
Anti-TRBC1 Antibody-Based Flow Cytometric Detection of T-Cell Clonality: Standardization of Sample Preparation and Diagnostic Implementation

 , , , , , and
Abstract
Simple Summary
Abstract
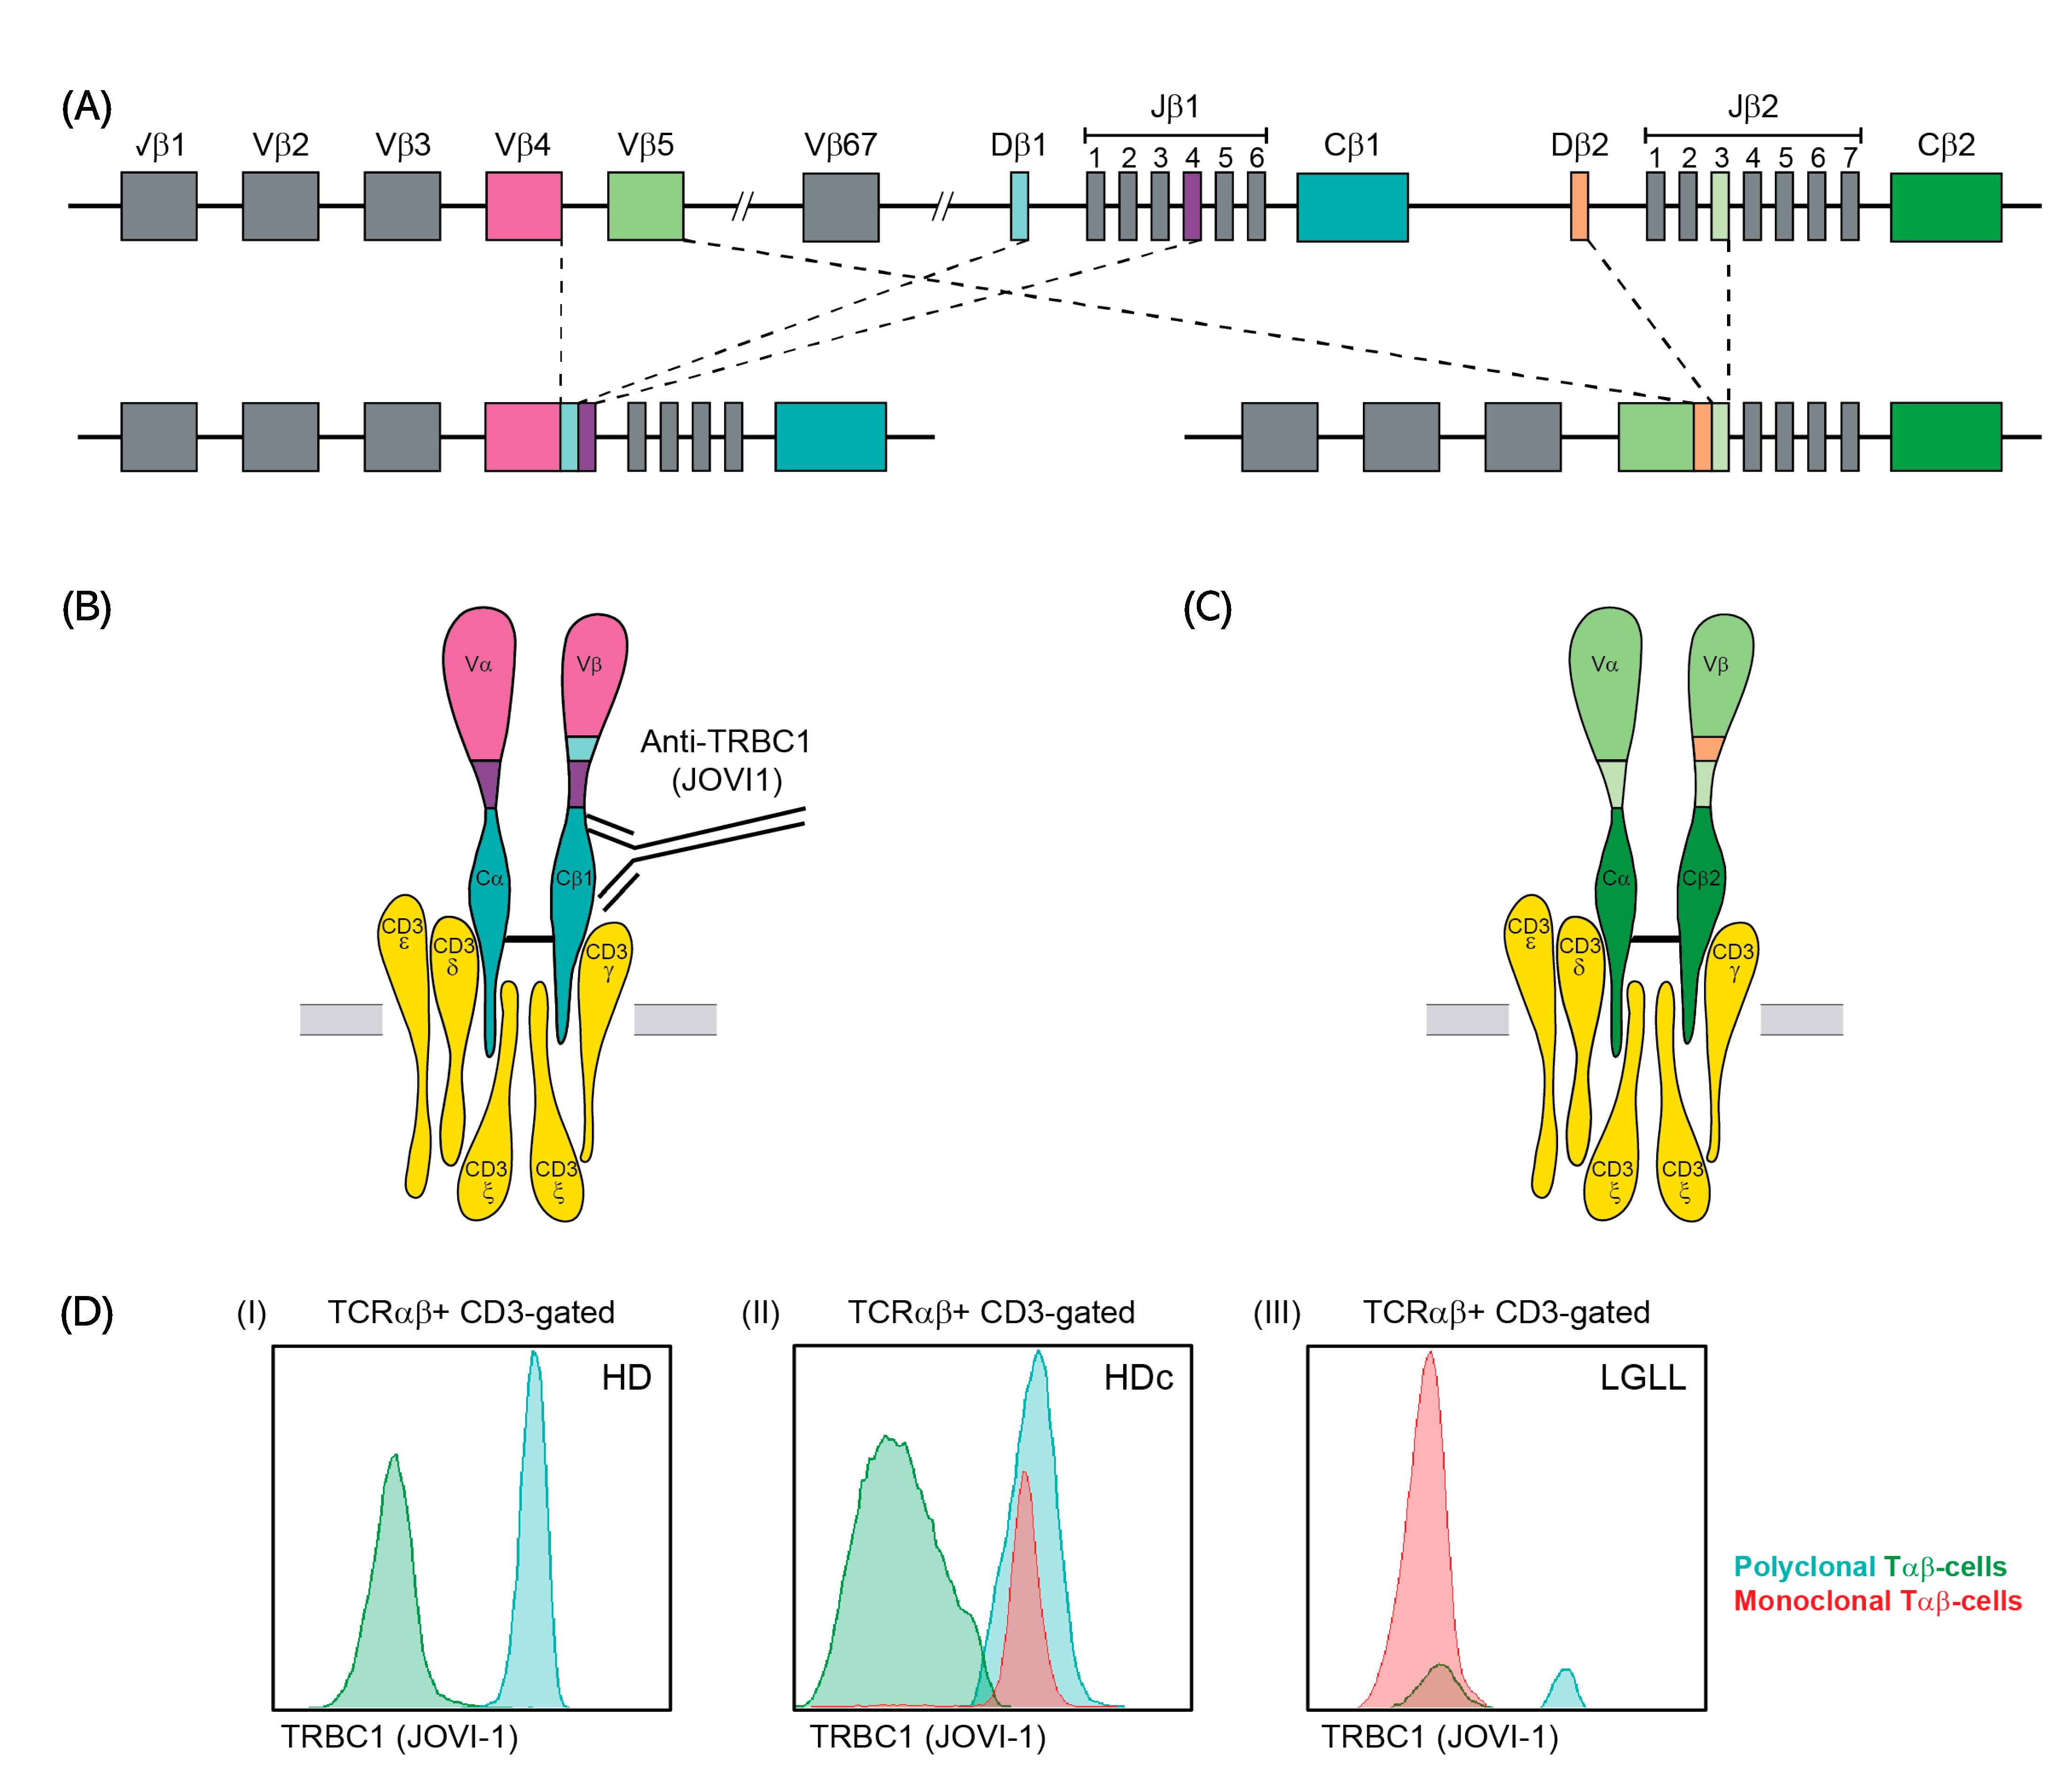
1. Introduction
2. Materials and Methods
2.1. Patients, Controls and Samples
2.2. General Immunophenotypic Approach
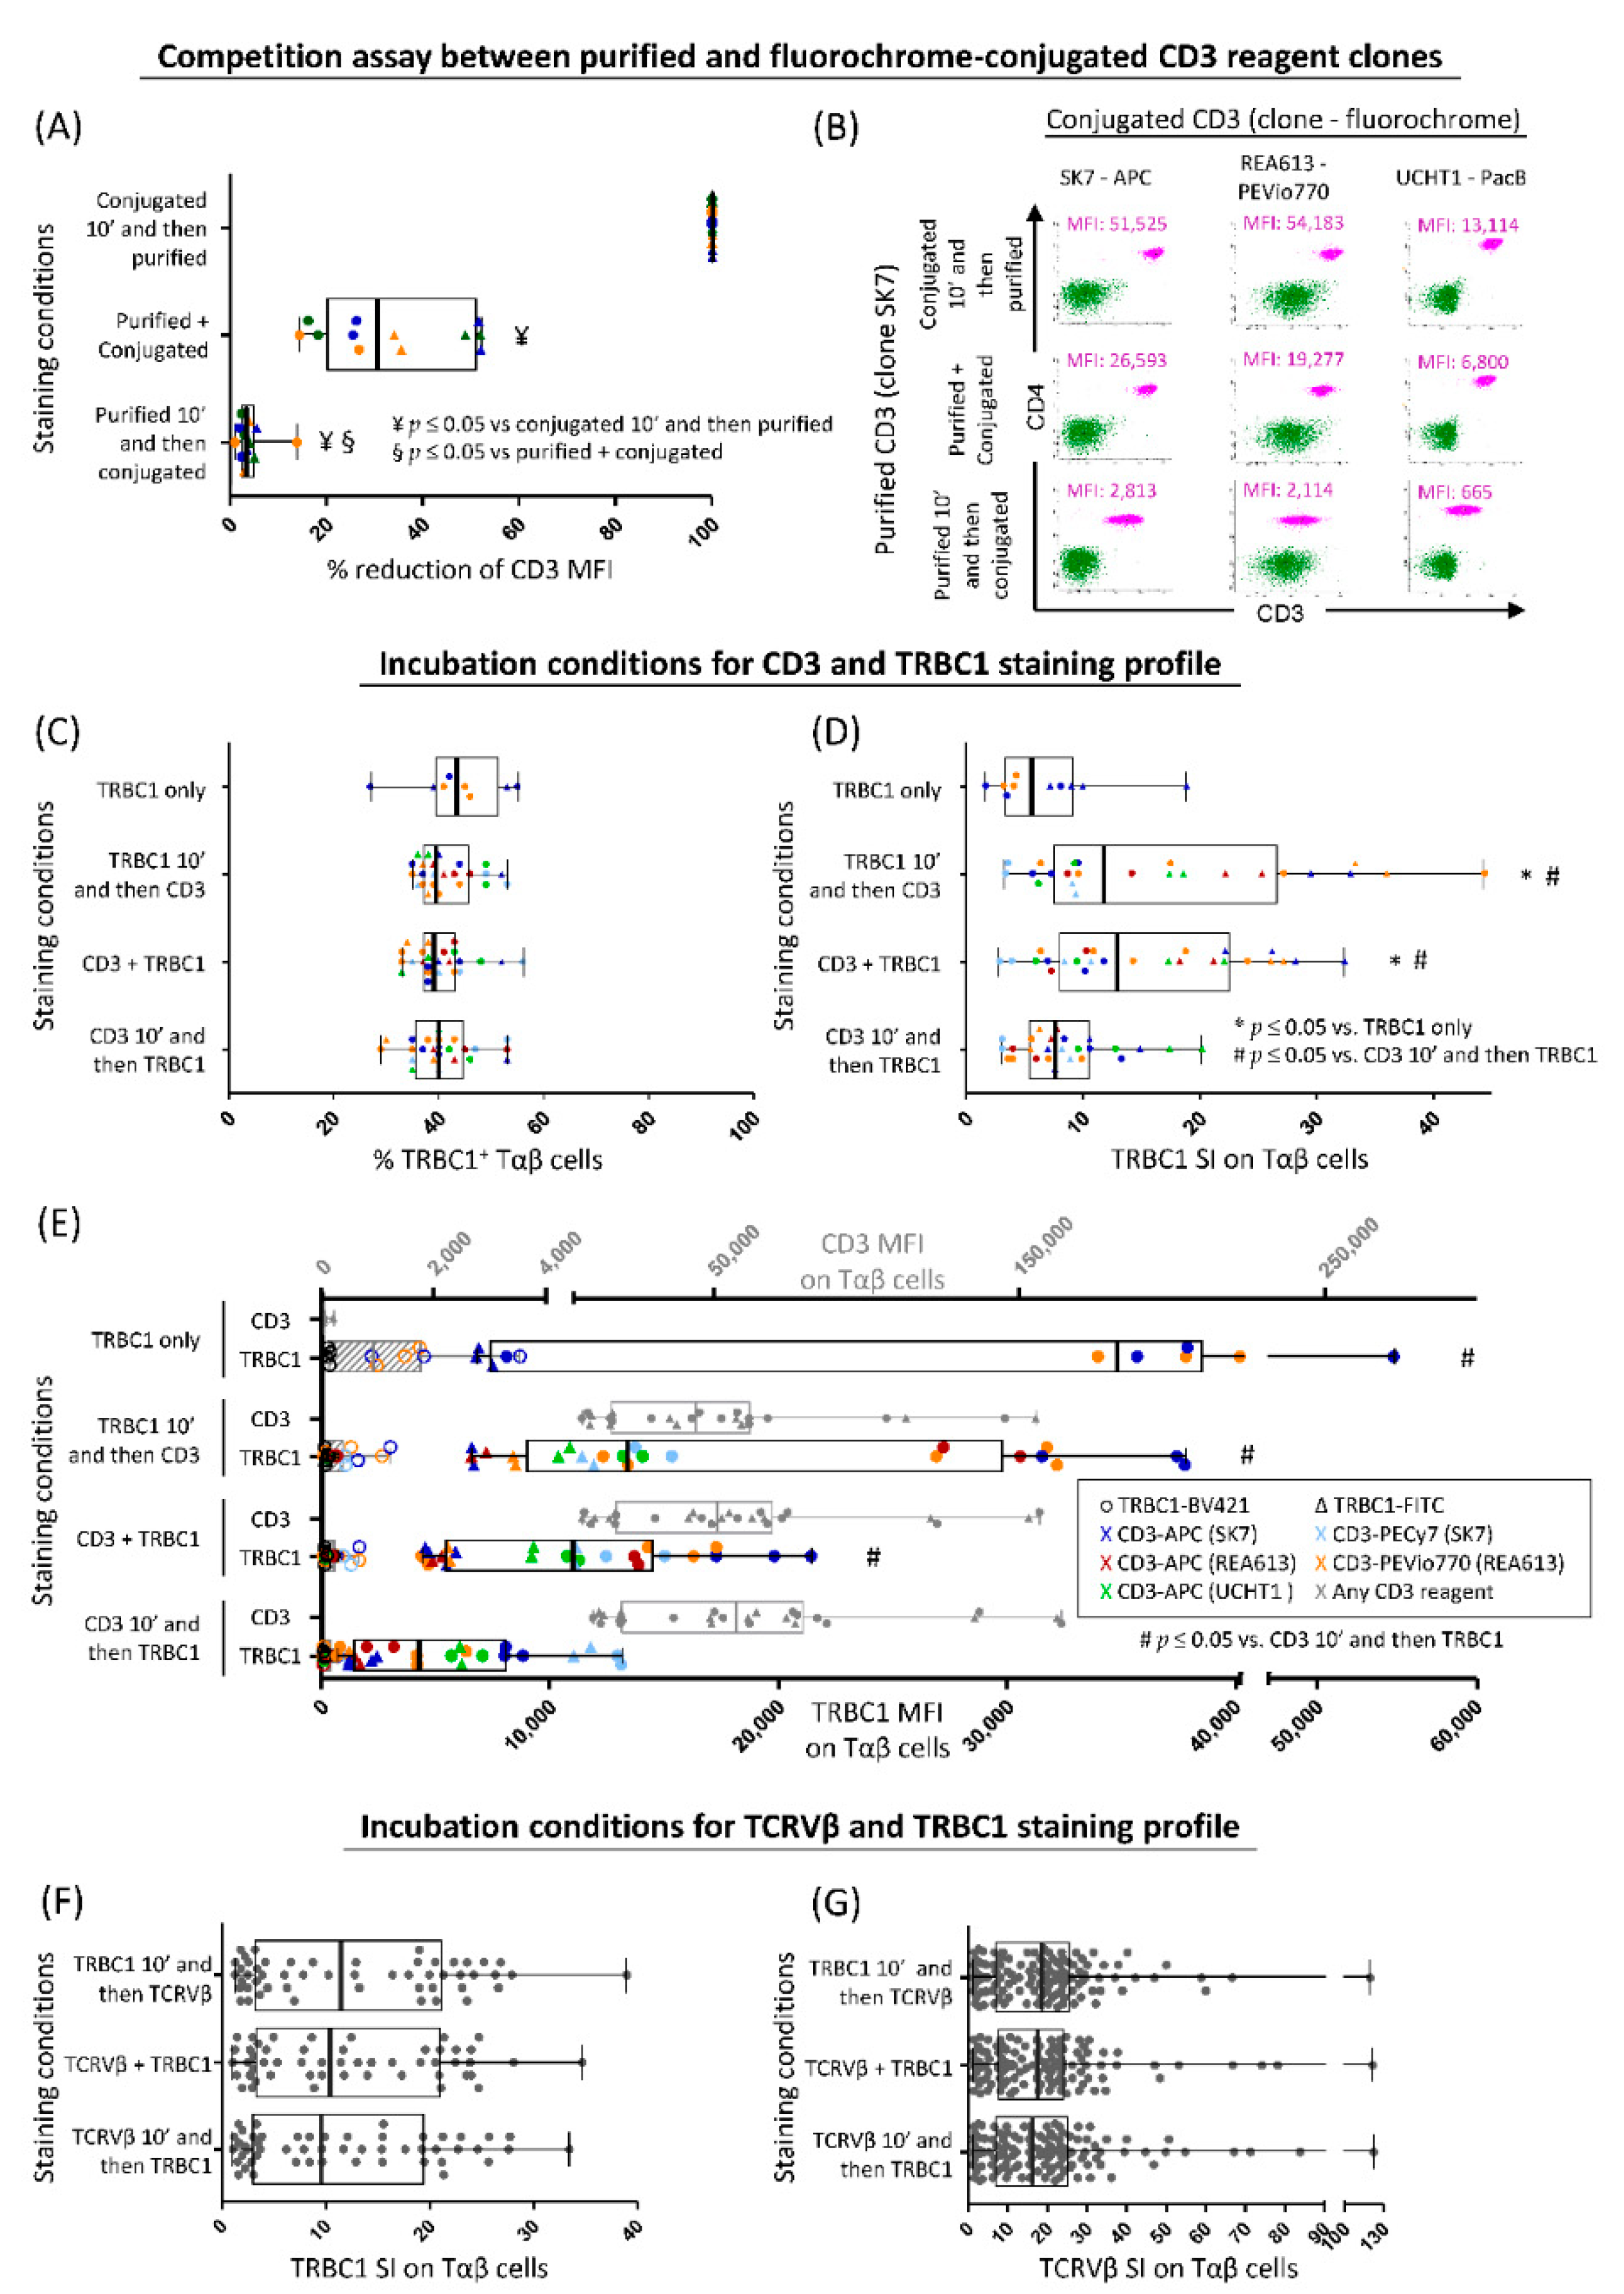
2.3. Optimization of TRBC1 Staining for Flow Cytometry
2.4. PCR-Based Detection of TRBJ1 or TRBJ2 Gene Rearrangements in FACS-Sorted Tαβ-Cell Populations
2.5. Analysis of the TRBC1+/TRBC1− Ratio in Distinct Subsets of Normal Tαβ-Cells Defined by the TCRVβ Family Expressed and Their Maturation Stage
2.6. Assessment of T-Cell Clonality on FACS-Sorted Cell Populations for Patients with T-CLPD vs. Reactive Lymphocytosis and Healthy Donors
2.7. Validation of the TRBC1-FCM Assay against Conventional Molecular and FCM Techniques for Detection of Clonal Tαβ-Cells
2.8. Serial Dilution Experiments of Pathological Tαβ-Cells in Normal Blood Cells
2.9. Statistical Methods
3. Results
3.1. Optimization of TRBC1 Staining by FCM
3.2. TRBJ Gene Rearrangements in FACS-Sorted TRBC1+ and/or TRBC1− Tαβ+-Cell Populations
3.3. Ranges for Polyclonal (Normal and Reactive) Tαβ-Cells and Major Tαβ-Cell Populations
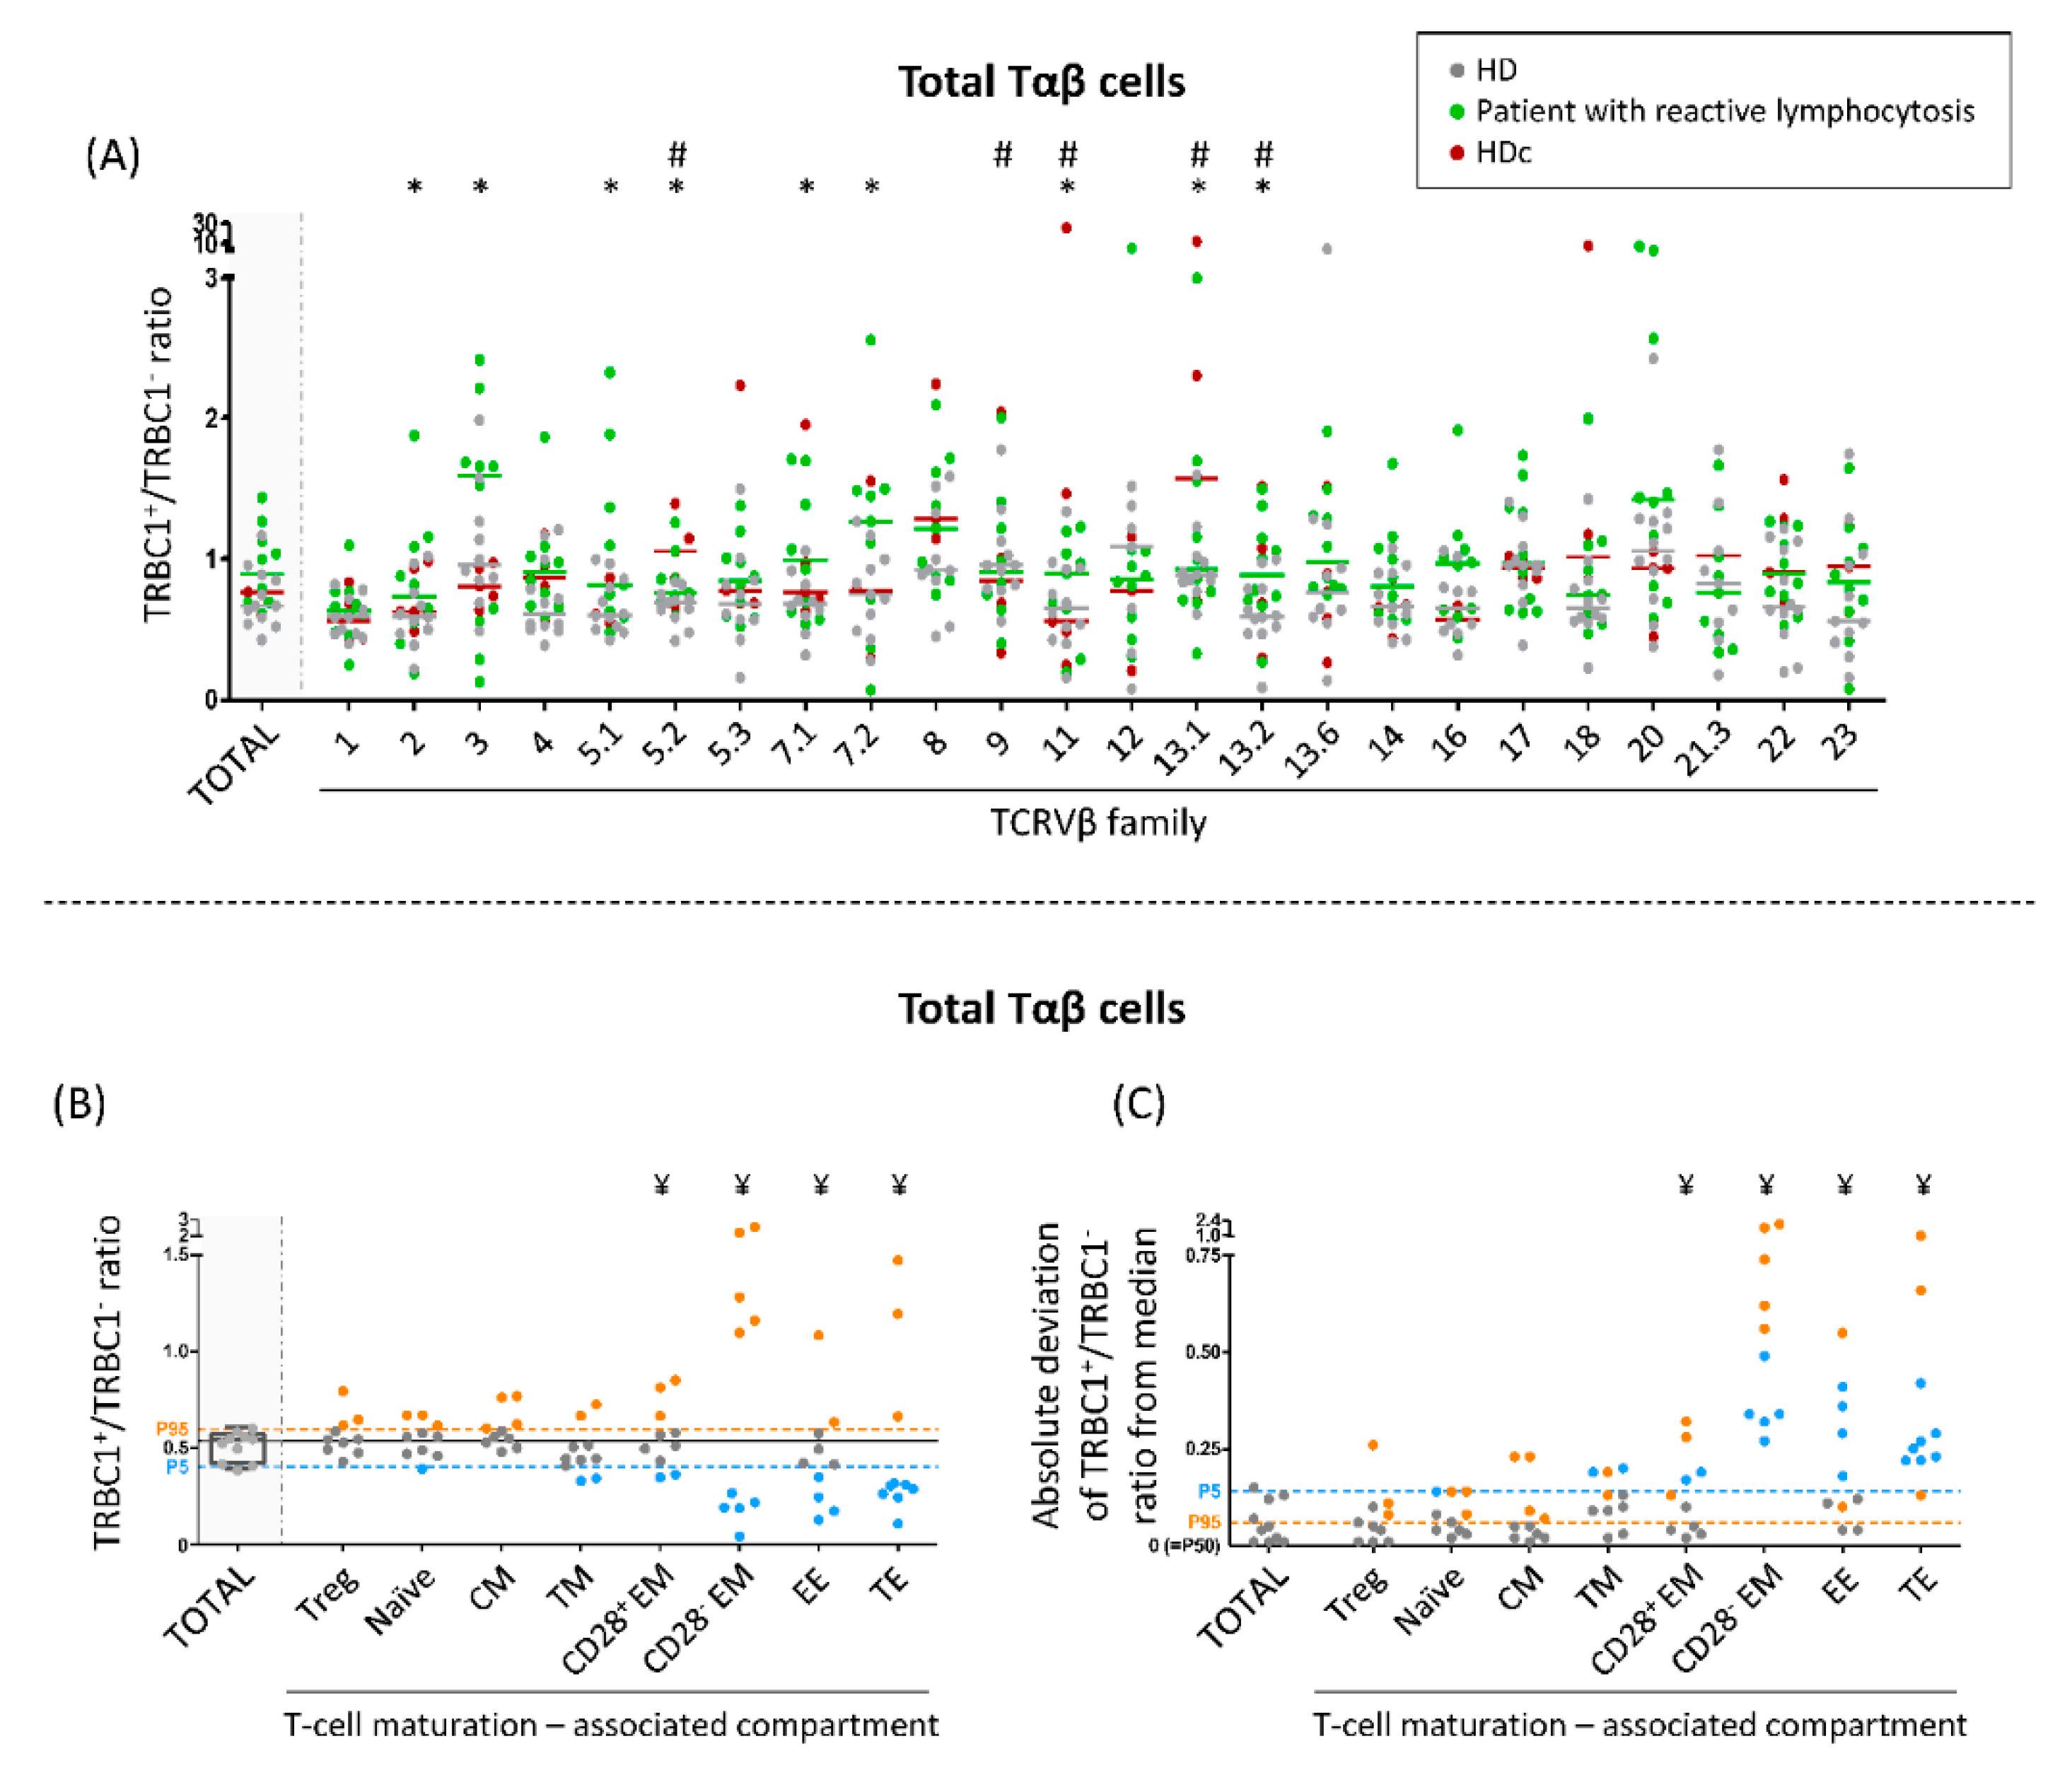
3.4. TRBC1+/TRBC1− Ratio of Normal Polyclonal Tαβ-Cells and Their TCRVβ and Maturation-Associated Subsets in Normal Blood
3.5. TRBC1+/TRBC1− Ratio of Polyclonal Tαβ-Cells Expressing Different TCRVβ Families in Patients with Reactive Lymphocytosis and HDc Blood
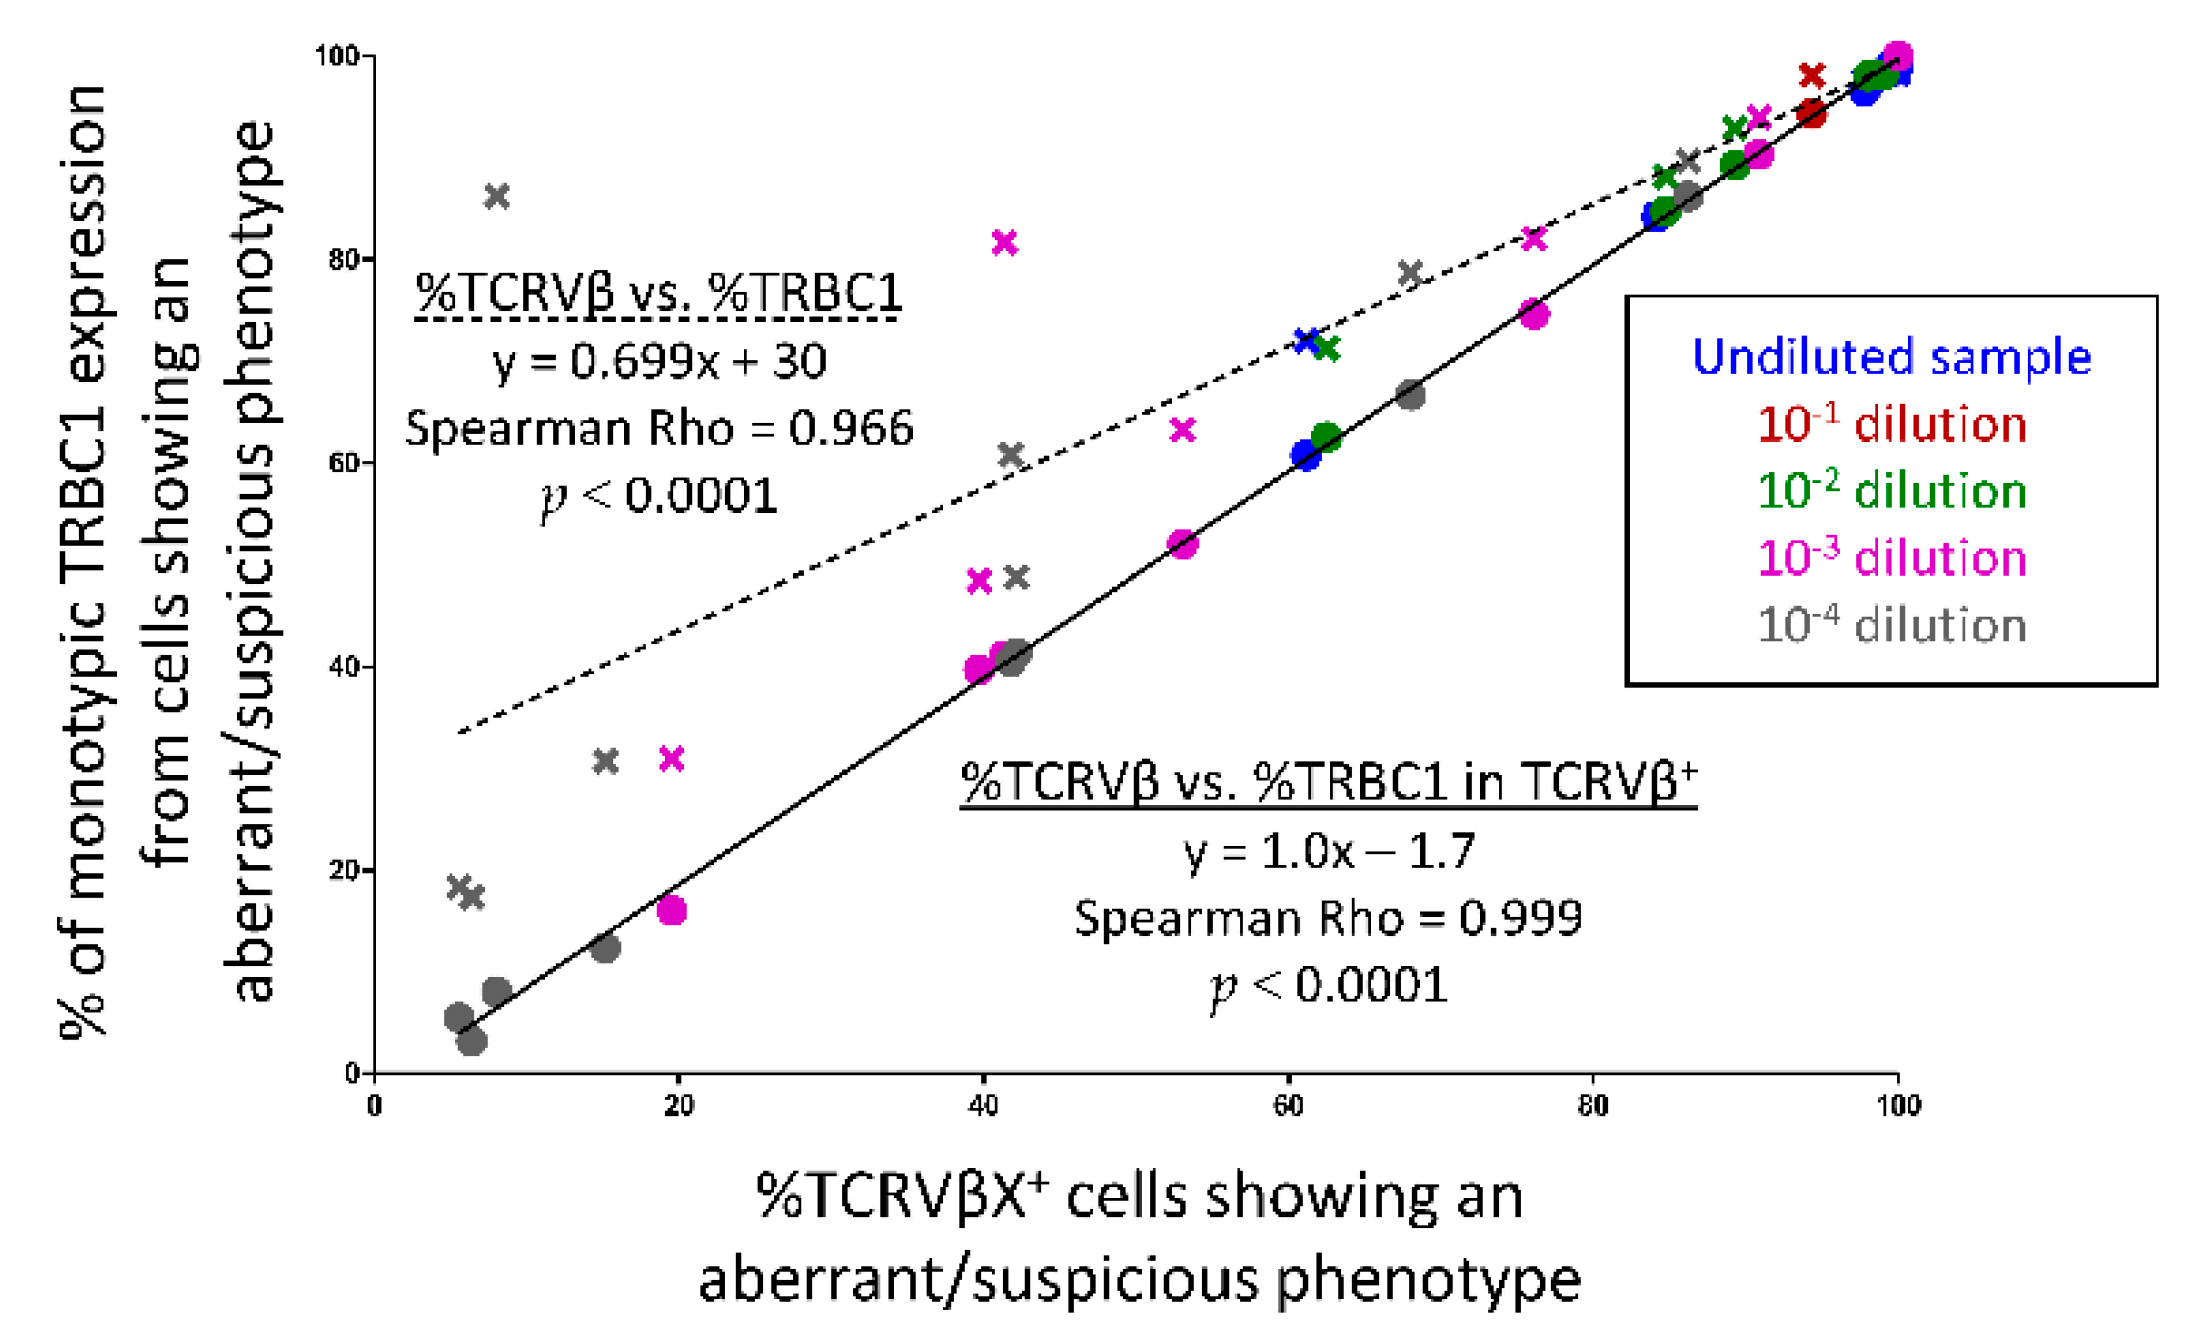
3.6. Comparison between the TRBC1-FCM Assay and Conventional TCRVβ-FCM and/or Molecular Techniques for Assessment of Tαβ-Cell Clonality
3.7. Utility of TRBC1 for Sensitive FCM Detection of Clonal Tαβ-Cellsi in Serial Dilution Experiments of Pathological Tαβ-Cells in Normal Blood Cells
4. Discussion
5. Conclusions
Supplementary Materials
Author Contributions
Funding
Institutional Review Board Statement
Informed Consent Statement
Data Availability Statement
Acknowledgments
Conflicts of Interest
References
- Campo, E.; Harris, N.L.; Jaffe, E.S.; Pileri, S.A.; Stein, H.; Thiele, J.; Vardiman, J.M. WHO Classification of Tumours of Haematopoietic and Lymphoid Tissues; Swerdlow, S.H., Ed.; Revised 4 t.; WHO Press: Lyon, France, 2017. [Google Scholar]
- Armitage, J.O. A clinical evaluation of the International Lymphoma Study Group classification of non-Hodgkin’s lymphoma. Blood 1997, 89, 3909–3918. [Google Scholar]
- Vose, J.M.; Neumann, M.; Harris, M.E. International peripheral T-cell and natural killer/T-cell lymphoma study: Pathology findings and clinical outcomes international T-cell lymphoma project. J. Clin. Oncol. 2008, 26, 4124–4130. [Google Scholar] [CrossRef]
- Jamal, S.; Picker, L.J.; Aquino, D.B.; McKenna, R.W.; Dawson, D.B.; Kroft, S.H. Immunophenotypic analysis of peripheral T-cell neoplasms: A multiparameter flow cytometric approach. Am. J. Clin. Pathol. 2001, 116, 512–526. [Google Scholar] [CrossRef]
- Gorczyca, W.; Weisberger, J.; Liu, Z.; Tsang, P.; Hossein, M.; Wu, C.D.; Dong, H.; Wong, J.Y.L.; Tugulea, S.; Dee, S.; et al. An Approach to Diagnosis of T-cell Lymphoproliferative Disorders by Flow Cytometry. Clin. Cytom. 2002, 50, 177–190. [Google Scholar] [CrossRef]
- Jevremovic, D.; Olteanu, H. Flow Cytometry Applications in the Diagnosis of T/NK-Cell Lymphoproliferative Disorders. Cytom. Part B - Clin. Cytom. 2019, 96, 99–115. [Google Scholar] [CrossRef]
- Went, P.; Agostinelli, C.; Gallamini, A.; Piccaluga, P.P.; Ascani, S.; Sabattini, E.; Bacci, F.; Falini, B.; Motta, T.; Paulli, M.; et al. Marker expression in peripheral T-cell lymphoma: A proposed clinical-pathologic prognostic score. J. Clin. Oncol. 2006, 24, 2472–2479. [Google Scholar] [CrossRef]
- Iqbal, J.; Amador, C.; McKeithan, T.W.; Chan, W.C. T-Cell and NK-Cell Lymphomas. From Biology to Novel Therapies - Chapter: Molecular and Genomic Landscape of Peripheral T-cell Lymphoma; Querfeld, C., Zain, J., Rosen, S.T., Eds.; Springer: Cham, Switzerland, 2019; ISBN 9783319997155. [Google Scholar]
- Flores-Montero, J.; Grigore, G.; Fluxá, R.; Hernández, J.; Fernandez, P.; Almeida, J.; Muñoz, N.; Böttcher, S.; Sedek, L.; van der Velden, V.; et al. EuroFlow Lymphoid Screening Tube (LST) data base for automated identification of blood lymphocyte subsets. J. Immunol. Methods 2019, 475, 112662. [Google Scholar] [CrossRef]
- Langerak, A.W.; van den Beemd, R.; Wolvers-Tettero, I.L.M.; Boor, P.P.C.; van Lochem, E.G.; Hooijkaas, H.; van Dongen, J.J.M. Molecular and flow cytometric analysis of the VB repertoire for clonality assessment in mature TCRab T-cell proliferations. Blood 2001, 98, 165–174. [Google Scholar] [CrossRef] [PubMed]
- Morice, W.G.; Kimlinger, T.; Katzmann, J.A.; Lust, J.A.; Heimgartner, P.J.; Halling, K.C.; Hanson, C.A. Flow Cytometric Assessment of TCR-Vβ Expression in the Evaluation of Peripheral Blood Involvement by T-Cell Lymphoproliferative Disorders: A Comparison with Conventional T-Cell Immunophenotyping and Molecular Genetic Techniques. Am. J. Clin. Pathol. 2004, 121, 373–383. [Google Scholar] [CrossRef] [PubMed]
- Beck, R.C.; Stahl, S.; O’Keefe, C.L.; Maciejewski, J.P.; Theil, K.S.; Hsi, E.D. Detection of Mature T-Cell Leukemias by Flow Cytometry Using Anti-T-Cell Receptor Vβ Antibodies. Am. J. Clin. Pathol. 2003, 120, 785–794. [Google Scholar] [CrossRef] [PubMed]
- Tembhare, P.; Yuan, C.M.; Xi, L.; Morris, J.C.; Liewehr, D.; Venzon, D.; Janik, J.E.; Raffeld, M.; Stetler-Stevenson, M. Flow cytometric immunophenotypic assessment of T-cell clonality by V β repertoire analysis: Detection of T-cell clonality at diagnosis and monitoring of minimal residual disease following therapy. Am. J. Clin. Pathol. 2011, 135, 890–900. [Google Scholar] [CrossRef]
- Langerak, A.W.; Groenen, P.J.T.A.; Brüggemann, M.; Beldjord, K.; Bellan, C.; Bonello, L.; Boone, E.; Carter, G.I.; Catherwood, M.; Davi, F.; et al. EuroClonality/BIOMED-2 guidelines for interpretation and reporting of Ig/TCR clonality testing in suspected lymphoproliferations. Leukemia 2012, 26, 2159–2171. [Google Scholar] [CrossRef] [PubMed]
- van Dongen, J.J.M.; Langerak, A.W.; Brüggemann, M.; Evans, P.A.S.; Hummel, M.; Lavender, F.L.; Delabesse, E.; Davi, F.; Schuuring, E.; García-Sanz, R.; et al. Design and standardization of PCR primers and protocols for detection of clonal immunoglobulin and T-cell receptor gene recombinations in suspect lymphoproliferations: Report of the BIOMED-2 concerted action BMH4-CT98-3936. Leukemia 2003, 17, 2257–2317. [Google Scholar] [CrossRef]
- Wang, H.W.; Raffeld, M. Molecular assessment of clonality in lymphoid neoplasms. Semin. Hematol. 2019, 56, 37–45. [Google Scholar] [CrossRef]
- Schumacher, J.A.; Duncavage, E.J.; Mosbruger, T.L.; Szankasi, P.M.; Kelley, T.W. A comparison of deep sequencing of TCRG rearrangements vs. traditional capillary electrophoresis for assessment of clonality in t-cell lymphoproliferative disorders. Am. J. Clin. Pathol. 2014, 141, 348–359. [Google Scholar] [CrossRef]
- Novikov, N.D.; Griffin, G.K.; Dudley, G.; Drew, M.; Rojas-Rudilla, V.; Lindeman, N.I.; Dorfman, D.M. Utility of a simple and robust flow cytometry assay for rapid clonality testing in mature peripheral T-Cell lymphomas. Am. J. Clin. Pathol. 2019, 151, 494–503. [Google Scholar] [CrossRef]
- Maciocia, P.M.; Wawrzyniecka, P.A.; Philip, B.; Ricciardelli, I.; Akarca, A.U.; Onuoha, S.C.; Leguţ, M.; Cole, D.K.; Sewell, A.K.; Gritti, G.; et al. Targeting the T cell receptor β-chain constant region for immunotherapy of T cell malignancies. Nat. Med. 2017, 23, 1416–1423. [Google Scholar] [CrossRef]
- Shi, M.; Jevremovic, D.; Otteson, G.E.; Timm, M.M.; Olteanu, H.; Horna, P. Single Antibody Detection of T-Cell Receptor αβ Clonality by Flow Cytometry Rapidly Identifies Mature T-Cell Neoplasms and Monotypic Small CD8-Positive Subsets of Uncertain Significance. Cytom. Part B - Clin. Cytom. 2020, 98, 99–107. [Google Scholar] [CrossRef] [PubMed]
- Berg, H.; Otteson, G.E.; Corley, H.; Shi, M.; Horna, P.; Jevremovic, D.; Olteanu, H. Flow cytometric evaluation of TRBC1 expression in tissue specimens and body fluids is a novel and specific method for assessment of T-cell clonality and diagnosis of T-cell neoplasms. Cytom. Part B - Clin. Cytom. 2020, 1–9. [Google Scholar] [CrossRef]
- Kaewpreedee, P.; Boonrat, P.; Tansiri, Y.; Rowland-Jones, S.L.; Hansasuta, P. Dimorphism in the T-cell receptor constant region affects T-cell function, phenotype and HIV outcome. Aids 2019, 33, 1421–1429. [Google Scholar] [CrossRef] [PubMed]
- Shi, M.; Olteanu, H.; Jevremovic, D.; He, R.; Viswanatha, D.; Corley, H.; Horna, P. T-cell clones of uncertain significance are highly prevalent and show close resemblance to T-cell large granular lymphocytic leukemia. Implications for laboratory diagnostics. Mod. Pathol. 2020. [Google Scholar] [CrossRef] [PubMed]
- Horna, P.; Shi, M.; Jevremovic, D.; Craig, F.E.; Comfere, N.I.; Olteanu, H. Utility of TRBC1 Expression in the Diagnosis of Peripheral Blood Involvement by Cutaneous T-Cell Lymphoma. J. Invest. Dermatol. 2021, 141, 821–829.e2. [Google Scholar] [CrossRef] [PubMed]
- Horna, P.; Olteanu, H.; Jevremovic, D.; Otteson, G.E.; Corley, H.; Ding, W.; Parikh, S.A.; Shah, M.V.; Morice, W.G.; Shi, M. Single-Antibody Evaluation of T-Cell Receptor β Constant Chain Monotypia by Flow Cytometry Facilitates the Diagnosis of T-Cell Large Granular Lymphocytic Leukemia. Am. J. Clin. Pathol. 2021, 156, 139–148. [Google Scholar] [CrossRef] [PubMed]
- Horna, P.; Shi, M.; Olteanu, H.; Johansson, U. Emerging role of t-cell receptor constant β chain-1 (TRBC1) expression in the flow cytometric diagnosis of t-cell malignancies. Int. J. Mol. Sci. 2021, 22, 1817. [Google Scholar] [CrossRef] [PubMed]
- van Dongen, J.J.; Lhermitte, L.; Böttcher, S.; Almeida, J.; van der Velden, V.H.; Flores-Montero, J.; Rawstron, A.; Asnafi, V.; Lécrevisse, Q.; Lucio, P.; et al. EuroFlow antibody panels for standardized n-dimensional flow cytometric immunophenotyping of normal, reactive and malignant leukocytes. Leukemia 2012, 26, 1908–1975. [Google Scholar] [CrossRef]
- Kalina, T.; Flores-Montero, J.; van der Velden, V.H.J.; Martin-Ayuso, M.; Böttcher, S.; Ritgen, M.; Almeida, J.; Lhermitte, L.; Asnafi, V.; Mendonça, A.; et al. EuroFlow standardization of flow cytometer instrument settings and immunophenotyping protocols. Leukemia 2012, 26, 1986–2010. [Google Scholar] [CrossRef]
- EuroFlow. Available online: https://www.euroflow.org/ (accessed on 17 June 2021).
- Maecker, H.T.; Frey, T.; Nomura, L.E.; Trotter, J. Selecting fluorochrome conjugates for maximum sensitivity. Cytom. Part A 2004, 62, 169–173. [Google Scholar] [CrossRef]
- Langerak, A.; Wolvers-Tettero, I.; van Dongen, J. Detection of T cell receptor beta (TCRB) gene rearrangement patterns in T cell malignancies by Southern blot analysis. Leukemia 1999, 13, 965–974. [Google Scholar] [CrossRef][Green Version]
- Droese, J.; Langerak, A.W.; Groenen, P.J.T.A.; Brüggemman, M.; Neumann, P.; Wolvers-Tettero, I.L.M.; van Altena, M.C.; Kneba, M.; van Dongen, J.J.M. Validation of BIOMED-2 multiplex PCR tubes for detection of TCRB gene rearrangements in T-cell malignancies. Leukemia 2004, 18, 1531–1538. [Google Scholar] [CrossRef]
- Muñoz-García, N.; Jara-Acevedo, M.; Caldas, C.; Bárcena, P.; López, A.; Puig, N.; Alcoceba, M.; Fernández, P.; Villamor, N.; Flores-Montero, J.A.; et al. STAT3 and STAT5B mutations in T/NK-cell chronic lymphoproliferative disorders of large granular lymphocytes (LGL): Association with disease features. Cancers 2020, 12, 3508. [Google Scholar] [CrossRef]
- Laribi, K.; Lemaire, P.; Sandrini, J.; de Materre, A.B. Advances in the understanding and management of T-cell prolymphocytic leukemia. Oncotarget 2017, 8, 104664–104686. [Google Scholar] [CrossRef]
- Kastrup, J.; Pedersen, L.; Dietrich, J.; Lauritsen, J.P.H.; Menné, C.; Geisler, C. In vitro production and characterization of partly assembled human CD3 complexes. Scand. J. Immunol. 2002, 56, 436–442. [Google Scholar] [CrossRef] [PubMed]
- Morath, A.; Schamel, W.W. αβ and γδ T cell receptors: Similar but different. J. Leukoc. Biol. 2020, 107, 1045–1055. [Google Scholar] [CrossRef] [PubMed]
- Natarajan, K.; Jiang, J.; May, N.A.; Mage, M.G.; Boyd, L.F.; McShan, A.C.; Sgourakis, N.G.; Bax, A.; Margulies, D.H. The role of molecular flexibility in antigen presentation and T cell receptor-mediated signaling. Front. Immunol. 2018, 9, 1657. [Google Scholar] [CrossRef] [PubMed]
- Tunnacliffe, A.; Kefford, R.; Milstein, C.; Forster, A.; Rabbitts, T.H. Sequence and evolution of the human T-cell antigen receptor β-chain genes. Proc. Natl. Acad. Sci. USA 1985, 82, 5068–5072. [Google Scholar] [CrossRef] [PubMed]
- Diks, A.M.; Bonroy, C.; Teodosio, C.; Groenland, R.J.; de Mooij, B.; de Maertelaere, E.; Neirynck, J.; Philippé, J.; Orfao, A.; van Dongen, J.J.M.; et al. Impact of blood storage and sample handling on quality of high dimensional flow cytometric data in multicenter clinical research. J. Immunol. Methods 2019, 475, 112616. [Google Scholar] [CrossRef]
- Duby, A.D.; Seidman, J.G. Abnormal recombination products result from aberrant DNA rearrangement of the human T-cell antigen receptor B-chain gene. Immunology 1986, 83, 4890–4894. [Google Scholar] [CrossRef]
- TRBC2 Sequence. Available online: http://www.ensembl.org/Homo_sapiens/Gene/Summary?db=core;g=ENSG00000211772;r=7:142801041-142802748;t=ENST00000466254 (accessed on 28 June 2021).
- TRBC1 Sequence. Available online: http://www.ensembl.org/Homo_sapiens/Gene/Summary?db=core;g=ENSG00000211751;r=7:142791694-142793368;t=ENST00000633705 (accessed on 17 June 2021).
- Katzmann, J.A.; Clark, R.J.; Abraham, R.S.; Bryant, S.; Lymp, J.F.; Bradwell, A.R.; Kyle, R.A. Serum reference intervals and diagnostic ranges for free κ and free λ immunoglobulin light chains: Relative sensitivity for detection of monoclonal light chains. Clin. Chem. 2002, 48, 1437–1444. [Google Scholar] [CrossRef]
- Geary, W.; Frierson, H.; Innes, D.; Normansell, D. Quantitative criteria for clonality in the diagnosis of B-cell non-Hodgkin’s lymphoma by flow cytometry. Mod. Pathol. 1993, 6, 155–161. [Google Scholar]
- Criado, I.; Rodríguez-Caballero, A.; Gutiérrez, M.L.; Pedreira, C.E.; Alcoceba, M.; Nieto, W.; Teodosio, C.; Bárcena, P.; Romero, A.; Fernández-Navarro, P.; et al. Low-count monoclonal B-cell lymphocytosis persists after seven years of follow up and is associated with a poorer outcome. Haematologica 2018, 103, 1198–1208. [Google Scholar] [CrossRef]
- Miron, M.; Meng, W.; Rosenfeld, A.M.; Dvorkin, S.; Meimei, M.; Poon, L.; Lam, N.; Kumar, B.V.; Louzoun, Y.; Prak, E.T.L.; et al. Maintenance of the human memory T cell repertoire by subset and tissue site. Genome Med. 2021, 13, 100. [Google Scholar] [CrossRef] [PubMed]
- Flores-Montero, J.; Sanoja-Flores, L.; Paiva, B.; Puig, N.; García-Sánchez, O.; Böttcher, S.; Van Der Velden, V.H.J.; Pérez-Morán, J.J.; Vidriales, M.B.; García-Sanz, R.; et al. Next Generation Flow for highly sensitive and standardized detection of minimal residual disease in multiple myeloma. Leukemia 2017, 31, 2094–2103. [Google Scholar] [CrossRef] [PubMed]
- Davidson, B.; Risberg, B.; Berner, A.; Smeland, E.B.; Torlakovic, E. Evaluation of lymphoid cell populations in cytology specimens using flow cytometry and polymerase chain reaction. Diagn. Mol. Pathol. 1999, 8, 183–188. [Google Scholar] [CrossRef] [PubMed]


| Diagnosis | n. of Cases |
|---|---|
| T-PLL | 10 |
| PCTCL-SS | 16 |
| PCTCL-MF | 6 |
| PCTCL-NOS | 1 |
| PTCL-AITL | 2 |
| Extranodal NK/T-lymphoma, nasal type | 1 |
| PCTCLPD-small/medium CD4 | 2 |
| Hemophagocytic syndrome | 1 |
| PTCL-NOS | 2 |
| T-LGLL | 40 |
| T-CLPD not classified | 6 |
| TRBC1 Expression by FCM | Clonality Status of TRBC1 Stained Cell Populations 1 | TRBJ Rearrangement | |
|---|---|---|---|
| JB1 | JB1+JB2 | ||
| Positive (n = 47) | Monoclonal (n = 4) | 4 | 0 |
| Oligoclonal (n = 3) | 3 | 0 | |
| Polyclonal (n = 40) | 37 | 3 | |
| TOTAL | 44/47 (94%) | 3/47 (6%) | |
| Negative (n = 48) | Monoclonal (n = 3 2) | 0 | 3 |
| Oligoclonal (n = 4) | 0 | 4 | |
| Polyclonal (n = 41) | 0 | 41 | |
| TOTAL | 0 | 48/48 (100%) | |
| Tαβ-Cell Subset | % TRBC1+ Cells * | TRBC1+/TRBC1− Ratio | Probability (%) of Finding A Clonal Tαβ Expansion When TRBC1+/TRBC1− Ratio is Outside the Range Mean ± 3 SD (ρ-Value) | ||
|---|---|---|---|---|---|
| Mean ± 1 SD | Range (Mean ± 3 SD) | Mean ± 1 SD | Range (Mean ± 3 SD) | ||
| Tαβ cells | 40 ± 6.7 | 20–60 | 0.66 ± 0.071 | 0.25–1.4 | 99.73% (<0.001) |
| Tαβ CD4+ | 43 ± 6.3 | 24–62 | 0.75 ± 0.067 | 0.31–1.6 | |
| Tαβ CD8+ | 35 ± 8.8 | 8.3–61 | 0.53 ± 0.096 | 0.091–1.6 | |
| Tαβ DP | 36 ± 12 | 1.6–71 | 0.57 ± 0.13 | 0.016–2.5 | |
| Tαβ DN | 29 ± 10 | 0-61 | 0.41 ± 0.12 | 0–1.5 | |
| Clonality Status by Other Techniques * | TRBC1 Expression Pattern by FCM | p-Value | |
|---|---|---|---|
| Polytypic (n = 23) | Monotypic (n = 94) | ||
| Poly/oligoclonal (n = 24) | 21/24 (87%) | 3/24 (13%) | <0.0001 |
| Monoclonal (n = 93) | 2/93 (2%) | 91/93 (98%) | |
| WHO 2017 Diagnosis | TRBC1+ (n = 52) | TRBC1− (n = 37) |
|---|---|---|
| T-PLL (n = 10) | 3/10 (30%) | 7/10 (70%) |
| PCTCL-SS (n = 15) | 12/15 (80%) | 3/15 (20%) |
| PCTCL-MF (n = 6) | 3/6 (50%) | 3/6 (50%) |
| PCTCL-NOS (n = 1) | 0/1 (0%) | 1/1 (100%) |
| PTCL-AITL (n = 2) | 0/2 (0%) | 2/2 (100%) |
| Extranodal NK/T-lymphoma, nasal type (n = 1) | 0/1 (0%) | 1/1 (100%) |
| PCTCLPD-small/medium CD4 (n = 2) | 2/2 (100%) | 0/2 (0%) |
| Hemophagocytic syndrome (n = 1) | 0/1 (0%) | 1/1 (100%) |
| PTCL-NOS (n = 2) | 1/2 (50%) | 1/2 (50%) |
| T-LGLL (n = 39) | 22/39 (56%) | 17/39 (44%) |
| HDc * (n = 10) | 9/10 (90%) | 1/10 (10%) |
Publisher’s Note: MDPI stays neutral with regard to jurisdictional claims in published maps and institutional affiliations. |
© 2021 by the authors. Licensee MDPI, Basel, Switzerland. This article is an open access article distributed under the terms and conditions of the Creative Commons Attribution (CC BY) license (https://creativecommons.org/licenses/by/4.0/).
Share and Cite
Muñoz-García, N.; Lima, M.; Villamor, N.; Morán-Plata, F.J.; Barrena, S.; Mateos, S.; Caldas, C.; Balanzategui, A.; Alcoceba, M.; Domínguez, A.; et al. Anti-TRBC1 Antibody-Based Flow Cytometric Detection of T-Cell Clonality: Standardization of Sample Preparation and Diagnostic Implementation. Cancers 2021, 13, 4379. https://doi.org/10.3390/cancers13174379
Muñoz-García N, Lima M, Villamor N, Morán-Plata FJ, Barrena S, Mateos S, Caldas C, Balanzategui A, Alcoceba M, Domínguez A, et al. Anti-TRBC1 Antibody-Based Flow Cytometric Detection of T-Cell Clonality: Standardization of Sample Preparation and Diagnostic Implementation. Cancers. 2021; 13(17):4379. https://doi.org/10.3390/cancers13174379
Chicago/Turabian StyleMuñoz-García, Noemí, Margarida Lima, Neus Villamor, F. Javier Morán-Plata, Susana Barrena, Sheila Mateos, Carolina Caldas, Ana Balanzategui, Miguel Alcoceba, Alejandro Domínguez, and et al. 2021. "Anti-TRBC1 Antibody-Based Flow Cytometric Detection of T-Cell Clonality: Standardization of Sample Preparation and Diagnostic Implementation" Cancers 13, no. 17: 4379. https://doi.org/10.3390/cancers13174379
APA StyleMuñoz-García, N., Lima, M., Villamor, N., Morán-Plata, F. J., Barrena, S., Mateos, S., Caldas, C., Balanzategui, A., Alcoceba, M., Domínguez, A., Gómez, F., Langerak, A. W., van Dongen, J. J. M., Orfao, A., & Almeida, J. (2021). Anti-TRBC1 Antibody-Based Flow Cytometric Detection of T-Cell Clonality: Standardization of Sample Preparation and Diagnostic Implementation. Cancers, 13(17), 4379. https://doi.org/10.3390/cancers13174379