
Comprehensively Exploring the Mutational Landscape and Patterns of Genomic Evolution in Hypermutated Cancers

 , , , and
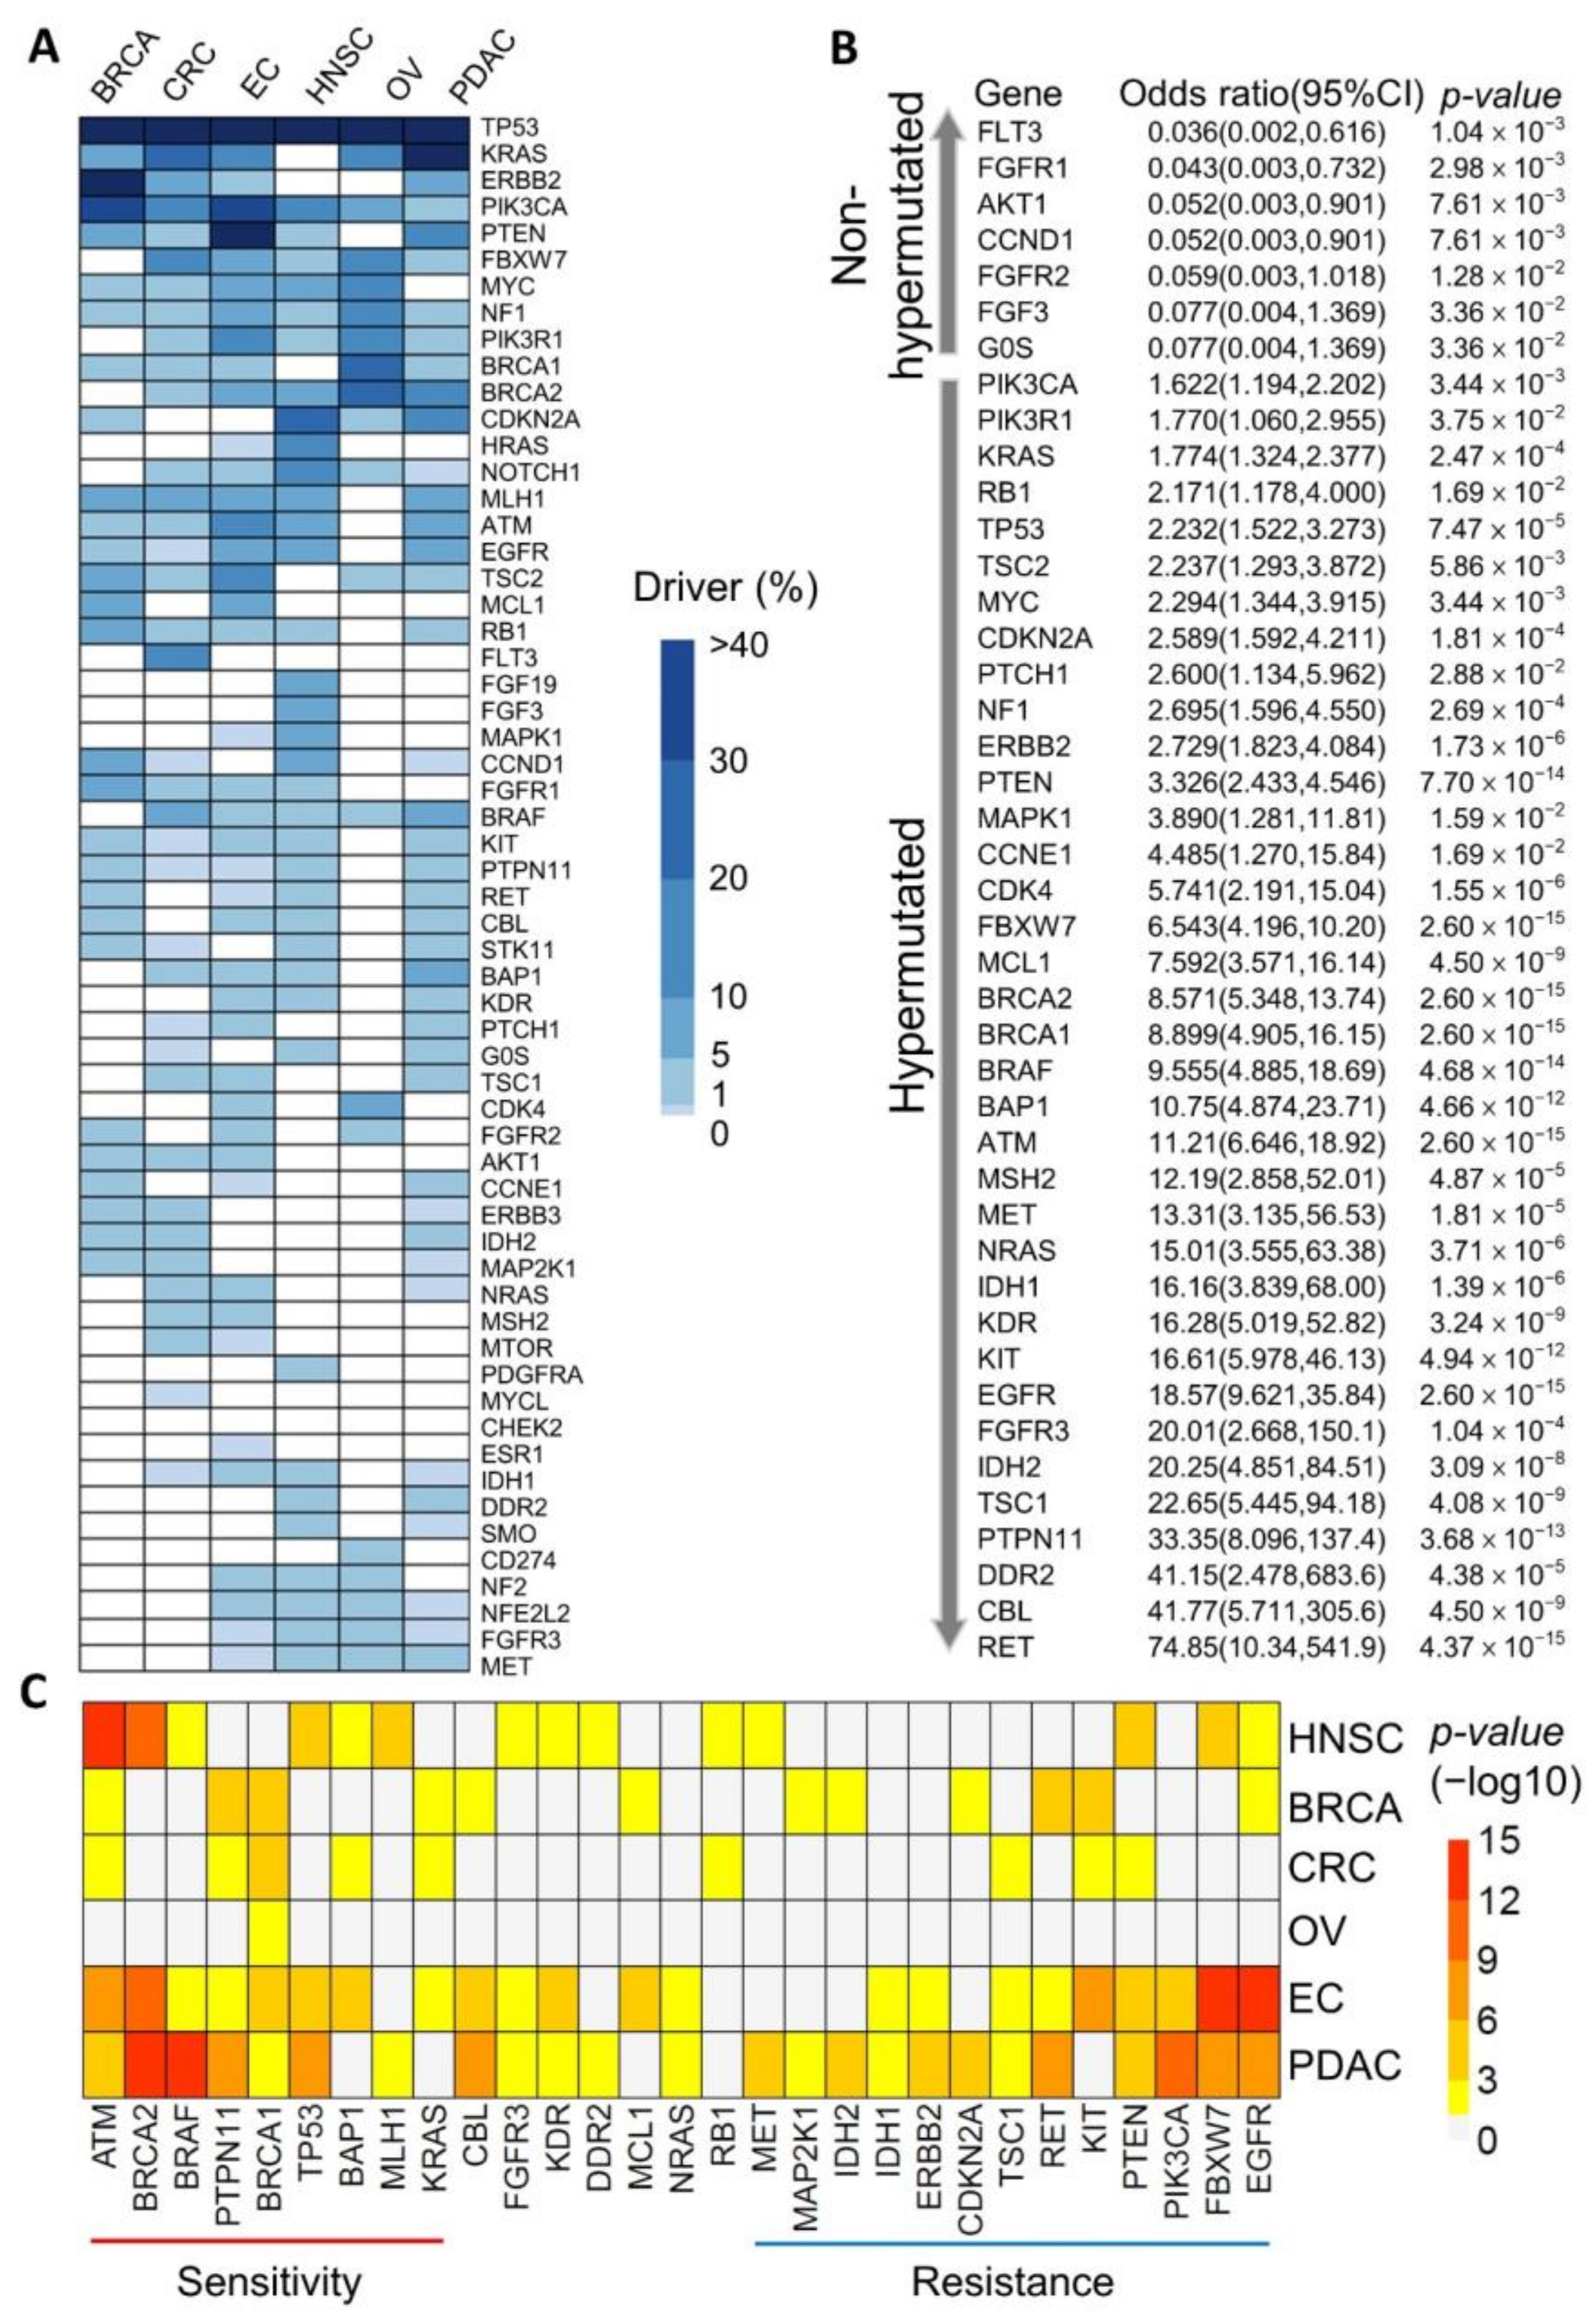
Abstract
:Simple Summary
Abstract
1. Introduction
2. Materials and Methods
2.1. Enrollment of Cancer Patients
2.2. Targeted Tumor Sequencing Using a Cancer Gene Panel
2.3. Immune Response Gene Expression Data
2.4. Statistical Analysis
2.5. Cancer Driver Mutation Spectra and Mutational Signature Analysis
2.6. Evolutionary Tree Construction Trajectory Analysis
2.7. Machine Learning Model and Analysis
2.7.1. Selecting Evolutionary Trajectories for the Hypermutation Prediction Model
2.7.2. Identification of Putative Neoantigens
3. Results
3.1. Identification of Potential Cancer Driver Mutations in Hypermutated Cancers
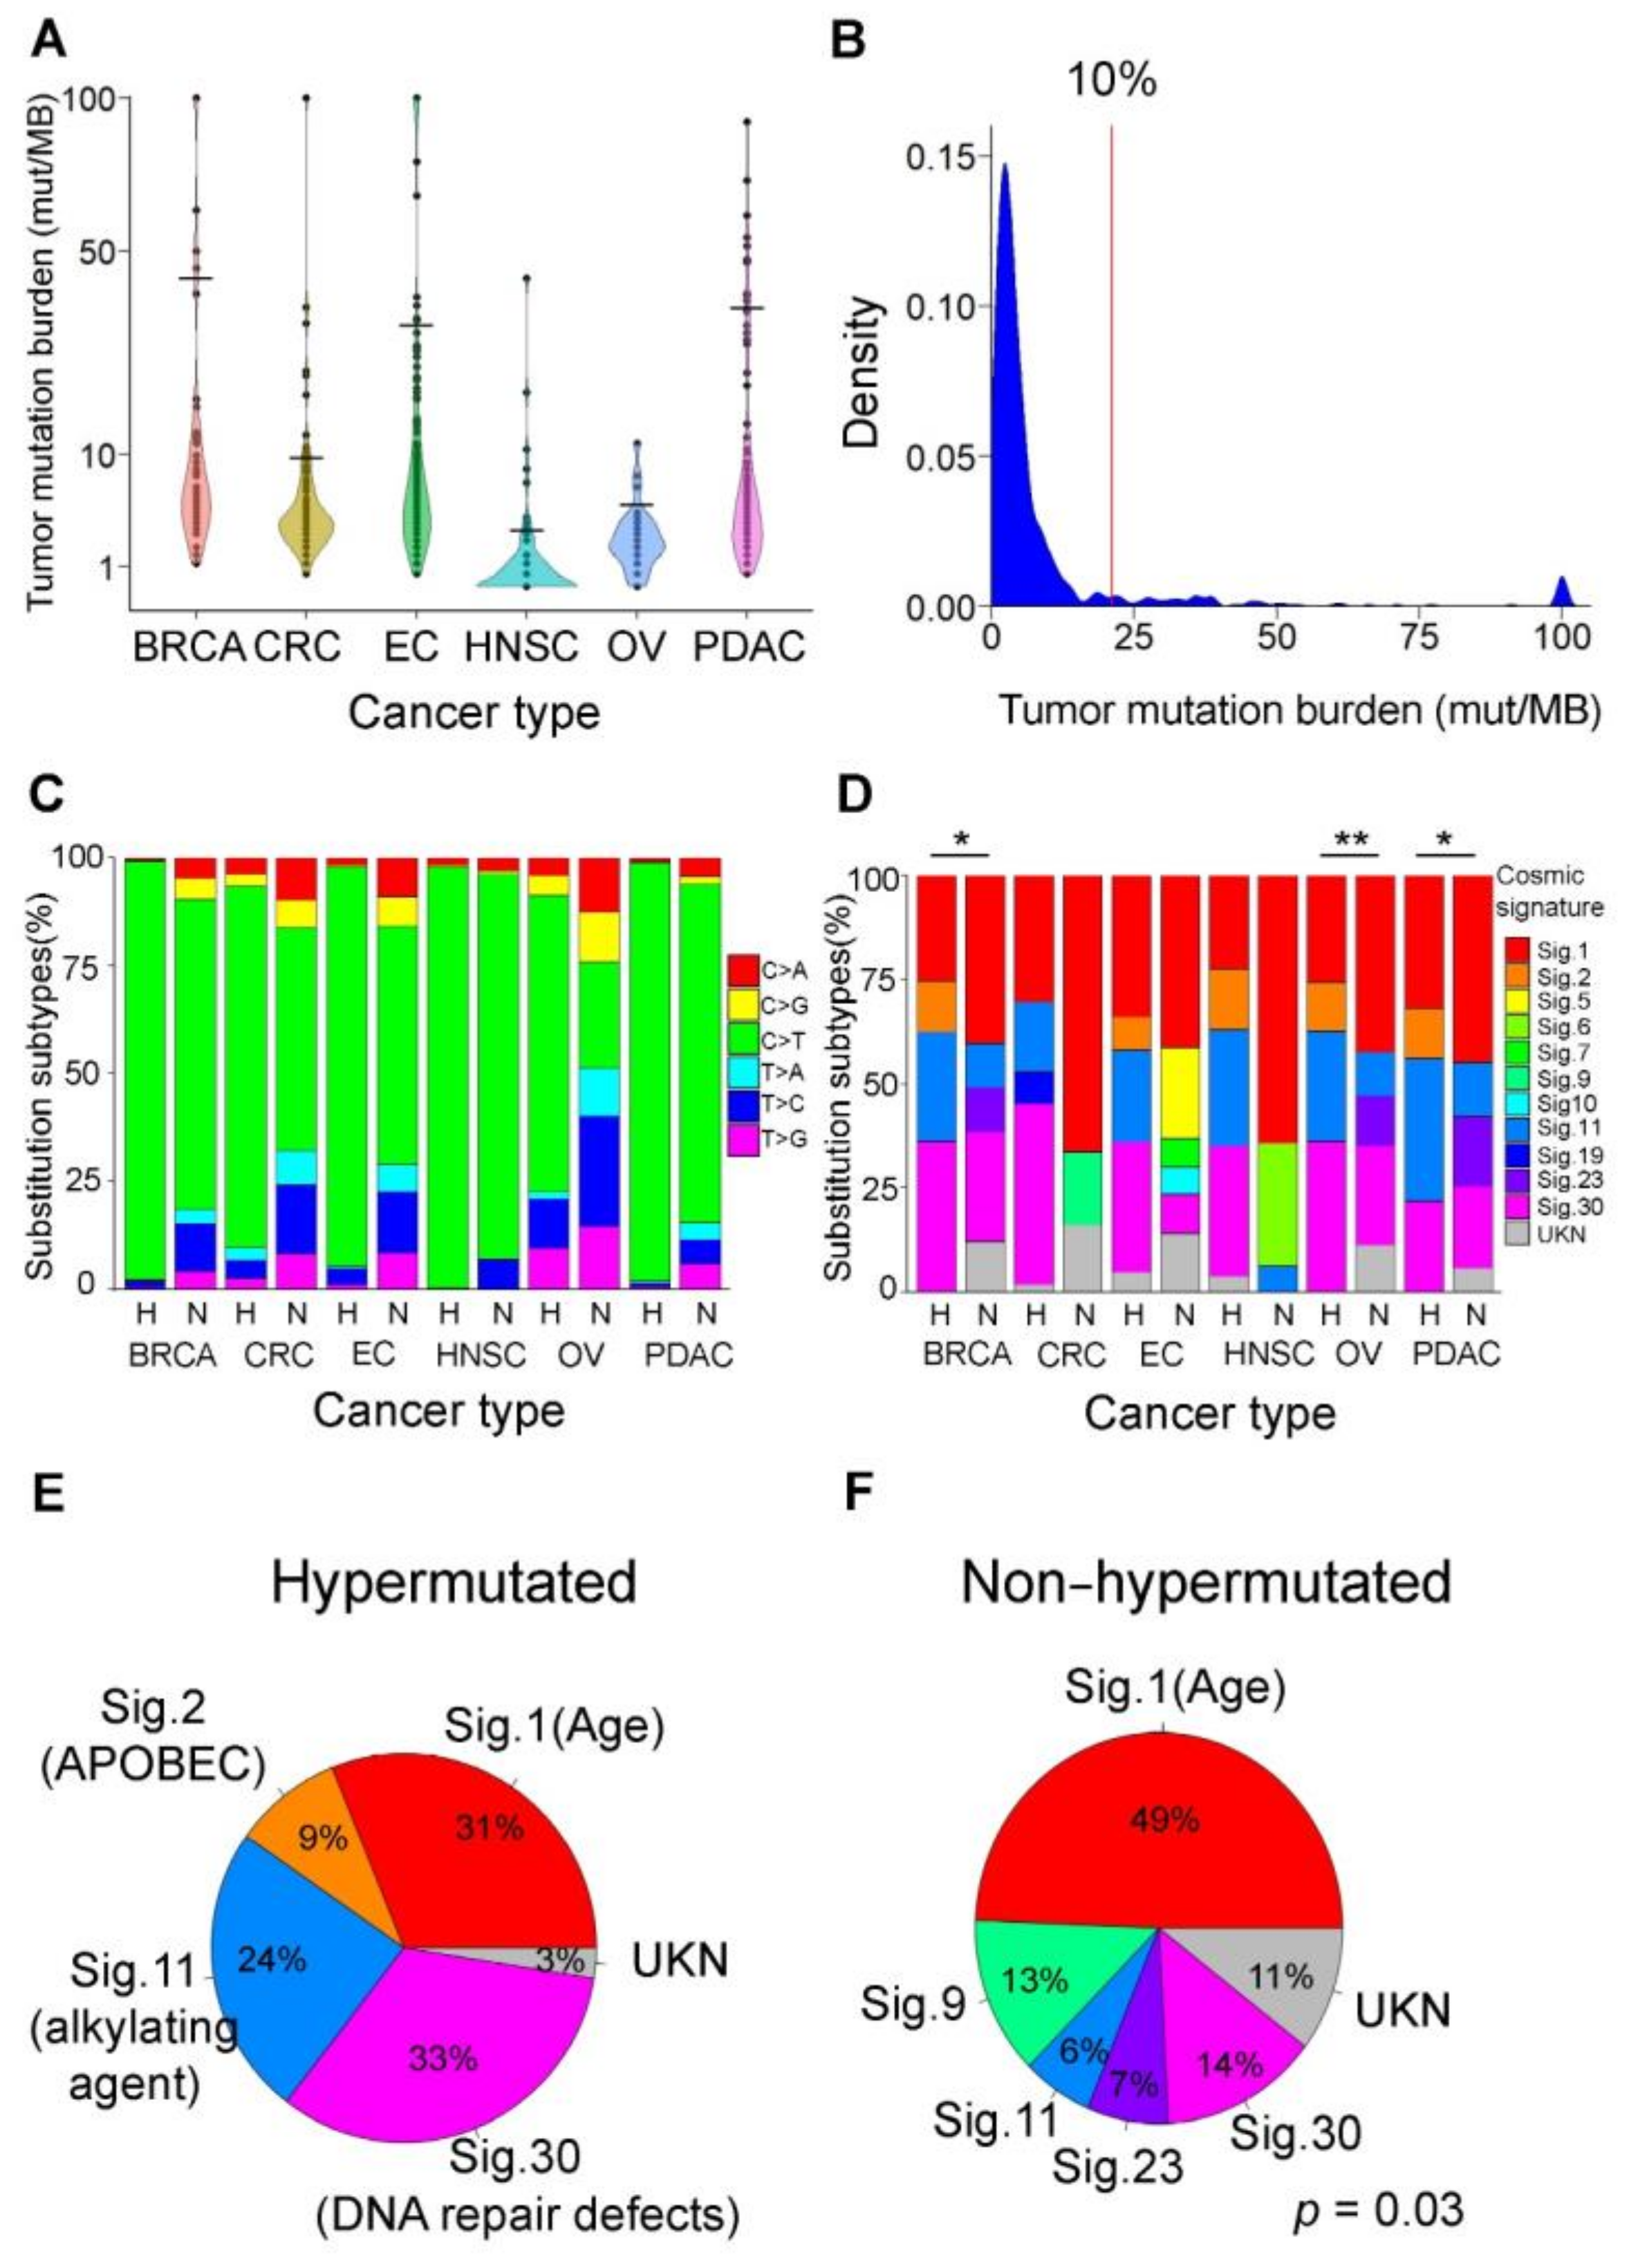
3.2. Mutational Signatures as Genetic Makers for Immunotherapy
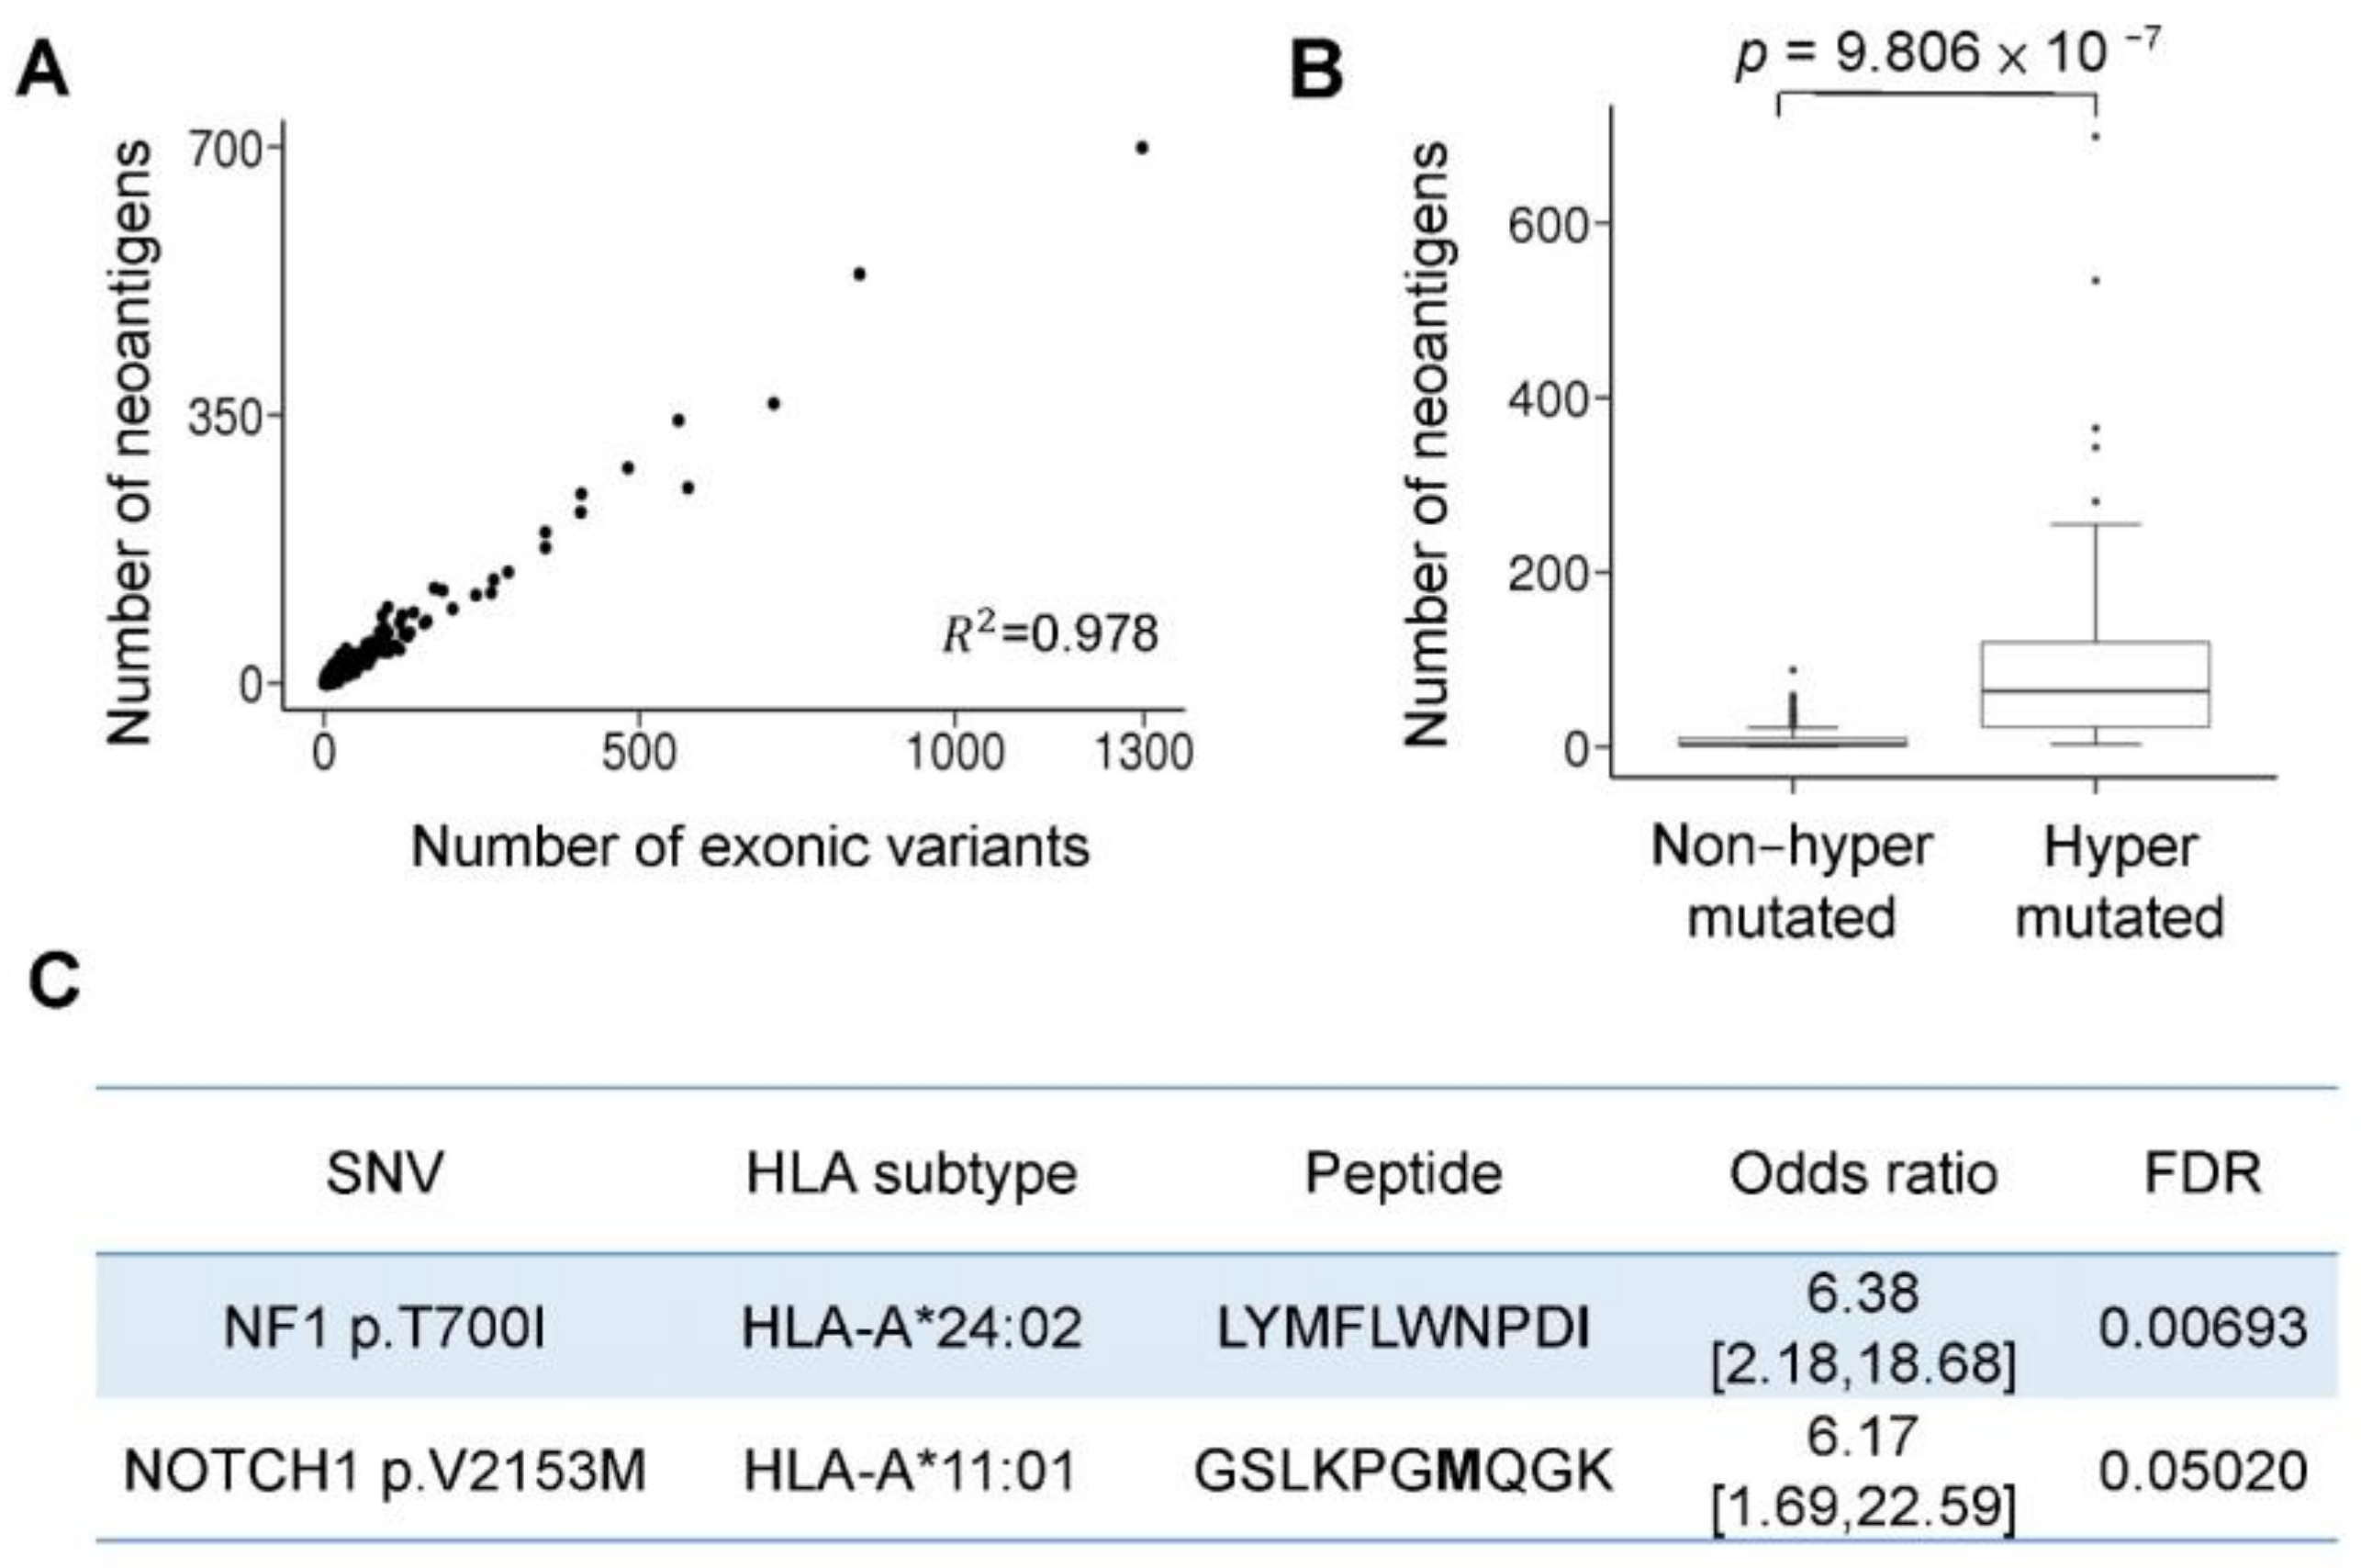
3.3. Hypermutation-Derived Neoantigens
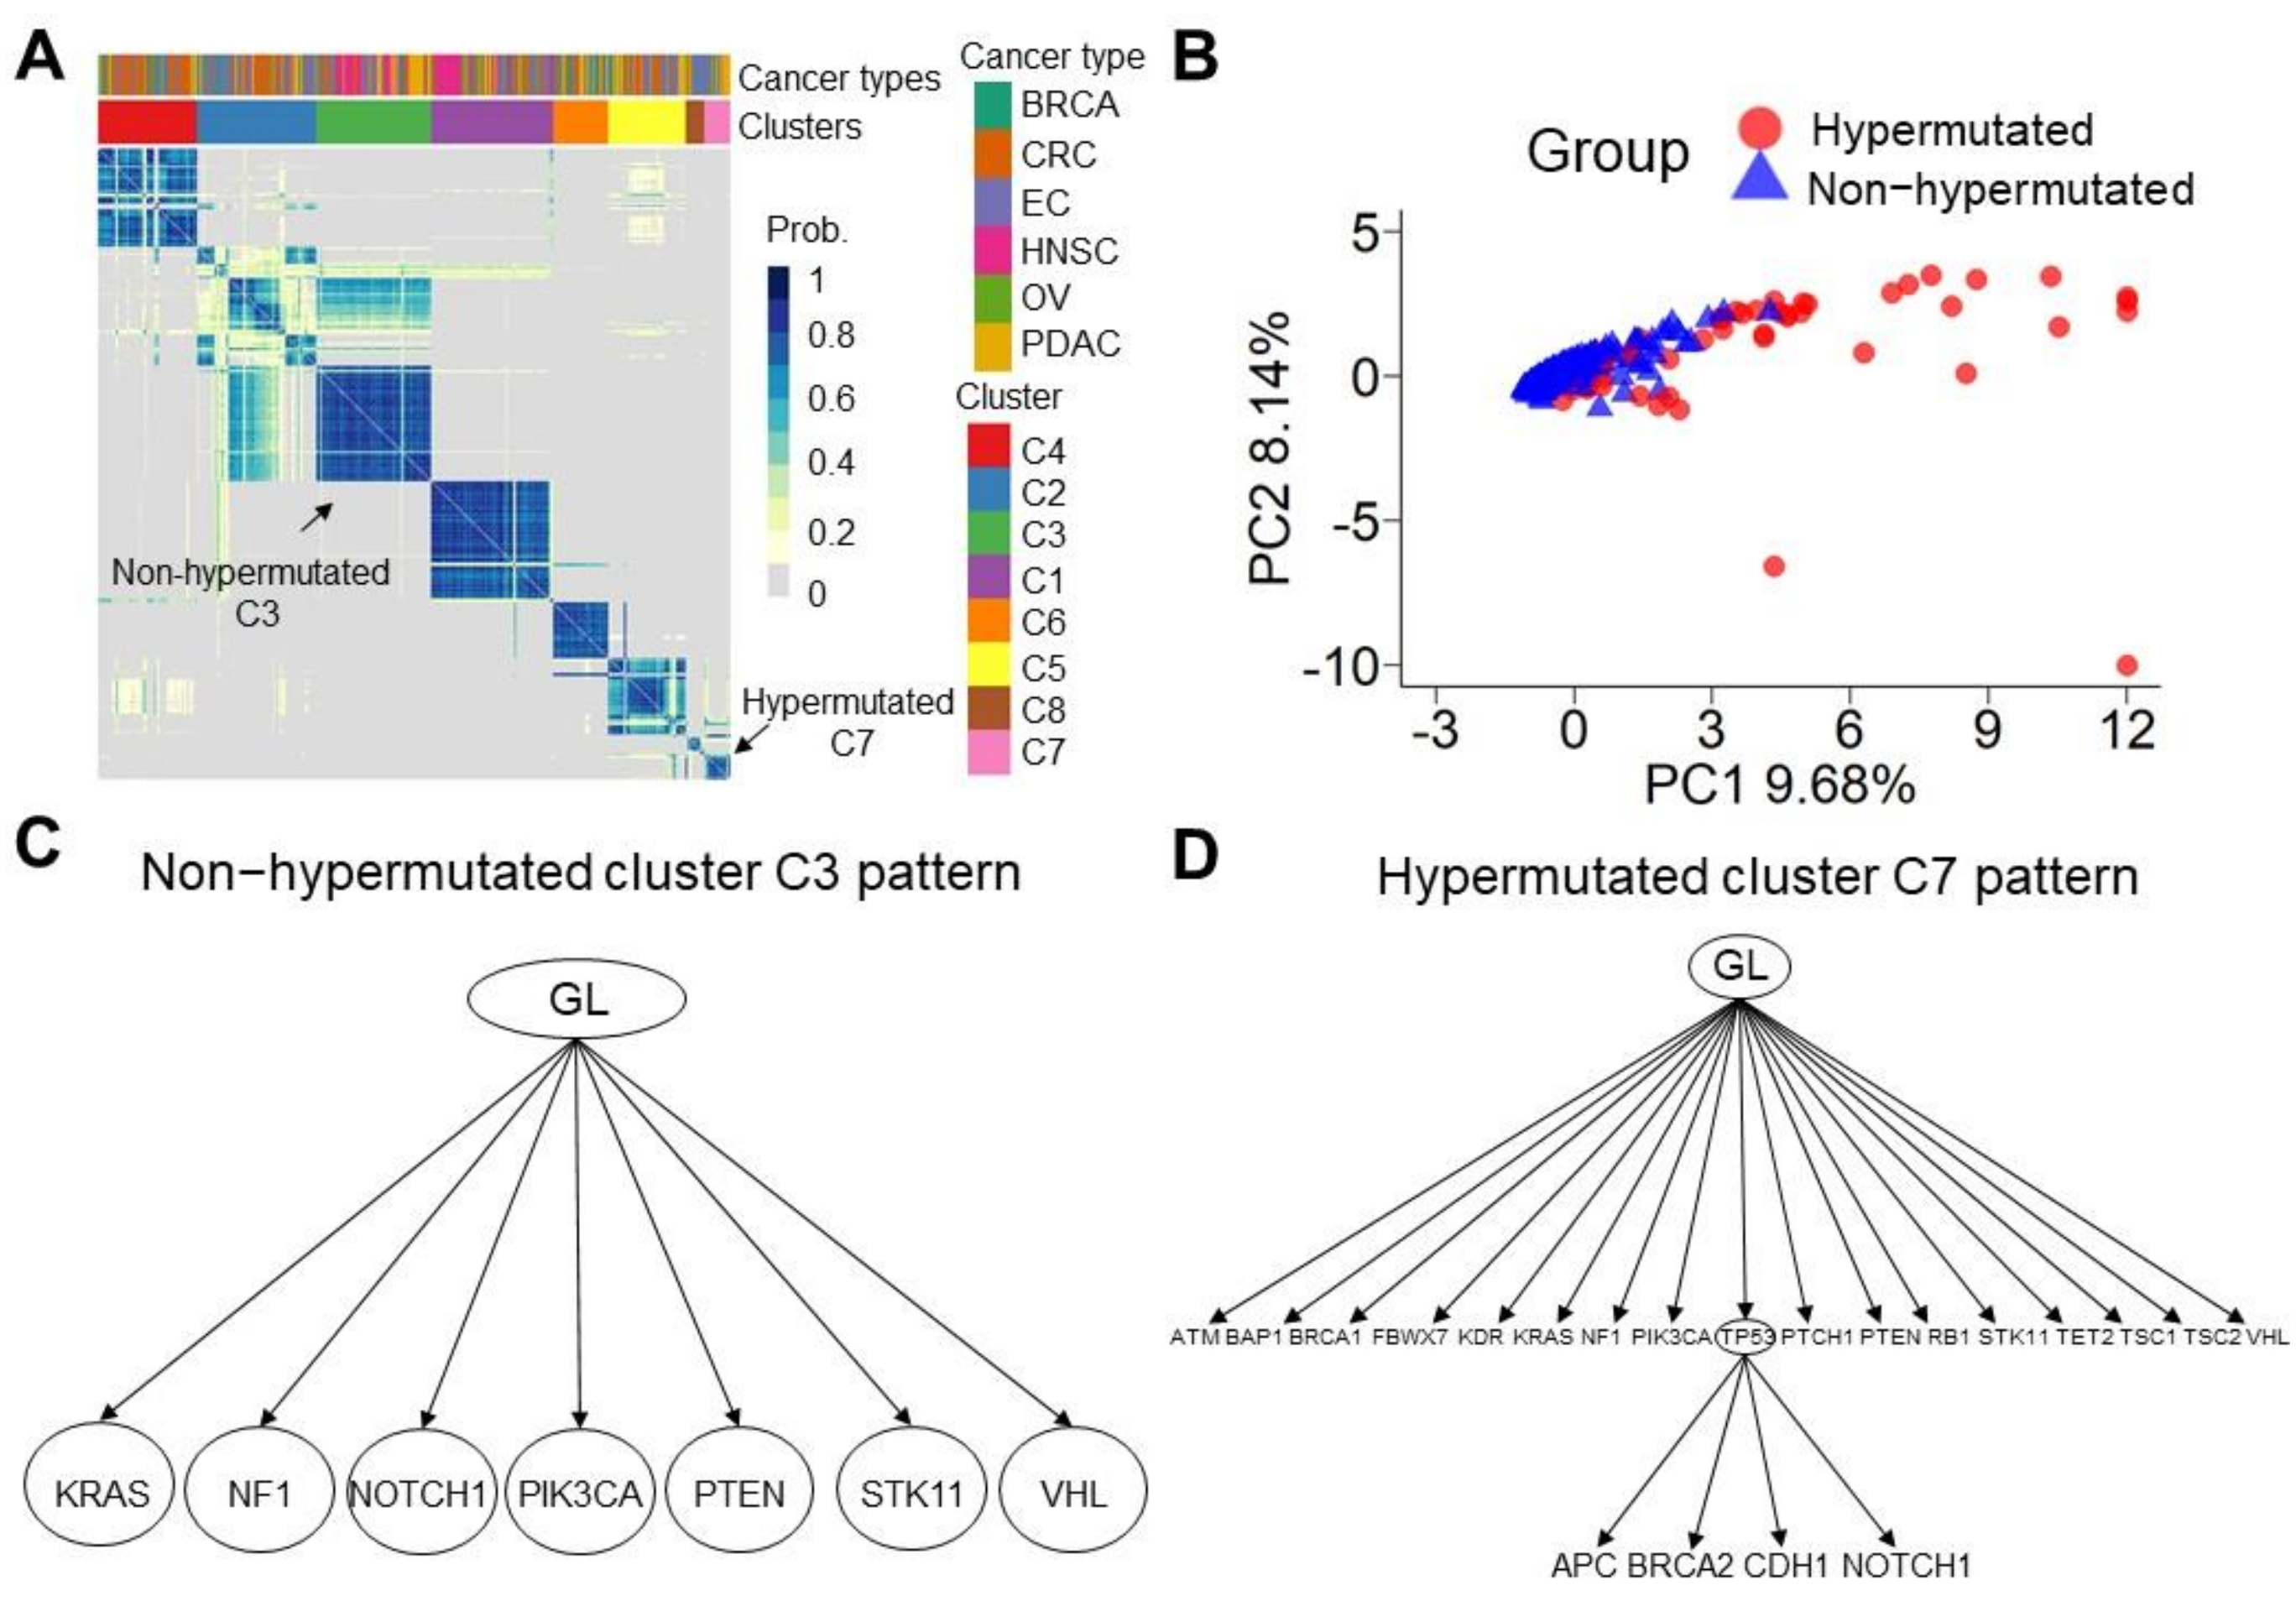
3.4. Sequential Mutation Clustering and Trajectory Analysis in the Evolution of Hypermutated Cancers
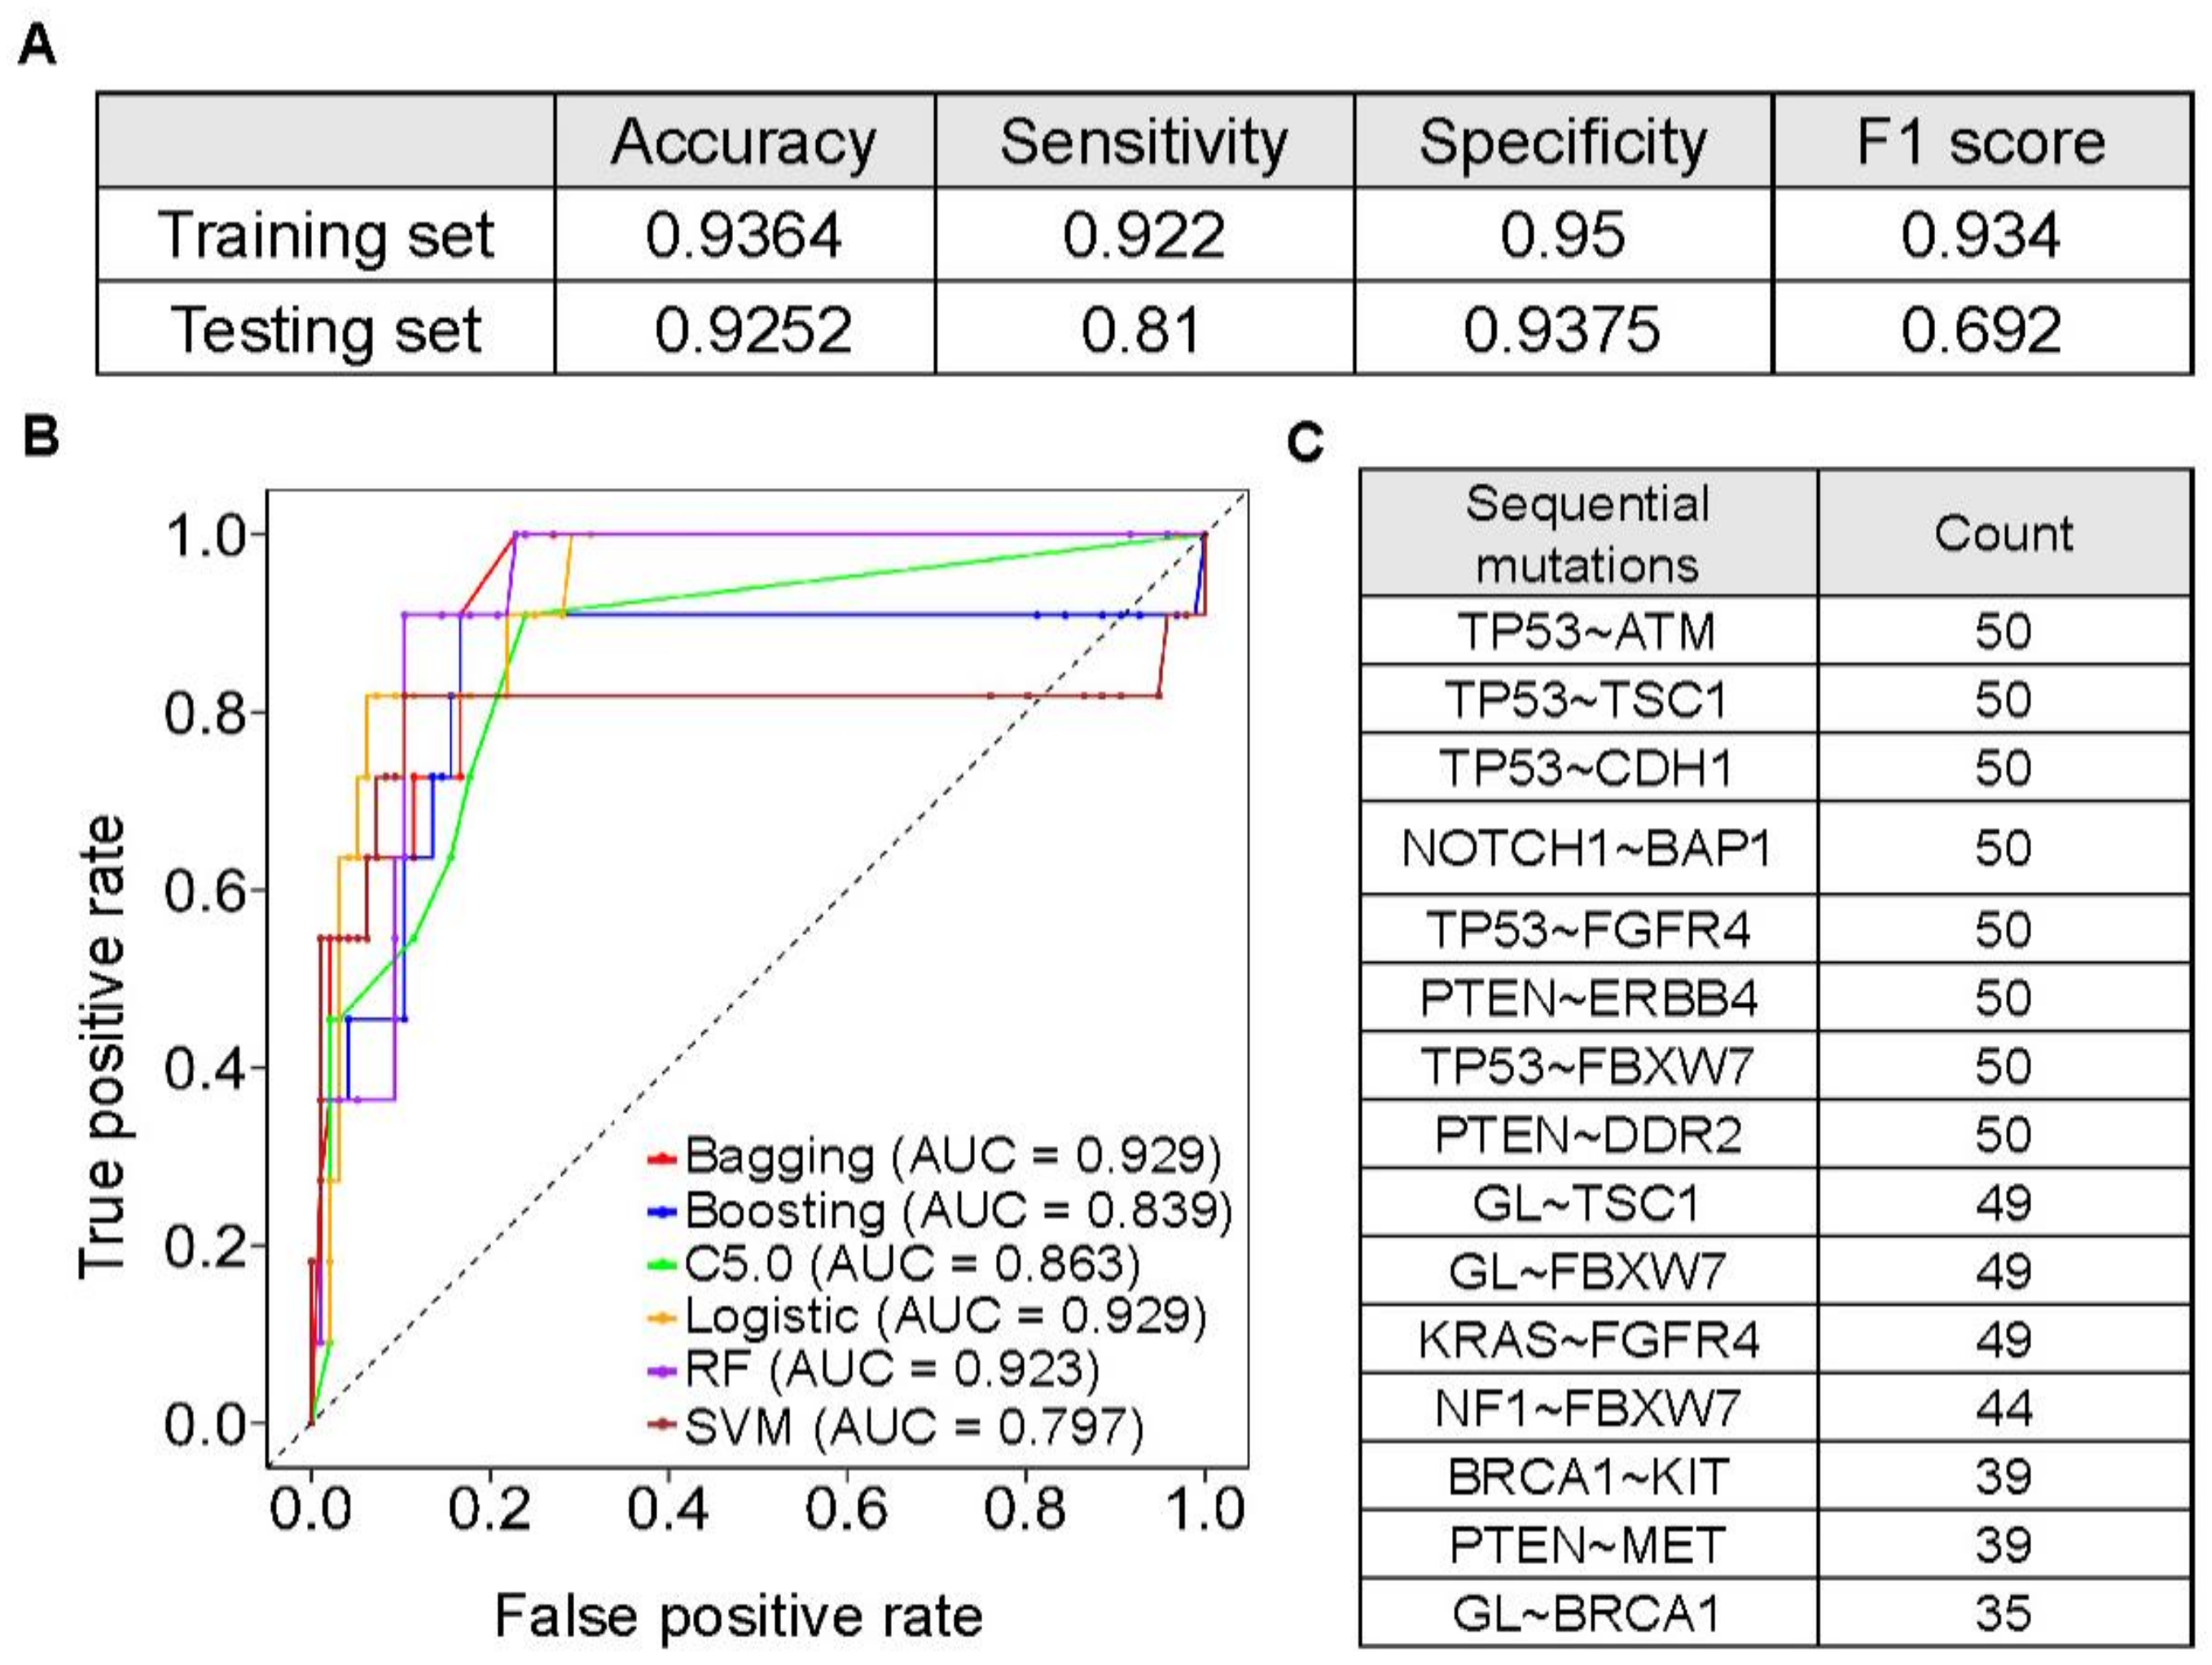
3.5. Machine Learning Models to Predict Hypermutated Cancers by Sequential Mutations
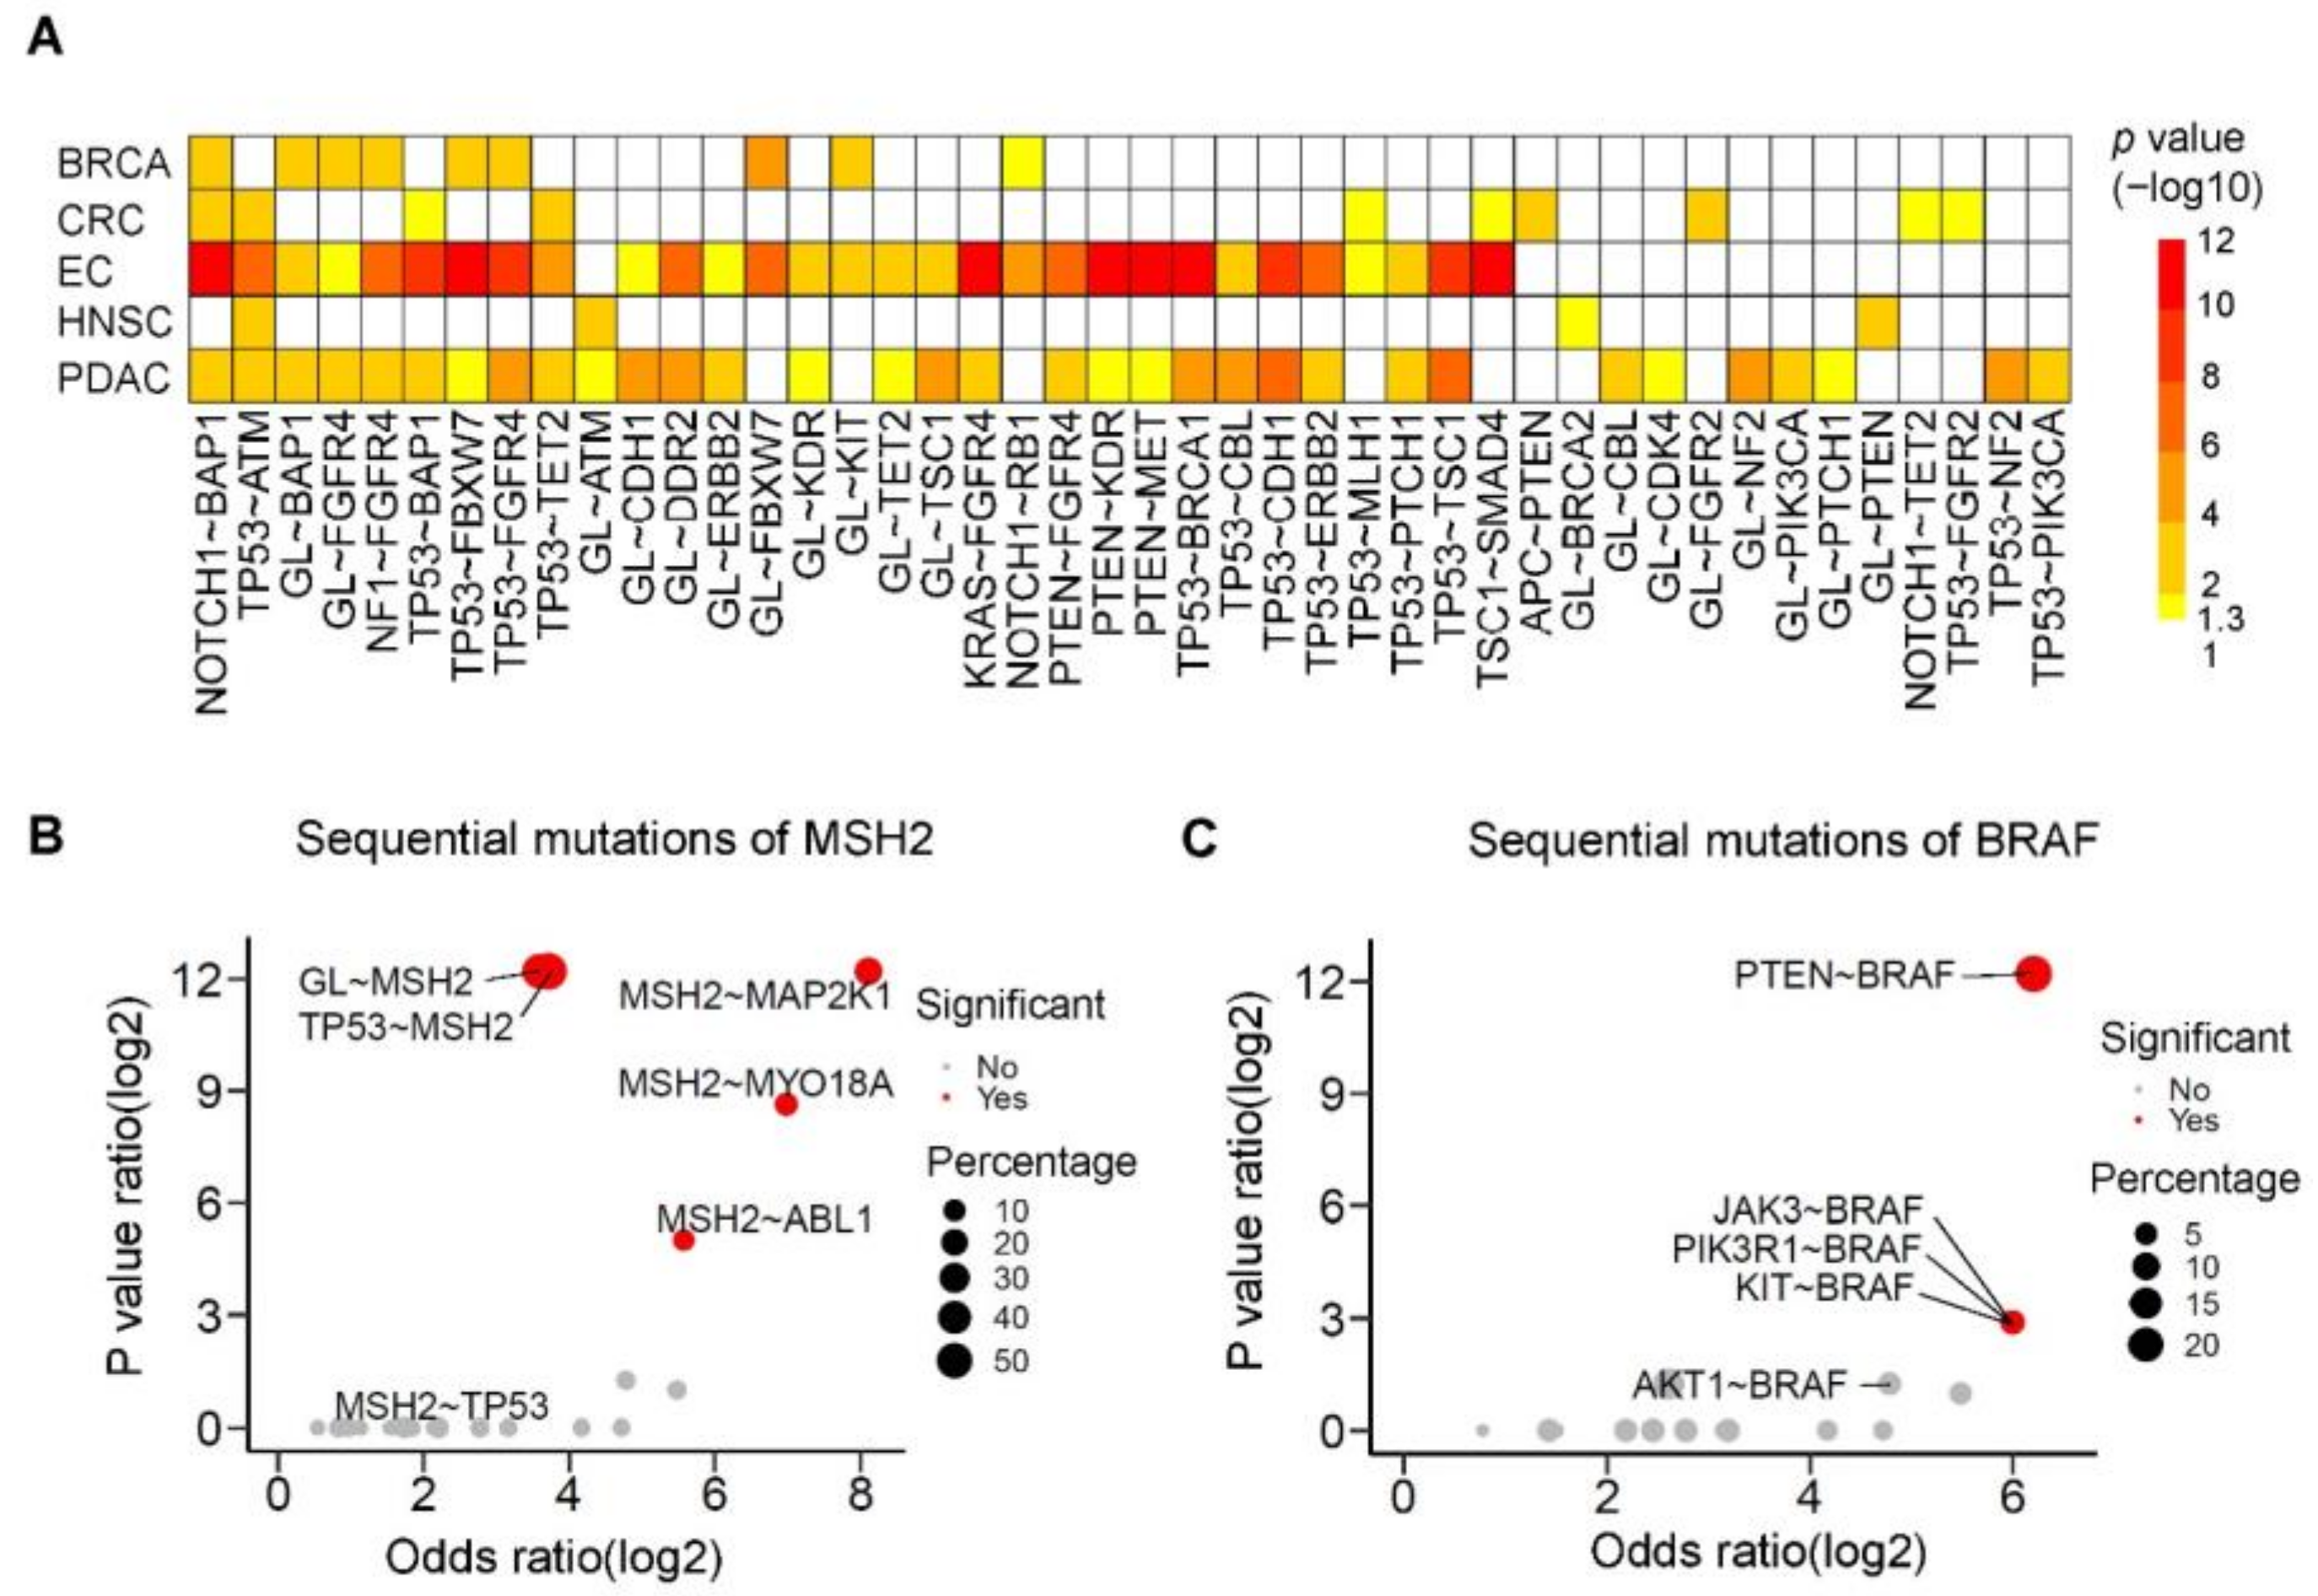
3.6. The Prevalence and Spectrum of Sequential Mutations
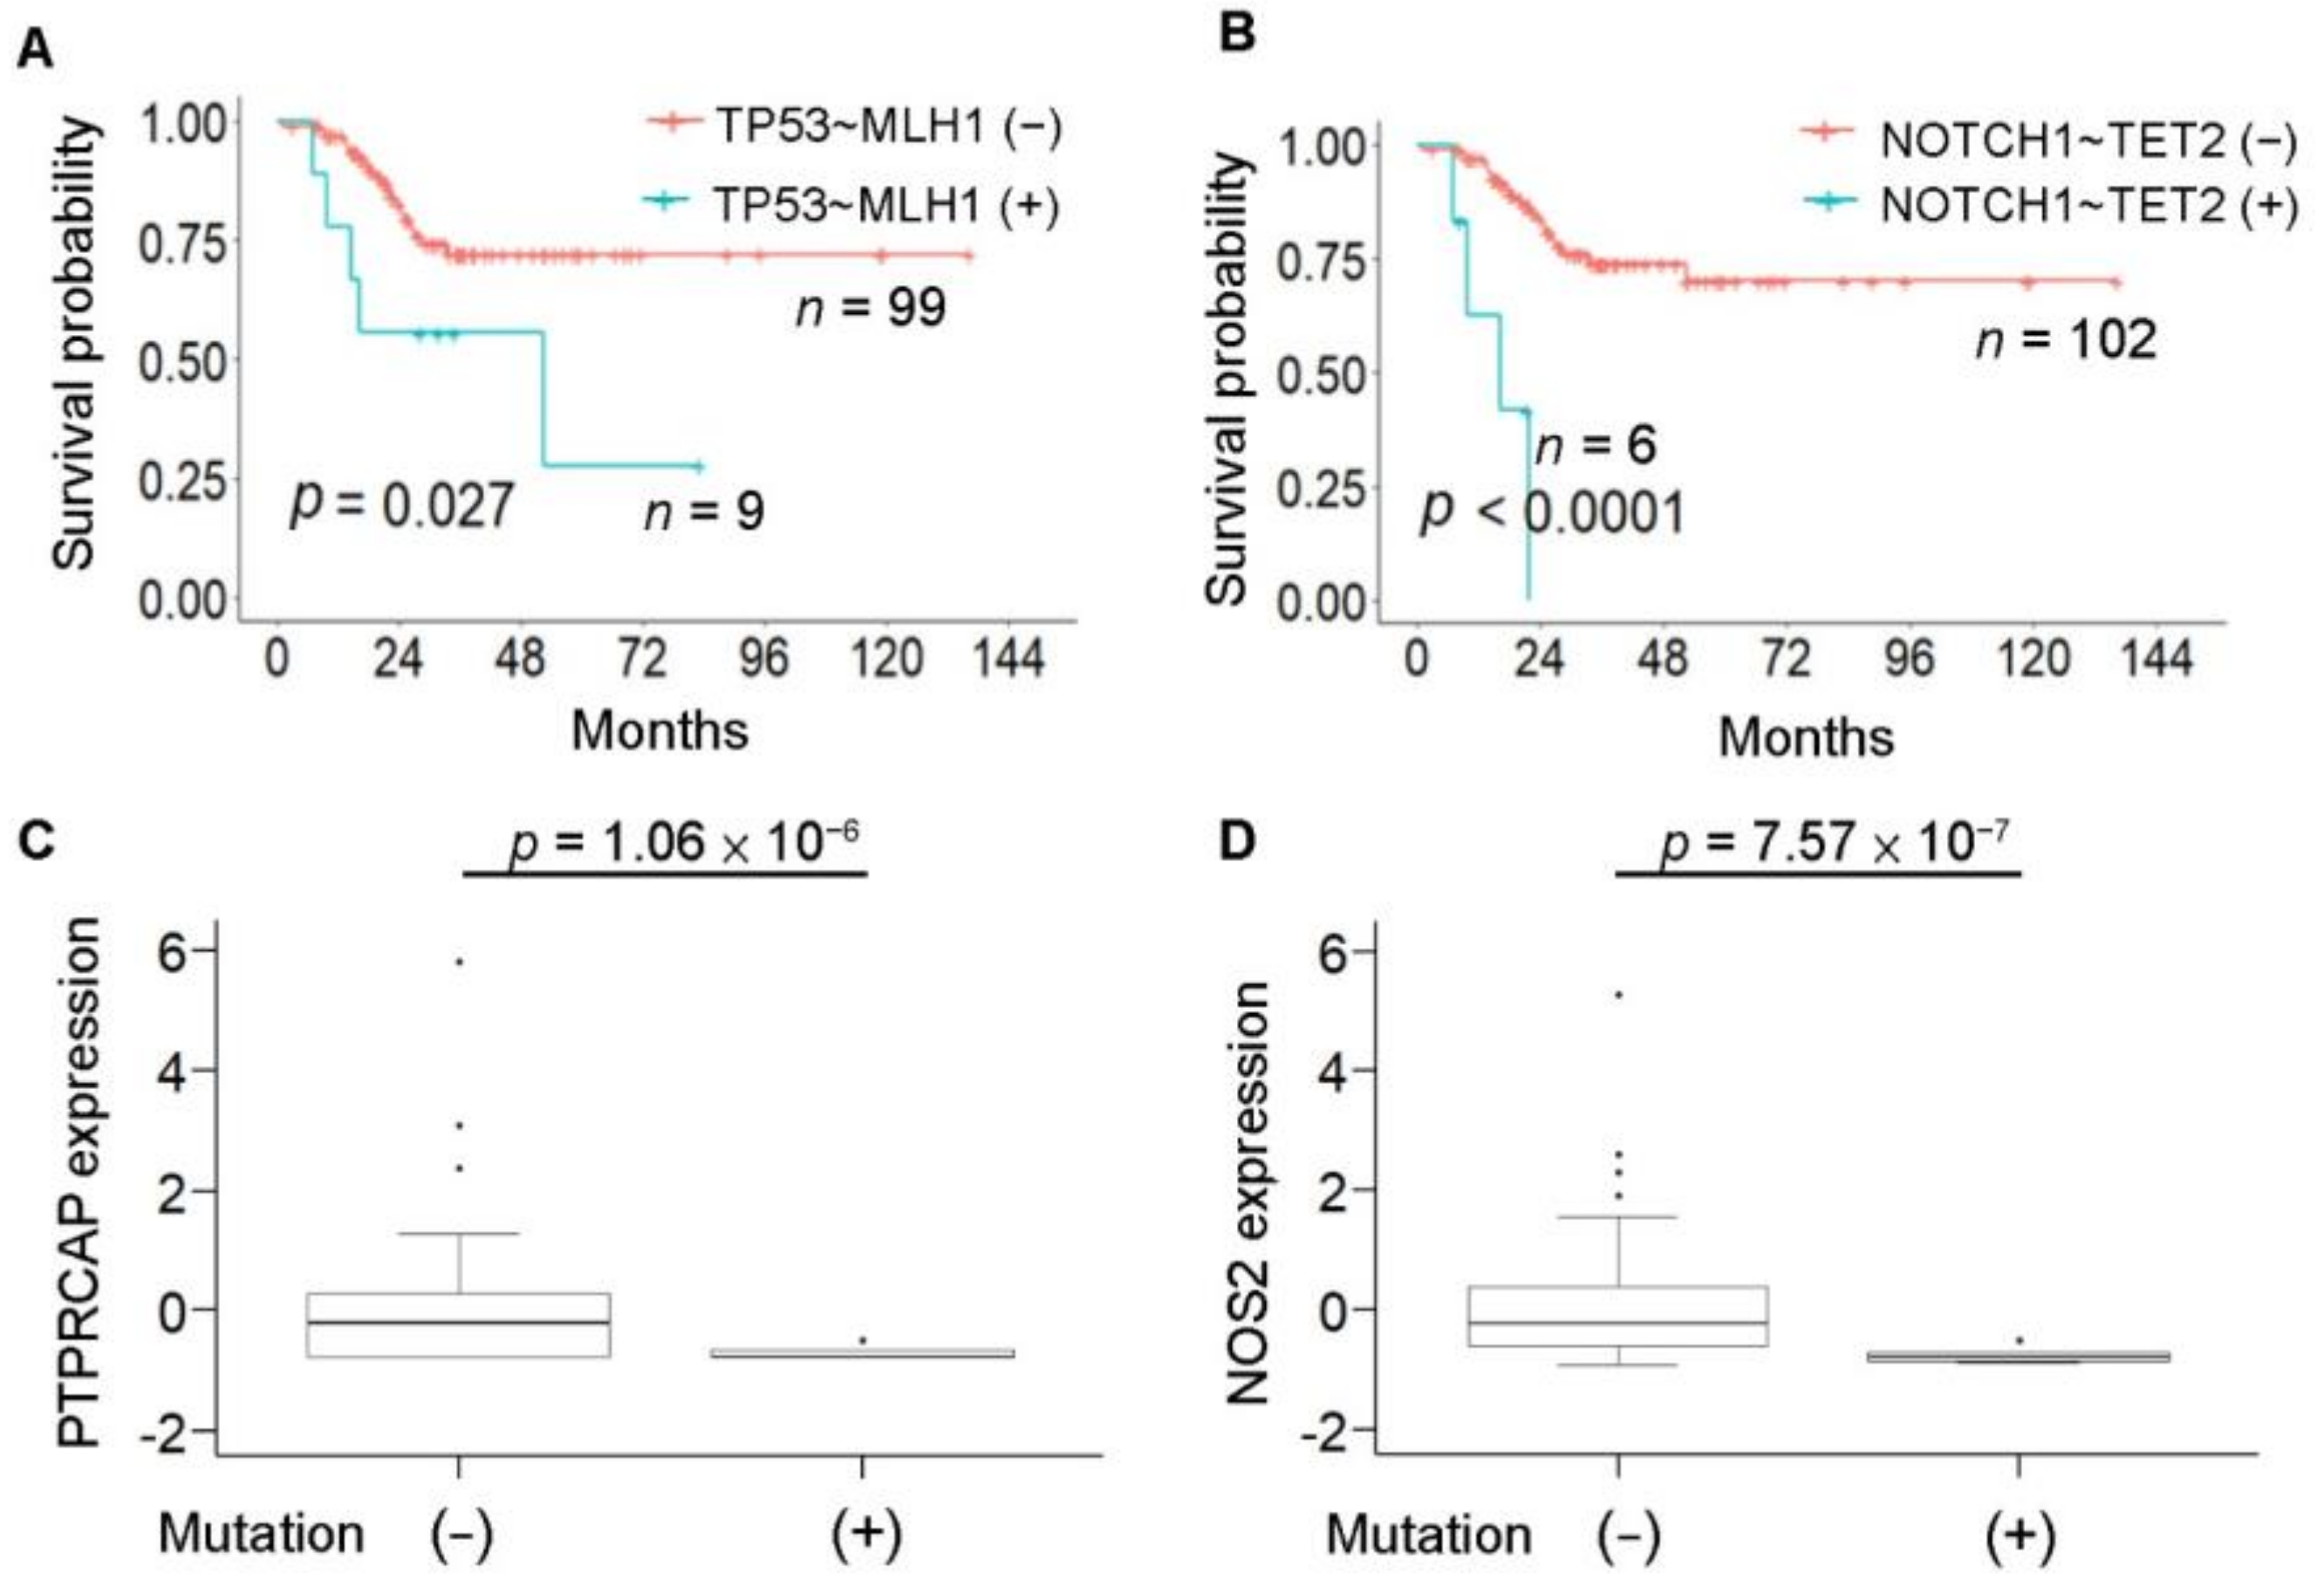
3.7. Hypermutation-Associated Sequential Mutations and Clinical Outcome in Colorectal Cancer
4. Discussion
5. Conclusions
Supplementary Materials
Author Contributions
Funding
Institutional Review Board Statement
Informed Consent Statement
Data Availability Statement
Acknowledgments
Conflicts of Interest
Abbreviations
| AUC | area under the curve |
| APOBEC | apolipoprotein B mRNA editing enzyme, catalytic polypeptide-like |
| BRCA | breast cancer |
| BF | Bonferroni |
| CRC | colorectal cancer |
| COSMIC | Catalog of Somatic Mutations in Cancer |
| EC | endometrial cancer |
| ECOG PS | Eastern Cooperative Oncology Group performance status |
| ExAC-EAS | Exome Aggregation Consortium-East Asian |
| FDA | U.S. Food and Drug Administration |
| FDR | false discovery rate |
| FF | fresh-frozen |
| FFPE | formalin-fixed paraffin-embedded |
| HNSC | head and neck cancer |
| ICI | immune checkpoint inhibitor |
| LASSO | least absolute shrinkage and selection operator |
| LR | logistic regression |
| MSI-H | microsatellite instability-high; mut/Mb: mutations per megabase |
| NCKUH | National Cheng Kung University Hospital |
| NGS | next generation sequencing |
| OV | ovarian cancer |
| PCA | principal component analysis |
| RFS | recurrence-free survival |
| PDL-1 | programmed death-ligand 1 |
| PDAC | pancreatic cancer |
| RF | random forest |
| SNVs | single-nucleotide variants |
| SVM | support vector machine |
| TAF | Taiwan Accreditation Foundation |
| TCGA | The Cancer Genome Atlas |
| TFDA-LDTs | Taiwan Food and Drug Administration |
| TMB | tumor mutational burden |
| WES | whole-exome sequencing |
References
- Yarchoan, M.; Hopkins, A.; Jaffee, E.M. Tumor Mutational Burden and Response Rate to PD-1 Inhibition. N. Engl. J. Med. 2017, 377, 2500–2501. [Google Scholar] [CrossRef]
- Jackson, C.M.; Choi, J.; Lim, M. Mechanisms of immunotherapy resistance: Lessons from glioblastoma. Nat. Immunol. 2019, 20, 1100–1109. [Google Scholar] [CrossRef]
- Fares, C.M.; VanAllen, E.M.; Drake, C.G.; Allison, J.P.; Hu-Lieskovan, S. Mechanisms of Resistance to Immune Checkpoint Blockade: Why Does Checkpoint Inhibitor Immunotherapy Not Work for All Patients? Am. Soc. Clin. Oncol. Educ. B. 2019, 147–164. [Google Scholar] [CrossRef]
- Rizvi, H.; Sanchez-Vega, F.; La, K.; Chatila, W.; Jonsson, P.; Halpenny, D.; Plodkowski, A.; Long, N.; Sauter, J.L.; Rekhtman, N.; et al. Molecular determinants of response to anti-programmed cell death (PD)-1 and anti-programmed death-ligand 1 (PD-L1) blockade in patients with non-small-cell lung cancer profiled with targeted next-generation sequencing. J. Clin. Oncol. 2018, 36, 633–641. [Google Scholar] [CrossRef]
- Vanderwalde, A.; Spetzler, D.; Xiao, N.; Gatalica, Z.; Marshall, J. Microsatellite instability status determined by next-generation sequencing and compared with PD-L1 and tumor mutational burden in 11,348 patients. Cancer Med. 2018, 7, 746–756. [Google Scholar] [CrossRef] [PubMed] [Green Version]
- Hu, W.; Yang, Y.; Ge, W.; Zheng, S. Deciphering molecular properties of hypermutated gastrointestinal cancer. J. Cell. Mol. Med. 2019, 23, 370–379. [Google Scholar] [CrossRef]
- Skoulidis, F.; Goldberg, M.E.; Greenawalt, D.M.; Hellmann, M.D.; Awad, M.M.; Gainor, J.F.; Schrock, A.B.; Hartmaier, R.J.; Trabucco, S.E.; Gay, L.; et al. STK11/LKB1 mutations and PD-1 inhibitor resistance in KRAS-mutant lung adenocarcinoma. Cancer Discov. 2018, 8, 822–835. [Google Scholar] [CrossRef] [PubMed] [Green Version]
- Chalmers, Z.R.; Connelly, C.F.; Fabrizio, D.; Gay, L.; Ali, S.M.; Ennis, R.; Schrock, A.; Campbell, B.; Shlien, A.; Chmielecki, J.; et al. Analysis of 100,000 human cancer genomes reveals the landscape of tumor mutational burden. Genome Med. 2017, 9, 34. [Google Scholar] [CrossRef] [PubMed]
- Herbet, M.; Salomon, A.; Feige, J.J.; Thomas, M. Acquisition order of Ras and p53 gene alterations defines distinct adrenocortical tumor phenotypes. PLoS Genet. 2012, 8, e1002700. [Google Scholar] [CrossRef] [PubMed] [Green Version]
- Endris, V.; Buchhalter, I.; Allgäuer, M.; Rempel, E.; Lier, A.; Volckmar, A.L.; Kirchner, M.; von Winterfeld, M.; Leichsenring, J.; Neumann, O.; et al. Measurement of tumor mutational burden (TMB) in routine molecular diagnostics: In silico and real-life analysis of three larger gene panels. Int. J. Cancer. 2019, 144, 2303–2312. [Google Scholar] [CrossRef] [PubMed]
- Baden, J.; Barrett, J.C.; Chaudhary, R.; Chen, L.; Chen, W.S.; Cheng, J.H.; Cyanam, D.; Dickey, J.S.; Gupta, V.; Hellmann, M.; et al. Establishing guidelines to harmonize tumor mutational burden (TMB): In silico assessment of variation in TMB quantification across diagnostic platforms: Phase I of the Friends of Cancer Research TMB Harmonization Project. J. Immunother. Cancer. 2020, 8, e000147. [Google Scholar] [CrossRef] [Green Version]
- McNulty, S.N.; Parikh, B.A.; Duncavage, E.J.; Heusel, J.W.; Pfeifer, J.D. Optimization of Population Frequency Cutoffs for Filtering Common Germline Polymorphisms from Tumor-Only Next-Generation Sequencing Data. J. Mol. Diagn. 2019, 21, 903–912. [Google Scholar] [CrossRef] [PubMed]
- Tsai, Y.Y.; Lee, W.J. An imagined future community: Taiwan Biobank, Taiwanese genome, and nation-building. BioSocieties 2021, 16, 88–115. [Google Scholar] [CrossRef]
- Karczewski, K.J.; Weisburd, B.; Thomas, B.; Solomonson, M.; Ruderfer, D.M.; Kavanagh, D.; Hamamsy, T.; Lek, M.; Samocha, K.E.; Cummings, B.B.; et al. The ExAC browser: Displaying reference data information from over 60 000 exomes. Nucleic Acids Res. 2017, 45, D840–D845. [Google Scholar] [CrossRef] [Green Version]
- Lin, P.C.; Yeh, Y.M.; Wu, P.Y.; Hsu, K.F.; Chang, J.Y.; Shen, M.R. Germline susceptibility variants impact clinical outcome and therapeutic strategies for stage III colorectal cancer. Sci. Rep. 2019, 9, 3931. [Google Scholar] [CrossRef] [Green Version]
- Mueller, J.J.; Schlappe, B.A.; Kumar, R.; Olvera, N.; Dao, F.; Abu-Rustum, N.; Aghajanian, C.; DeLair, D.; Hussein, Y.R.; Soslow, R.A.; et al. Massively parallel sequencing analysis of mucinous ovarian carcinomas: Genomic profiling and differential diagnoses. Gynecol. Oncol. 2018, 150, 127–135. [Google Scholar] [CrossRef]
- Rosenthal, R.; McGranahan, N.; Herrero, J.; Taylor, B.S.; Swanton, C. deconstructSigs: Delineating mutational processes in single tumors distinguishes DNA repair deficiencies and patterns of carcinoma evolution. Genome Biol. 2016, 17, 31. [Google Scholar] [CrossRef] [Green Version]
- Salk, J.J.; Fox, E.J.; Loeb, L.A. Mutational heterogeneity in human cancers: Origin and consequences. Annu. Rev. Pathol. 2010, 5, 51–75. [Google Scholar] [CrossRef] [PubMed] [Green Version]
- Birkbak, N.J.; McGranahan, N. Cancer Genome Evolutionary Trajectories in Metastasis. Cancer Cell. 2020, 37, 8–19. [Google Scholar] [CrossRef] [PubMed]
- Miller, C.A.; White, B.S.; Dees, N.D.; Griffith, M.; Welch, J.S.; Griffith, O.L.; Vij, R.; Tomasson, M.H.; Graubert, T.A.; Walter, M.J.; et al. SciClone: Inferring Clonal Architecture and Tracking the Spatial and Temporal Patterns of Tumor Evolution. PLoS Comput. Biol. 2014, 10, e1003665. [Google Scholar] [CrossRef]
- Caravagna, G.; Giarratano, Y.; Ramazzotti, D.; Tomlinson, I.; Graham, T.A.; Sanguinetti, G.; Sottoriva, A. Detecting repeated cancer evolution from multi-region tumor sequencing data. Nat. Methods 2018, 15, 707–714. [Google Scholar] [CrossRef] [PubMed]
- Friedman, J.; Hastie, T.; Tibshirani, R. Regularization paths for generalized linear models via coordinate descent. J. Stat. Softw. 2010, 33, 1–22. [Google Scholar] [CrossRef] [PubMed] [Green Version]
- Lunardon, N.; Menardi, G.; Torelli, N. ROSE: A package for binary imbalanced learning. R J. 2014, 6, 79–89. [Google Scholar] [CrossRef] [Green Version]
- Kuhn, M. Building predictive models in R using the caret package. J. Stat. Softw. 2008, 28, 1–26. [Google Scholar] [CrossRef] [Green Version]
- González-Galarza, F.F.; Takeshita, L.Y.C.; Santos, E.J.M.; Kempson, F.; Maia, M.H.T.; DaSilva, A.L.S.; Teles E Silva, A.L.; Ghattaoraya, G.S.; Alfirevic, A.; Jones, A.R.; et al. Allele frequency net 2015 update: New features for HLA epitopes, KIR and disease and HLA adverse drug reaction associations. Nucleic Acids Res. 2015, 43, D784–D788. [Google Scholar] [CrossRef]
- Schenck, R.O.; Lakatos, E.; Gatenbee, C.; Graham, T.A.; Anderson, A.R.A. NeoPredPipe: High-throughput neoantigen prediction and recognition potential pipeline. BMC Bioinform. 2019, 20, 264. [Google Scholar] [CrossRef] [Green Version]
- Loong, H.H.; Du, N.; Cheng, C.; Lin, H.; Guo, J.; Lin, G.; Li, M.; Jiang, T.; Shi, Z.; Cui, Y.; et al. KRAS G12C mutations in Asia: A landscape analysis of 11,951 Chinese tumor samples. Transl. Lung Cancer Res. 2020, 9, 1759–1769. [Google Scholar] [CrossRef]
- Yuan, H.; Ji, J.; Shi, M.; Shi, Y.; Liu, J.; Wu, J.; Yang, C.; Xi, W.; Li, Q.; Zhu, W.; et al. Characteristics of Pan-Cancer Patients with Ultrahigh Tumor Mutation Burden. Front. Oncol. 2021, 11, 682017. [Google Scholar] [CrossRef]
- Fancello, L.; Gandini, S.; Pelicci, P.G.; Mazzarella, L. Tumor mutational burden quantification from targeted gene panels: Major advancements and challenges. J. Immunother. Cancer 2019, 7, 183. [Google Scholar] [CrossRef] [Green Version]
- Zehir, A.; Benayed, R.; Shah, R.H.; Syed, A.; Middha, S.; Kim, H.R.; Srinivasan, P.; Gao, J.; Chakravarty, D.; Devlin, S.M.; et al. Mutational landscape of metastatic cancer revealed from prospective clinical sequencing of 10,000 patients. Nat. Med. 2017, 23, 703–713. [Google Scholar] [CrossRef]
- Lin, P.C.; Yeh, Y.M.; Lin, B.W.; Lin, S.C.; Chan, R.H.; Chen, P.C.; Shen, M.R. Intratumor Heterogeneity of MYO18A and FBXW7 Variants Impact the Clinical Outcome of Stage III Colorectal Cancer. Front. Oncol. 2020, 10, 588557. [Google Scholar] [CrossRef] [PubMed]
- McGranahan, N.; Swanton, C. Clonal Heterogeneity and Tumor Evolution: Past, Present, and the Future. Cell 2017, 168, 613–628. [Google Scholar] [CrossRef] [PubMed] [Green Version]
- Stadler, Z.K.; Battaglin, F.; Middha, S.; Hechtman, J.F.; Tran, C.; Cercek, A.; Yaeger, R.; Segal, N.H.; Varghese, A.M.; Reidy-Lagunes, D.L.; et al. Reliable detection of mismatch repair deficiency in colorectal cancers using mutational load in next-generation sequencing panels. J. Clin. Oncol. 2016, 34, 2141–2147. [Google Scholar] [CrossRef] [PubMed]
- Parsons, M.T.; Buchanan, D.D.; Thompson, B.; Young, J.P.; Spurdle, A.B. Correlation of tumour BRAF mutations and MLH1 methylation with germline mismatch repair (MMR) gene mutation status: A literature review assessing utility of tumour features for MMR variant classification. J. Med. Genet. 2012, 49, 151–157. [Google Scholar] [CrossRef]
- Huang, Y.C.; Chen, Y.H. Cancer Incidence Characteristic Evolution Based on the National Cancer Registry in Taiwan. J. Oncol. 2020, 1408793. [Google Scholar] [CrossRef]
- Yan, X.; Zhang, S.; Deng, Y.; Wang, P.; Hou, Q.; Xu, H. Prognostic factors for checkpoint inhibitor based immunotherapy: An update with new evidences. Front. Pharmacol. 2018, 9, 1050. [Google Scholar] [CrossRef] [Green Version]
- Teo, M.Y.; Seier, K.; Ostrovnaya, I.; Regazzi, A.M.; Kania, B.E.; Moran, M.M.; Cipolla, C.K.; Bluth, M.J.; Chaim, J.; Al-Ahmadie, H.; et al. Alterations in DNA damage response and repair genes as potential marker of clinical benefit from PD-1/PD-L1 blockade in advanced urothelial cancers. J. Clin. Oncol. 2018, 36, 1685–1694. [Google Scholar] [CrossRef]
- Yamashita, H.; Nakayama, K.; Ishikawa, M.; Nakamura, K.; Ishibashi, T.; Sanuki, K.; Ono, R.; Sasamori, H.; Minamoto, T.; Iida, K.; et al. Microsatellite instability is a biomarker for immune checkpoint inhibitors in endometrial cancer. Oncotarget 2018, 9, 5652–5664. [Google Scholar] [CrossRef] [Green Version]
- Amin, N.; Chaabouni, N.; George, A. Genetic testing for epithelial ovarian cancer. Best Pract. Res. Clin. Obstet. Gynaecol. 2020, 65, 125–138. [Google Scholar] [CrossRef]
- Marigo, I.; Zilio, S.; Desantis, G.; Mlecnik, B.; Agnellini, A.H.R.; Ugel, S.; Sasso, M.S.; Qualls, J.E.; Kratochvill, F.; Zanovello, P.; et al. T Cell Cancer Therapy Requires CD40-CD40L Activation of Tumor Necrosis Factor and Inducible Nitric-Oxide-Synthase-Producing Dendritic Cells. Cancer Cell 2016, 30, 377–390. [Google Scholar] [CrossRef] [PubMed] [Green Version]
- Lobr, C.; Ntziachristos, P.; Ndiaye-Lobry, D.; Oh, P.; Cimmino, L.; Zhu, N.; Araldi, E.; Hu, W.; Freund, J.; Abdel-Wahab, O.; et al. Notch pathway activation targets AML-initiating cell homeostasis and differentiation. J. Exp. Med. 2013, 210, 301–319. [Google Scholar] [CrossRef] [PubMed]
- Auerbach, S.S.; Xu, M.; Merrick, B.A.; Hoenerhoff, M.J.; Phadke, D.; Taxman, D.J.; Shah, R.; Hong, H.L.; Ton, T.V.; Kovi, R.C.; et al. Exome Sequencing of Fresh-frozen or Formalin-fixed Paraffin-embedded B6C3F1/N Mouse Hepatocellular Carcinomas Arising Either Spontaneously or due to Chronic Chemical Exposure. Toxicol. Pathol. 2018, 46, 706–718. [Google Scholar] [CrossRef] [Green Version]
- Prentice, L.M.; Miller, R.R.; Knaggs, J.; Mazloomian, A.; Aguirre Hernandez, R.; Franchini, P.; Parsa, K.; Tessier-Cloutier, B.; Lapuk, A.; Huntsman, D.; et al. Formalin fixation increases deamination mutation signature but should not lead to false positive mutations in clinical practice. PLoS ONE 2018, 13, e0196434. [Google Scholar] [CrossRef] [PubMed] [Green Version]
- Wong, S.Q.; Li, J.; Tan, A.Y.; Vedururu, R.; Pang, J.M.; Do, H.; Ellul, J.; Doig, K.; Bell, A.; MacArthur, G.A.; et al. Sequence artefacts in a prospective series of formalin-fixed tumours tested for mutations in hotspot regions by massively parallel sequencing. BMC Med. Genomics. 2014, 7, 23. [Google Scholar] [CrossRef] [PubMed] [Green Version]


Publisher’s Note: MDPI stays neutral with regard to jurisdictional claims in published maps and institutional affiliations. |
© 2021 by the authors. Licensee MDPI, Basel, Switzerland. This article is an open access article distributed under the terms and conditions of the Creative Commons Attribution (CC BY) license (https://creativecommons.org/licenses/by/4.0/).
Share and Cite
Lin, P.-C.; Yeh, Y.-M.; Hsu, H.-P.; Chan, R.-H.; Lin, B.-W.; Chen, P.-C.; Pan, C.-C.; Hsu, K.-F.; Hsiao, J.-R.; Shan, Y.-S.; et al. Comprehensively Exploring the Mutational Landscape and Patterns of Genomic Evolution in Hypermutated Cancers. Cancers 2021, 13, 4317. https://doi.org/10.3390/cancers13174317
Lin P-C, Yeh Y-M, Hsu H-P, Chan R-H, Lin B-W, Chen P-C, Pan C-C, Hsu K-F, Hsiao J-R, Shan Y-S, et al. Comprehensively Exploring the Mutational Landscape and Patterns of Genomic Evolution in Hypermutated Cancers. Cancers. 2021; 13(17):4317. https://doi.org/10.3390/cancers13174317
Chicago/Turabian StyleLin, Peng-Chan, Yu-Min Yeh, Hui-Ping Hsu, Ren-Hao Chan, Bo-Wen Lin, Po-Chuan Chen, Chien-Chang Pan, Keng-Fu Hsu, Jenn-Ren Hsiao, Yan-Shen Shan, and et al. 2021. "Comprehensively Exploring the Mutational Landscape and Patterns of Genomic Evolution in Hypermutated Cancers" Cancers 13, no. 17: 4317. https://doi.org/10.3390/cancers13174317
APA StyleLin, P.-C., Yeh, Y.-M., Hsu, H.-P., Chan, R.-H., Lin, B.-W., Chen, P.-C., Pan, C.-C., Hsu, K.-F., Hsiao, J.-R., Shan, Y.-S., & Shen, M.-R. (2021). Comprehensively Exploring the Mutational Landscape and Patterns of Genomic Evolution in Hypermutated Cancers. Cancers, 13(17), 4317. https://doi.org/10.3390/cancers13174317