
Integrating Serum Biomarkers into Prediction Models for Biochemical Recurrence Following Radical Prostatectomy

 , , , and
Abstract
:Simple Summary
Abstract
1. Introduction
2. Patients and Methods
2.1. Patient Population and Sample Collection
2.2. Biomarker Measurements
2.3. Statistical Method
3. Results
4. Discussion
5. Conclusions
Supplementary Materials
Author Contributions
Funding
Institutional Review Board Statement
Informed Consent Statement
Data Availability Statement
Acknowledgments
Conflicts of Interest
References
- Tourinho-Barbosa, R.; Srougi, V.; Nunes-Silva, I.; Baghdadi, M.; Rembeyo, G.; Eiffel, S.S.; Barret, E.; Rozet, F.; Galiano, M.; Cathelineau, X.; et al. Biochemical recurrence after radical prostatectomy: What does it mean? Int. Braz. J. Urol. 2018, 44, 14–21. [Google Scholar] [CrossRef] [Green Version]
- Carneiro, A.; Priante Kayano, P.; Gomes Barbosa, Á.R.; Langer Wroclawski, M.; Ko Chen, C.; Cavlini, G.C.; Reche, G.J.; Sanchez-Salas, R.; Tobias-Machado, M.; Sowalsky, A.G.; et al. Are localized prostate cancer biomarkers useful in the clinical practice? Tumor Biol. 2018, 40. [Google Scholar] [CrossRef] [Green Version]
- Murphy, L.; Prencipe, M.; Gallagher, W.M.; Watson, R.W. Commercialized biomarkers: New horizons in prostate cancer diagnostics. Expert Rev. Mol. Diagn. 2015, 15, 491–503. [Google Scholar] [CrossRef] [Green Version]
- Svatek, R.S.; Jeldres, C.; Karakiewicz, P.I.; Suardi, N.; Walz, J.; Roehrborn, C.G.; Montorsi, F.; Slawin, K.M.; Shariat, S.F. Pre-treatment biomarker levels improve the accuracy of post-prostatectomy nomogram for prediction of biochemical recurrence. Prostate 2009, 69, 886–894. [Google Scholar] [CrossRef]
- Cox, D.R. Regression models and life-tables. J. R. Stat. Soc. Ser. B Methodol. 1972, 34, 187–202. [Google Scholar] [CrossRef]
- Boyce, S.; Fan, Y.; Watson, R.W.; Murphy, T.B. Evaluation of prediction models for the staging of prostate cancer. BMC Med Inform. Decis. Mak. 2013, 13, 126. [Google Scholar] [CrossRef]
- Cai, Q.; Dozmorov, M.; Oh, Y. IGFBP-3/IGFBP-3 receptor system as an anti-tumor and anti-metastatic signaling in cancer. Cells 2020, 9, 1261. [Google Scholar] [CrossRef]
- Honda, K.; Kobayashi, M.; Okusaka, T.; Rinaudo, J.A.; Huang, Y.; Marsh, T.; Sanada, M.; Sasajima, Y.; Nakamori, S.; Shimahara, M.; et al. Plasma biomarker for detection of early stage pancreatic cancer and risk factors for pancreatic malignancy using antibodies for apolipoprotein-AII isoforms. Sci. Rep. 2015, 5, 1–5. [Google Scholar] [CrossRef]
- Malik, G.; Ward, M.D.; Gupta, S.K.; Trosset, M.W.; Grizzle, W.E.; Adam, B.L.; Diaz, J.I.; Semmes, O.J. Serum levels of an isoform of apolipoprotein A-II as a potential marker for prostate cancer. Clin. Cancer Res. 2005, 11, 1073–1085. [Google Scholar]
- Cheah, M.T.; Chen, J.Y.; Sahoo, D.; Contreras-Trujillo, H.; Volkmer, A.K.; Scheeren, F.A.; Volkmer, J.P.; Weissman, I.L. CD14-expressing cancer cells establish the inflammatory and proliferative tumor microenvironment in bladder cancer. Proc. Natl. Acad. Sci. USA 2015, 112, 4725–4730. [Google Scholar] [CrossRef] [Green Version]
- Zhang, Q.; Shan, Y. Genetic polymorphisms of vitamin D receptor and the risk of prostate cancer: A meta-analysis. J. BUON 2013, 18, 961–969. [Google Scholar]
- Katafigiotis, I.; Tyritzis, S.I.; Stravodimos, K.G.; Alamanis, C.; Pavlakis, K.; Vlahou, A.; Makridakis, M.; Katafigioti, A.; Garbis, S.D.; Constantinides, C.A. Zinc α2-glycoprotein as a potential novel urine biomarker for the early diagnosis of prostate cancer. BJU Int. 2012, 110, E688–E693. [Google Scholar] [CrossRef] [PubMed]
- Chavan, S.S.; Hudson, L.K.; Li, J.H.; Ochani, M.; Harris, Y.; Patel, N.B.; Katz, D.; Scheinerman, J.A.; Pavlov, V.A.; Tracey, K.J. Identification of Pigment Epithelium-Derived Factor as an adipocyte-derived inflammatory factor. Mol. Med. 2020, 18, 1161–1168. [Google Scholar] [CrossRef] [PubMed]
- Nelius, T.; Samathanam, C.; Martinez-Marin, D.; Gaines, N.; Stevens, J.; Hickson, J.; de Riese, W.; Filleur, S. Positive correlation between PEDF expression levels and macrophage density in the human prostate. Prostate 2013, 73, 549–561. [Google Scholar] [CrossRef] [Green Version]
- Shimura, S.; Yang, G.; Ebara, S.; Wheeler, T.M.; Frolov, A.; Thompson, T.C. Reduced infiltration of tumor-associated macrophages in human prostate cancer: Association with cancer progression. Cancer Res. 2000, 60, 5857–5861. [Google Scholar]
- Steyerberg, E.W.; Harrell, F.E. Prediction models need appropriate internal, internal–external, and external validation. J. Clin. Epidemiol. 2016, 69, 245–247. [Google Scholar] [CrossRef] [PubMed] [Green Version]
- Stephenson, A.J.; Kattan, M.W.; Eastham, J.A.; Dotan, Z.A.; Bianco, F.J., Jr.; Lilja, H.; Scardino, P.T. Defining biochemical recurrence of prostate cancer after radical prostatectomy: A proposal for a standardized definition. J. Clin. Oncol. 2006, 24, 3973–3978. [Google Scholar] [CrossRef]
- Oon, S.F.; Fanning, D.M.; Fan, Y.; Boyce, S.; Murphy, T.B.; Fitzpatrick, J.M.; Watson, R.W. The identification and internal validation of a preoperative serum biomarker panel to determine extracapsular extension in patients with prostate cancer. Prostate 2012, 72, 1523–1531. [Google Scholar] [CrossRef]
- R Core Team. R: A Language and Environment for Statistical Computing; R Foundation for Statistical Computing: Vienna, Austria, 2013; Available online: http://www.R-project.org/ (accessed on 3 April 2013).
- Vickers, A.J.; Elkin, E.B. Decision curve analysis: A novel method for evaluating prediction models. Med. Decis. Making. 2006, 26, 565–574. [Google Scholar] [CrossRef] [Green Version]
- DeLong, E.R.; DeLong, D.M.; Clarke-Pearson, D.L. Comparing the areas under two or more correlated receiver operating characteristic curves: A nonparametric approach. Biometrics 1988, 837–845. [Google Scholar] [CrossRef]
- D’Agostino, R.B.; Nam, B.H. Evaluation of the performance of survival analysis models: Discrimination and calibration measures. Handb. Stat. 2003, 23, 1–25. [Google Scholar]
- Harrell, F.E., Jr. rms: Regression Modeling Strategies. R Package Version 5.1–2. 2018. Available online: https://CRAN.R-project.org/package=rms (accessed on 7 January 2018).
- Royston, P.; Altman, D.G. External validation of a Cox prognostic model: Principles and methods. BMC Med. Res. Methodol. 2013, 13, 33. [Google Scholar] [CrossRef] [Green Version]
- Kuhn, M. Building predictive models in R using the caret package. J. Stat. Softw. 2008, 28, 1–26. [Google Scholar] [CrossRef] [Green Version]
- Berge, V.; Berg, R.E.; Hoff, J.R.; Wessel, N.; Svindland, A.; Karlsen, S.J.; Eri, L.M. Five-year progression-free survival in 577 patients operated on with laparoscopic radical prostatectomy for localized prostate cancer. Scand. J. Urol. Nephrol. 2012, 46, 8–13. [Google Scholar] [CrossRef]
- Jalali, A.; Foley, R.W.; Maweni, R.M.; Murphy, K.; Lundon, D.J.; Lynch, T.; Power, R.; O’Brien, F.; O’Malley, K.J.; Galvin, D.J.; et al. A risk calculator to inform the need for a prostate biopsy: A rapid access clinic cohort. BMC Med. Inform. Decis. Making. 2020, 20, 148. [Google Scholar] [CrossRef] [PubMed]
- Mohler, J.L.; Armstrong, A.J.; Bahnson, R.R.; D’Amico, A.V.; Davis, B.J.; Eastham, J.A.; Enke, C.A.; Farrington, T.A.; Higano, C.S.; Horwitz, E.M.; et al. Prostate cancer, version 1.2016. J. Natl. Compr. Cancer Network. 2016, 14, 19–30. [Google Scholar] [CrossRef] [PubMed] [Green Version]
- Moghaddam, S.; Murphy, L.; Reilly, A.M.; Heffernan, Á.; Lynch, T.; Power, R.; O’Malley, J.K.; Taskèn, K.A.; Berge, V.; Solhaug, V.; et al. Logistic Regression Models to Predict Biochemical Reoccurrence in Prostate Cancer Patients. In Proceedings of the 39th Conference on Applied Statistics, Dublin, Ireland, 15–17 May 2019. [Google Scholar]
- Lin, D.W.; Crawford, E.D.; Keane, T.; Evans, B.; Reid, J.; Rajamani, S.; Brown, K.; Gutin, A.; Tward, J.; Scardino, P.; et al. Identification of men with low-risk biopsy-confirmed prostate cancer as candidates for active surveillance. Urol. Oncol. 2018, 36, 310.e7–310.e13. [Google Scholar] [CrossRef] [PubMed]
- Connell, S.P.; Yazbek-Hanna, M.; McCarthy, F.; Hurst, R.; Webb, M.; Curley, H.; Walker, H.; Mills, R.; Ball, R.Y.; Sanda, M.G.; et al. A four-group urine risk classifier for predicting outcomes in patients with prostate cancer. BJU Int. 2019, 124, 609–620. [Google Scholar] [CrossRef] [PubMed] [Green Version]
- Klocker, H.; Golding, B.; Weber, S.; Steiner, E.; Tennstedt, P.; Keller, T.; Schiess, R.; Gillessen, S.; Horninger, W.; Steuber, T. Development and validation of a novel multivariate risk score to guide biopsy decision for the diagnosis of clinically significant prostate cancer. BJUI Compass. 2020, 1, 15–20. [Google Scholar] [CrossRef]
- Murphy, K.; Murphy, B.T.; Boyce, S.; Flynn, L.; Gilgunn, S.; O’Rourke, C.J.; Rooney, C.; Stöckmann, H.; Walsh, A.L.; Finn, S.; et al. Integrating biomarkers across omic platforms: An approach to improve stratification of patients with indolent and aggressive prostate cancer. Mol. Oncol. 2018, 12, 1513–1525. [Google Scholar] [CrossRef] [Green Version]
- Foley, R.W.; Gorman, L.; Sharifi, N.; Murphy, K.; Moore, H.; Tuzova, A.V.; Perry, A.S.; Murphy, T.B.; Lundon, D.J.; Watson, R.W.G. Improving multivariable prostate cancer risk assessment using the Prostate Health Index. BJU Int. 2016, 117, 409–417. [Google Scholar] [CrossRef] [Green Version]
- Jalali, A.; Kitching, M.; Martin, K.; Richardson, C.; Murphy, T.B.; FitzGerald, S.P.; Watson, R.W.; Perry, A.S. Integrating inflammatory serum biomarkers into a risk calculator for prostate cancer detection. Sci. Reports. 2021, 11, 1–8. [Google Scholar]
- Filleur, S.; Nelius, T.I.; De Riese, W.; Kennedy, R.C. Characterization of PEDF: A multi-functional serpin family protein. J. Cell. Biochem. 2009, 106, 769–775. [Google Scholar] [CrossRef]
- Doll, J.A.; Stellmach, V.M.; Bouck, N.P.; Bergh, A.R.; Lee, C.; Abramson, L.P.; Cornwell, M.L.; Pins, M.R.; Borensztajn, J.; Crawford, S.E. Pigment epithelium–derived factor regulates the vasculature and mass of the prostate and pancreas. Nat. Med. 2003, 9, 774–780. [Google Scholar] [CrossRef]
- Halin, S.; Wikström, P.; Rudolfsson, S.H.; Stattin, P.; Doll, J.A.; Crawford, S.E.; Bergh, A. Decreased pigment epithelium-derived factor is associated with metastatic phenotype in human and rat prostate tumors. Cancer Res. 2004, 64, 5664–5671. [Google Scholar] [CrossRef] [PubMed] [Green Version]
- Becerra, S.P.; Notario, V. The effects of PEDF on cancer biology: Mechanisms of action and therapeutic potential. Nat. Rev. Cancer. 2013, 13, 258–271. [Google Scholar] [CrossRef] [Green Version]
- Vickers, A.J.; van Calster, B.; Steyerberg, E.W. A simple, step-by-step guide to interpreting decision curve analysis. Diagn. Progn. Res. 2019, 3, 1–8. [Google Scholar] [CrossRef] [PubMed]


| Features | Irish | Austrian | Norwegian | p-Value b |
|---|---|---|---|---|
| Sample size (n = 577) | 271 | 128 | 178 | |
| Pre-op | ||||
| PSA | <0.001 | |||
| Mean (SD) | 8.36 (4.74) | 5.77 (4.73) | 11.3 (7.25) | |
| DRE | <0.001 | |||
| Normal | 198 (73%) | 107 (84%) | 165 (93%) | |
| Abnormal | 73 (27%) | 21 (16%) | 13 (7%) | |
| Biopsy Gleason Score | <0.001 | |||
| 6 | 132 (49%) | 73 (55%) | 56 (31%) | |
| 7 | 98 (36%) | 47 (35%) | 76 (43%) | |
| 8 and above | 42 (15%) | 13 (10%) | 46 (26%) | |
| Post-op | ||||
| Gleason Score | <0.001 | |||
| 6 | 92 (34%) | 37 (29%) | 60 (34%) | |
| 7 | 135 (51%) | 79 (62%) | 59 (33%) | |
| 8 or above | 40 (15%) | 12 (9%) | 59 (33%) | |
| Stage | 0.13 | |||
| Organ-confined | 155 (57%) | 78 (61%) | 89 (50%) | |
| Non-organ-confined | 116 (43%) | 50 (39%) | 89 (50%) | |
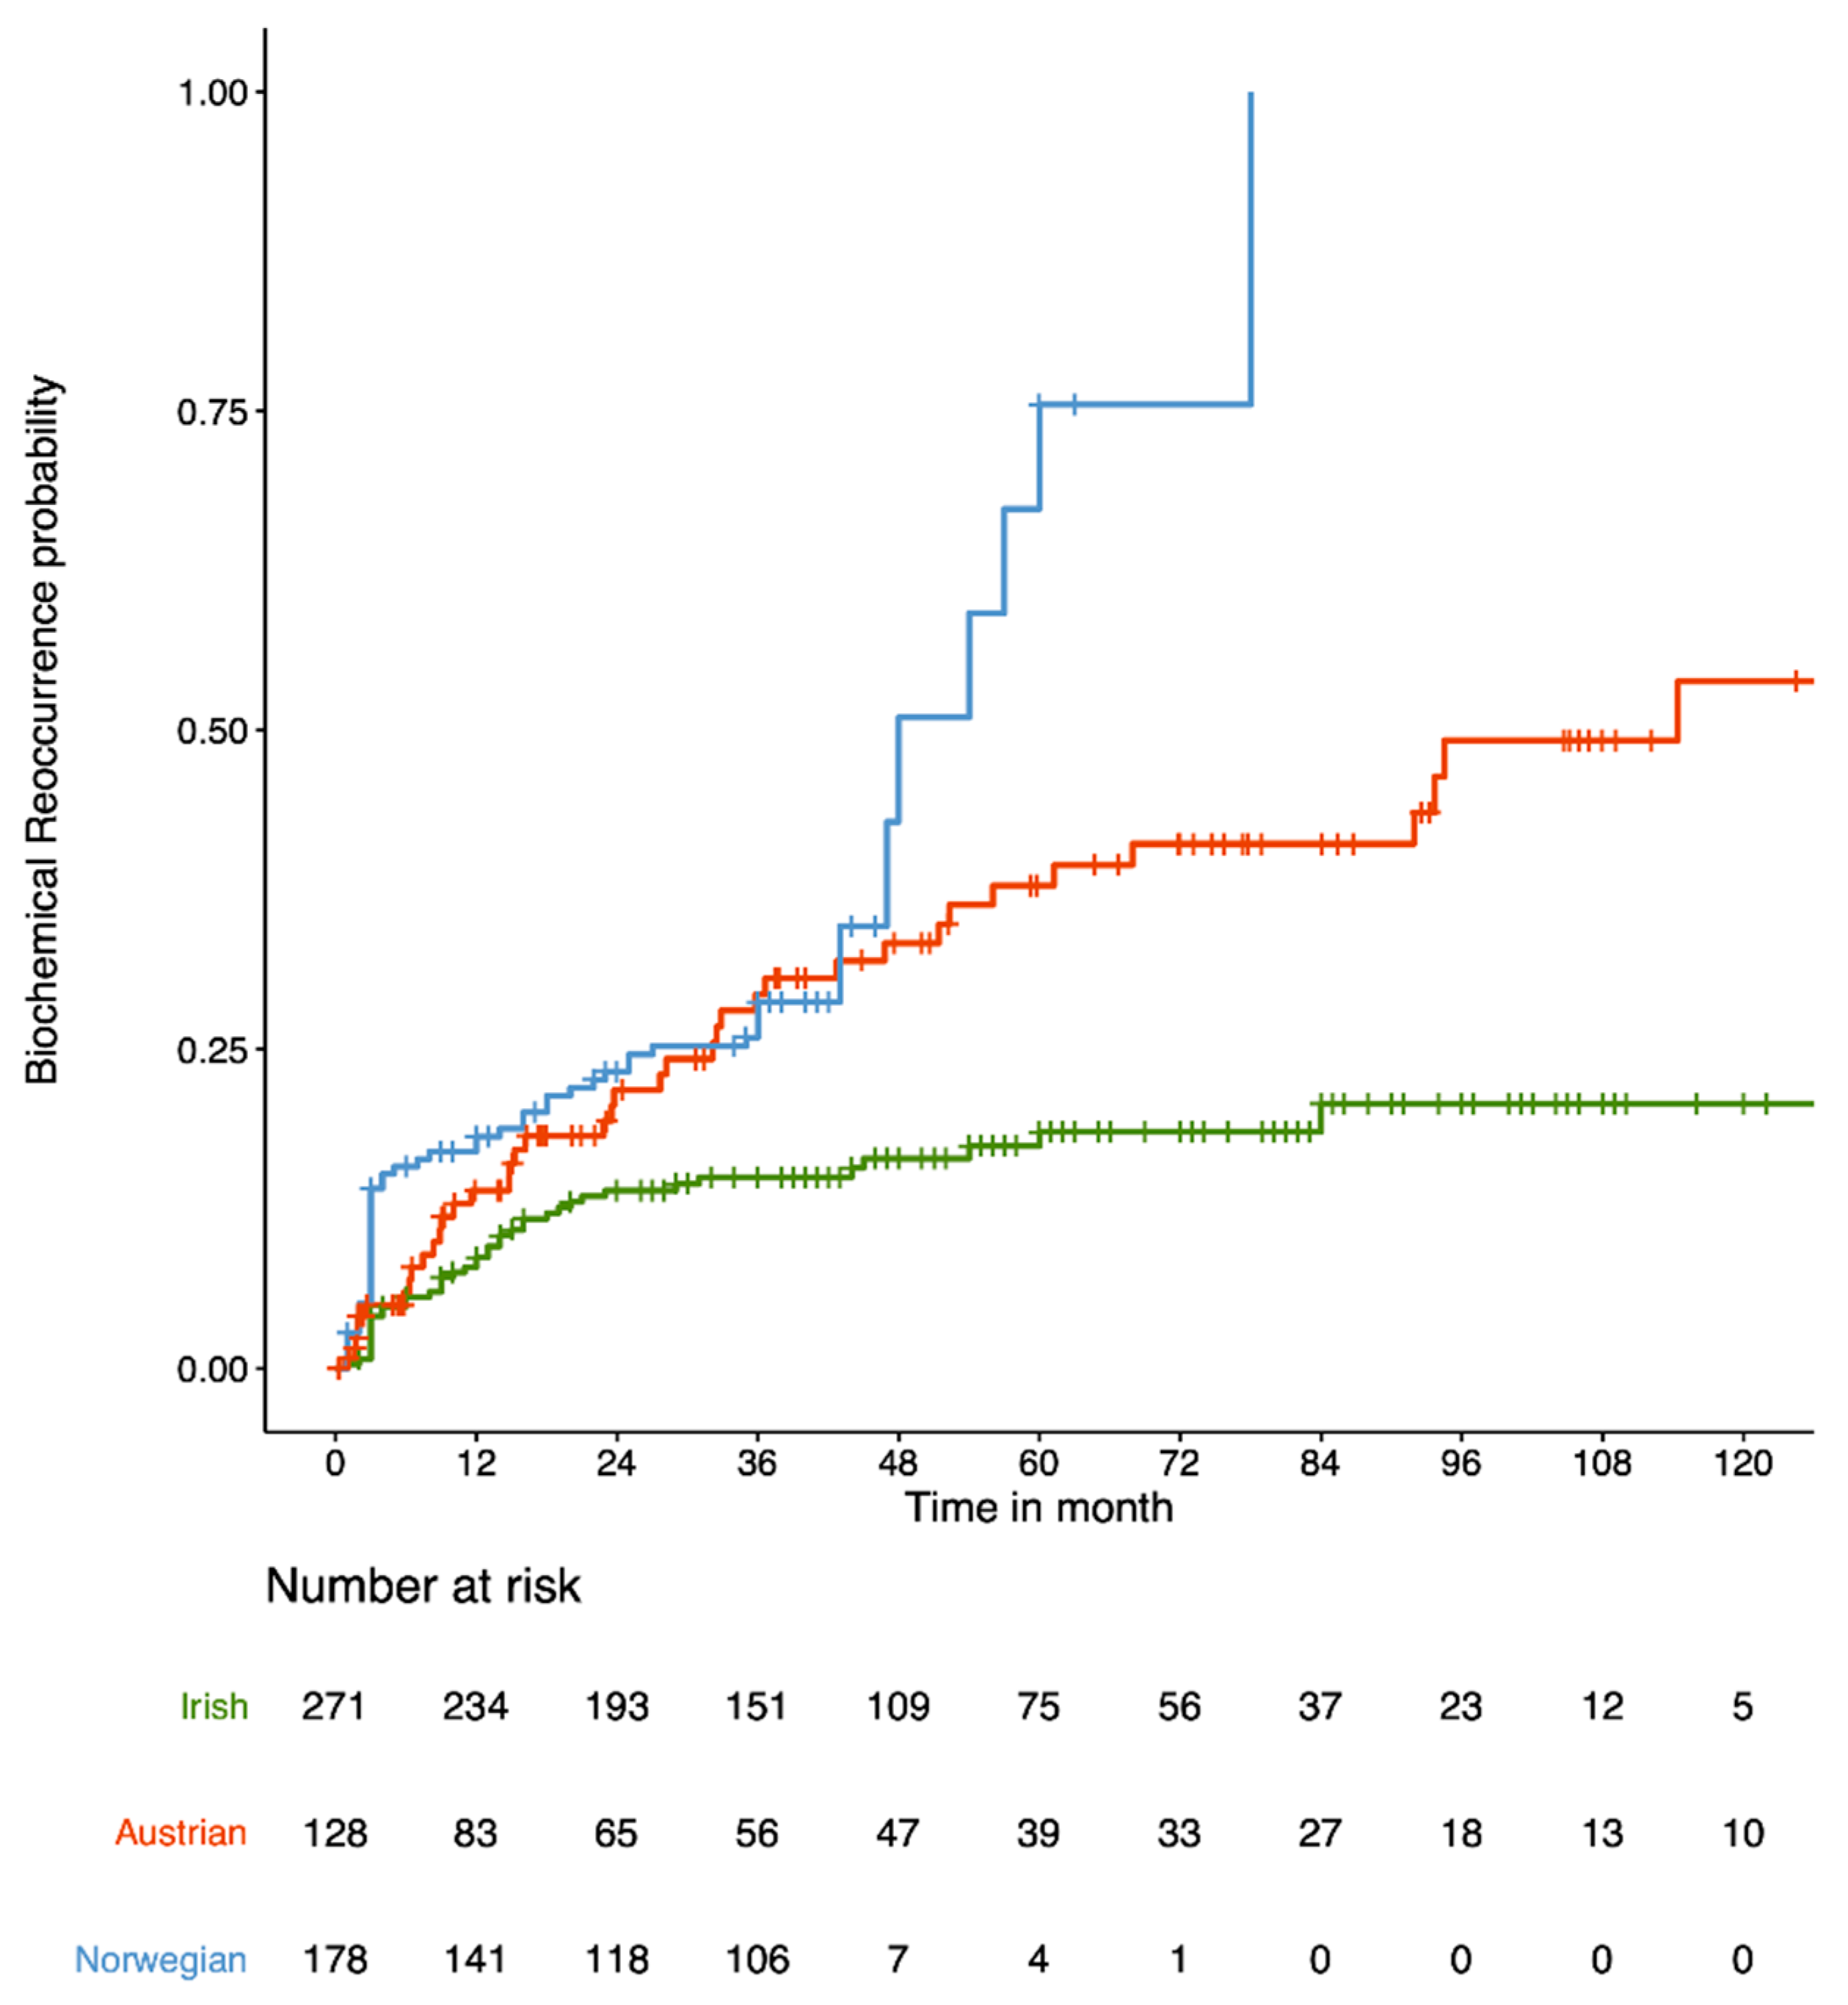
| Time to biochemical recurrence | <0.001 | |||
| <3 years | 15.0% | 29.3% | 28.7% | |
| <5 years | 18.5% | 37.8% | 75.5% |
| Features | NCCNbio | Clinicalbio | ||||
|---|---|---|---|---|---|---|
| Hazard Ratio | 95% CI | p-Value | Hazard Ratio | 95% CI | p-Value | |
| PSA a | - | - | - | 2.628 | (1.45, 4.75) | 0.001 |
| DRE | ||||||
| (Abnormal vs. normal) | - | - | - | 1.227 | (0.62, 2.43) | 0.556 |
| Biopsy Gleason Score | ||||||
| (7 vs. 6) | - | - | - | 1.516 | (0.73, 3.15) | 0.265 |
| (8 or above vs 6) | - | - | - | 2.99 | (1.35, 6.65) | 0.007 |
| NCCN | ||||||
| (Intermediate vs. low) | 1.808 | (0.72, 4.54) | 0.207 | - | - | - |
| (High vs. low) | 3.135 | (1.33, 7.39) | 0.009 | - | - | - |
| CD14 (100,000 pg/mL) | 1.02 | (0.99, 1.05) | 0.1 | - | - | - |
| PEDF (100,000 pg/mL) | 0.831 | (0.70, 0.98) | 0.03 | 0.801 | (0.68, 0.95) | 0.009 |
| Models | (A) Internal Validation | (B) External Validation | ||
|---|---|---|---|---|
| AUC at 3-Year (Irish Cohort) | AUC at 5-Year (Irish Cohort) | AUC at 3-Year (Austrian Cohort) | AUC at 3-Year (Norwegian Cohort) | |
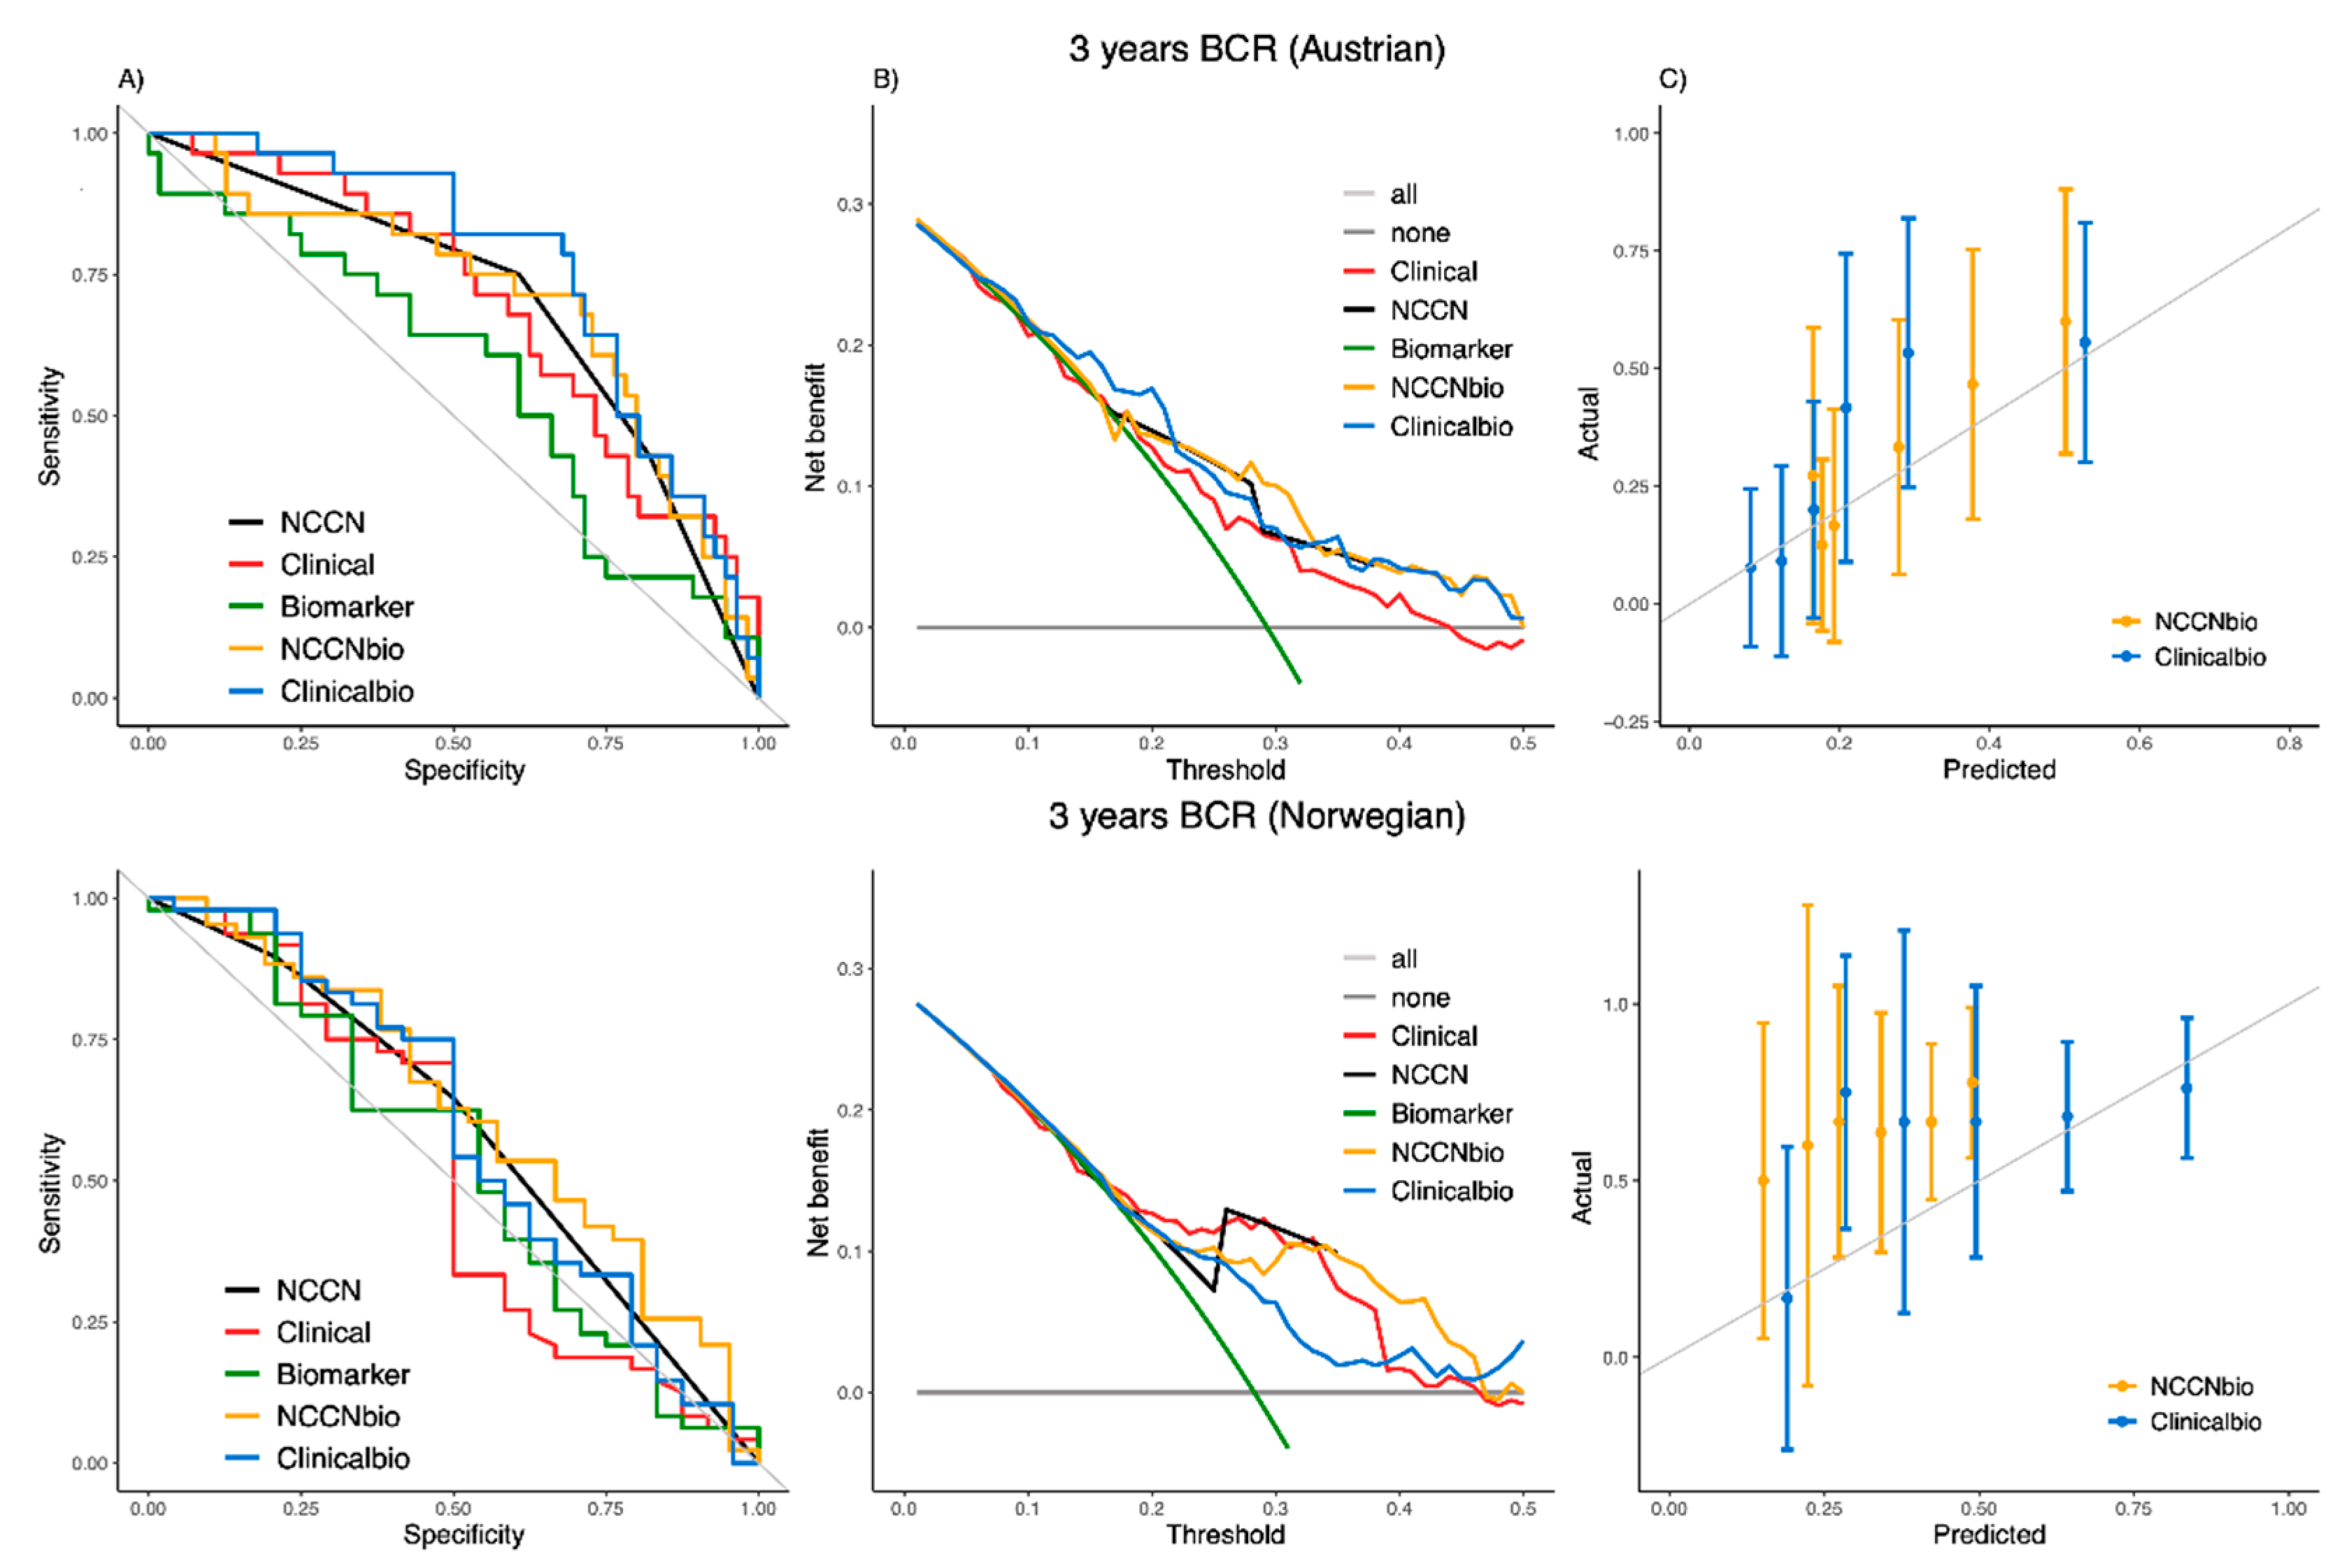
| NCCN | 0.5335 | 0.5424 | 0.6958 | 0.5838 |
| Clinical | 0.6377 | 0.6777 | 0.6971 | 0.5174 |
| Biomarker | 0.5928 | 0.6236 | 0.5702 | 0.5330 |
| NCCNbio | 0.7058; p-value (vs. NCCN) < 0.001 a | 0.6968; p-value (vs. NCCN) = 0.002 a | 0.7065; p-value (vs. NCCN) = 0.901 a | 0.6224; p-value (vs. NCCN) = 0.701 a |
| Clinicalbio | 0.7076; p-value (vs. Clinical) = 0.024 a | 0.7531; p-value (vs. Clinical) = 0.032 a | 0.7659; p-value (vs. Clinical) = 0.034 a | 0.5877; p-value (vs. Clinical) = 0.042 a |
Publisher’s Note: MDPI stays neutral with regard to jurisdictional claims in published maps and institutional affiliations. |
© 2021 by the authors. Licensee MDPI, Basel, Switzerland. This article is an open access article distributed under the terms and conditions of the Creative Commons Attribution (CC BY) license (https://creativecommons.org/licenses/by/4.0/).
Share and Cite
Moghaddam, S.; Jalali, A.; O’Neill, A.; Murphy, L.; Gorman, L.; Reilly, A.-M.; Heffernan, Á.; Lynch, T.; Power, R.; O’Malley, K.J.; et al. Integrating Serum Biomarkers into Prediction Models for Biochemical Recurrence Following Radical Prostatectomy. Cancers 2021, 13, 4162. https://doi.org/10.3390/cancers13164162
Moghaddam S, Jalali A, O’Neill A, Murphy L, Gorman L, Reilly A-M, Heffernan Á, Lynch T, Power R, O’Malley KJ, et al. Integrating Serum Biomarkers into Prediction Models for Biochemical Recurrence Following Radical Prostatectomy. Cancers. 2021; 13(16):4162. https://doi.org/10.3390/cancers13164162
Chicago/Turabian StyleMoghaddam, Shirin, Amirhossein Jalali, Amanda O’Neill, Lisa Murphy, Laura Gorman, Anne-Marie Reilly, Áine Heffernan, Thomas Lynch, Richard Power, Kieran J. O’Malley, and et al. 2021. "Integrating Serum Biomarkers into Prediction Models for Biochemical Recurrence Following Radical Prostatectomy" Cancers 13, no. 16: 4162. https://doi.org/10.3390/cancers13164162
APA StyleMoghaddam, S., Jalali, A., O’Neill, A., Murphy, L., Gorman, L., Reilly, A.-M., Heffernan, Á., Lynch, T., Power, R., O’Malley, K. J., Taskèn, K. A., Berge, V., Solhaug, V.-A., Klocker, H., Murphy, T. B., & Watson, R. W. (2021). Integrating Serum Biomarkers into Prediction Models for Biochemical Recurrence Following Radical Prostatectomy. Cancers, 13(16), 4162. https://doi.org/10.3390/cancers13164162