Article

Quantitative Assessment and Prognostic Associations of the Immune Landscape in Ovarian Clear Cell Carcinoma

by
Saira Khalique
1,†,
Sarah Nash
1,†,
David Mansfield
2,
Julian Wampfler
3,
Ayoma Attygale
3,4,
Katherine Vroobel
3,4,
Harriet Kemp
1,
Richard Buus
1,
Hannah Cottom
1,
Ioannis Roxanis
1,
Thomas Jones
5,
Katharina von Loga
6,
Dipa Begum
6,
Naomi Guppy
1,
Pradeep Ramagiri
7,
Kerry Fenwick
7,
Nik Matthews
7,
Michael J. F. Hubank
5,
Christopher J. Lord
1,8,
Syed Haider
1,
Alan Melcher
2,
Susana Banerjee
3,9,* and
Rachael Natrajan
1,*
add Show full author list remove Hide full author list
1
Division of Brest Cancer, The Breast Cancer Now Toby Robins Research Centre, The Institute of Cancer Research, London SW3 6JB, UK
2
Division of Radiotherapy and Imaging, The Institute of Cancer Research, London SW3 6JB, UK
3
Gynaecology Unit, The Royal Marsden NHS Foundation Trust, London SW3 6JJ, UK
4
Department of Histopathology, The Royal Marsden NHS Foundation Trust, London SW3 6JJ, UK
5
Division of Molecular Pathology, The Institute of Cancer Research, London SM2 5NG, UK
6
Biomedical Research Centre, The Royal Marsden NHS Foundation Trust, London SM2 5PT, UK
7
Tumour Profiling Unit, The Institute of Cancer Research, London SW3 6JB, UK
8
The CRUK Gene Function Laboratory, The Institute of Cancer Research, London SW3 6JB, UK
9
Division of Clinical Studies, The Institute of Cancer Research, London SM2 5NG, UK
*
Authors to whom correspondence should be addressed.
These authors contributed equally to the study.
Cancers 2021, 13(15), 3854; https://doi.org/10.3390/cancers13153854
Submission received: 1 July 2021 / Revised: 22 July 2021 / Accepted: 27 July 2021 / Published: 30 July 2021

Abstract

:

Simple Summary

Ovarian clear cell carcinoma (OCCC) is a rare subtype of epithelial ovarian cancer that has a poor response to chemotherapy. Here, we assessed the immunological features of a series of 33 OCCCs and identified an immune-related gene expression signature that correlated with a patient’s risk of recurrence. Additionally, using multiplex immunofluorescence, we assessed the spatial distribution and abundance of immune cell populations at the protein level and identified that tumour-associated macrophages (TAM) and regulatory T cells are excluded from the vicinity of tumour cells in low-risk patients, suggesting that high-risk patients have a more immunosuppressive microenvironment. We also found that TAMs and cytotoxic T cells were also excluded from the vicinity of tumour cells in ARID1A mutated OCCCs, suggesting that the exclusion of these immune effectors could determine the host response in ARID1A mutant OCCCs.

Abstract

Ovarian clear cell carcinoma (OCCC) is a rare subtype of epithelial ovarian cancer characterised by a high frequency of loss-of-function ARID1A mutations and a poor response to chemotherapy. Despite their generally low mutational burden, an intratumoural T cell response has been reported in a subset of OCCC, with ARID1A purported to be a biomarker for the response to the immune checkpoint blockade independent of micro-satellite instability (MSI). However, assessment of the different immune cell types and spatial distribution specifically within OCCC patients has not been described to date. Here, we characterised the immune landscape of OCCC by profiling a cohort of 33 microsatellite stable OCCCs at the genomic, gene expression and histological level using targeted sequencing, gene expression profiling using the NanoString targeted immune panel, and multiplex immunofluorescence to assess the spatial distribution and abundance of immune cell populations at the protein level. Analysis of these tumours and subsequent independent validation identified an immune-related gene expression signature associated with risk of recurrence of OCCC. Whilst histological quantification of tumour-infiltrating lymphocytes (TIL, Salgado scoring) showed no association with the risk of recurrence or ARID1A mutational status, the characterisation of TILs via multiplexed immunofluorescence identified spatial differences in immunosuppressive cell populations in OCCC. Tumour-associated macrophages (TAM) and regulatory T cells were excluded from the vicinity of tumour cells in low-risk patients, suggesting that high-risk patients have a more immunosuppressive microenvironment. We also found that TAMs and cytotoxic T cells were also excluded from the vicinity of tumour cells in ARID1A-mutated OCCCs compared to ARID1A wild-type tumours, suggesting that the exclusion of these immune effectors could determine the host response of ARID1A-mutant OCCCs to therapy. Overall, our study has provided new insights into the immune landscape and prognostic associations in OCCC and suggest that tailored immunotherapeutic approaches may be warranted for different subgroups of OCCC patients.

1. Introduction

Ovarian clear cell carcinoma (OCCC) is a rare aggressive subtype of epithelial ovarian carcinoma (EOC), characterised by a distinct repertoire of clinical, histological and molecular features [1,2,3]. With the exception of early-stage disease, OCCC is associated with the poorest stage-adjusted prognosis when compared to other EOC subtypes and shows relative resistance to chemotherapy [4,5]. Thus, there is a clear unmet clinical need to identify additional treatment for those OCCC patients that show poor responses to chemotherapy, and identification of biomarkers for OCCC patient stratification.
OCCCs harbor high frequencies of ARID1A (AT rich interactive domain 1A) loss of function mutations [1,3], which lead to an aberrant cell cycle and loss of proliferation control [6,7,8], and are associated with endometriosis [3]. A number of studies have highlighted potential synthetic-lethal treatment strategies targeting tumours with loss of ARID1A [9,10,11,12,13,14,15,16,17,18,19]. There is emerging evidence that OCCC may respond to an immune checkpoint blockade. In the KEYNOTE−100 phase II clinical trial, patients with advanced recurrent OCCC had a 15.8% overall response rate to pembrolizumab, compared to 8.5% in unselected recurrent ovarian cancers [20]. Similarly, a smaller phase II clinical trial assessing the combination of nivolumab and ipilimumab induction followed by nivolumab maintenance showed a higher response rate and longer progression-free survival (PFS) when compared with nivolumab alone in platinum-resistant OCCC patients [21].
Mis-match deficient (MMR) microsatellite instability (MSI)-high OCCCs have been shown to harbor significantly higher CD8+ tumour-infiltrating lymphocytes (TILs), higher CD8 +/CD4 + ratios and higher PD1+ TILs compared to microsatellite-stable (MSS) OCCCs [22], and although MMR deficiency is only seen in around 10% of OCCC, some degree of tumoural and stromal PD-L1 expression has been reported in around 74% of OCCC [23], suggesting that additional subsets of OCCC show immunogenicity [20]. Notably, in the KEYNOTE−100 ovarian cancer trial, there was a trend towards improved response rates of OCCC to the checkpoint inhibitor pembrolizumab [20]. Indeed, a subgroup of OCCC with a relatively higher rate of gene mutations in the SWI/SNF complex have been shown to show an enrichment of immune-related pathway activity and poorer prognosis [24]. ARID1A deficiency is related to a mismatch repair-deficient phenotype with ARID1A mutant tumours showing an increase in TILs, activation of the immune checkpoint and sensitization to the PD-L1 checkpoint blockade in ovarian cancer in in vivo mouse models compared to ARID1A wild-type tumours [18]. This mechanism is thought to occur via MSH2 recruitment to the chromatin by ARID1A during DNA replication and mismatch DNA repair [18]. Whilst pan-histological clinical studies have highlighted a significant treatment benefit for patients with ARID1A-deficient tumours when treated with (PD-1)/PD-L1 immunotherapy [25], their response rate specifically in OCCC-specific trials, such as PEACOCC (NCT03425565) testing pembrolizumab in patients with advanced gynaecological clear cell cancer, has not been reported to date. Furthermore, the characterisation of immune cell types and spatial distribution within OCCC patients has not been comprehensively explored.
Here, we sought to comprehensively characterise the immune repertoire of OCCCs at the RNA and protein level alongside histological assessment of TILs within the immune microenvironment using multiplex immunofluorescence on tissue sections in order to identify subgroups of OCCC that may potentially benefit from immune checkpoint blockade.

2. Materials and Methods

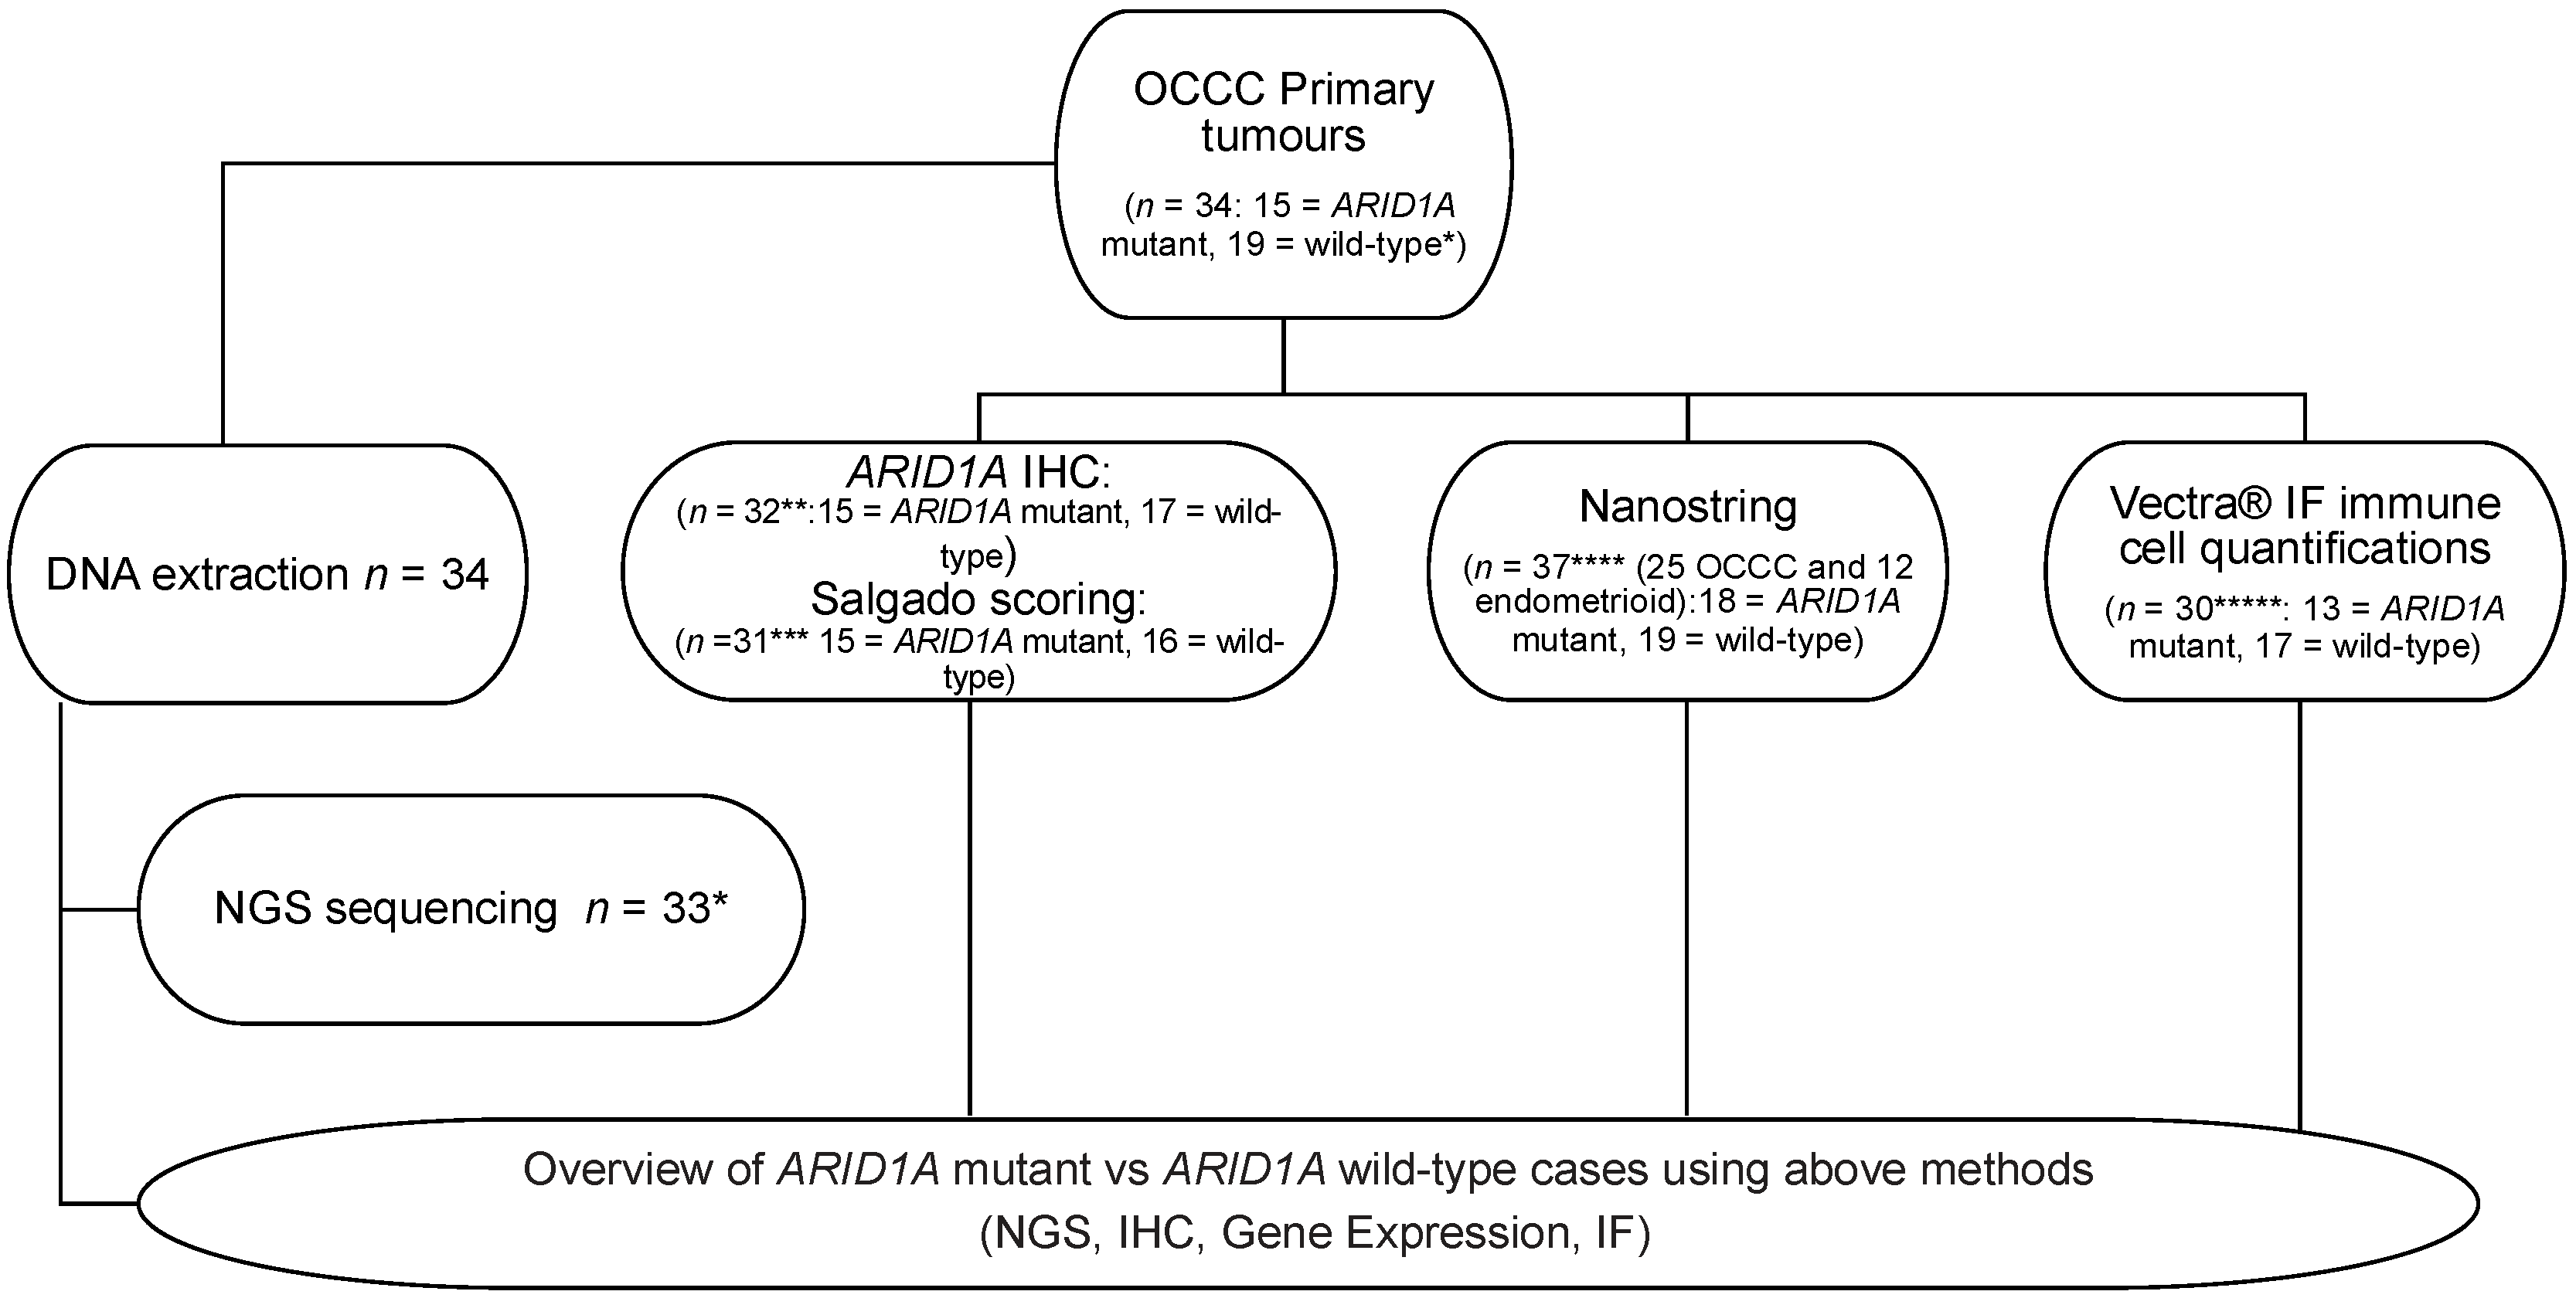
2.1. Clinical Samples

A retrospective series of primary untreated OCCC tumours (n = 34) and OCCC-like primary tumours (EAE n = 4; EAO n = 8) were obtained with appropriate ethical approval under the Royal Marsden Hospital (RMH) NHS Foundation Trust sponsored study (ID: CCR3705): “Analysis of tumour specimens for biomarkers in gynaecological cancers” (Table 1 and Supplementary Table S1). All patients provided written consent for the use of material for research purposes. Appropriate representative formalin-fixed paraffin-wax embedded (FFPE) tissue blocks were chosen based upon their histology reports. Haematoxylin and eosin (H&E) sections of each case were reviewed by two independent consultant histopathologists in order to confirm the percentage of tumour content. For each case, if a germline blood sample was unavailable, non-malignant FFPE blocks were selected and sections cut for DNA extraction. Microsatellite status was assessed by immunohistochemistry of mismatch repair (MMR) proteins MSH2, MSH6, PMS2 and MLH1 during routine clinical testing, or by PCR using fluorescent PCR-based microsatellite loci (MSI Analysis System, Version 1.2, Promega, Madison, WI, USA).

2.2. DNA Extraction and Library Preparation

Genomic DNA was extracted from FFPE tissue sections using the QIAamp FFPE Tissue Kit (Qiagen, Manchester, UK) based upon the manufacturer’s protocols for both tumour and non-malignant content. The extraction of genomic DNA from blood samples was completed using the QIAamp Blood mini kit (manual) or QIAsymphony DNA Midi Kit (automated) (Qiagen) using the manufacturer’s protocols. The quality of the extracted DNA was analysed using the Agilent 2200 Tapestation (Agilent, Stockport, UK) and the Qubit Fluorometer (Fisher Scientific, Loughborough, UK). Both DNA extraction and next generation sequencing (NGS) were completed at Good Clinical Laboratory Practice (GCLP)-accredited laboratories.

2.3. Targeted Sequencing

In order to identify common mutations in OCCC, a 59-gene targeted capture panel (originally established to target 59 genes for the FOrMAT clinical trial (Feasibility of Molecular Characterization Approach to Treatment, CCR3994, Royal Marsden NHS Hospital, Foundation Trust) (Nimblegen, Roche, Welwyn Garden City, UK)) was applied as previously described [26]. Detailed methodology regarding preparation and variant calling has been previously described [26] (Supplementary Table S2). Raw targeted sequencing data is deposited in the NCBI Sequence Read Archive under the accession PRJNA432413 and PRJNA432343.

2.4. ARID1A Immunohistochemistry

Immunohistochemistry (IHC) was performed on 3–4 μm thick whole tissue sections along with H&Es for each specimen with assistance from the Breast Cancer Now Histopathology Core Facility and the Royal Marsden NHS Foundation Trust Diagnostic Laboratory. Slides were incubated with anti-ARID1A, rabbit monoclonal antibody (1:1000) and EPR13501 (Abcam, Cambridge, UK), using the Dako-Autostainer Link 48 with the EnVision FLEX kit according to the manufacturer’s instructions (Agilent Technologies, Cheadle, UK). Human breast, tonsil, appendix, prostate and kidney tissues were used as positive controls and xenograft models were obtained as previously described [19]. Stromal cells were used as an internal positive control. Cases were scored by two independent consultant pathologists for ARID1A protein expression using a modified Allred scoring system as previously described [26].

2.5. Histological Quantification of Immune Infiltrate

The extent of lymphocytic infiltration in H&E stained tumour sections was assessed independently by two pathologists. Both were blinded to the ARID1A sequencing and IHC findings. The Salgado scoring system, a standardised methodology originally designed for the quantification of tumour-infiltrating lymphocytes (TILs) in breast cancer, was used [27]. TILs were scored as a percentage of the stromal area alone and areas occupied by carcinoma cells were not included in the total assessed surface area [27]. The mean of the pathologists’ scores was taken to obtain an overall Salgado score for each case.

2.6. NanoString nCounter Profiling with the PanCancer Immune Panel

For discovery, the NanoString nCounter® PanCancer Immune Profiling Panel was used to quantify mRNA abundance in primary OCCC tumours (n = 25), together with endometrioid carcinomas (endometrioid adenocarcinoma of the ovary (EAO) n = 8, and endometrioid adenocarcinoma of the endometrium (EAE) n = 4), given the genomic similarities of these tumour types to OCCC [28,29] and the small number of OCCC in our cohort. The panel targets 730 genes from 14 different immune cell types [30]. The input target amount of RNA was 75–80 ng, adjusted for the degree of fragmentation based upon the percentage of RNA fragments between 50–300 nucleotides of total RNA in the sample. RNA samples were hybridised to capture and reporter probes using a Thermo Cycler for 18–22 h at 65 °C. Once hybridised, probes were bound and aligned to the nCounter Cartridge and counted by the digital analyser. NanoString nCounter data were pre-processed using R package NanoStringNorm* (v1.2.1) [31], and normalised with Limma voom using R package Limma (v3.38.3) [32]. All visualisations were created using custom libraries in R statistical environment (v.3.6.0). NanoString nCounter® gene expression output was normalised across all samples combined (OCCC n = 25, EAE n = 4 and EAO n = 8), using the edgeR package (v3.24.3) [33]. Normalisation factors were calculated using the weighted trimmed mean of M-values (TMM). Batch effects within normalised expression data were calculated and adjusted across NanoString cartridges.

2.7. Differential Gene Expression Analysis

Normalised gene expression counts were used to perform differential gene expression analysis. For each gene of the NanoString nCounter® PanCancer Immune panel (n = 730), differential mRNA abundance analysis was performed using Limma in R statistical environment (v.3.6.0). Genes were considered significantly differentially expressed if satisfying |log2 fold change| > 1 and FDR adjusted p-value < 0.05. A lenient threshold of |log2 fold change| > 1 and p-value < 0.05 was also applied to identify the most statistically differentially expression genes if no genes satisfied the initial significance criteria.
Tumours from patients with recurrent disease within four years of diagnosis were assigned as high risk (n = 15) and tumours from patients without recurrent disease within a follow-up time of four or more years were assigned as low risk (n = 19) at the time of analysis (November 2020). Censored patients (i.e., samples from patients without recurrent disease and less than four years of follow-up time) were not assigned a risk category and were excluded from subsequent model training (n = 3). One further sample was excluded from model training due to being taken from a metastatic biopsy in a patient already included in the dataset with her primary disease.

2.8. Risk Predictor

Gene expression profiles of the OCCC and endometroid primary tumours profiled with the NanoString immune panel described above (Figure 1) from disease recurrence risk DGE analysis, were used to develop a supervised clustering model for prediction of risk in further datasets. Samples with a high/low risk label (n = 34) were used as observations to train a knn model using the R package Class (v7.3.15). mRNA abundance of training and validation datasets were scaled to z-scores for training and testing the knn. The number of neighbours included in majority voting (k) was determined by the square root of observations followed by ceiling function (k = 7). Three independent studies were used as validation datasets to validate the predictor including endometrial cancers and clear cell renal kidney cancers given reported genomic similarities between these and OCCC [28,29,34]: (1) Uehara et al. OCCC samples (n = 25) [35], (2) TCGA UCEC endometrioid endometrial adenocarcinoma samples (n = 107) [28], 3) TCGA KIRC samples (n = 533) [34]. Kaplan–Meier estimators were calculated using the R package Survival (v3.1.12) for each validation dataset using the knn-predicted risk labels as groups. Statistical difference between the risk groups was estimated using the log-rank test. For TCGA datasets, Disease-Specific Survival (DSS) was used for outcome analysis. For Uehara et al. [35], both Disease-Specific Survival (DSS) and Progression Free Survival (PFS) were used for outcome analysis.

2.9. Multiplex Immunofluorescence (MIF)

Multiplex immunofluorescence (MIF) biomarker imaging was performed on 31 OCCC samples to enable the simultaneous evaluation of six markers in a single FFPE tissue section. MIF staining was performed by sequential staining of 4 μm FFPE sections from each patient using an Opal 7−colour reagent kit (Akoya Bioscience, Marlborough, MA, USA). After de-waxing and rehydrating, the sections underwent heat-mediated antigen retrieval before staining. Antibodies were stripped after staining by repeat antigen retrieval before each new antibody was applied. The following antibodies were used: CD4 (Abcam, 133616), CD8 (Dako, M710301), PD-L1 (Cell Signaling, 13684), FOXP3 (Abcam, 20034), Pan–cytokeratin (Dako, M351501) and CD68 (Dako, M087629). Positive control tonsil tissue samples were stained for each different marker individually. Multispectral imaging was performed using the Vectra® 3.0 pathology imaging system (Akoya Bioscience). Cell phenotyping and density quantification was automated using a custom algorithm developed in the inForm™ image analysis software package (Perkin Elmer, Buckinghamshire, UK).

2.10. Quantitative Tissue Assessment of PD-L1 Expression and Combined Positive Score Calculation Using HALO® Image Analysis Platform

Assessment of PD-L1 spatial location was performed using the automated High-Plex FL module in HALO® (Indica Labs) in order to calculate the combined positive score (CPS), encompassing the number of PD-L1-positive cells (tumour, lymphocytes and macrophages) in relation to total tumour cells [36].
Eighteen of the thirty cases produced a CPS from the quantification of PD-L1-positive cells. Nucleated cells were segmented using optimised nuclear detection thresholds (nuclear contrast: 0.97; nuclear intensity: 0.15; nuclear segmentation aggressiveness: 0.59; and nuclear size: 0700.885). Cells were then classified by phenotype based on cytoplasmic-positive and nuclear-positive detection thresholds. PanCK staining intensity varied across images and was grouped into 4 categories based on algorithm settings that best segmented PanCK-positive tumour cells from PanCK-negative cells. An algorithm with PD-L1 detection thresholds (nucleus: 5; cytoplasm 0.5) and PanCK detection thresholds (nucleus: 5 or nucleus: 14, and cytoplasm: 0.28/0.478/3.47/7) was applied to the images from 18 cases.

3. Results

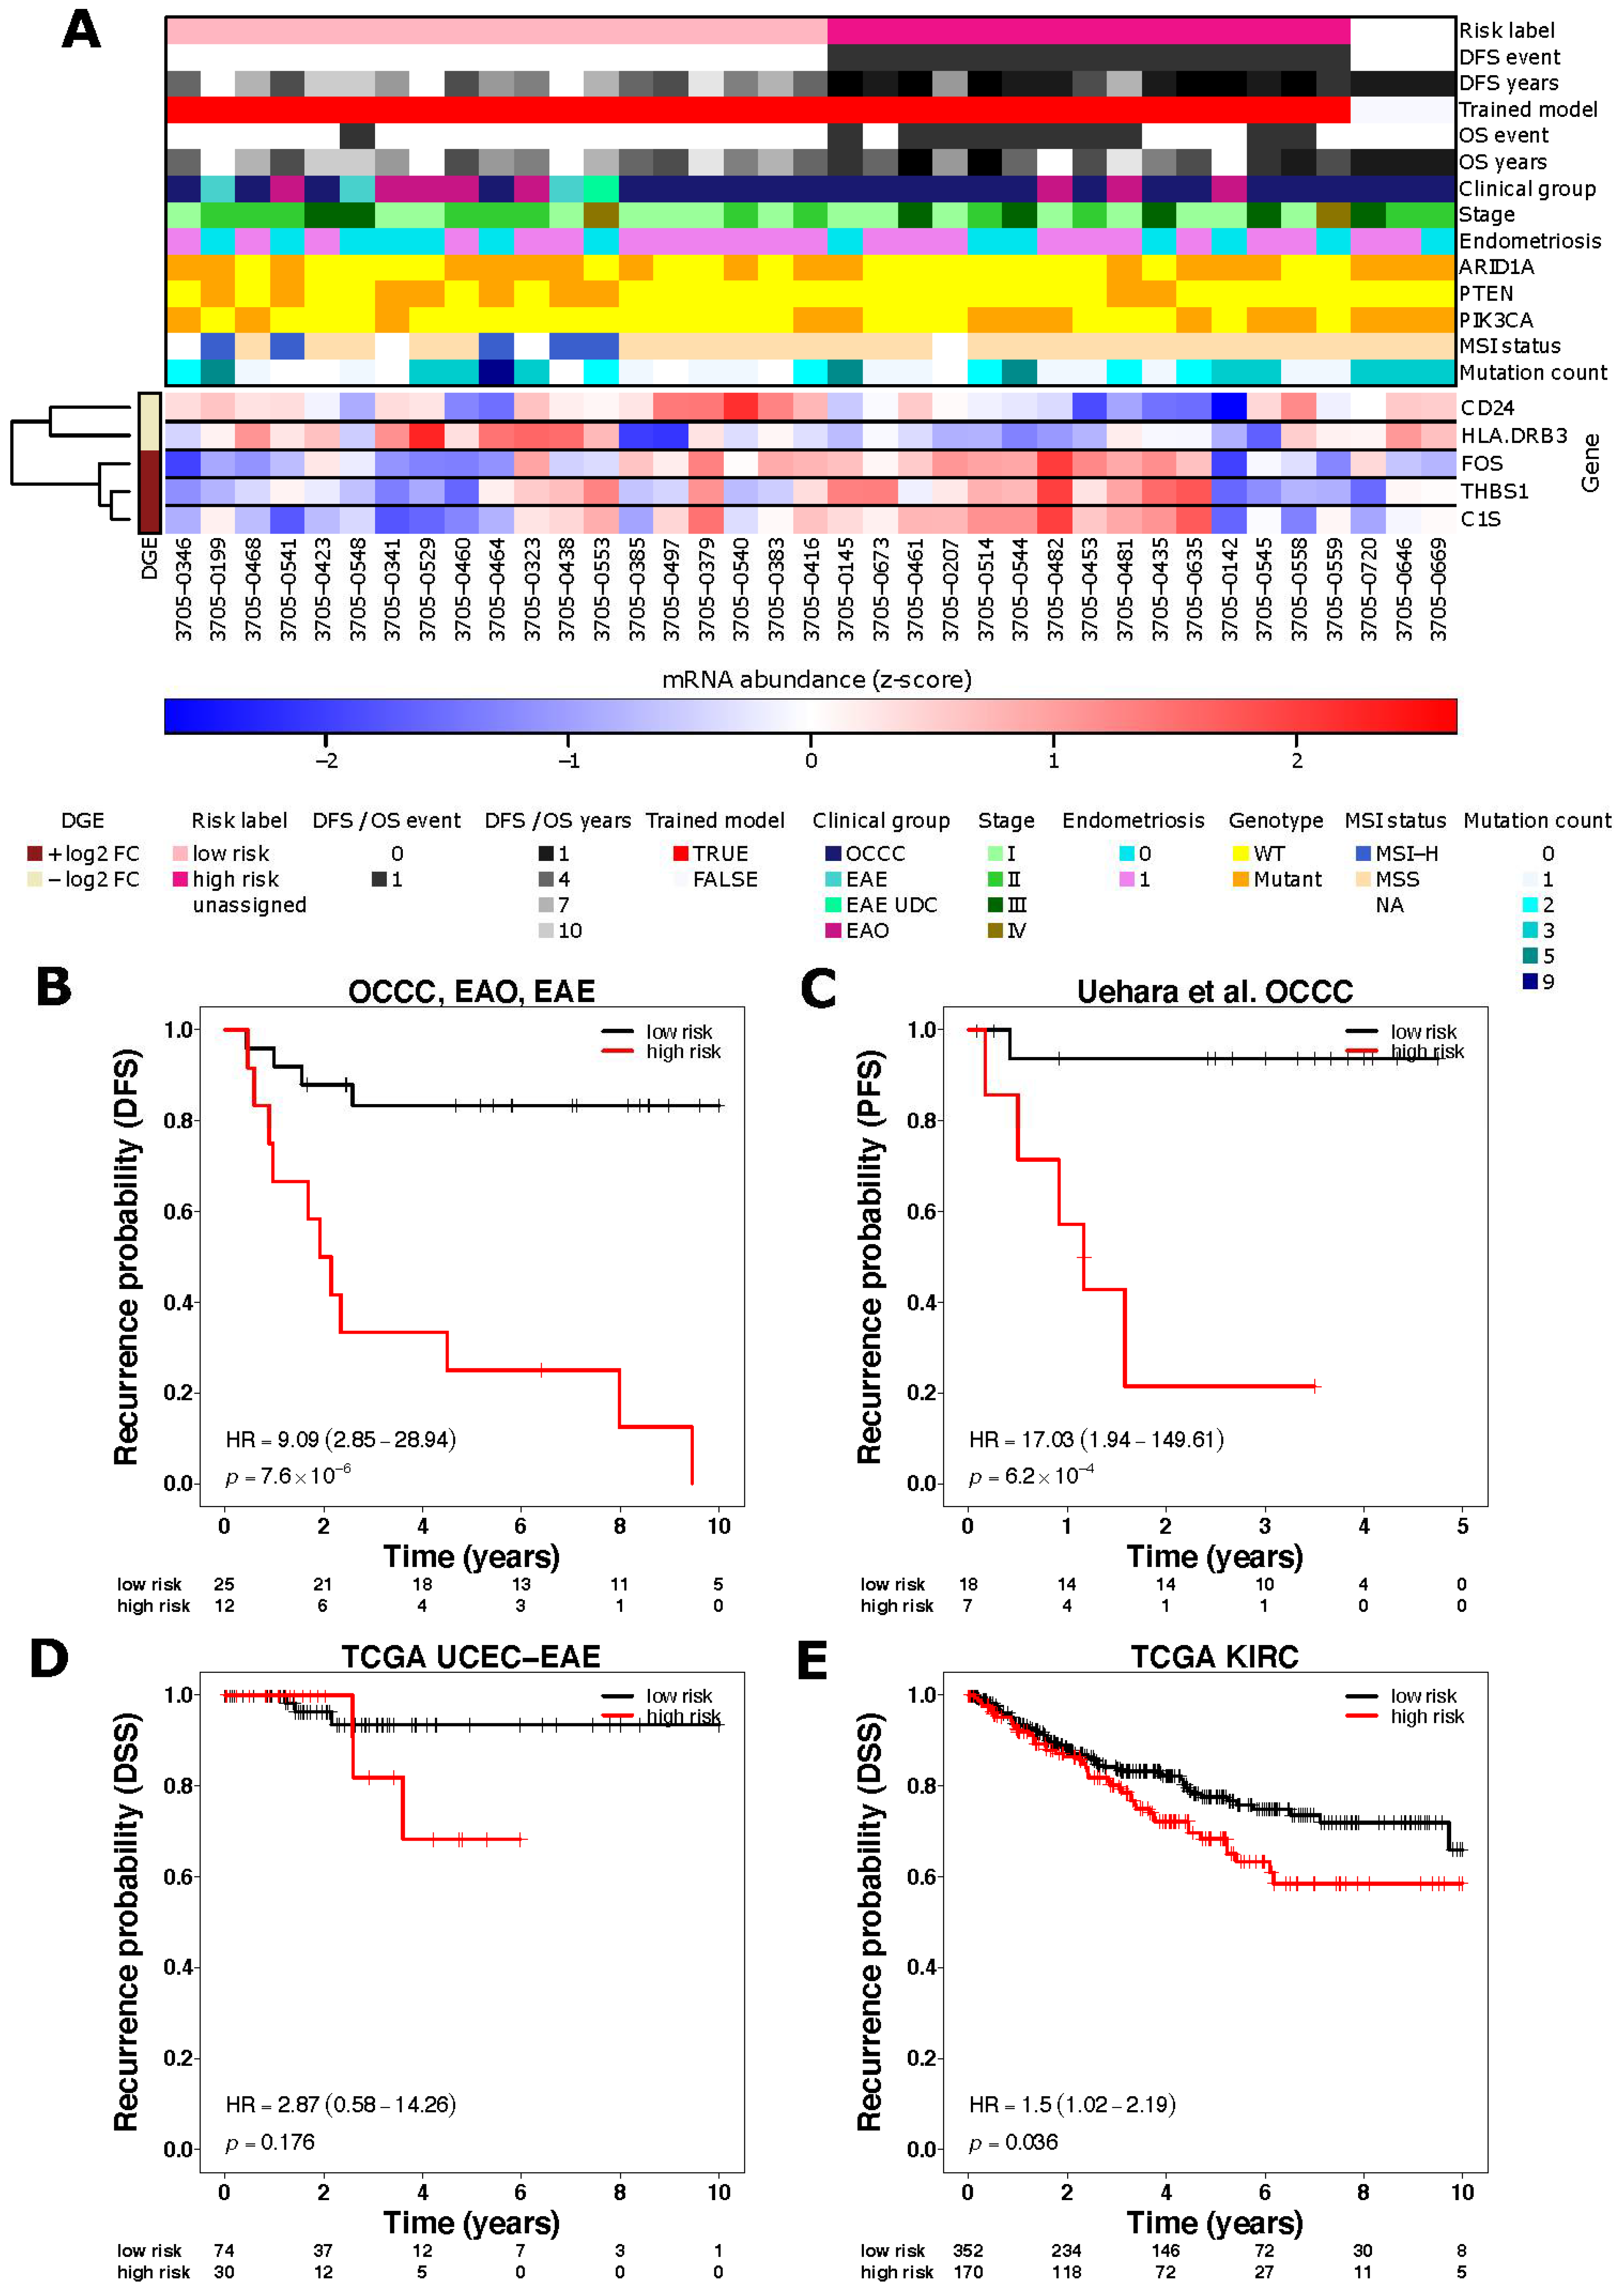
3.1. Immune Related Gene Expression Signatures Are Associated with Risk of Recurrence in OCCC

In order to characterise the immune landscape associations with prognosis in OCCC, we first used targeted gene expression profiling of 730 immune related genes using the NanoString nCounter® PanCancer Immune Profiling Panel that were subjected to targeted DNA sequencing and immunohistochemical assessment of ARID1A protein expression (Figure 1) (OCCC n = 25). We additionally included OCCC-like primary tumours (n = 12), given the genomic similarities of these disease types to OCCC [26,27,28]. Gene expression levels were compared between (i) high-risk patients (disease recurrence within 4 years; n = 15), and (ii) low-risk patients (no disease recurrence with a follow-up time of at least four years; n = 19). Five genes passed a significance threshold of |log2 fold change| > 1, p-value < 0.05. The cell surface protein cluster of differentiation 24 CD24 and the HLA class II beta chain coding gene HLA-DRB3 were under-expressed in the high-risk group (p = 0.008 and p = 0.012, respectively) and the complement component gene C1S, the Fos proto-oncogene FOS and the adhesive glycoprotein thrombospondin-1 THBS1 were over-expressed in the high-risk group (p = 0.007, p = 0.025 and p = 0.031, respectively; Figure 2A–E, Supplementary Figure S1, Supplementary Table S3).
To evaluate whether these genes were prognostic, we next trained a supervised k-nearest neighbour (knn) clustering model (Figure 2B) for the prediction of disease-recurrence risk in independent OCCC and OCCC-like tumour cohorts. This risk predictor was tested in three independent validation datasets: (1) an independent dataset of 25 OCCC primary tumours [35]; (2) TCGA UCEC endometrioid endometrial adenocarcinoma samples (n = 107) [28] and (3) TCGA KIRC samples (n = 533) [34]. Given the lack of clinically well-annotated OCCC cohorts with survival data, gene expression data available for UCEC and KIRC were used given their biological similarities to OCCC [1,29,37]. We first predicted the risk status (high or low) for each sample in the validation datasets (Figure 2C–E). In the independent Uehara OCCC cohort and TCGA KIRC cohort, the recurrence probability was statistically significant between the risk groups (Uehara OCCC cohort: p = 6.2 × 10⁻⁴, HR = 17.03 (1.94–149.61) logrank test, TCGA KIRC cohort p = 0.036, HR = 1.5 (1.02–2.19) Figure 2C,E, Supplementary Figure S2). Of note, estimation of immune cell subpopulations using mRNA abundance, did not identify any significant associations between the various immune subpopulations and risk status (Supplementary Table S4).

3.2. ARID1A Mutated OCCC Show Differential Gene Expression of Immune Related Genes Associated with Lymphocyte Recruitment

We next compared the relative gene expression of immune related genes between ARID1A mutant compared to ARID1A wild-type tumours. We identified that CC2L0 and TREM1 were over-expressed in ARID1A mutant cases (p = 0.001 and p = 0.001, respectively), and SERPING1 and CXCL14 were under-expressed in this group (p = 0.004 and p = 0.02, respectively; Supplementary Figure S3 and Supplementary Table S3). Of note, CCL20 is involved in lymphocyte attraction and TREM1 and CXCL14 are involved in attraction of neutrophils and macrophages, respectively. Comparison of immune cell subtype quantifications inferred from mRNA abundance levels, however, did not identify any significant differences in immune subpopulations according to ARID1A mutation status (Supplementary Table S4).

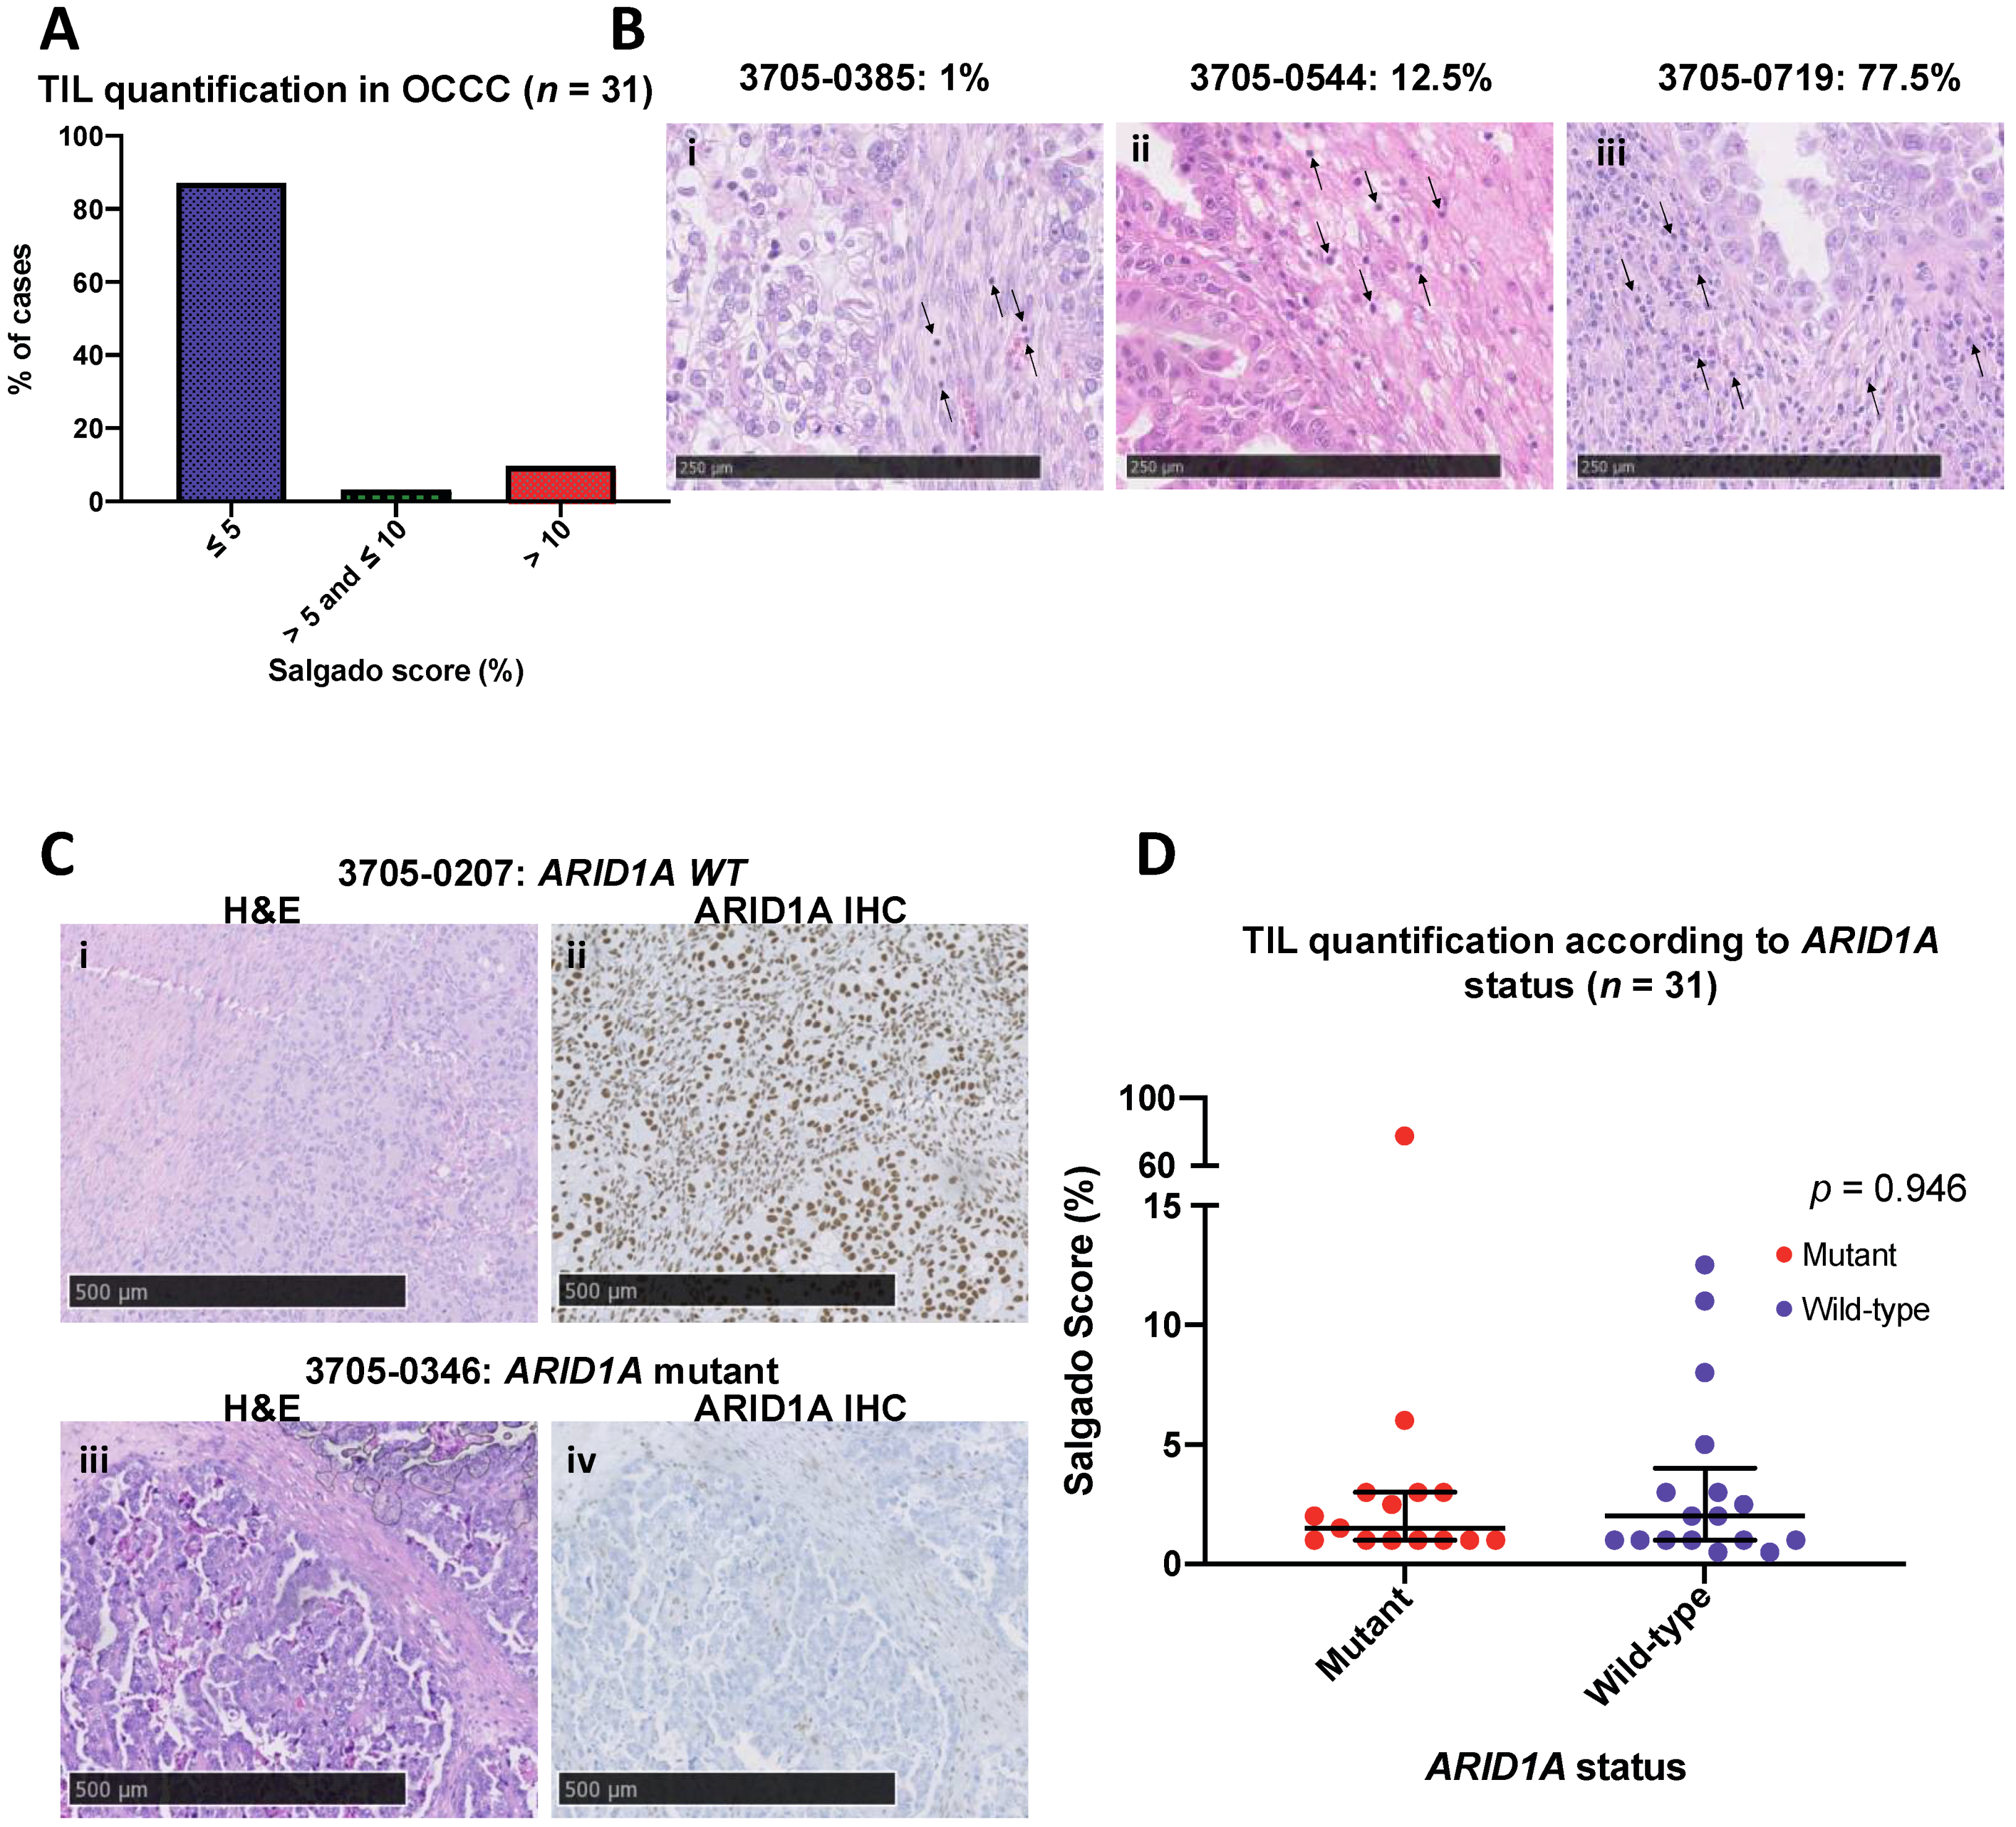
3.3. OCCCs Are Characterised by Histologically Low Levels of Immune Infiltrate

We next sought to ascertain whether the level of immune cell infiltrate was associated with risk of recurrence or ARID1A mutation status in OCCC. We initially used gross histological assessment of immune infiltrate and distribution using the Salgado scoring system [27] in 31 primary OCCC tumours (Figure 1) and correlated TILs with FIGO tumour stage, clinical risk status and ARID1A mutation status (Supplementary Table S5). Overall, OCCCs were characterised by low stromal lymphocytic infiltrates, with a median percentage of TILs of 1.5% (interquartile range: 1–3%), (Figure 3A–D, Supplementary Table S5). The majority of cases, 87.1% (27/31), had stromal TIL scores of ≤ 5%, whilst 3.2% of cases (1/31) had between 5–10% TILs and 9.7% of cases (3/31) had > 10% TILs. We observed no significant association between immune infiltrate and FIGO stage, relapse and ARID1A mutation status (Supplementary Table S5). Additionally, we observed no associations between relapse at 4 years (risk status) and ARID1A mutation status (p = 0.3777, Fisher’s exact test, Supplementary Table S6). Of note, all cases with high immune infiltrate were microsatellite (MSS) stable.

3.4. Total Immune Subpopulation Cell Quantifications Are Not Associated with Risk Status and ARID1A Mutation Status in OCCC

Although OCCC tumours have overall low levels of immune infiltrate, there is emerging evidence that they may respond well to immune checkpoint blockade [20,38,39,40]. Moreover, ARID1A mutant tumours have been shown to demonstrate activation of the immune checkpoint pathway and sensitization to the PD-1/PD-L1 checkpoint blockade in ovarian cancer in in vivo mouse models. We thus hypothesised that in-depth quantification of various immune subpopulations with a role in the potential immune response to these agents may identify subgroups of patients associated with clinical outcomes. To investigate this, we undertook multiplex immunofluorescence using the Opal™ immunofluorescence staining system, and Vectra™ imaging systems. In total, 30 OCCCs were assessed (13 ARID1A mutant and 17 ARID1A wild-type) with antibodies against CD4 (T-helper cells and regulatory T cells), FOXP3 (regulatory T cells), CD8 (cytotoxic T cells), CD68 (monocyte and/macrophage cells), PD-L1 and PanCK (Pan Cytokeratin, which stains tumour cells) (Figure 1) and quantified using a custom algorithm developed in the inForm™ image analysis software package (see methods). Overall, we observed a significant correlation between CD8+ staining and Salgado scoring (p = 0.0233, Spearman’s rank test, Supplementary Figure S4). Similar to the TIL quantification using Salgado methodology, we observed no association between overall levels of immune markers and risk status in this cohort. There were also no significant differences in immune markers between ARID1A mutant and wild-type tumours (Supplementary Table S7).
The CPS (which assesses the number of PD-L1-positive tumour, lymphocytic and macrophage cells in relation to total tumour cells) [36] has been identified as a predictive biomarker of higher overall response rate (ORR) to pembrolizumab in mixed histology epithelial ovarian cancers. Of the 18 OCCCs where CPS calculations were feasible using HALO®, no significant association between the CPS scores and risk status was observed (with 4/11 cases low-risk and the remaining 7/11 cases classed as high-risk, p = 0.4121, Mann–Whitney U test). In addition, we observed no significant associations between CPS score and ARID1A mutational status (ARID1A 7 = mutant and 11 = wild-type: p = 0.9503, p = 0.3734 Mann–Whitney U test, Supplementary Table S8).

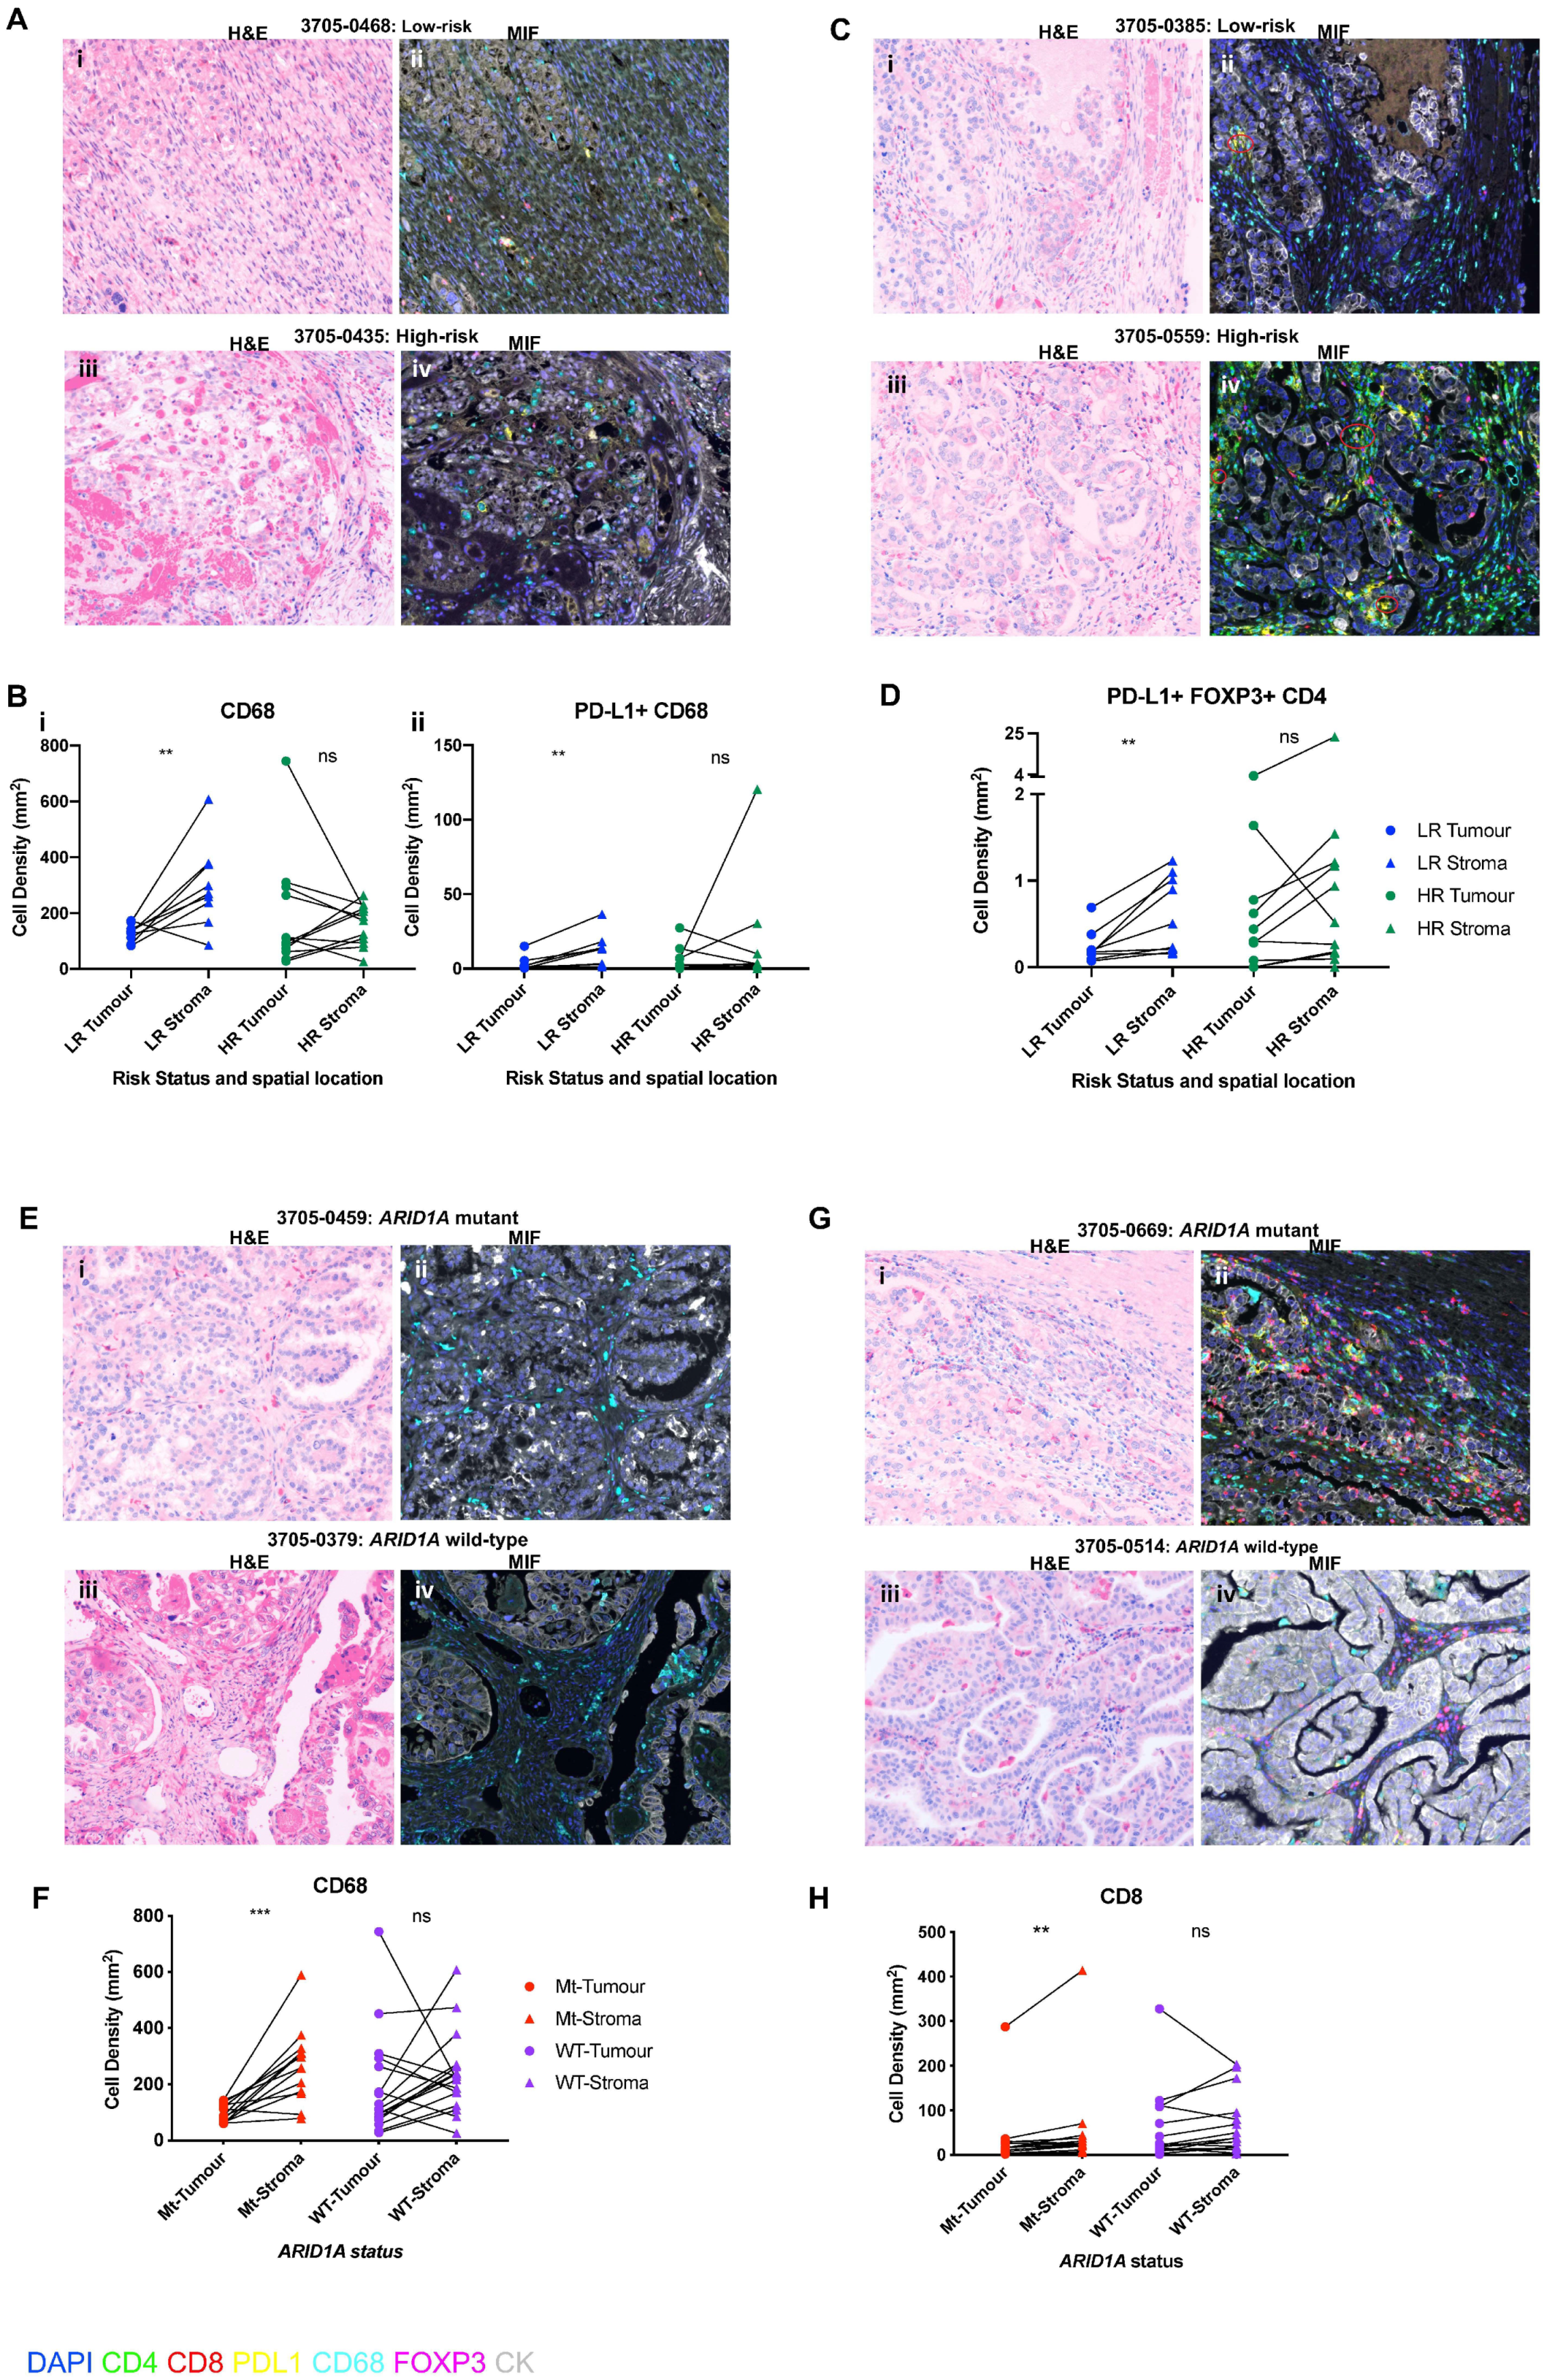
3.5. Spatial Distribution of Immunosuppressive Immune Subpopulations Is Associated with Risk Status and ARID1A Mutational Status in OCCC

We next sought to further interrogate the spatial locations of key immune subpopulations known to promote an immunosuppressive environment [41,42,43,44], including comparison of immune cell location amongst the tumour cells relative to the stroma. We therefore investigated the spatial locations of tumour-associated macrophages (TAMs) by assessing CD68 + cells, activated TAMs (PD–L1 + CD68 + cells), regulatory T cells (FOXP3 + CD4 + cells and activated regulatory T cells; PD–L1 + FOXP3 + CD4 + triple positive cells [45]), stratifying into tumoral and stromal locations. In low-risk patients, we identified significantly higher numbers of CD68 +, PD-L1 + CD68 + and PD-L1 + FOXP3 + cells in the stroma relative to tumour (n = 9) (CD68 +: p = 0.0117, PD-L1 + CD68 +: p = 0.0039, PD-L1 + FOXP3 + CD4 + p = 0.0039, paired samples Wilcoxon signed-rank test, Figure 4A–H). No significant differences were observed in the spatial location of these cell types in high-risk patients, however (n = 12) (CD68: p = 0.8501, PD–L1 + CD68: p = 0.3013, PD–L1 + FOXP3 + CD4 + p = 0.1055, paired samples Wilcoxon signed rank test, Figure 4A–D, Supplementary Table S9).
Comparing the spatial locations of the immunosuppressive subpopulations with ARID1A mutation status highlighted that CD68 + cells were significantly more prevalent in the stroma compared to tumour in the mutant cases (n = 13, p = 0.0007), yet no significant difference between these two spatial locations was present in wild-type cases (n = 17, p = 0.1089, paired samples Wilcoxon signed rank test) (Figure 4E–H). There were no significant differences in the spatial locations of PDL1 + TAMs (PD–L1 + CD68 + cells), or regulatory T cells (Tregs) (FOXP3 + CD4 + cells and PD–L1 + FOXP3 + CD4 + cells) in ARID1A mutant tumours, however (Supplementary Table S9).
Taken together, these results are suggestive that the increased presence of TAMs in the stroma and subsequent exclusion from the tumour cells in low-risk and ARID1A mutant tumours is indicative of a reduced immunosuppressive environment in these patients.

3.6. Spatial Distribution of Cytotoxic T Cells Is Associated with ARID1A Mutational Status

Previous work has highlighted that ARID1A deficiency is related to a mismatch repair phenotype and increased TILs in ovarian cancer mouse models. Given that we did not identify higher TILs in ARID1A mutant cases at the histological level, and also found no differences in the total quantifications of various immune subpopulations assessed through multiplex immunofluorescence, we sought to further clarify if there was any difference in the spatial locations of cytotoxic T-lymphocyte subpopulations that mediate tumour cell killing (dual positive CD4 + CD8 + cells) between ARID1A mutant and wild-type cases. We found that CD8 + cells (cytotoxic T cells) were significantly more prevalent in the stroma of the ARID1A mutant cases relative to the tumour (p = 0.0034), and this coexisted with significantly higher stromal CD68 + cells (p = 0.0007), whilst the wild-type cases showed no significant differences between the spatial location of this cell type (p = 0.0984) (Figure 4E–H). There were no differences, however, between ARID1A mutant and wild-type cases in terms of the locations of CD4 + T cells (Supplementary Table S9).

4. Discussion

By comprehensively characterising a cohort of OCCC, we have gained novel insights into the immune landscape of this histologically rare ovarian epithelial malignancy. Our study identified that although OCCCs have low levels of immune infiltrate, there is a subset of immune-related genes associated with clinical outcome in OCCC patients. Although derivation of this signature was supplemented with endometroid cancers to increase the power of the survival modelling, the signature validated in additional independent OCCC, endometrial and clear cell kidney cancers, highlighting the interoperability of the immune-related prognostic signature in cancers with reported genomic similarities [28,29,30,31,32,33,34]. Three of five genes that we identified as associated with disease recurrence (CD24, C1S and THBS1) were also found to be prognostic in a recent study by Tan and colleagues, which identified two prognostic OCCC gene expression subtypes in a large cohort of OCCCs [24], and may thus represent useful biomarkers for identification of poor prognosis OCCC tumours.
We further identify that the spatial location of immune subpopulations, rather than their gross quantification, is associated with patient risk of relapse and ARID1A mutation status. Our finding of relatively higher numbers of important immunosuppressive subpopulations, CD68 + and PD-L1 + CD68 + (TAMs) and PD-L1 + FOXP3 + CD4 + (T-regulatory) cells in the stroma relative to tumour in low-risk patients, suggests that the ‘tumour-exclusion’ of these cells is important in maintaining an effective anti-tumour immune response and preventing tumour progression. Recent studies have suggested that increased intratumoral PD-L1 + macrophages and T-regs are associated with a worse outcome in lung cancers [46,47]. High FOXP3 expression has additionally been associated with worse progression-free survival in high-grade serous epithelial ovarian cancer patients [48]. Whilst we did not identify this direct association in OCCC, likely due to low numbers, we provide new insights into the spatial significance of T-regulatory cells with relation to prognosis in OCCC.
When ARID1A mutation status was considered, we identified that mutant cases showed the simultaneous ‘tumour-exclusion’ of both CD68 + TAMs and CD8 + cytotoxic T cells. Previous studies have also demonstrated that stromal TAMs have long-lasting interactions with stromal T cells, ‘trapping’ them in the stroma and preventing them from gaining access to the tumour cells [49]. Our findings suggest that the therapeutic targeting of TAMs may be important in enabling CD8 + cells to access the tumour, further enhancing and synergising current immune checkpoint-based immunotherapy in ARID1A mutant patients [42,43,44,45,46,47,48,49,50]. Known synthetic-lethal targeting strategies associated with ARID1A deficiency, such as ATR inhibitors and/or PARP inhibitors [19,20,21,22,23,24,25,26,27,28,29,30,31,32,33,34,35,36,37,38,39,40,41,42,43,44,45,46,47,48,49,50,51], may also help prime the immune system and synergise the immune checkpoint blockade. Results from the ongoing ENGOT/GYNI/ATARI (ATr Inhibitor in Combination With Olaparib in Gynaecological Cancers With ARId1A Loss or no Loss (ATARI)) trial will be useful to assess this.
Our study has a number of limitations, namely, the small numbers of patient samples analysed within the cohort. Evaluation of our findings in larger cohorts and in the context of OCCC-specific clinical trials assessing the effectiveness of immunomodulatory agents (e.g., PEACOCC) will be important. In our cohort, no OCCCs harbored microsatellite instability. MSI has been reported in OCCC at a frequency of approximately 10% [22] and immunotherapy is now FDA approved for patients with MSI tumours, regardless of the primary tumour site [52]. This is thought to occur due to the high tumour mutational burden of cancers with defective mis-match repair. A recent pan-cancer analysis (not including OCCC) showed an increased mutational load in ARID1A-mutated tumours [53], suggesting that ARID1A mutant OCCCs may have a higher TMB, and thus potentially respond better to anti-PD-L1 therapies. We were unable to formally assess the TMB in this study due to the small size of the sequencing panel used, and this therefore warrants further assessment in future studies.

5. Conclusions

In summary, we have identified and validated an immune-related gene expression profile that is associated with a risk of recurrence that could be incorporated in future clinical trials. We have also provided new insights into the spatial significance of various immune subpopulations in OCCC, whereby tumour-associated macrophages (TAM) and regulatory T cells are excluded from the vicinity of tumour cells in low-risk patients, and TAMs and cytotoxic T cells are also excluded from the vicinity of tumour cells in ARID1A-mutated OCCCs. Together these findings suggest that the exclusion of these immune effectors could determine the host response of ARID1A mutant OCCCs to therapy. As such, ARID1A mutant patients may derive additional benefits from treatments targeting TAMs to further enhance the response to immunotherapy by facilitating the access of CD8 cells into the vicinity of the tumour. Together our findings provide a framework for the spatial assessment of immune subpopulations in prospective immunotherapy trials in OCCC and highlights the importance of considering combinatorial treatment approaches to improve responses to immunotherapy and overall clinical outcomes in OCCC.

Supplementary Materials

The following are available online at https://www.mdpi.com/article/10.3390/cancers13153854/s1, Figure S1: Prognostic genes in low and high-risk patients in the discovery cohort, Figure S2: Predicted risk groups in the validation datasets, Figure S3: Differential gene expression in ARID1A mutant versus wild-type tumours, Figure S4: Correlation between Salgado scores and CD8 counts. Table S1: Clinicopathological features of study cohort. Table S2: Targeted gene panels used for genomic sequencing and ARID1A mutation and protein status. Table S3: Differential Gene Expression in OCCC. Table S4: Immune cell deconvolution data comparisons in OCCC. Table S5: Salgado scores in OCCC. Table S6: ARID1A mutational status and risk status comparison. Table S7: MIF comparisons. Table S8: CPS associations in OCCC, Table S9: Associations of the spatial assessment of MIF in OCCC.

Author Contributions

Conceptualization, A.A., C.J.L., S.B. and R.N.; data curation, S.K., S.N., D.M., J.W., A.A., K.V., H.K., H.C., I.R., K.v.L., D.B., P.R. and S.B.; formal analysis, S.K., S.N., D.M., H.K., R.B., H.C., I.R., T.J., K.v.L., D.B., P.R., M.J.F.H., S.H., A.M. and R.N.; funding acquisition, R.N.; investigation, S.K., S.N., D.M., J.W., A.A., K.V., H.K., R.B., H.C., T.J., K.v.L., D.B., K.F., N.M., M.J.F.H., C.J.L., S.H., A.M., S.B. and R.N.; methodology, S.K., D.M., H.K., K.v.L., D.B., N.G., K.F., N.M., M.J.F.H., S.H., A.M. and R.N.; project administration, R.N.; Resources, N.G., K.F. and N.M.; Software, S.H.; supervision, M.J.F.H., C.J.L., S.H., A.M., S.B. and R.N.; writing—original draft, S.K., S.N. and R.N.; writing—review and editing, D.M., A.A., K.V., H.K., R.B., H.C., I.R., T.J., K.v.L., D.B., N.G., P.R., K.F., N.M., C.J.L., S.H., A.M. and S.B. All authors have read and agreed to the published version of the manuscript.

Funding

This work was funded by the Lady Garden Foundation (as part of programme funding for SB), Breast Cancer Now, as part of programmatic funding for RN and CJL, Cancer Research UK as part of programme grant funding to CJL and The Monument Trust. We acknowledge the Centre for Translational Immunotherapy at The Institute of Cancer Research for funding support. We acknowledge funding support from NIHR RM/ICR Biomedical Research Centre for Cancer.

Institutional Review Board Statement

This study was approved by the Ethics Committee from The Royal Marsden Hospital (RMH) NHS Foundation Trust. Study: CCR3705 “Analysis of tumour specimens for biomarkers in gynaecological cancers”.

Informed Consent Statement

All patients provided signed consent to be involved in the research.

Data Availability Statement

Raw targeted sequencing data have been deposited into the NCBI Sequence Read Archive under the accession PRJNA432413 and PRJNA432343.

Acknowledgments

We thank Breast Cancer Now Histopathology Unit, The Centre for Molecular Pathology and the Gynaecology Research Team at The Royal Marsden NHS Foundation Trust, The Breast Cancer Now Bioinformatics Core and members of The Functional Genomics Laboratory at the Institute for Cancer Research.

Conflicts of Interest

C.J.L. reports grants from CRUK and Breast Cancer Now during the conduct of the study, is a named inventor on patents describing the use of DNA repair inhibitors and stands to gain from their use as part of the Institute of Cancer Research “Rewards to Inventor” scheme, has received research funding from AstraZeneca, Merck KGaA, Artios, Pfizer, and consultancy and/or advisory fees from Artios, AstraZeneca, MerckKGaA, Tango, and GLG and is a shareholder of OviBio and Tango outside the submitted work. S.B. has worked in an advisory role for Amgen, AstraZeneca, Clovis Oncology, Epsilogen, Genmab, GlaxoSmithKline, Immunogen, Mersana, Merck Sharp & Dohme, Merck Sereno, Oncxerna, Pfizer, Tesaro and Roche, has received institution research funding from AstraZeneca and has received funding support from NIHR RM/ICR Biomedical Research Centre for Cancer. The remining authors declare no conflicts of interest.

References

  1. Jones, S.; Li, M.; Parsons, D.W.; Zhang, X.; Wesseling, J.; Kristel, P.; Schmidt, M.K.; Markowitz, S.; Yan, H.; Bigner, D.; et al. Somatic mutations in the chromatin remodeling gene ARID1A occur in several tumor types. Hum. Mutat. 2012, 33, 100–103. [Google Scholar] [CrossRef]
  2. Tan, D.S.; Iravani, M.; McCluggage, W.G.; Lambros, M.B.; Milanezi, F.; Mackay, A.; Gourley, C.; Geyer, F.C.; Vatcheva, R.; Millar, J.; et al. Genomic analysis reveals the molecular heterogeneity of ovarian clear cell carcinomas. Clin. Cancer Res. 2011, 17, 1521–1534. [Google Scholar] [CrossRef]
  3. Wiegand, K.C.; Shah, S.P.; Al-Agha, O.M.; Zhao, Y.; Tse, K.; Zeng, T.; Senz, J.; McConechy, M.K.; Anglesio, M.S.; Kalloger, S.E.; et al. ARID1A mutations in endometriosis-associated ovarian carcinomas. N. Engl. J. Med. 2010, 359, 1532–1543. [Google Scholar] [CrossRef]
  4. Goff, B.A.; de la Cuesta, R.S.; Muntz, H.G.; Fleischhacker, D.; Ek, M.; Rice, L.W.; Nikrui, N.; Tamimi, H.K.; Cain, J.M.; Greer, B.E.; et al. Clear cell carcinoma of the ovary: A distinct histologic type with poor prognosis and resistance to platinum-based chemotherapy in stage III disease. Gynecol. Oncol. 1996, 60, 412–417. [Google Scholar] [CrossRef]
  5. Chan, J.K.; Teoh, D.; Hu, J.M.; Shin, J.Y.; Osann, K.; Kapp, D.S. Do clear cell ovarian carcinomas have poorer prognosis compared to other epithelial cell types? A study of 1411 clear cell ovarian cancers. Gynecol. Oncol. 2008, 109, 370–376. [Google Scholar] [CrossRef] [PubMed]
  6. Imbalzano, A.N.; Kwon, H.; Green, M.R.; Kingston, R.E. Facilitated binding of TATA-binding protein to nucleosomal DNA. Nature 1994, 370, 481–485. [Google Scholar] [CrossRef] [PubMed]
  7. Kwon, H.; Imbalzano, A.N.; Khavari, P.A.; Kingston, R.E.; Green, M.R. Nucleosome disruption and enhancement of activator binding by a human SW1/SNF complex. Nature 1994, 370, 477–481. [Google Scholar] [CrossRef] [PubMed]
  8. Nagl, N.G., Jr.; Patsialou, A.; Haines, D.S.; Dallas, P.B.; Beck, G.R., Jr.; Moran, E. The p270 (ARID1A/SMARCF1) subunit of mammalian SWI/SNF-related complexes is essential for normal cell cycle arrest. Cancer Res. 2005, 65, 9236–9244. [Google Scholar] [CrossRef]
  9. Berns, K.; Caumanns, J.J.; Hijmans, E.M.; Gennissen, A.M.C.; Severson, T.M.; Evers, B.; Wisman, G.B.A.; Jan Meersma, G.; Lieftink, C.; Beijersbergen, R.L.; et al. ARID1A mutation sensitizes most ovarian clear cell carcinomas to BET inhibitors. Oncogene 2018, 37, 4611–4625. [Google Scholar] [CrossRef] [PubMed]
  10. Bitler, B.G.; Aird, K.M.; Garipov, A.; Li, H.; Amatangelo, M.; Kossenkov, A.V.; Schultz, D.C.; Liu, Q.; Shih Ie, M.; Conejo-Garcia, J.R.; et al. Synthetic lethality by targeting EZH2 methyltransferase activity in ARID1A-mutated cancers. Nat. Med. 2015, 21, 231–238. [Google Scholar] [CrossRef]
  11. Fukumoto, T.; Park, P.H.; Wu, S.; Fatkhutdinov, N.; Karakashev, S.; Nacarelli, T.; Kossenkov, A.V.; Speicher, D.W.; Jean, S.; Zhang, L.; et al. Repurposing pan-HDAC Inhibitors for ARID1A-Mutated ovarian cancer. Cell Rep. 2018, 22, 3393–3400. [Google Scholar] [CrossRef] [PubMed]
  12. Helming, K.C.; Wang, X.; Wilson, B.G.; Vazquez, F.; Haswell, J.R.; Manchester, H.E.; Kim, Y.; Kryukov, G.V.; Ghandi, M.; Aguirre, A.J.; et al. ARID1B is a specific vulnerability in ARID1A-mutant cancers. Nat. Med. 2014, 20, 251–254. [Google Scholar] [CrossRef]
  13. Kwan, S.Y.; Cheng, X.; Tsang, Y.T.; Choi, J.S.; Kwan, S.Y.; Izaguirre, D.I.; Kwan, H.S.; Gershenson, D.M.; Wong, K.K. Loss of ARID1A expression leads to sensitivity to ROS-inducing agent elesclomol in gynecologic cancer cells. Oncotarget 2016, 7, 56933–56943. [Google Scholar] [CrossRef] [PubMed]
  14. Miller, R.E.; Brough, R.; Bajrami, I.; Williamson, C.T.; McDade, S.; Campbell, J.; Kigozi, A.; Rafiq, R.; Pemberton, H.; Natrajan, R.; et al. Synthetic lethal targeting of ARID1A-Mutant ovarian clear cell tumors with dasatinib. Mol. Cancer Ther. 2016, 15, 1472–1484. [Google Scholar] [CrossRef] [PubMed]
  15. Ogiwara, H.; Takahashi, K.; Sasaki, M.; Kuroda, T.; Yoshida, H.; Watanabe, R.; Maruyama, A.; Makinoshima, H.; Chiwaki, F.; Sasaki, H.; et al. Targeting the vulnerability of glutathione metabolism in ARID1A-deficient cancers. Cancer Cell 2019, 35, 177–190.e178. [Google Scholar] [CrossRef]
  16. Park, Y.; Chui, M.H.; Suryo Rahmanto, Y.; Yu, Z.C.; Shamanna, R.A.; Bellani, M.A.; Gaillard, S.; Ayhan, A.; Viswanathan, A.; Seidman, M.M.; et al. Loss of ARID1A in tumor cells renders selective vulnerability to combined ionizing radiation and PARP inhibitor therapy. Clin. Cancer Res. 2019, 25, 5584–5594. [Google Scholar] [CrossRef]
  17. Samartzis, E.P.; Gutsche, K.; Dedes, K.J.; Fink, D.; Stucki, M.; Imesch, P. Loss of ARID1A expression sensitizes cancer cells to PI3K- and AKT-inhibition. Oncotarget 2014, 5, 5295–5303. [Google Scholar] [CrossRef]
  18. Shen, J.; Ju, Z.; Zhao, W.; Wang, L.; Peng, Y.; Ge, Z.; Nagel, Z.D.; Zou, J.; Wang, C.; Kapoor, P.; et al. ARID1A deficiency promotes mutability and potentiates therapeutic antitumor immunity unleashed by immune checkpoint blockade. Nat. Med. 2018, 24, 556–562. [Google Scholar] [CrossRef]
  19. Williamson, C.T.; Miller, R.; Pemberton, H.N.; Jones, S.E.; Campbell, J.; Konde, A.; Badham, N.; Rafiq, R.; Brough, R.; Gulati, A.; et al. ATR inhibitors as a synthetic lethal therapy for tumours deficient in ARID1A. Nat. Commun. 2016, 7, 1–13. [Google Scholar] [CrossRef]
  20. Matulonis, U.A.; Shapira-Frommer, R.; Santin, A.D.; Lisyanskaya, A.S.; Pignata, S.; Vergote, I.; Raspagliesi, F.; Sonke, G.S.; Birrer, M.; Provencher, D.M.; et al. Antitumor activity and safety of pembrolizumab in patients with advanced recurrent ovarian cancer Results from the phase II KEYNOTE-100 study. Ann. Oncol. 2019, 30, 1080–1087. [Google Scholar] [CrossRef]
  21. Zamarin, D.; Burger, R.A.; Sill, M.W.; Powell, D.J., Jr.; Lankes, H.A.; Feldman, M.D.; Zivanovic, O.; Gunderson, C.; Ko, E.; Mathews, C.; et al. Randomized phase II trial of Nivolumab Versus Nivolumab and Ipilimumab for recurrent or persistent ovarian cancer: An NRG Oncology Study. J. Clin. Oncol. 2020, 38, 1814–1823. [Google Scholar] [CrossRef]
  22. Howitt, B.E.; Strickland, K.C.; Sholl, L.M.; Rodig, S.; Ritterhouse, L.L.; Chowdhury, D.; D’Andrea, A.D.; Matulonis, U.A.; Konstantinopoulos, P.A. Clear cell ovarian cancers with microsatellite instability: A unique subset of ovarian cancers with increased tumor-infiltrating lymphocytes and PD-1/PD-L1 expression. Oncoimmunology 2017, 6, e1277308. [Google Scholar] [CrossRef] [PubMed]
  23. Willis, B.C.; Sloan, E.A.; Atkins, K.A.; Stoler, M.H.; Mills, A.M. Mismatch repair status and PD-L1 expression in clear cell carcinomas of the ovary and endometrium. Mod. Pathol. 2017, 30, 1622–1632. [Google Scholar] [CrossRef]
  24. Tan, T.Z.; Ye, J.; Yee, C.V.; Lim, D.; Ngoi, N.Y.L.; Tan, D.S.P.; Huang, R.Y. Analysis of gene expression signatures identifies prognostic and functionally distinct ovarian clear cell carcinoma subtypes. EBioMedicine 2019, 50, 203–210. [Google Scholar] [CrossRef] [PubMed]
  25. Okamura, R.; Kato, S.; Lee, S.; Jimenez, R.E.; Sicklick, J.K.; Kurzrock, R. ARID1A alterations function as a biomarker for longer progression-free survival after anti-PD-1/PD-L1 immunotherapy. J. Immunother. Cancer 2020, 8, e000438. [Google Scholar] [CrossRef] [PubMed]
  26. Khalique, S.; Naidoo, K.; Attygalle, A.D.; Kriplani, D.; Daley, F.; Lowe, A.; Campbell, J.; Jones, T.; Hubank, M.; Fenwick, K.; et al. Optimised ARID1A immunohistochemistry is an accurate predictor of ARID1A mutational status in gynaecological cancers. J. Pathol. Clin. Res. 2018, 4, 154–166. [Google Scholar] [CrossRef]
  27. Salgado, R.; Denkert, C.; Demaria, S.; Sirtaine, N.; Klauschen, F.; Pruneri, G.; Wienert, S.; Van den Eynden, G.; Baehner, F.L.; Penault-Llorca, F.; et al. The evaluation of tumor-infiltrating lymphocytes (TILs) in breast cancer: Recommendations by an International TILs Working Group 2014. Ann. Oncol. 2015, 26, 259–271. [Google Scholar] [CrossRef] [PubMed]
  28. Cancer Genome Atlas Research, N.; Kandoth, C.; Schultz, N.; Cherniack, A.D.; Akbani, R.; Liu, Y.; Shen, H.; Robertson, A.G.; Pashtan, I.; Shen, R.; et al. Integrated genomic characterization of endometrial carcinoma. Nature 2013, 497, 67–73. [Google Scholar] [CrossRef]
  29. Anglesio, M.S.; George, J.; Kulbe, H.; Friedlander, M.; Rischin, D.; Lemech, C.; Power, J.; Coward, J.; Cowin, P.A.; House, C.M.; et al. IL6-STAT3-HIF signaling and therapeutic response to the angiogenesis inhibitor sunitinib in ovarian clear cell cancer. Clin. Cancer Res. 2011, 17, 2538–2548. [Google Scholar] [CrossRef]
  30. Cesano, A.; Warren, S. Bringing the next generation of immuno-oncology biomarkers to the clinic. Biomedicines 2018, 6, 14. [Google Scholar] [CrossRef] [PubMed]
  31. Waggott, D.; Chu, K.; Yin, S.; Wouters, B.G.; Liu, F.F.; Boutros, P.C. NanoStringNorm: An extensible R package for the pre-processing of NanoString mRNA and miRNA data. Bioinformatics 2012, 28, 1546–1548. [Google Scholar] [CrossRef] [PubMed]
  32. Ritchie, M.E.; Phipson, B.; Wu, D.; Hu, Y.; Law, C.W.; Shi, W.; Smyth, G.K. Limma powers differential expression analyses for RNA-sequencing and microarray studies. Nucleic Acids Res. 2015, 43, e47. [Google Scholar] [CrossRef]
  33. Robinson, M.D.; McCarthy, D.J.; Smyth, G.K. edgeR: A Bioconductor package for differential expression analysis of digital gene expression data. Bioinformatics 2010, 26, 139–140. [Google Scholar] [CrossRef] [PubMed]
  34. Cancer Genome Atlas Research, N. Comprehensive molecular characterization of clear cell renal cell carcinoma. Nature 2013, 499, 43–49. [Google Scholar] [CrossRef] [PubMed]
  35. Uehara, Y.; Oda, K.; Ikeda, Y.; Koso, T.; Tsuji, S.; Yamamoto, S.; Asada, K.; Sone, K.; Kurikawa, R.; Makii, C.; et al. Integrated copy number and expression analysis identifies profiles of whole-arm chromosomal alterations and subgroups with favorable outcome in ovarian clear cell carcinomas. PLoS ONE 2015, 10, e0128066. [Google Scholar] [CrossRef]
  36. Kulangara, K.; Hanks, D.A.; Waldroup, S.; Peltz, L.; Shah, S.; Roach, C.; Juco, J.W.; Emancipator, K.; Stanforth, D. Development of the combined positive score (CPS) for the evaluation of PD-L1 in solid tumors with the immunohistochemistry assay PD–L1 IHC 22C3 pharmDx. J. Clin. Oncol. 2017, 35, e14589. [Google Scholar] [CrossRef]
  37. Zorn, K.K.; Bonome, T.; Gangi, L.; Chandramouli, G.V.; Awtrey, C.S.; Gardner, G.J.; Barrett, J.C.; Boyd, J.; Birrer, M.J. Gene expression profiles of serous, endometrioid, and clear cell subtypes of ovarian and endometrial cancer. Clin. Cancer Res. 2005, 11, 6422–6430. [Google Scholar] [CrossRef]
  38. Hamanishi, J.; Mandai, M.; Ikeda, T.; Minami, M.; Kawaguchi, A.; Murayama, T.; Kanai, M.; Mori, Y.; Matsumoto, S.; Chikuma, S.; et al. Safety and antitumor activity of anti–PD–1 Antibody, Nivolumab, in patients with platinum-resistant ovarian cancer. J. Clin. Oncol. 2015, 33, 4015–4022. [Google Scholar] [CrossRef]
  39. Bellone, S.; Buza, N.; Choi, J.; Zammataro, L.; Gay, L.; Elvin, J.; Rimm, D.L.; Liu, Y.; Ratner, E.S.; Schwartz, P.E.; et al. Exceptional response to pembrolizumab in a metastatic, chemotherapy/radiation–resistant ovarian cancer patient harboring a PD–L1–Genetic rearrangement. Clin. Cancer Res. 2018, 24, 3282–3291. [Google Scholar] [CrossRef]
  40. Disis, M.L.; Taylor, M.H.; Kelly, K.; Beck, J.T.; Gordon, M.; Moore, K.M.; Patel, M.R.; Chaves, J.; Park, H.; Mita, A.C.; et al. Efficacy and safety of avelumab for patients with recurrent or refractory ovarian cancer: Phase 1b results from the JAVELIN solid tumor trial. JAMA Oncol. 2019, 5, 393–401. [Google Scholar] [CrossRef] [PubMed]
  41. Ruffell, B.; Coussens, L.M. Macrophages and therapeutic resistance in cancer. Cancer Cell 2015, 27, 462–472. [Google Scholar] [CrossRef] [PubMed]
  42. Xiang, X.; Wang, J.; Lu, D.; Xu, X. Targeting tumor-associated macrophages to synergize tumor immunotherapy. Signal. Transduct. Target. Ther. 2021, 6, 1–12. [Google Scholar] [CrossRef]
  43. Liu, G.; Xu, P.; Fu, Z.; Hua, X.; Liu, X.; Li, W.; Zhang, M.; Wu, J.; Wen, J.; Xu, J.; et al. Prognostic and clinicopathological significance of ARID1A in Endometrium-Related Gynecological Cancers: A Meta-Analysis. J. Cell Biochem. 2017, 118, 4517–4525. [Google Scholar] [CrossRef]
  44. Lin, Y.; Xu, J.; Lan, H. Tumor-associated macrophages in tumor metastasis: Biological roles and clinical therapeutic applications. J. Hematol. Oncol. 2019, 12, 1–16. [Google Scholar] [CrossRef]
  45. Fanelli, G.; Romano, M.; Nova-Lamperti, E.; Werner Sunderland, M.; Nerviani, A.; Scotta, C.; Bombardieri, M.; Quezada, S.A.; Sacks, S.H.; Noelle, R.J.; et al. PD-L1 signaling on human memory CD4+ T cells induces a regulatory phenotype. PLoS Biol. 2021, 19, e3001199. [Google Scholar] [CrossRef]
  46. Sepesi, B.; Cuentas, E.P.; Canales, J.R.; Behrens, C.; Correa, A.M.; Vaporciyan, A.; Weissferdt, A.; Kalhor, N.; Moran, C.; Swisher, S.; et al. Programmed death cell ligand 1 (PD-L1) is associated with survival in stage I non-small cell lung cancer. Semin. Thorac. Cardiovasc. Surg. 2017, 29, 408–415. [Google Scholar] [CrossRef]
  47. Barua, S.; Fang, P.; Sharma, A.; Fujimoto, J.; Wistuba, I.; Rao, A.U.K.; Lin, S.H. Spatial interaction of tumor cells and regulatory T cells correlates with survival in non-small cell lung cancer. Lung Cancer 2018, 117, 73–79. [Google Scholar] [CrossRef]
  48. Wolf, D.; Wolf, A.M.; Rumpold, H.; Fiegl, H.; Zeimet, A.G.; Muller-Holzner, E.; Deibl, M.; Gastl, G.; Gunsilius, E.; Marth, C. The expression of the regulatory T cell-specific forkhead box transcription factor FoxP3 is associated with poor prognosis in ovarian cancer. Clin. Cancer Res. 2005, 11, 8326–8331. [Google Scholar] [CrossRef] [PubMed]
  49. Peranzoni, E.; Lemoine, J.; Vimeux, L.; Feuillet, V.; Barrin, S.; Kantari-Mimoun, C.; Bercovici, N.; Guerin, M.; Biton, J.; Ouakrim, H.; et al. Macrophages impede CD8 T cells from reaching tumor cells and limit the efficacy of anti-PD-1 treatment. Proc. Natl. Acad. Sci. USA 2018, 115, E4041–E4050. [Google Scholar] [CrossRef] [PubMed]
  50. Peranzoni, E.; Donnadieu, E. Improving efficacy of cancer immunotherapy through targeting of macrophages. Hum. Vaccin. Immunother. 2019, 15, 189–192. [Google Scholar] [CrossRef]
  51. Shen, J.; Peng, Y.; Wei, L.; Zhang, W.; Yang, L.; Lan, L.; Kapoor, P.; Ju, Z.; Mo, Q.; Shih Ie, M.; et al. ARID1A deficiency impairs the DNA damage checkpoint and sensitizes cells to PARP inhibitors. Cancer Discov. 2015, 5, 752–767. [Google Scholar] [CrossRef] [PubMed]
  52. Marcus, L.; Lemery, S.J.; Keegan, P.; Pazdur, R. FDA approval summary: Pembrolizumab for the treatment of microsatellite instability-high solid tumors. Clin. Cancer Res. 2019, 25, 3753–3758. [Google Scholar] [CrossRef] [PubMed]
  53. Orlando, K.A.; Nguyen, V.; Raab, J.R.; Walhart, T.; Weissman, B.E. Remodeling the cancer epigenome: Mutations in the SWI/SNF complex offer new therapeutic opportunities. Expert Rev. Anticancer Ther. 2019, 19, 375–391. [Google Scholar] [CrossRef] [PubMed]
Figure 1. Study workflow. CONSORT diagram showing 34 ovarian clear cell carcinoma (OCCC) cases identified from the Royal Marsden biomarker study (CCR 3705). The same FFPE block was used for extracting DNA for next generation sequencing (NGS), RNA for gene expression analysis, immunohistochemistry (IHC) and multiplexed immunofluorescence (IF). * Case 3705–0573 failed NGS quality control and was not included in further analysis. ** Two of the 34 cases were not included in histological, NanoString and IF analysis: Case 3705–0573 was omitted having failed sequencing and case 3705–0611 failed IHC due to absence of tumour on tissue section and no further tissue blocks available. *** 3705–0435 had matched primary and metastatic samples and only the primary sample was analysed for TIL infiltrate. **** Three further cases had inadequate material for NanoString analysis (3705–0082, 3705–0181, 3705–0713). Three cases failed QC metrics (3705–0625, 3705–0719, 3705–0459). The cohort of 25 OCCCs was supplemented with a cohort of endometrioid carcinomas (endometrioid adenocarcinoma of the ovary (EAO) n = 8 and endometrioid adenocarcinoma of the endometrium (EAE) n = 4, total = 37 cases) for NanoString analysis. ***** Cases 3705–0719 and 3705–0464 had insufficient tissue for MIF analysis.
Cancers 13 03854 g001
Figure 2. Gene Expression Profiling shows differential gene expression in low- vs. high-risk patient samples. (A) Heatmap demonstrating results from NanoString PanCancer Immune Panel gene expression profiling (n = 37, OCCC n = 25 and endometrioid-EAE and EAO n = 12). (BE) Kaplan–Meier curves depicting the associations with prognosis of the differential gene expression signature in (B) our discovery cohort (all OCCC, EAE and EAO samples (n = 37) and independent validation cohorts), (C) Uehara et al. OCCC samples (n = 25), (D) TCGA UCEC endometrioid endometrial adenocarcinoma samples (n = 107), and (E) TCGA KIRC (kidney renal cell carcinoma) samples (n = 533). OS/DFS event 1 = is event and 0 = censored. Prognostic association (expressed as Hazard ratio ‘HR’) was estimated by fitting Cox proportional hazards model.
Cancers 13 03854 g002
Figure 3. OCCC is characterized by low immune infiltrates. (A) Bar chart showing that the greatest proportion of cases (87.1%, 27/31) fall within the lowest Salgado score category, whilst lower proportions fall within the intermediate (3.23%, 1/31) and high Salgado score groups (9.68%, 3/31). (B) From left to right: (i) low (1%), (ii) intermediate (12.5%) and (iii) high (77.5%) Salgado scores represented in H&E sections (arrows indicate TILs, magnification = × 20). (C) Representative micrographs of ARID1A protein expression in OCCC tumours: (i) H&E and (ii) matched ARID1A IHC for ARID1A wild-type case 3705–0207, and (iii) H&E and (iv) matched ARID1A IHC for ARID1A mutant case 3705–0346 showing loss of ARID1A expression. (D) Scatter plot showing Salgado scores in the cohort according to ARID1A mutational status.
Cancers 13 03854 g003
Figure 4. Spatial distribution of immune subpopulations is associated with risk status and ARID1A mutational status in OCCC. (A) Representative H&Es and Vectra images in low- and high-risk patients demonstrating differential spatial locations of PD-L1 + CD68 cells: (i) H&E and (ii) corresponding Vectra IF image in low-risk case 3705–0468 showing stromal PD-L1 + CD68 + cells; (iii) H&E and (iv) corresponding Vectra IF image for high-risk case 3705–0435 demonstrating PD-L1 + CD68 + cells located in a tumour area. (B) Immune cell quantifications subdivided into tumour and stromal locations according to patient risk status (n = 21). Scatter graphs depicting individual data points for each patient for cell density counts of (i) CD68 and (ii) PD-L1 + CD68. (C) Representative H&Es and Vectra images in low- and high-risk patients demonstrating differential spatial locations of PD-L1 + FOXP3 + CD4 + cells; (i) H&E and (ii) corresponding Vectra IF image in low-risk case 3705–0385 showing a stromal PD-L1 + FOXP3 + CD4 + cells; (iii) H&E and (iv) corresponding Vectra IF image for high-risk case 3705–0559 demonstrating PD-L1 + FOXP3 + CD4 cells located in tumour and stroma compartments. These cells are highlighted by red annotations. (D) Immune cell quantifications subdivided into tumour and stromal locations according to patient risk status (n = 21). Scatter graph depicting individual data points for each patient for cell density counts of PD-L1 + FOXP3 + CD4 + cells showing significantly higher numbers of this immune cell-type in the stroma relative to tumour in low-risk patients (n = 9). (E) Representative H&E and corresponding Vectra IF images in ARID1A mutant and wild-type tumours demonstrating CD68 cell findings: (i) H&E for mutant case 3705–0459 and (ii) corresponding Vectra IF image demonstrating CD68 cells located within the stroma and excluded from the tumour cells; (iii) H&E for wild-type case 3705–0379 and (iv) corresponding Vectra IF image demonstrating CD68 cells located in both the stroma and the tumour. (F) Scatter graph depicting individual data points depicting CD68 cell density counts in the tumour and stroma for each patient (n = 30). (G) Representative H&E and corresponding Vectra IF images in ARID1A mutant and wild-type cases demonstrating CD8 + cell findings: (i) H&E of mutant case 3705–0669 and (ii) corresponding Vectra IF image demonstrating CD8 + cells located within the stroma and excluded from the tumour cells; (iii) H&E for wild-type case 3705–0514 and (iv) corresponding Vectra IF image demonstrating CD8 + cells located in both the stroma and the tumour. (H) Scatter graph depicting individual data points for cell density counts of CD8 + cells in the tumour and stroma for each individual patient (n = 30), (** p < 0.01, *** p < 0.001, Wilcoxon matched pairs-signed rank test).
Cancers 13 03854 g004
Table 1. Overview of patient characteristics in the study.
ParameterTotal
Number (n)
Number of primary tumour samples43 *
Diagnosis
Ovarian Clear Cell Carcinoma (OCCC)31
Endometrioid adenocarcinoma of the ovary (EAO)8
Endometrioid adenocarcinoma of the endometrium (EAE)4
Grade
I3
II7
III33
FIGO Stage
I17
II14
III10
IV2
Median age, years (range)55 (32,75)
Endometriosis
Yes24
No15
Unknown4
* Clinical data excludes 2 of the original 34 OCCC cases which were not analysed (3705–0573, 3705–0611 see Figure 1 legend). Patient 3705–0435 had both primary and metastatic tumour samples and clinical data relating to the primary sample are included.
Publisher’s Note: MDPI stays neutral with regard to jurisdictional claims in published maps and institutional affiliations.

