1. Introduction
Cutaneous melanoma has become the most rapidly increasing cancer in Caucasian populations [
1], causing 90% of skin cancer mortality [
2]. The recent introduction of immune checkpoint inhibitors (ICI) has revolutionized the treatment of advanced melanoma [
3], leading to a significantly higher life expectancy in treated melanoma patients [
4]. However, an accurate patient selection for immunotherapy remains challenging given not only the heterogeneous mutation profile of cutaneous melanoma [
5], but also the risk of exposing treatment-resistant patients to higher immune-related toxicity [
6,
7]. A personalized approach with individual biomarkers predictive of treatment response thus appears necessary. In order to predict the response to immunotherapy several outcome predictive biomarkers based on the histopathology of the primary tumor (i.e., tumor thickness, ulceration, mitotic rate) [
8], standard blood samples (i.e., lactate dehydrogenase LDH, calcium-binding protein B S100B) [
9] or clinical aspects (i.e., sentinel lymph node involvement, anatomical site of primary tumor, gender or age) [
10] have been already discussed in the literature. However the 2019 European guidelines for cutaneous melanoma recommending FDG-PET/CT for staging and treatment response assessment in advanced melanoma have highlighted the need for further individual outcome predictive biomarkers based on hybrid imaging [
2].
The value of semiquantitative parameters, such as standardized uptake values SUV on FDG-PET/CT scans to predict treatment response has been already extensively discussed in the literature for several malignancies. High primary SUVmax has been associated with poor outcome and higher risk of recurrence in patients with breast cancer [
11]. In oral cancer patients high primary SUVmax has also shown a significantly higher risk of local recurrence and occult nodal metastases [
12].
However, in the context of melanoma, the evidence on the predictive value of semiquantitative parameters is still very limited since only a few investigations with small cohorts have been performed so far, highlighting the urgent need for further investigations with larger populations [
13,
14,
15].
We aimed to investigate, whether metastatic volume and semiquantitative parameters on FDG-PET/CT scans performed at baseline TP 0 and three months after initiation of immunotherapy TP 1 can be used on a metastasis- and patient-level to predict the outcome six months after initiation of immune checkpoint inhibition TP 2 in a large cohort of metastatic melanoma patients.
2. Methods
2.1. Patient Cohort
In this single-center retrospective study patients with histopathologically proven metastatic melanoma treated with either single checkpoint-inhibition (anti-PD-1) or dual checkpoint-inhibition (anti-PD-1/anti-CTLA-4) between 2013 and 2019 at the Department of Dermatology of the University Hospital Zurich in Switzerland were considered. FDG-PET/CT scans performed in clinical routine at regular intervals were mandatory for patient inclusion. In order to minimize the risk of misinterpretation through pseudoprogression FDG-PET/CT scans before starting immunotherapy (i.e., baseline timepoint TP 0), 3 and 6 months after treatment initiation performed for response assessment under immune checkpoint inhibition (i.e., first follow up time point TP 1 and second follow up time point TP 2) were mandatory. The average interval between FDG-PET/CT scan at TP 0 and TP 1 was 107.1 days and 93.1 days between TP 1 and TP 2. All included patients consented the use of their clinical data for research purposes. This study was approved by the local ethics committee (protocol code KEK-ZH-Nr: 2014-0193) and conducted in compliance with Good Clinical Practice GCP-rules and the Declaration of Helsinki.
2.2. Clinical Data
Clinical data (such as gender, age, prior treatment, histopathology of primary tumor, anatomical site of metastasis, immunotherapy agent, date of treatment start, occurrence of immune-related adverse events under immune checkpoint inhibition and clinical follow up of treatment, i.e., local treatment of metastasis, treatment abort or patient death) were provided in kind cooperation with the Department of Dermatology based on internal clinical records.
2.3. FDG-PET/CT Acquisition
The considered FDG-PET/CT scans were all performed in clinical routine at the Department of Nuclear Medicine of the University Hospital Zurich, according to the department’s standard protocol. Given the wide time window (2013–2019) four different PET/CT scanners by General Electric (GE, Boston, Massachusetts, United States of America) were used over time, i.e., Discovery ST16 und VCT (2013–2017), Discovery 690 (2013–2019) and Discovery DMI (2017–2019). All scanners were calibrated as well as cross calibrated against each other. Furthermore, the four single-center PET/CT scanners were numbered from one to four in the listed order above and included in the statistical analysis in order to investigate whether the use of four different single-center PET/CT scanners had an influence on the measurement of semiquantitative parameters.
All examinations were performed from the vertex of the skull to the thighs in supine position. Whole body FDG-PET/CT scans only if the primary melanoma was located in the lower extremities. A CT scan without contrast medium was performed first for attenuation correction (tube potential 120 kV; tube current modulation between 15 and 80 mA; matrix size 512 × 512; field of view 50 cm; slice thickness 3.75 mm) immediately followed by the PET acquisition (matrix size 256 × 256; field of view 70 cm) in time-of-flight TOF technique.
Patients were asked to fast at least 4 h prior the intravenous 18F-FDG-administration. A blood glucose level below 160 mg/dL at the time of 18F-FDG injection was mandatory. Image acquisition began 60 min after the administration of a body mass index (BMI)-adapted 18F-FDG dose.
2.4. Lesion Segmentation
All included melanoma metastases were retrospectively delineated on coregistered CT- and PET-images at all three time points by two independent physicians using a manual 3D-contouring tool.
The standardized uptake values (SUV mean, maximum and peak), as well as metabolic tumor volume MTV and total lesion glycolysis TLG of each included metastasis were extracted from the same volume of interest VOI surrounding the whole metastasis on PET images reconstructed with ordered subset expectation maximization OSEM (3 iterations, 16 subsets) and a threshold set at 42% of the SUVmax.
The metastatic volume was measured using a VOI surrounding the whole metastasis on native computed tomography scans. The CT-based contours could be manually corrected by matching the lesion borders on CT- and PET-images.
As part of the analysis on a patient-level, total tumor volume, total metabolic tumor volume MTV and total lesion glycolysis TLG of all metastases were determined.
Newly occurred metastases at TP 1 were not segmented, but only documented (i.e., onset of new metastasis).
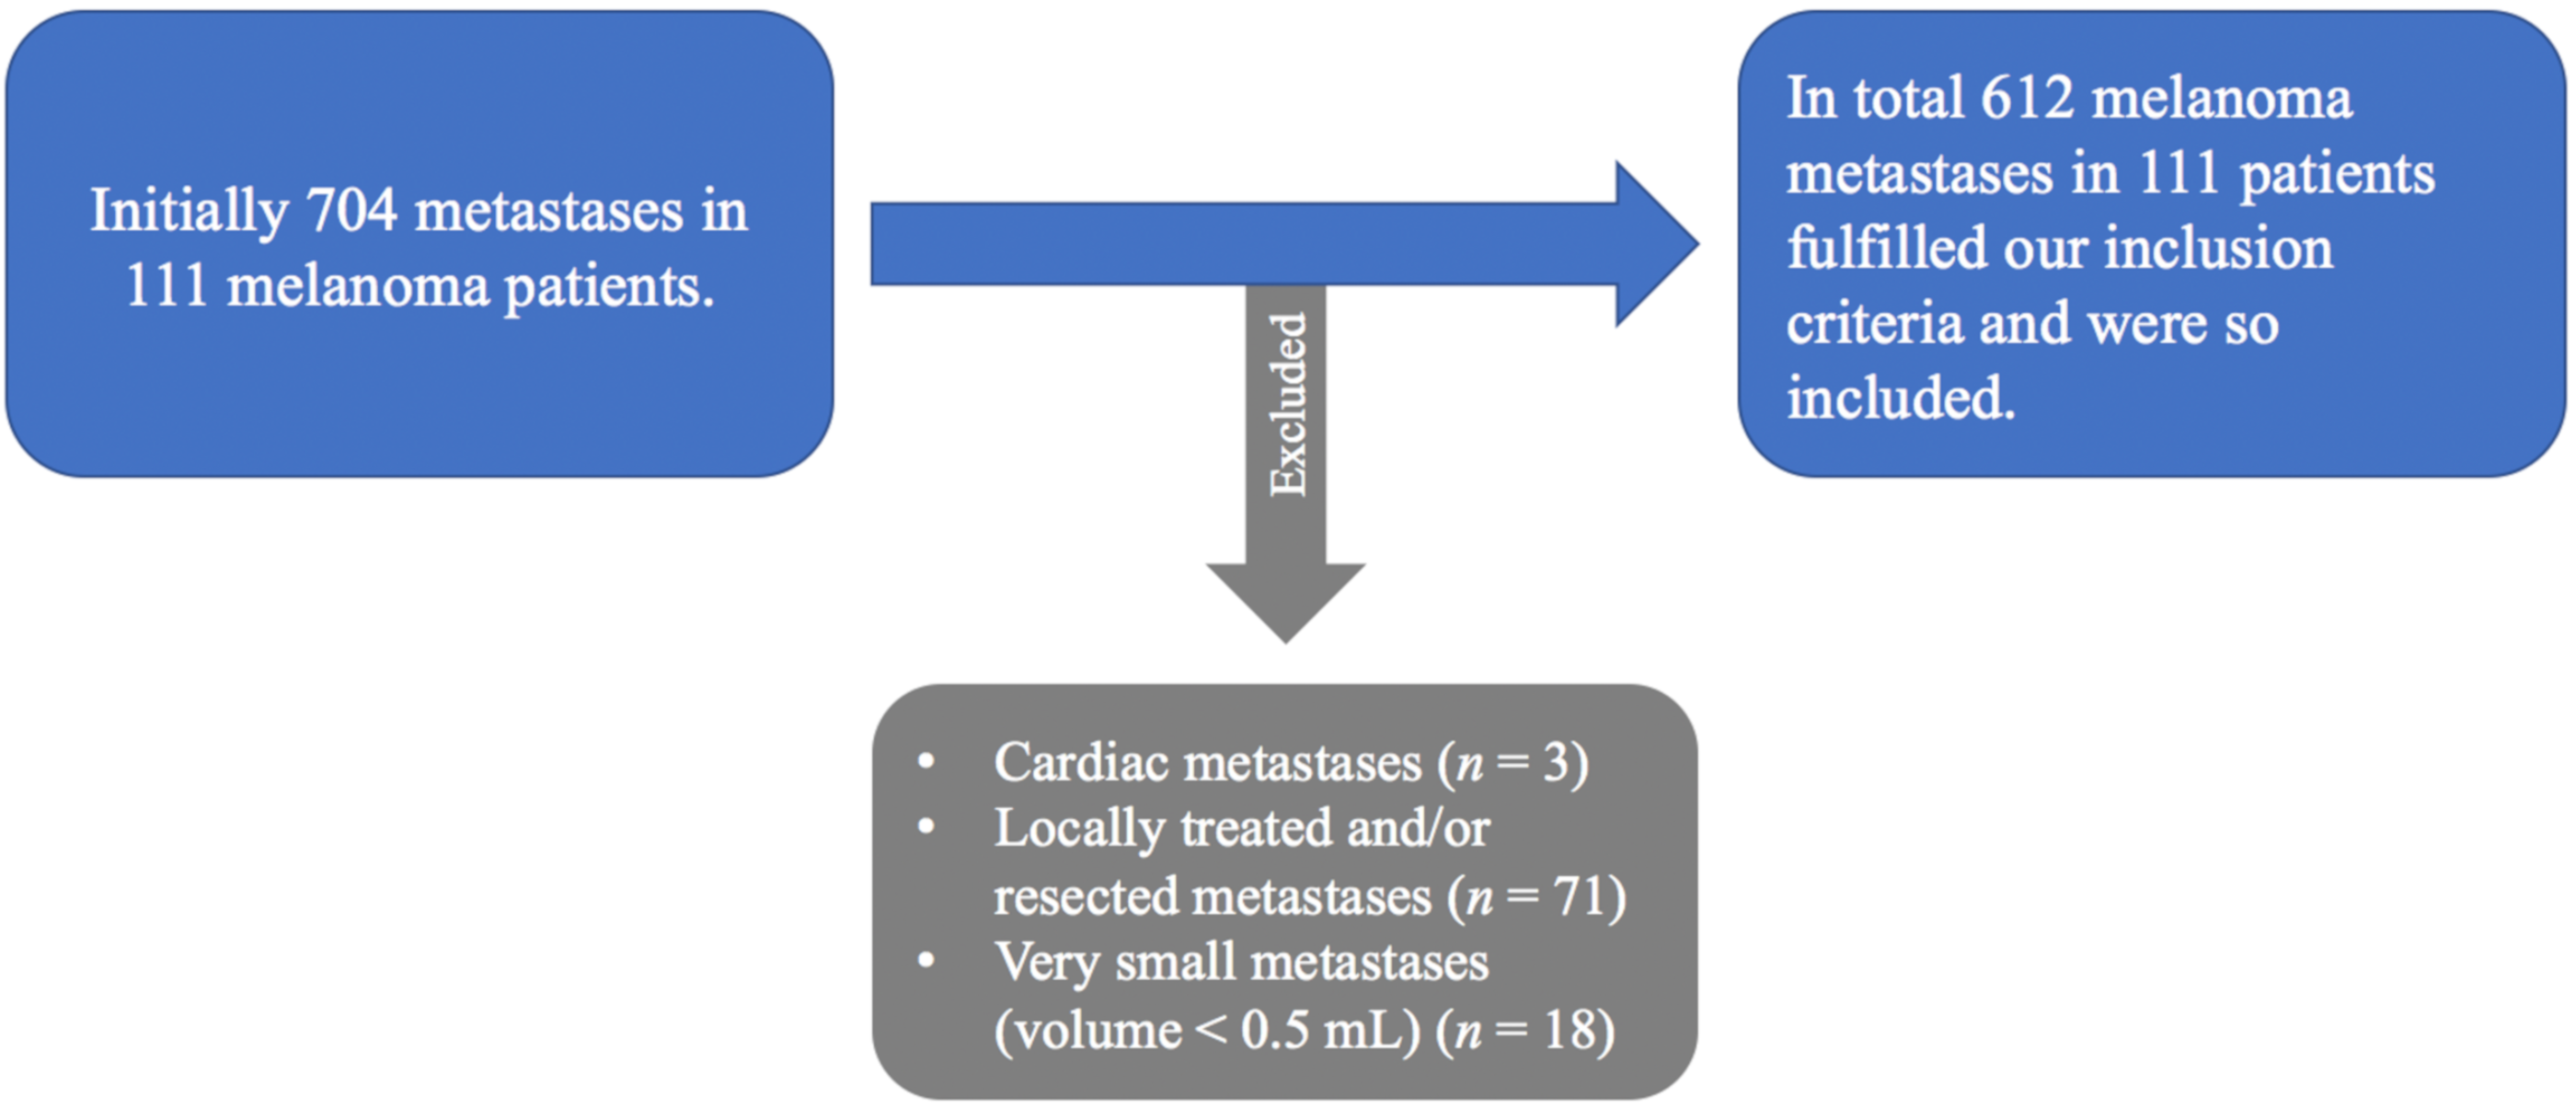
In order to optimize the accuracy and also the reproducibility of the measurements using a manual 3D-contouring tool following exclusion criteria were applied in accordance with the aim of the investigation.
Cardiac metastases were not included due to the surrounding physiological activity of the left ventricle and difficult morphological assignment on native computed tomography scans (n = 3).
Since the aim of the investigation was to predict the response to systemic immunotherapy and not local treatment locally treated or resected metastases during treatment were excluded (n = 71).
Finally, very small metastases at baseline (metastatic volume < 0.5 mL) were also not included (n = 18) in order to ensure accurate measurements using a manual 3D-contouring tool by two independent readers.
All segmented metastases could be divided according to their anatomical site into four groups: bone, liver, lung and soft tissue (including cutaneous/subcutaneous, muscular and lymph nodes metastases).
2.5. Treatment Response Assessment
2.5.1. Analysis at Metastasis-Level
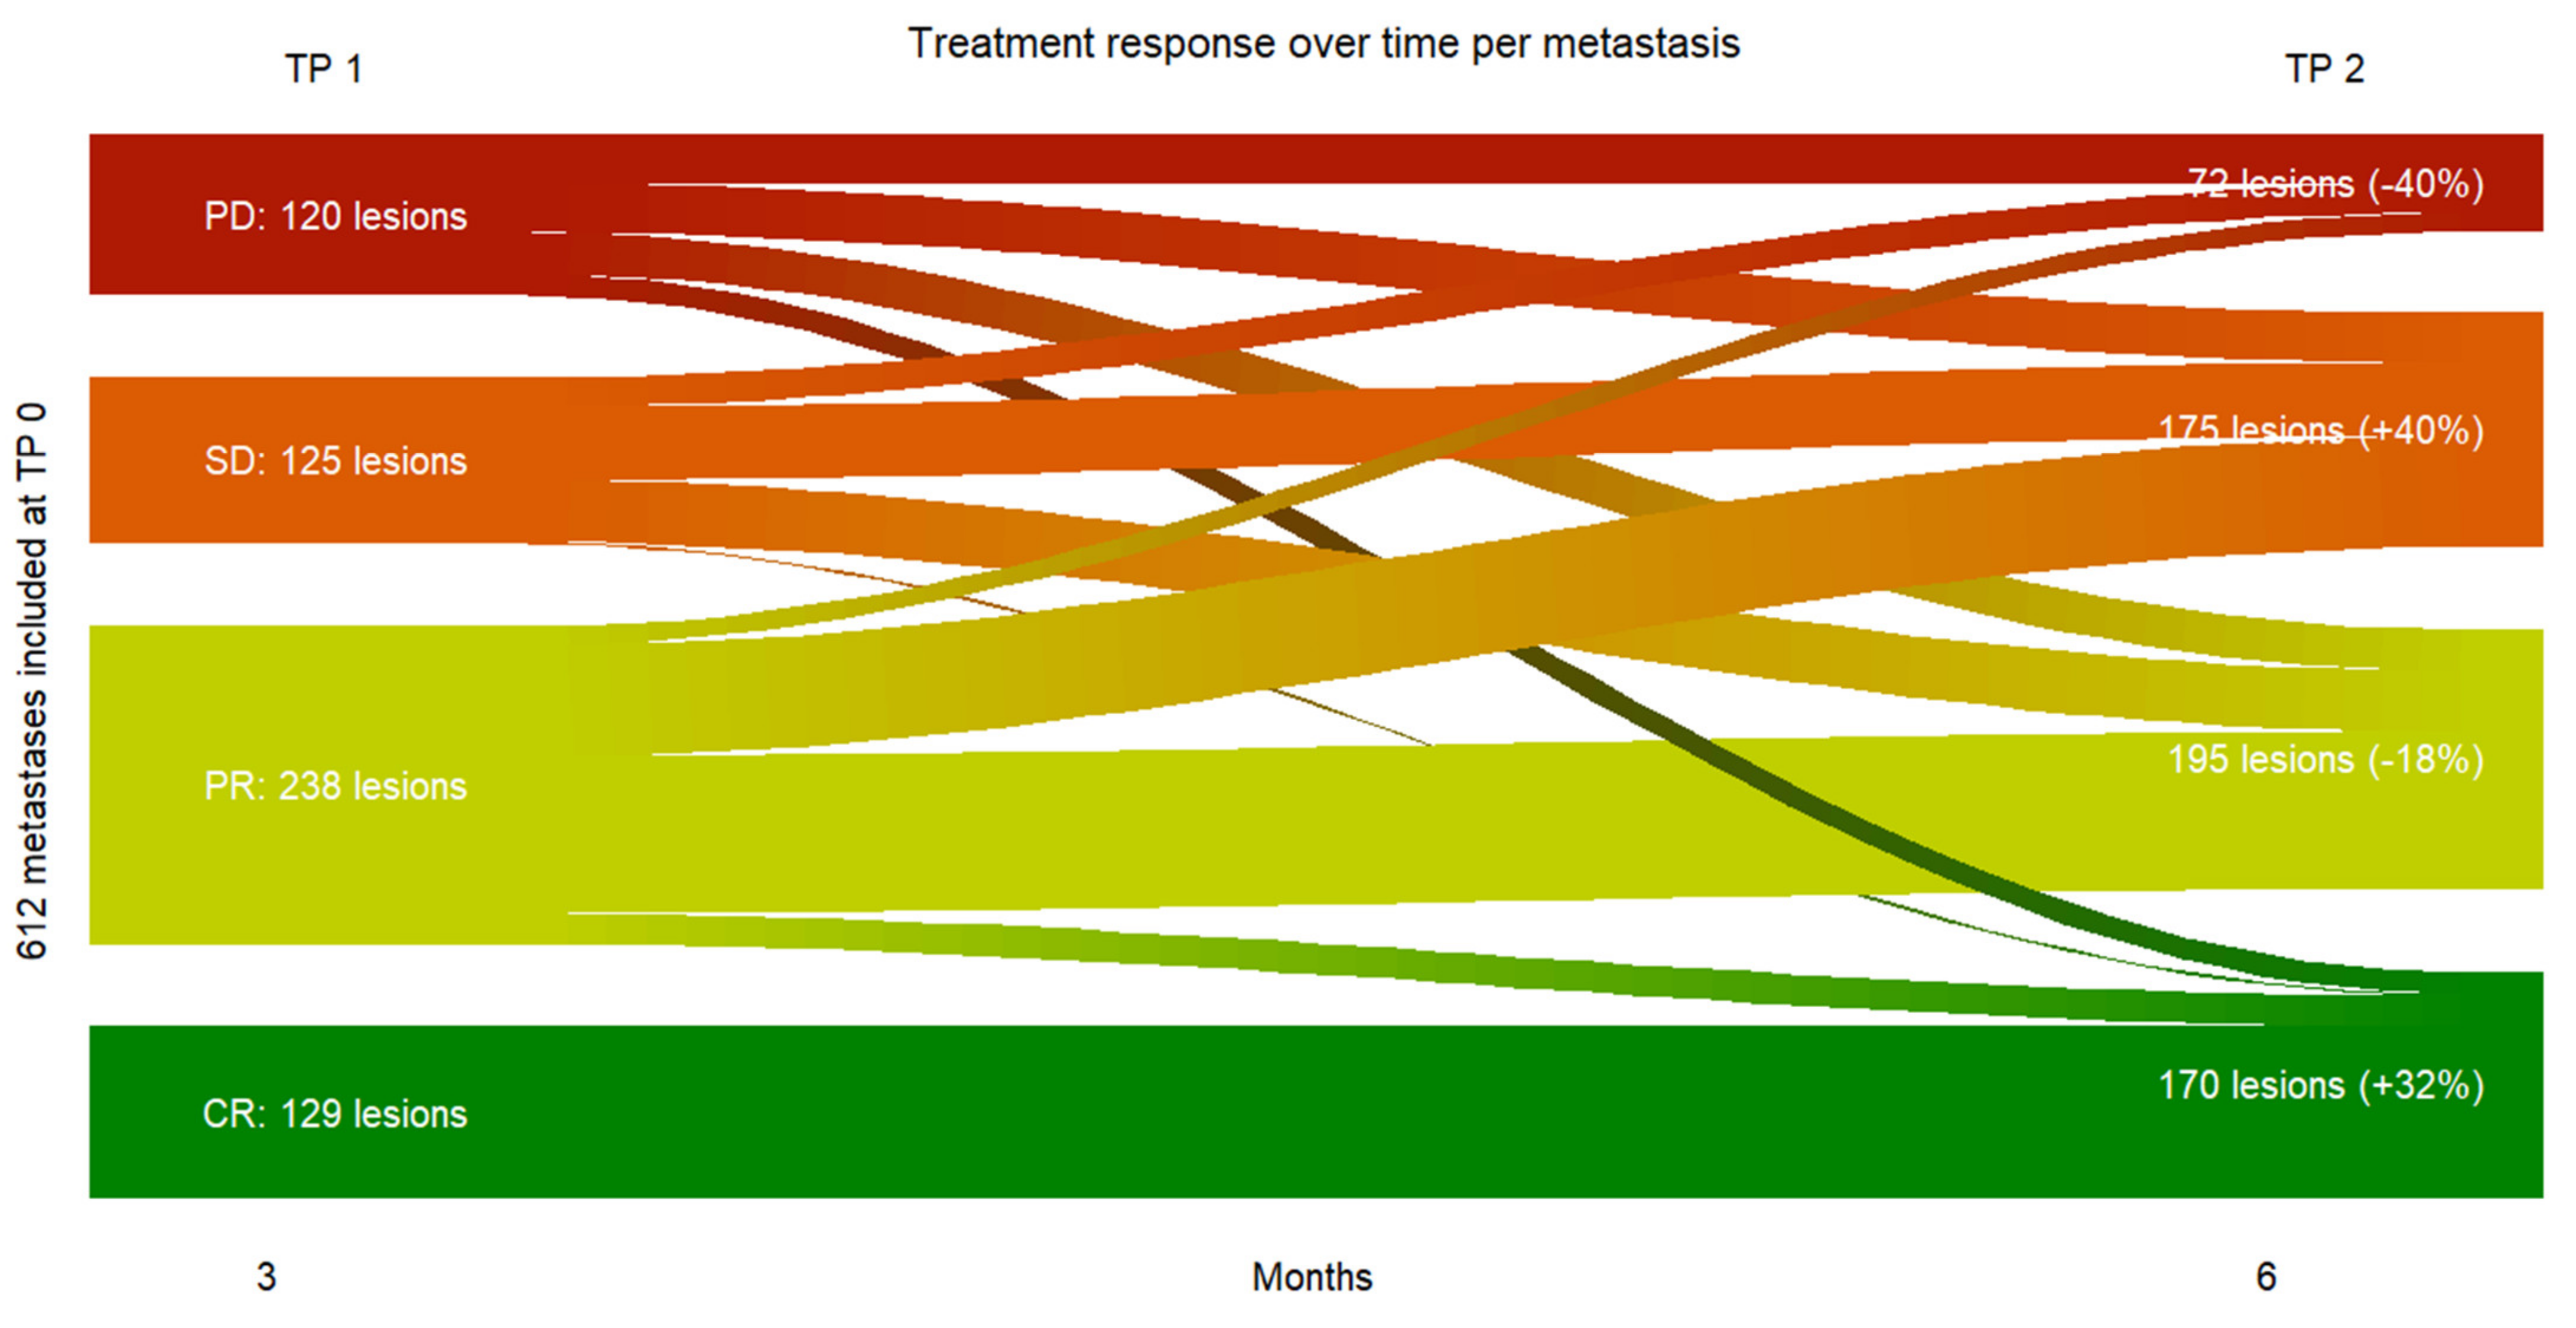
The response to immunotherapy was assessed at metastasis-level six months after treatment initiation TP 2 in order to minimize the risk of misinterpretation through pseudoprogression at 3 months TP 1.
A metastatic complete response CR was reached when the metastasis disappeared (i.e., not measurable).
A metastasis with a decrease ≥ 30% in the sum of diameters showed partial response PR.
A metastasis with an increase ≥ 20% in the sum of diameters showed progressive disease PD.
A metastasis was reported as stable disease SD in any case not qualifying for partial response or progressive disease.
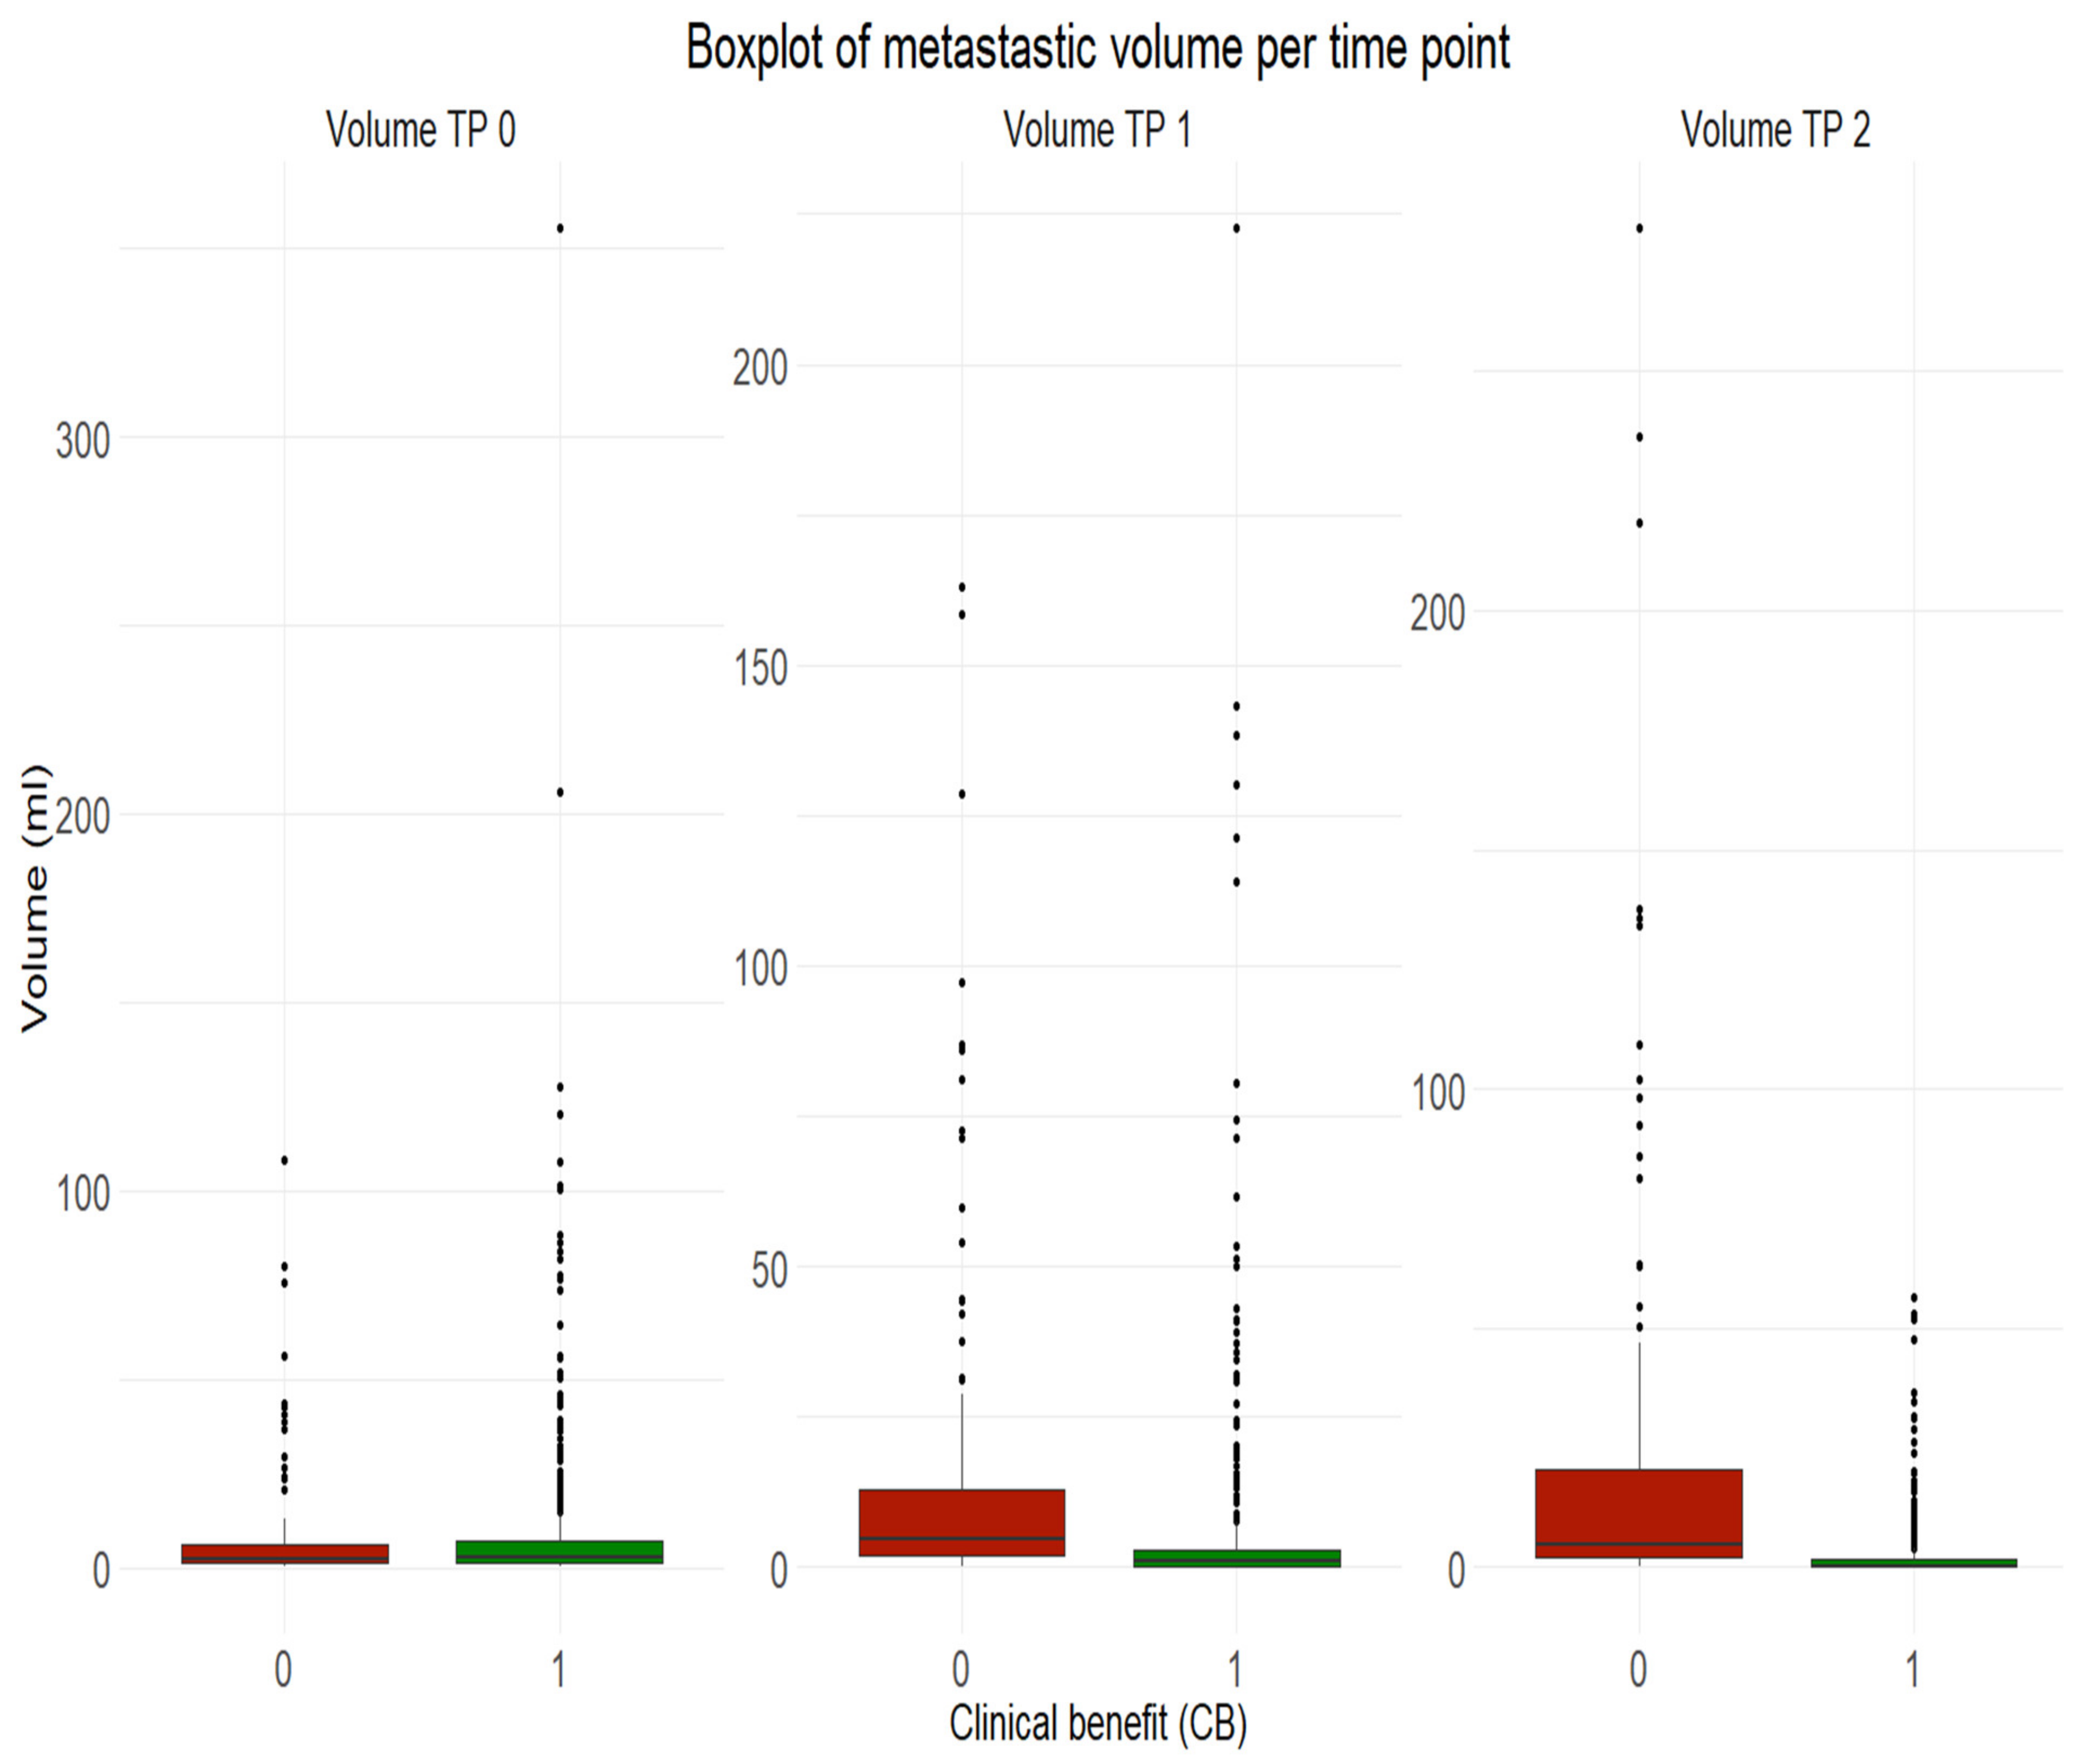
Subsequently, all metastases were dichotomized into two groups, respectively progressive metastases vs. non progressive metastases with clinical benefit CB 6 months after immunotherapy initiation (i.e., complete response CR; partial response PR; stable disease SD).
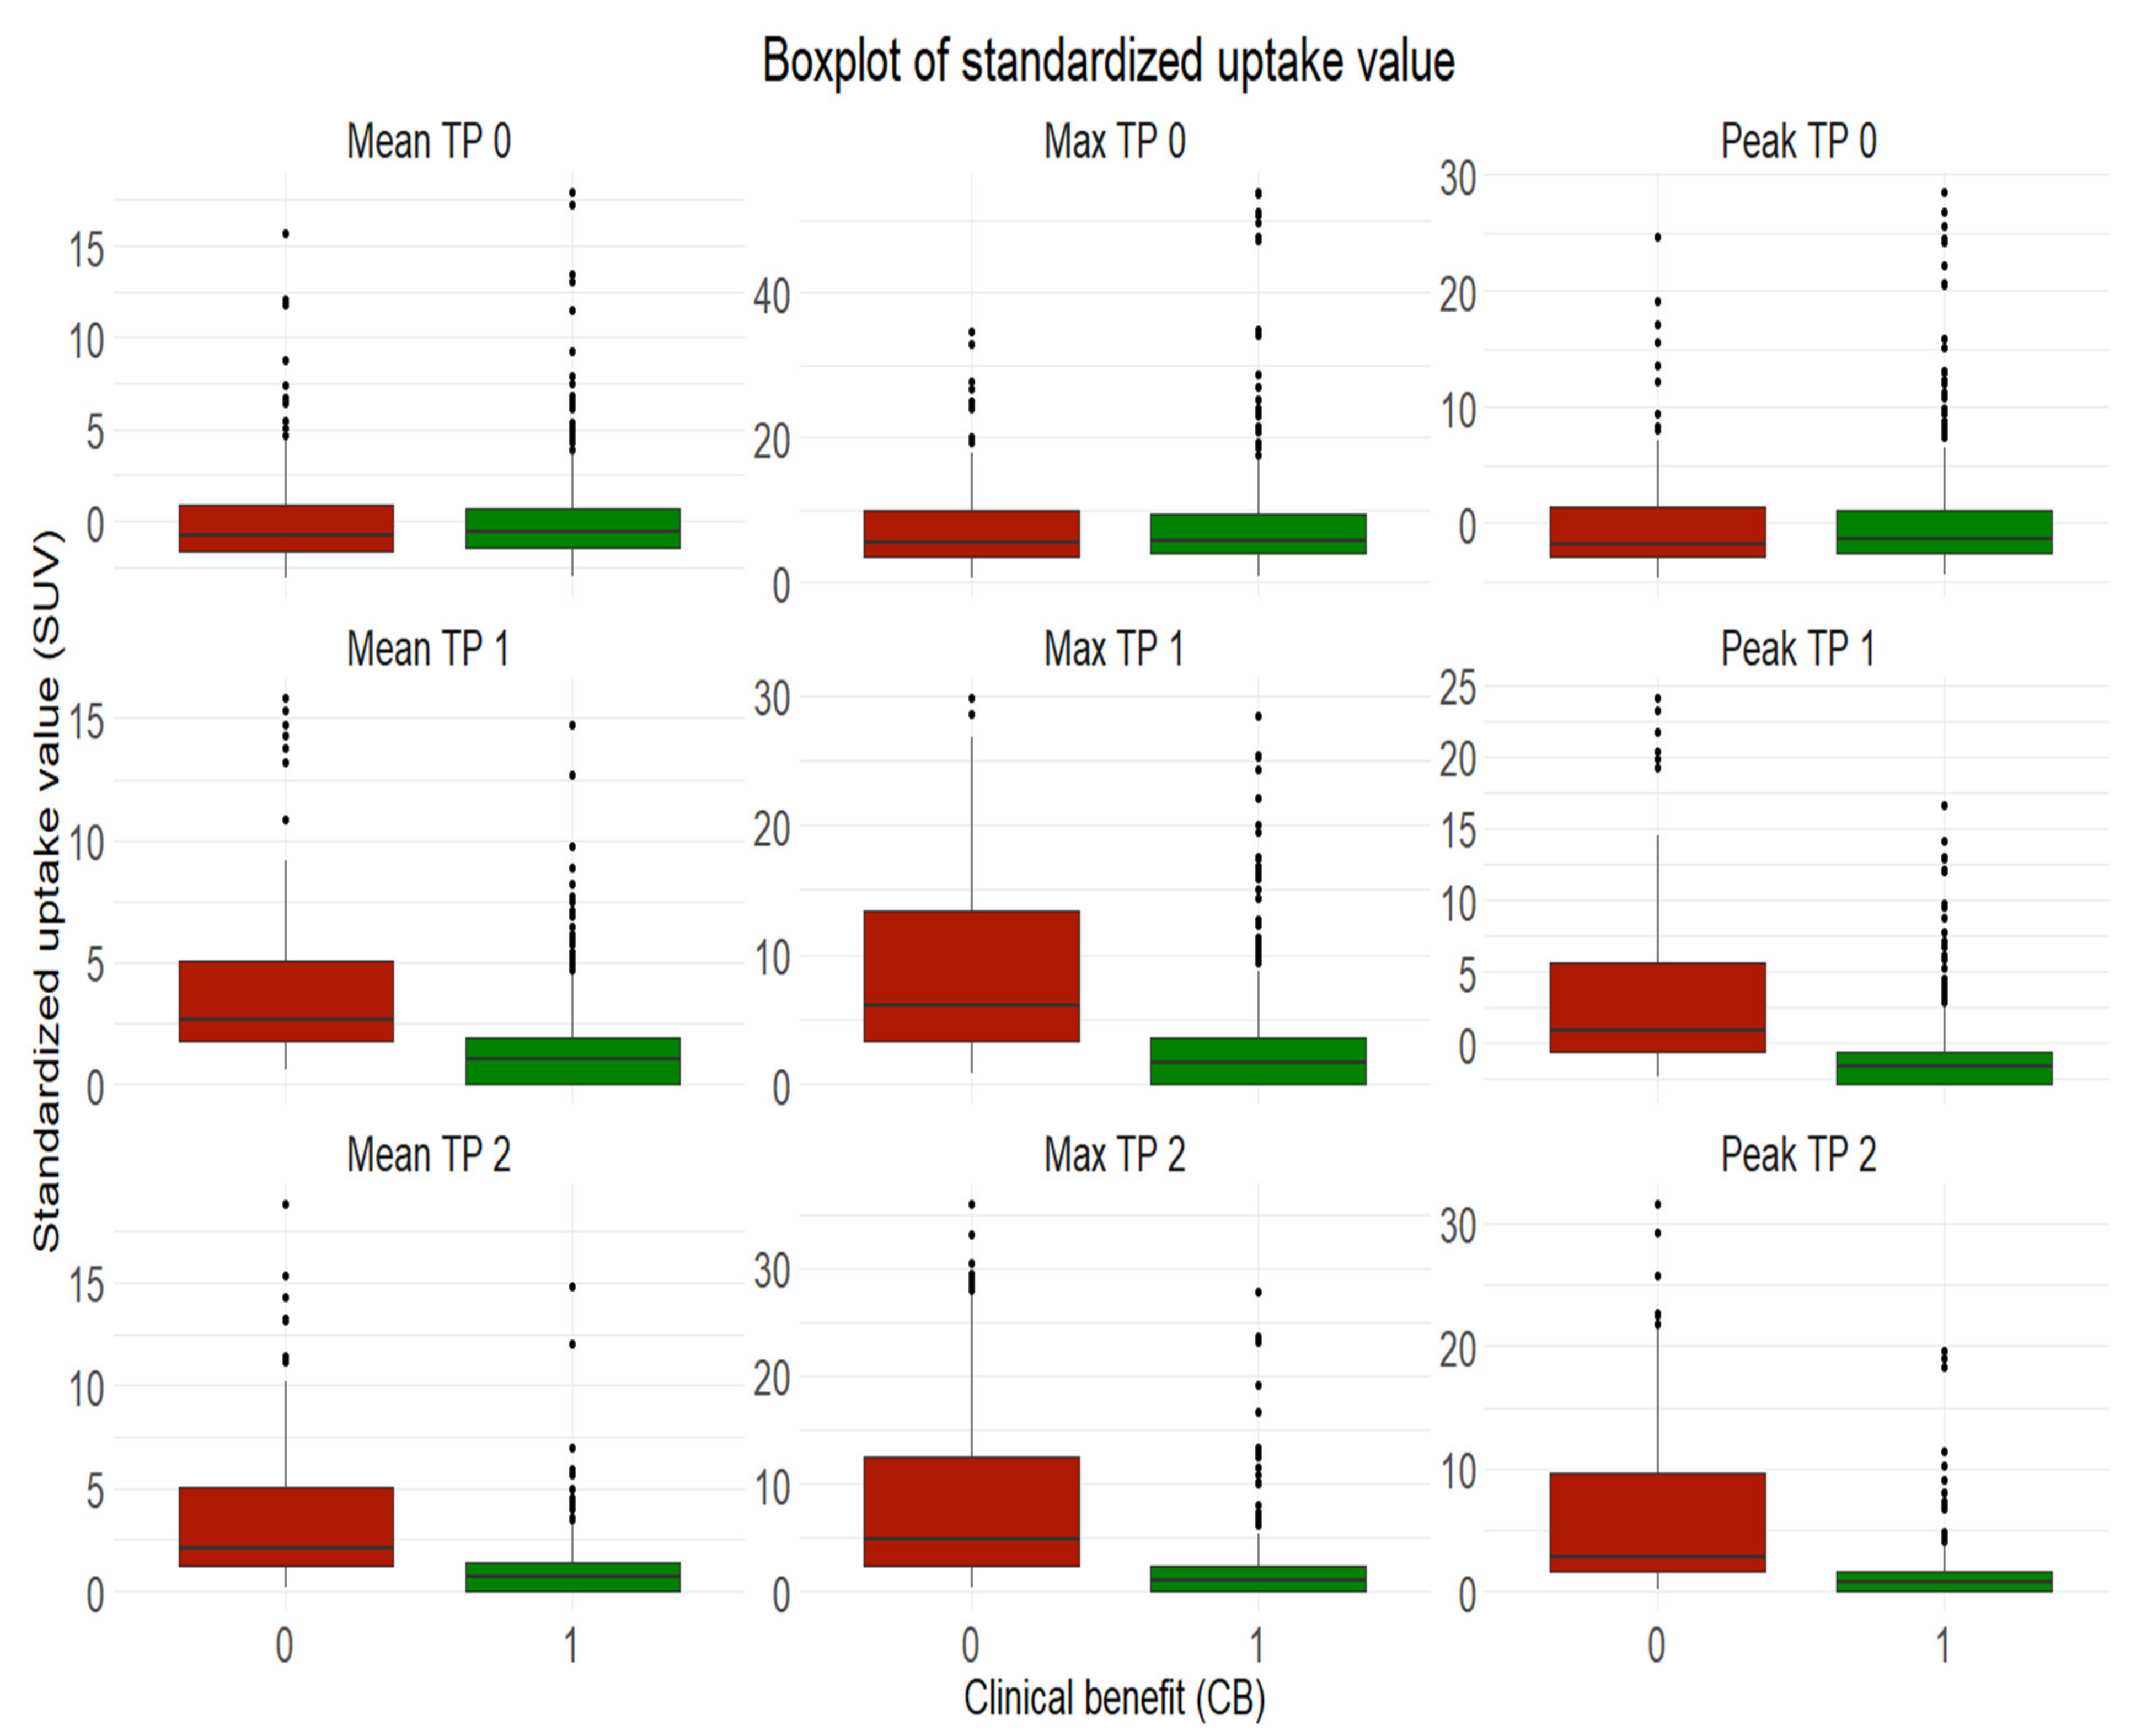
Finally, we investigated whether volume and standardized uptake values of metastases at TP 0 and TP 1 can be used to predict whether metastases benefit from treatment or show progressive disease six months after immunotherapy at TP 2.
2.5.2. Analysis at Patient-Level
The response to immunotherapy was also assessed at patient-level six months after treatment initiation TP 2 in order to minimize the risk of misinterpretation through pseudoprogression at 3 months TP 1.
A complete response CR was reached when the metastases disappeared (i.e., not measurable).
A partial response PR was reached when the metastases showed a decrease ≥ 30% in the sum of diameters.
A progressive disease PD was reached when metastases showed an increase ≥ 20% in the sum of diameters.
A stable disease SD was reached in any case not qualifying for partial response or progressive disease.
Subsequently, all included patients were dichotomized into two groups, respectively patients with clinical benefit CB 6 months after immunotherapy initiation (i.e., complete response CR; partial response PR; stable disease SD) vs. patients with no clinical benefit (progressive disease PD).
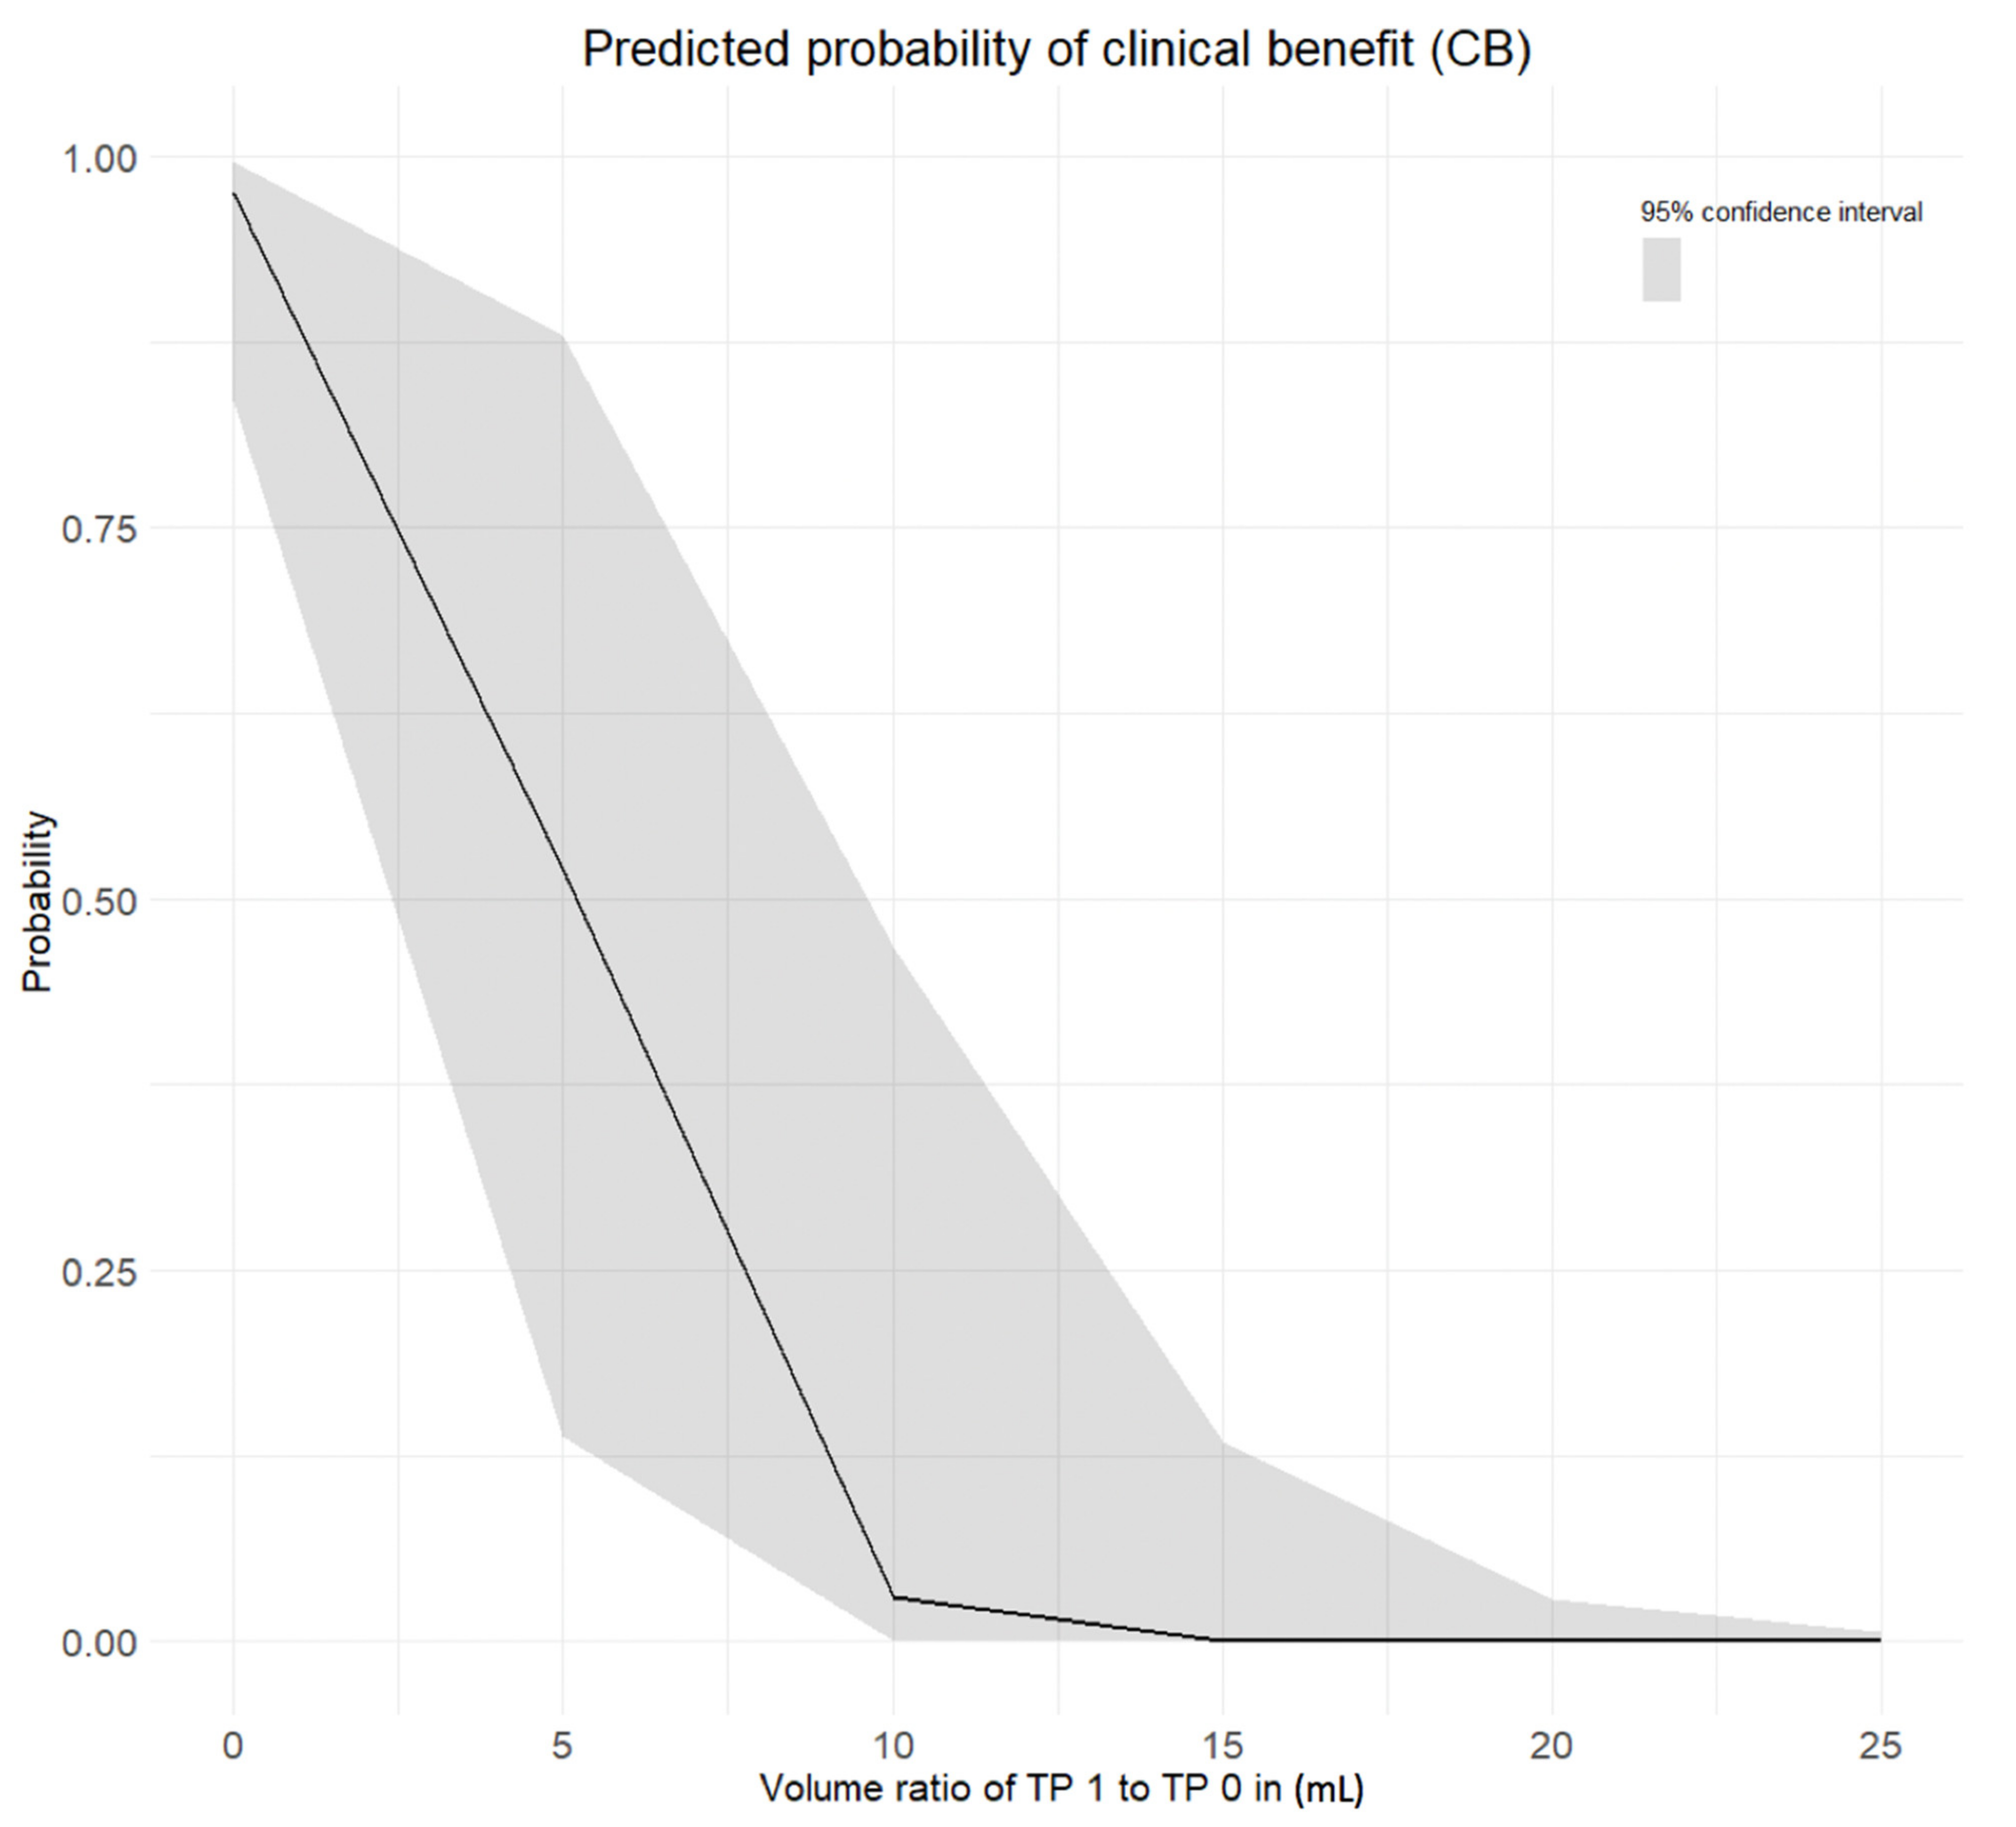
Finally, we investigated whether total tumor volume, total metabolic tumor volume and total lesion glycolysis of all metastases at TP 0 and TP 1 can be used to predict whether patient would benefit from treatment or show progressive disease six months after immunotherapy at TP 2.
2.5.3. Statistical Analysis
Statistical analysis was performed in R (version 3.3.3, R core team). An analysis of variance (ANOVA) was carried out in order to investigate, whether the use of four different single-center PET/CT scanners had an influence on the semiquantitative parameters. For outcome prediction at metastasis-level a binominal logistic regression was used with patient and anatomical site of metastasis as random effects independent of one another. For outcome prediction on a patient-level, a stepwise regression (backward selection) was used. Statistical significance was accepted at p < 0.050.
4. Discussion
The value of semiquantitative parameters on FDG-PET/CT scans to predict treatment response has been extensively discussed in the literature for several malignancies albeit with a lack of evidence in large cohorts of melanoma patients [
11,
12,
13,
14,
15].
We aimed to investigate whether metastatic volume and semiquantitative parameters on FDG-PET/CT scans performed at baseline TP 0 and three months after initiation of immunotherapy TP 1 can be used at metastasis- and patient-level to predict the outcome six months after initiation of immune checkpoint inhibition TP 2 in a large cohort of metastatic melanoma patients.
First of all, our results provided evidence at metastasis-level, that a vast majority of melanoma metastases did respond to immune checkpoint inhibition in the first six months since only 11.8 % of all metastases at TP 2 were progressive vs. 88.2% non-progressive metastases with clinical benefit.
Our results also suggested that the initial volume of melanoma metastases shouldn’t be used for treatment outcome prediction at metastasis-level, given similar median values of volume between progressive metastases and non-progressive metastases with clinical benefit at baseline. However, initial SUVmean and SUVpeak of melanoma metastases can be indicative of treatment response or resistance at metastasis-level but shouldn’t be considered alone given the lower prediction power.
Our results provided strong evidence that metastatic SUVpeak and early volume changes have a strong power to predict the response to therapy at metastasis-level.
Clinical parameters can also be taken into account as part of the analysis at metastasis-level. Although bone metastasis only represented 7% of all included metastasis at TP 0, their presence seemed to have a negative influence on the outcome at TP 2, especially in women showing the lowest likelihood of clinical benefit compared to other metastasis entities. Also, the occurrence of new metastases at TP 1 seemed to be a negative predictive biomarker.
The prognostic power of semiquantitative parameters in context of melanoma has been controversial discussed in recent investigations mostly performed in smaller cohorts.
In a retrospective review published in 2016 including 41 melanoma patients pretreatment SUVmax was found to be significantly higher in non-survivors than in survivors, but also higher in patients with recurrence than patients without recurrence. Besides the smaller cohort, Son et al. measured SUVmax, metabolic tumor volume MTV and total lesion glycolysis TLG of the primary tumor, while we exclusively considered metastatic parameters since the primary tumor was already resected when the pretreatment FDG-PET/CT scan was performed to detect distant metastasis. Furthermore, the authors assessed treatment outcome using disease-free-survival DFS and melanoma-specific-survival MSS following all included patients over five years [
14], while we defined clinical benefit and no clinical benefit based on FDG-PET/CT scans performed six months after treatment.
A retrospective study published in 2019 including 55 melanoma patients reported that SUVmax was not predictive of outcome. Semiquantitative parameters (SUVmax, SUVmean, MTV and TLG) were not manually as we did but automatically measured using a software for each included lesion. Furthermore, the treatment outcome after single immune checkpoint inhibition with anti-PD1 only was defined by the overall survival OS, progression free survival PFS and best overall response BOR with a median follow-up of 20 months [
13], while we focused on early treatment outcome six months after start of single- or double-checkpoint inhibition based on FDG-PET/CT scans only.
In 2020 Dittrich et al. investigated retrospectively in 26 melanoma patients treated either with vemurafenib (
n = 9) or ipilimumab (
n = 17) the prognostic power of standardized uptake values [
15]. In contrast to our methodology standardized uptake values were measured automatically and not manually for each included lesion on FDG-PET/CT scans pretreatment and 12 weeks after treatment start. SUVmax and SUVmean showed in patients treated with vemurafenib only a significant prediction power [
15].
However, an additional analysis on a patient-level appeared clinically more relevant, as part of the discussion in the interdisciplinary tumor board.
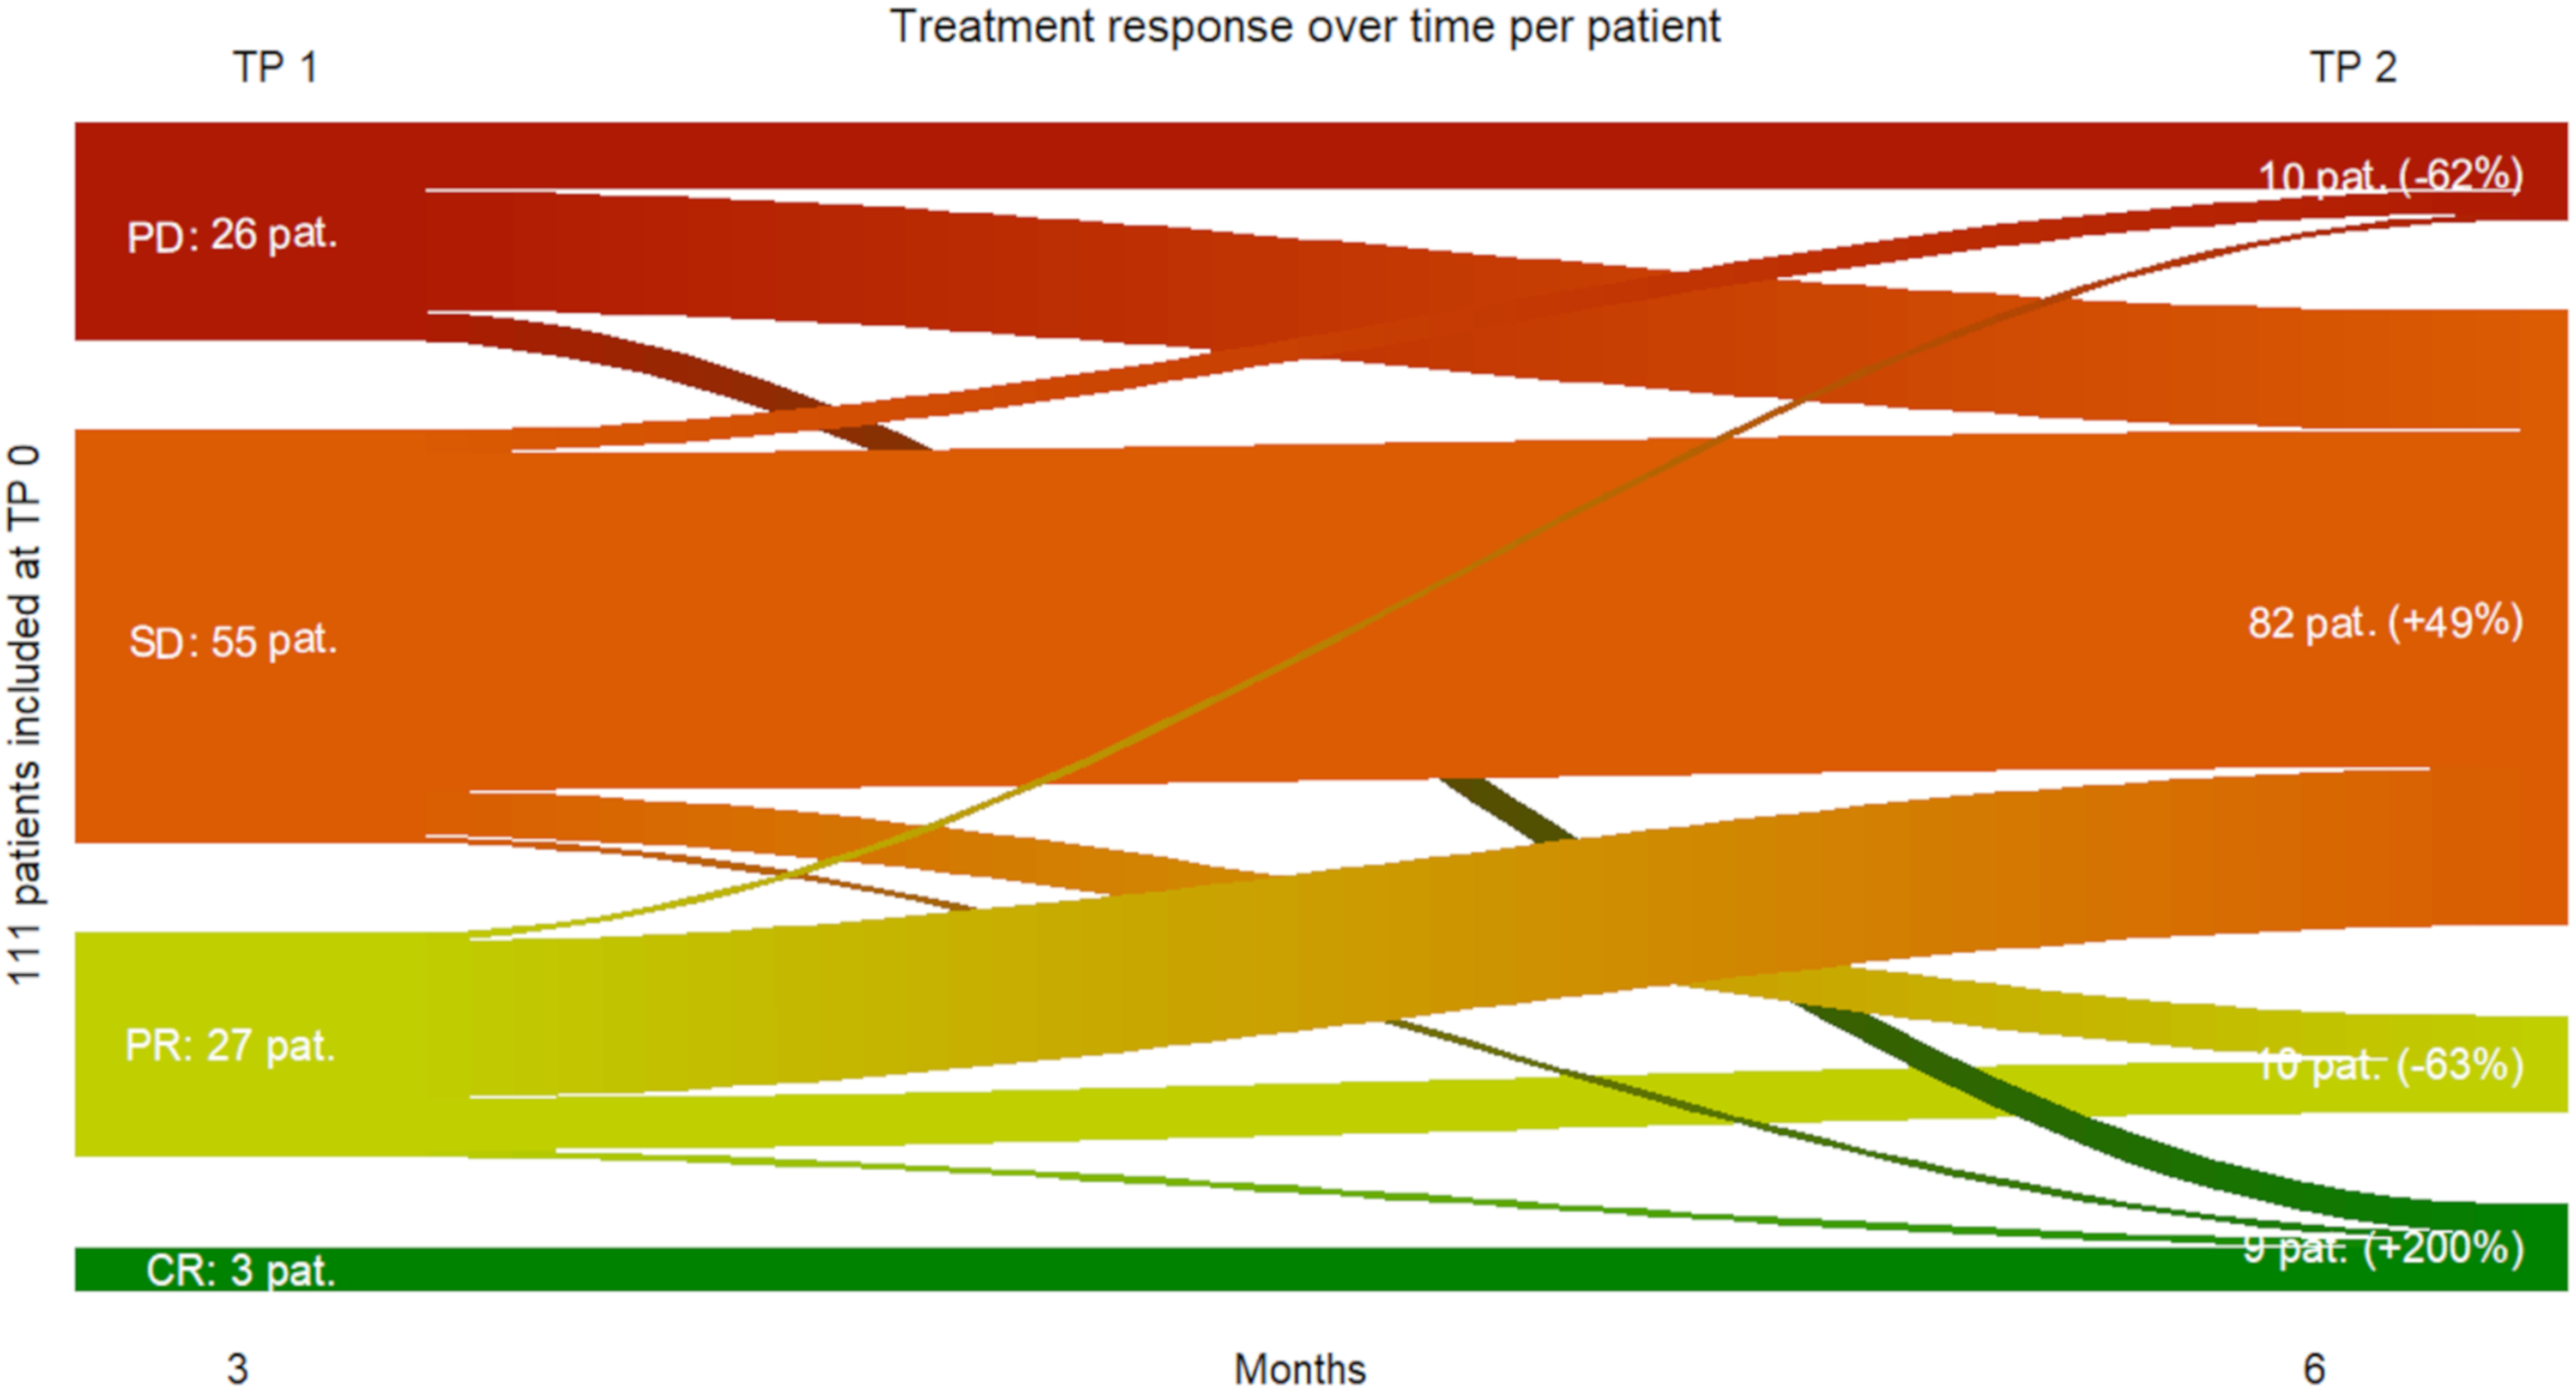
Our results provided evidence that 90 % of all included metastatic melanoma patients (n = 101) benefited from immune checkpoint inhibition six months after treatment start (i.e., no disease progression under treatment), while 10 % displayed progressive disease at the same time. Furthermore, total tumor volume and number of metastases at baseline did not show any predictive power, suggesting that metastatic melanoma patients with higher tumor load initially can still benefit from immunotherapy.
Three months after treatment initiation, total tumor volume, total MTV and TLG of all metastases can be used as strong negative predictive biomarkers for treatment response six months after treatment start. Interestingly, the occurrence of immune-related adverse events during the first six months of immunotherapy did not show any predictive power for early response, implying, that patients presenting early immune related side effects can still benefit from the ongoing treatment. Also, our results provided strong evidence, that early complete response on a metastasis- and patient-level seems to be predictive for lasting complete response. Tan et al. observed in their investigations published in 2018, that a small proportion of all included patients (
n = 104) reached a complete response at one year [
16]. However, the vast majority of these patients had long lasting response to therapy (median follow-up 30.1 months) [
16]. Interestingly, early progressive disease on a metastasis- and patient-level three months after treatment start does not exclude subsequent clinical benefit under ongoing immune checkpoint inhibition, since some patients initially displaying progressive disease three months after treatment initiation showed a stable disease to complete response three months later. Furthermore, bone metastases were negative predictors for response. These results are in accordance with recent investigations published in 2020. Da Silva et al. reported that different anatomical metastatic locations may display different response patterns and so influence overall response and survival under dual immunotherapy, highlighting the importance of personalized treatment [
17].
Finally, clinical parameters, such as age and female sex were also negative predictive biomarkers with lower prediction power.
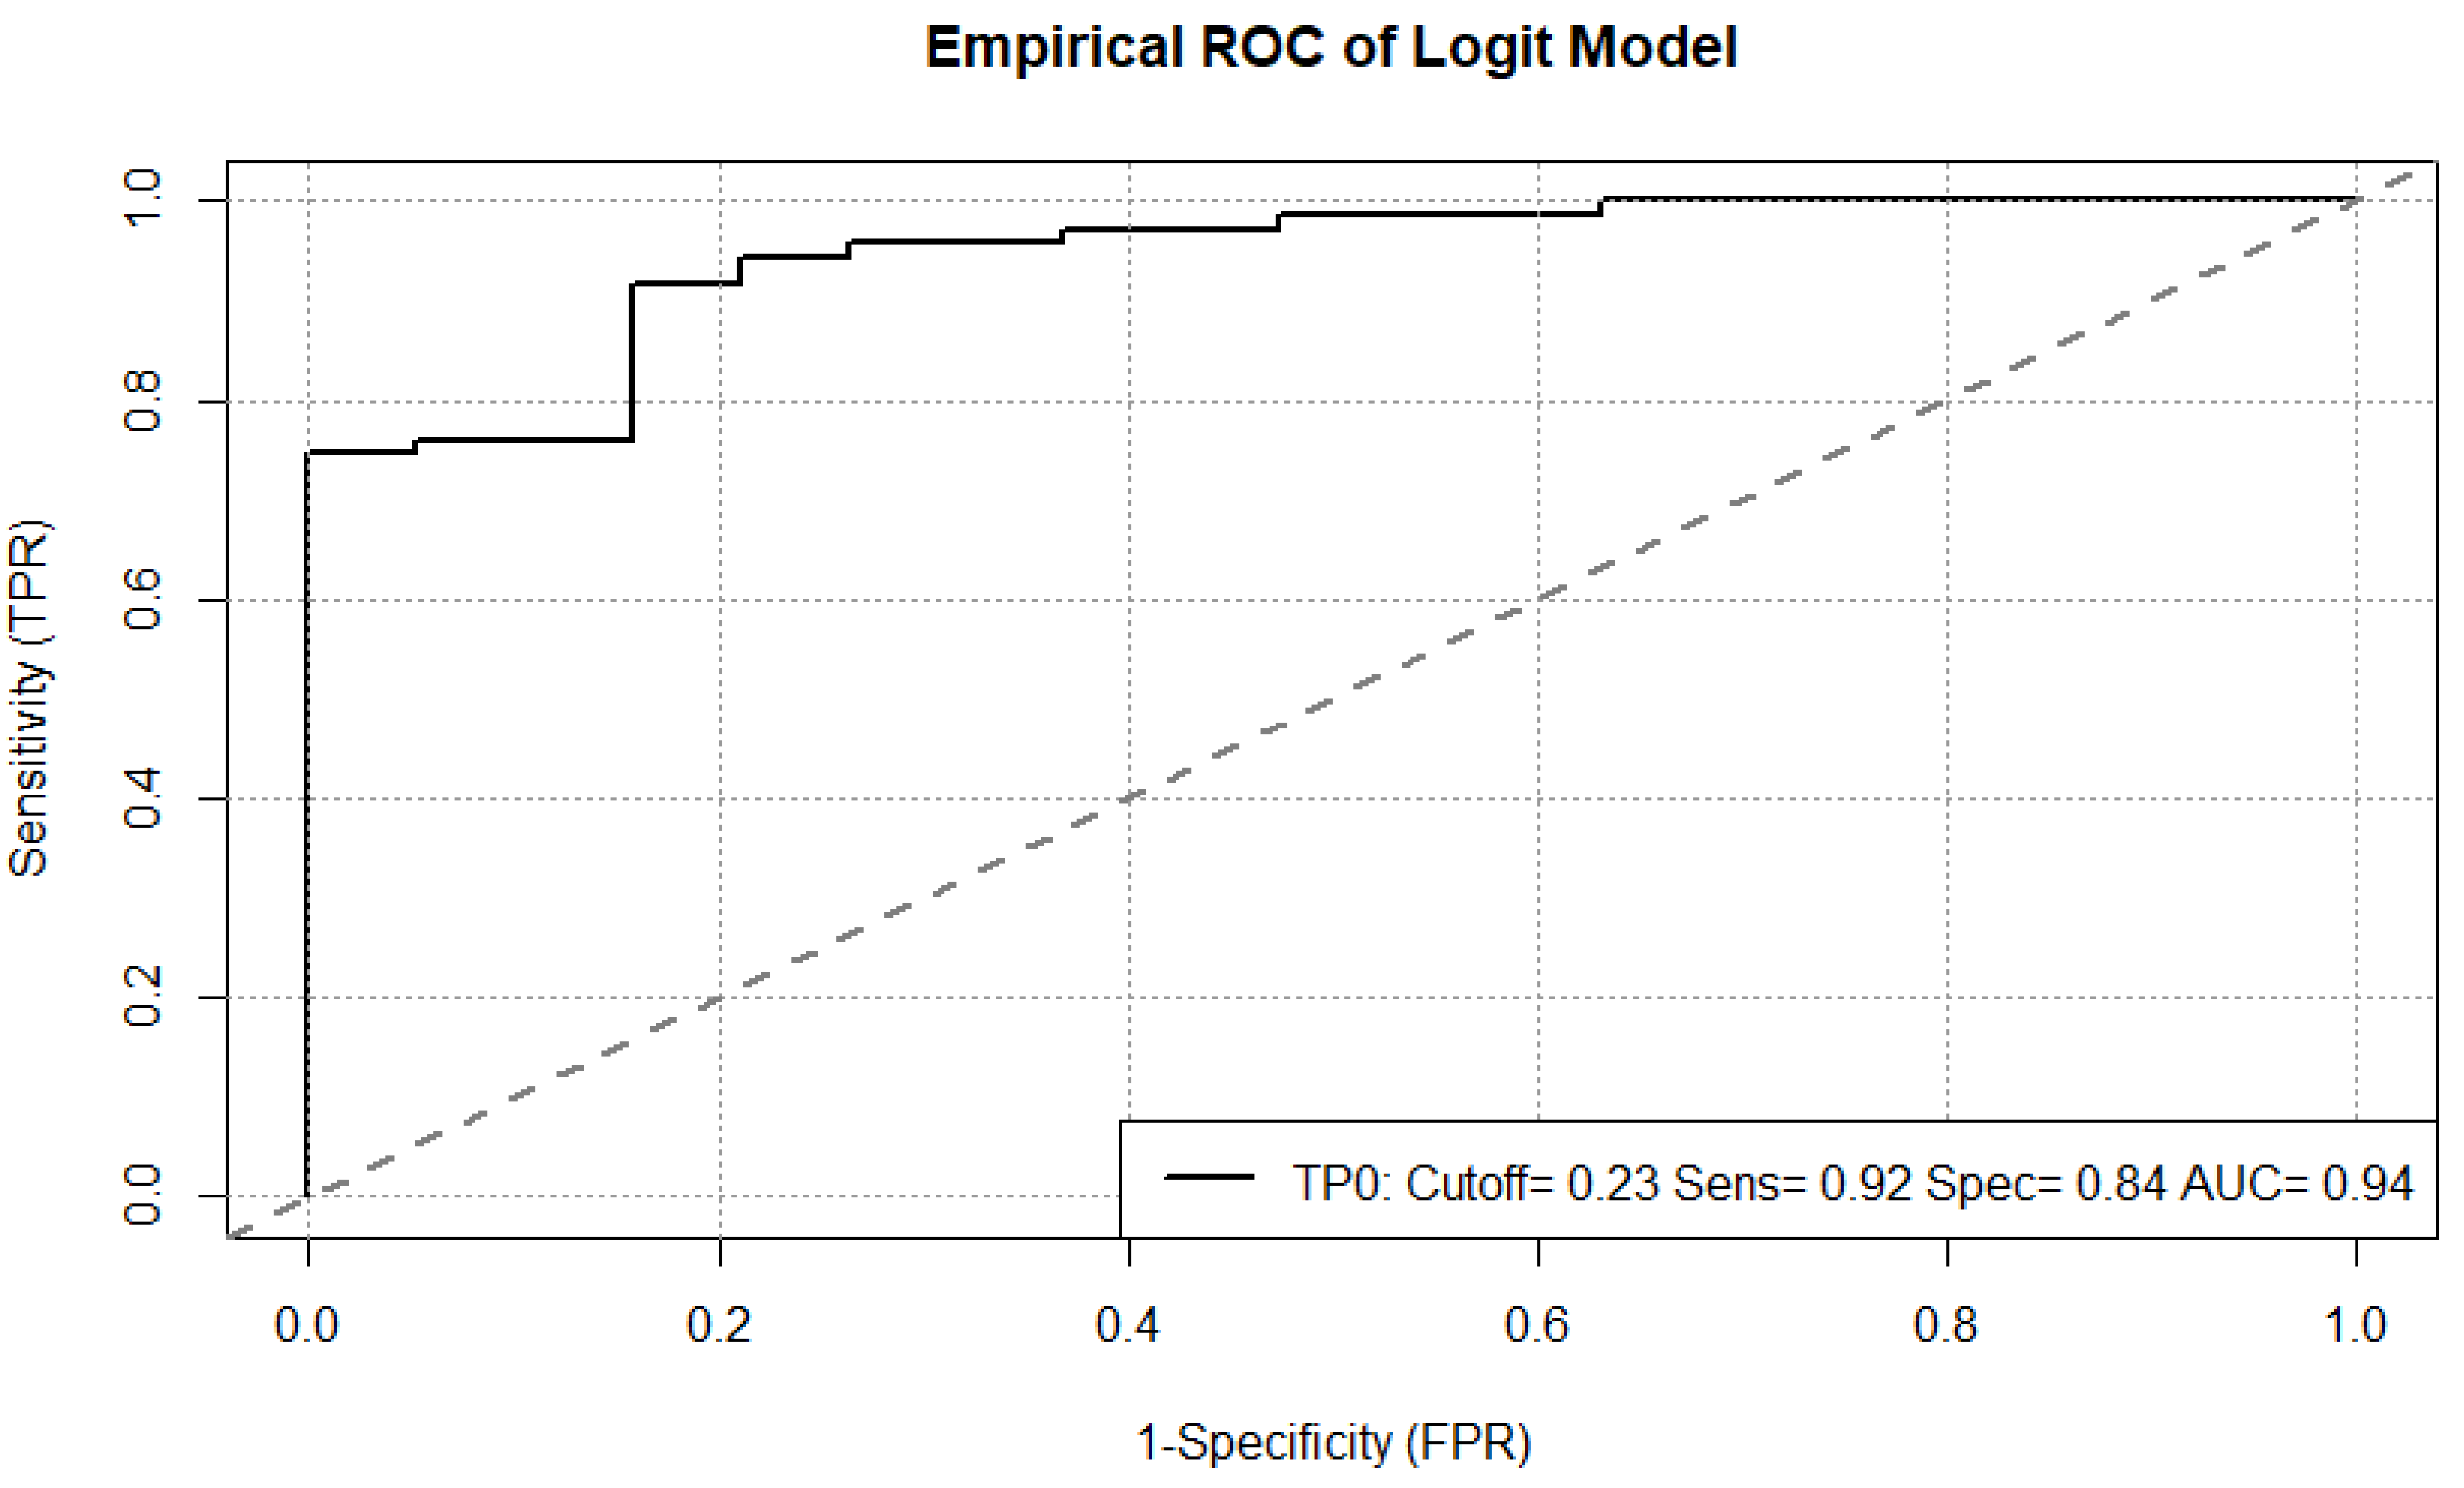
Our results bring innovative and clinically relevant insights to light in knowledge of the current controversial literature. Besides the important size of our cohort, our results provide strong evidence, a prediction of early response to immune checkpoint inhibition using FDG-PET/CT is possible with a low estimated prediction error. Additionally, we have highlighted the importance of an accurate timing for outcome prediction since we have reported a different prediction power pretreatment TP 0 and during treatment TP 1 at metastasis- and patient-level.
The main limitation of this study includes its single-center retrospective design with images acquired on different PET/CT scanners from 2013 to 2019. Four different PET/CT scanners by GE were used over time, i.e., Discovery ST16 und VCT (2013–2017), Discovery 690 (2013–2019) and Discovery DMI (2017–2019), which could have influenced the measurement of PET semiquantitative parameters, despite calibration and cross-calibration of the used scanners.
These results will be confronted with long-term outcome results (based on overall survival OS and progression free survival PFS) in a larger population of metastatic melanoma patients in a separate investigation in kind cooperation with our department of dermatology.


 ,
, 


