
Quantitative Assessment of the Echogenicity of a Breast Tumor Predicts the Response to Neoadjuvant Chemotherapy


Abstract
:Simple Summary
Abstract
1. Introduction
2. Materials and Methods
2.1. Patients
2.2. Histology
2.3. Ultrasonic Data Registration
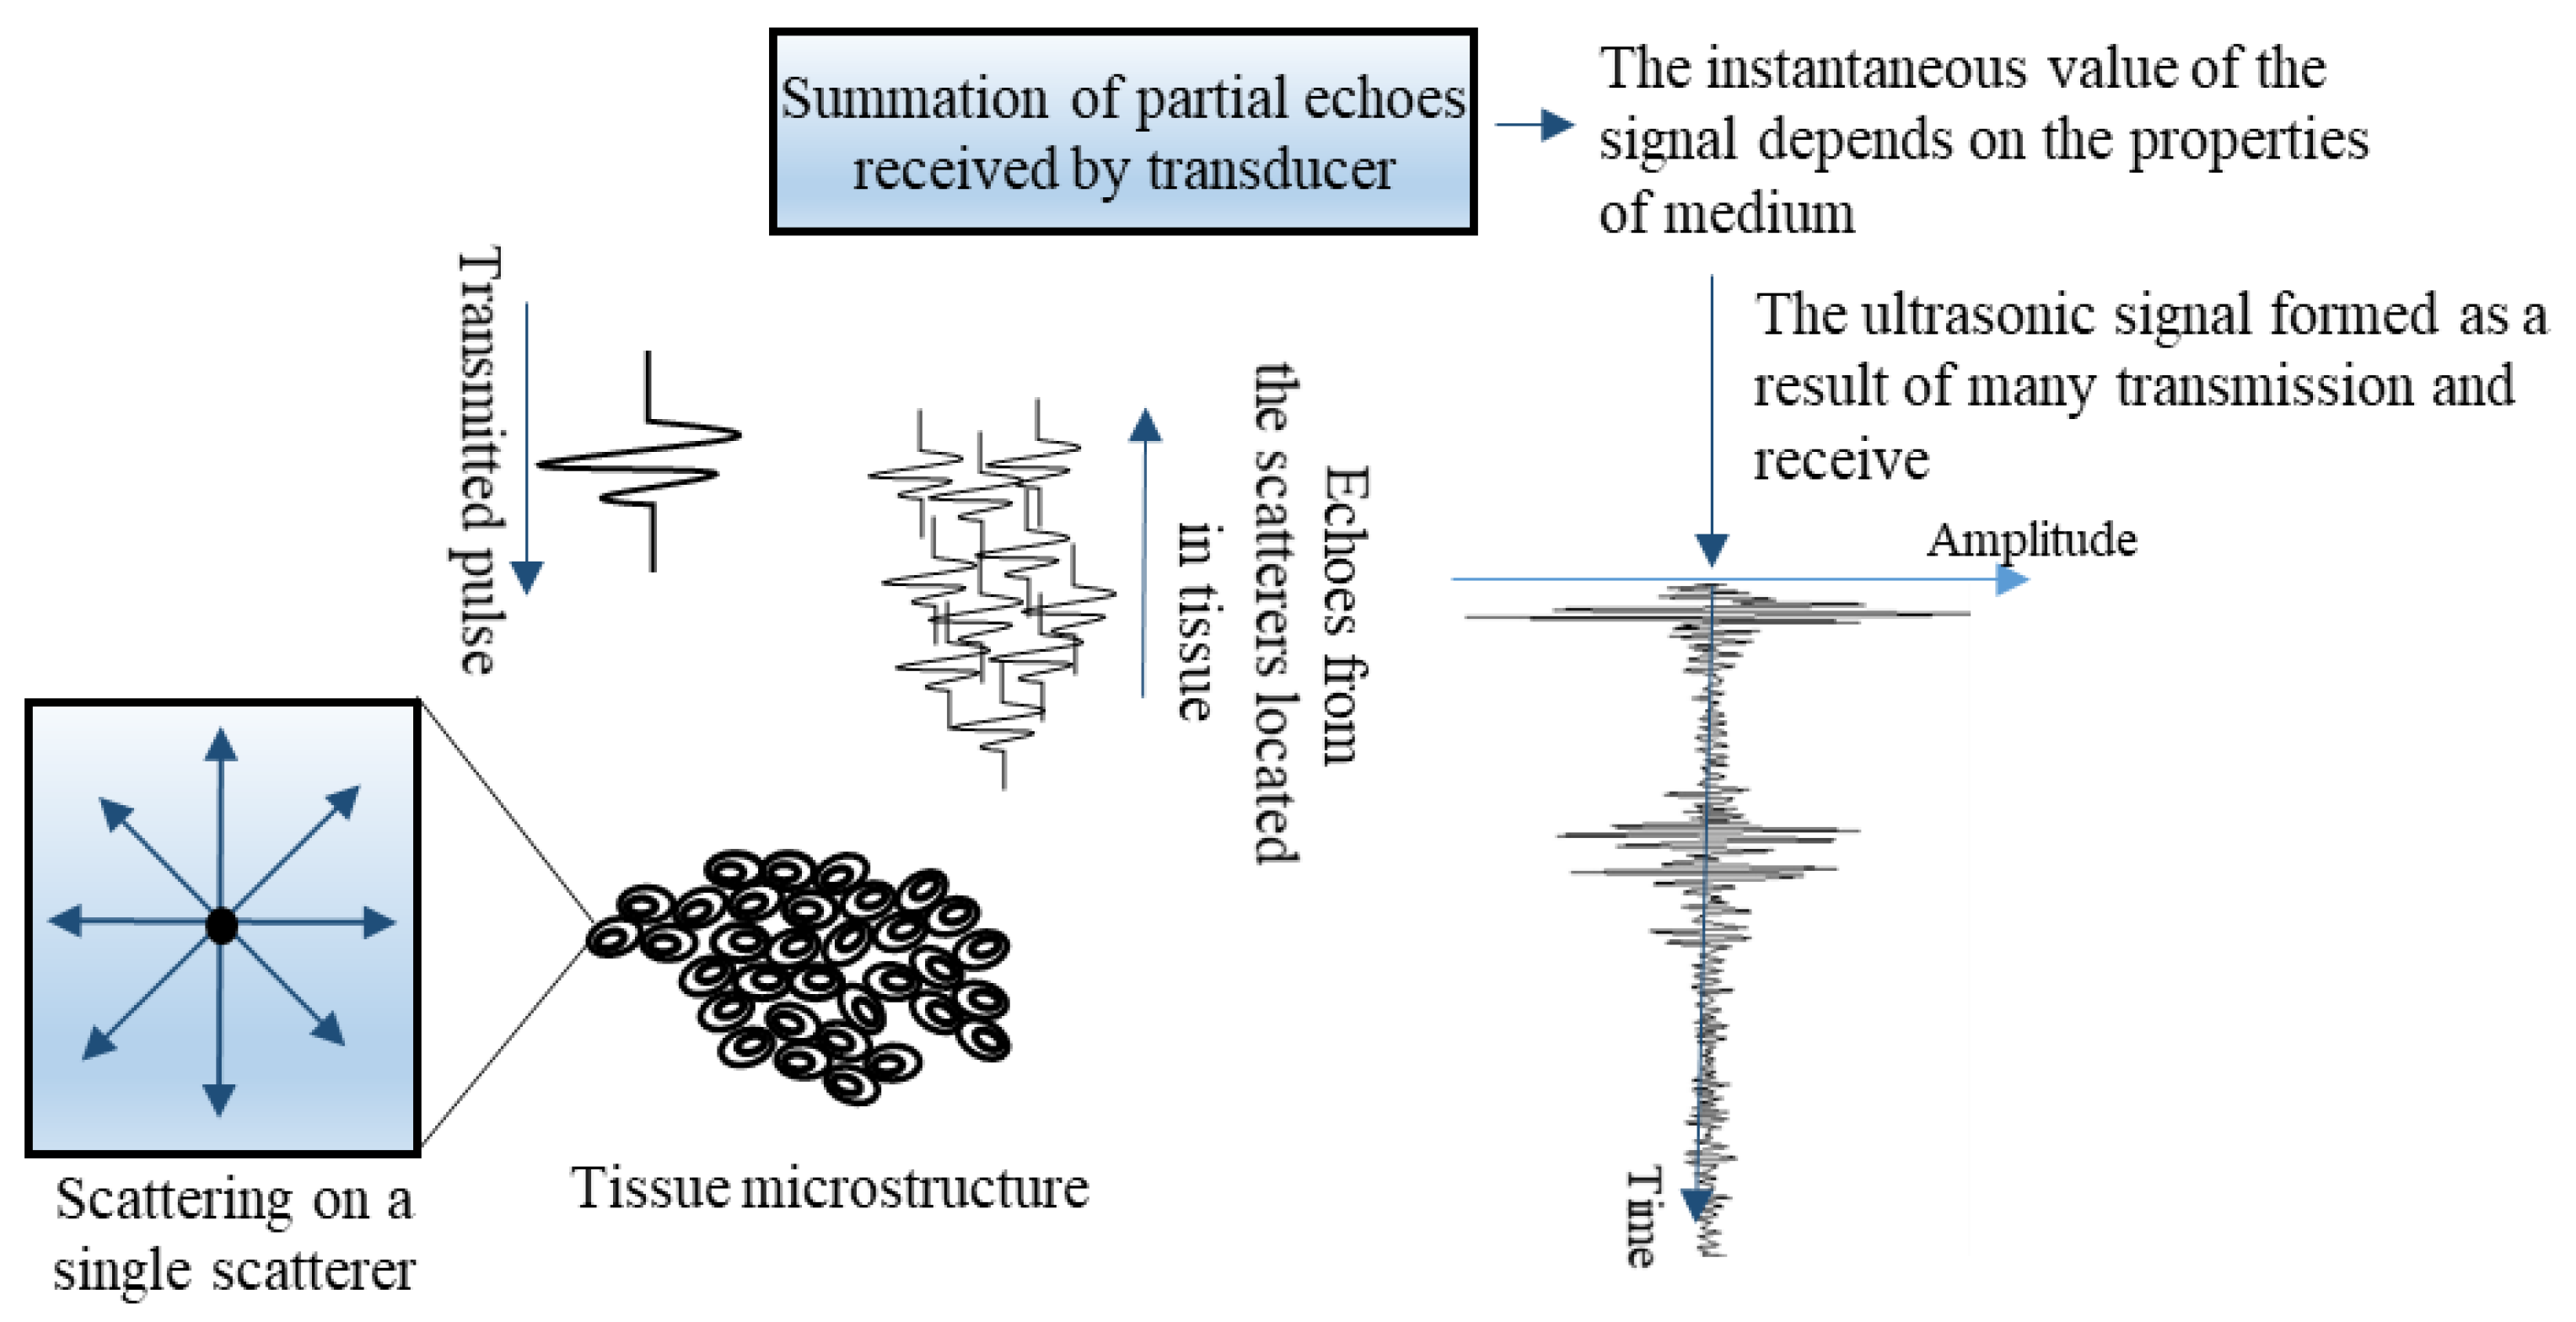
2.4. Quantitative Analysis of Ultrasound Data
2.5. Tumor Echogenicity
- Hypoechoic
- Hypo and isoechoic (mixed)
- Isoechoic
- Hyperechoic
2.6. Tumor Volume
2.7. Statistical Analysis
3. Results
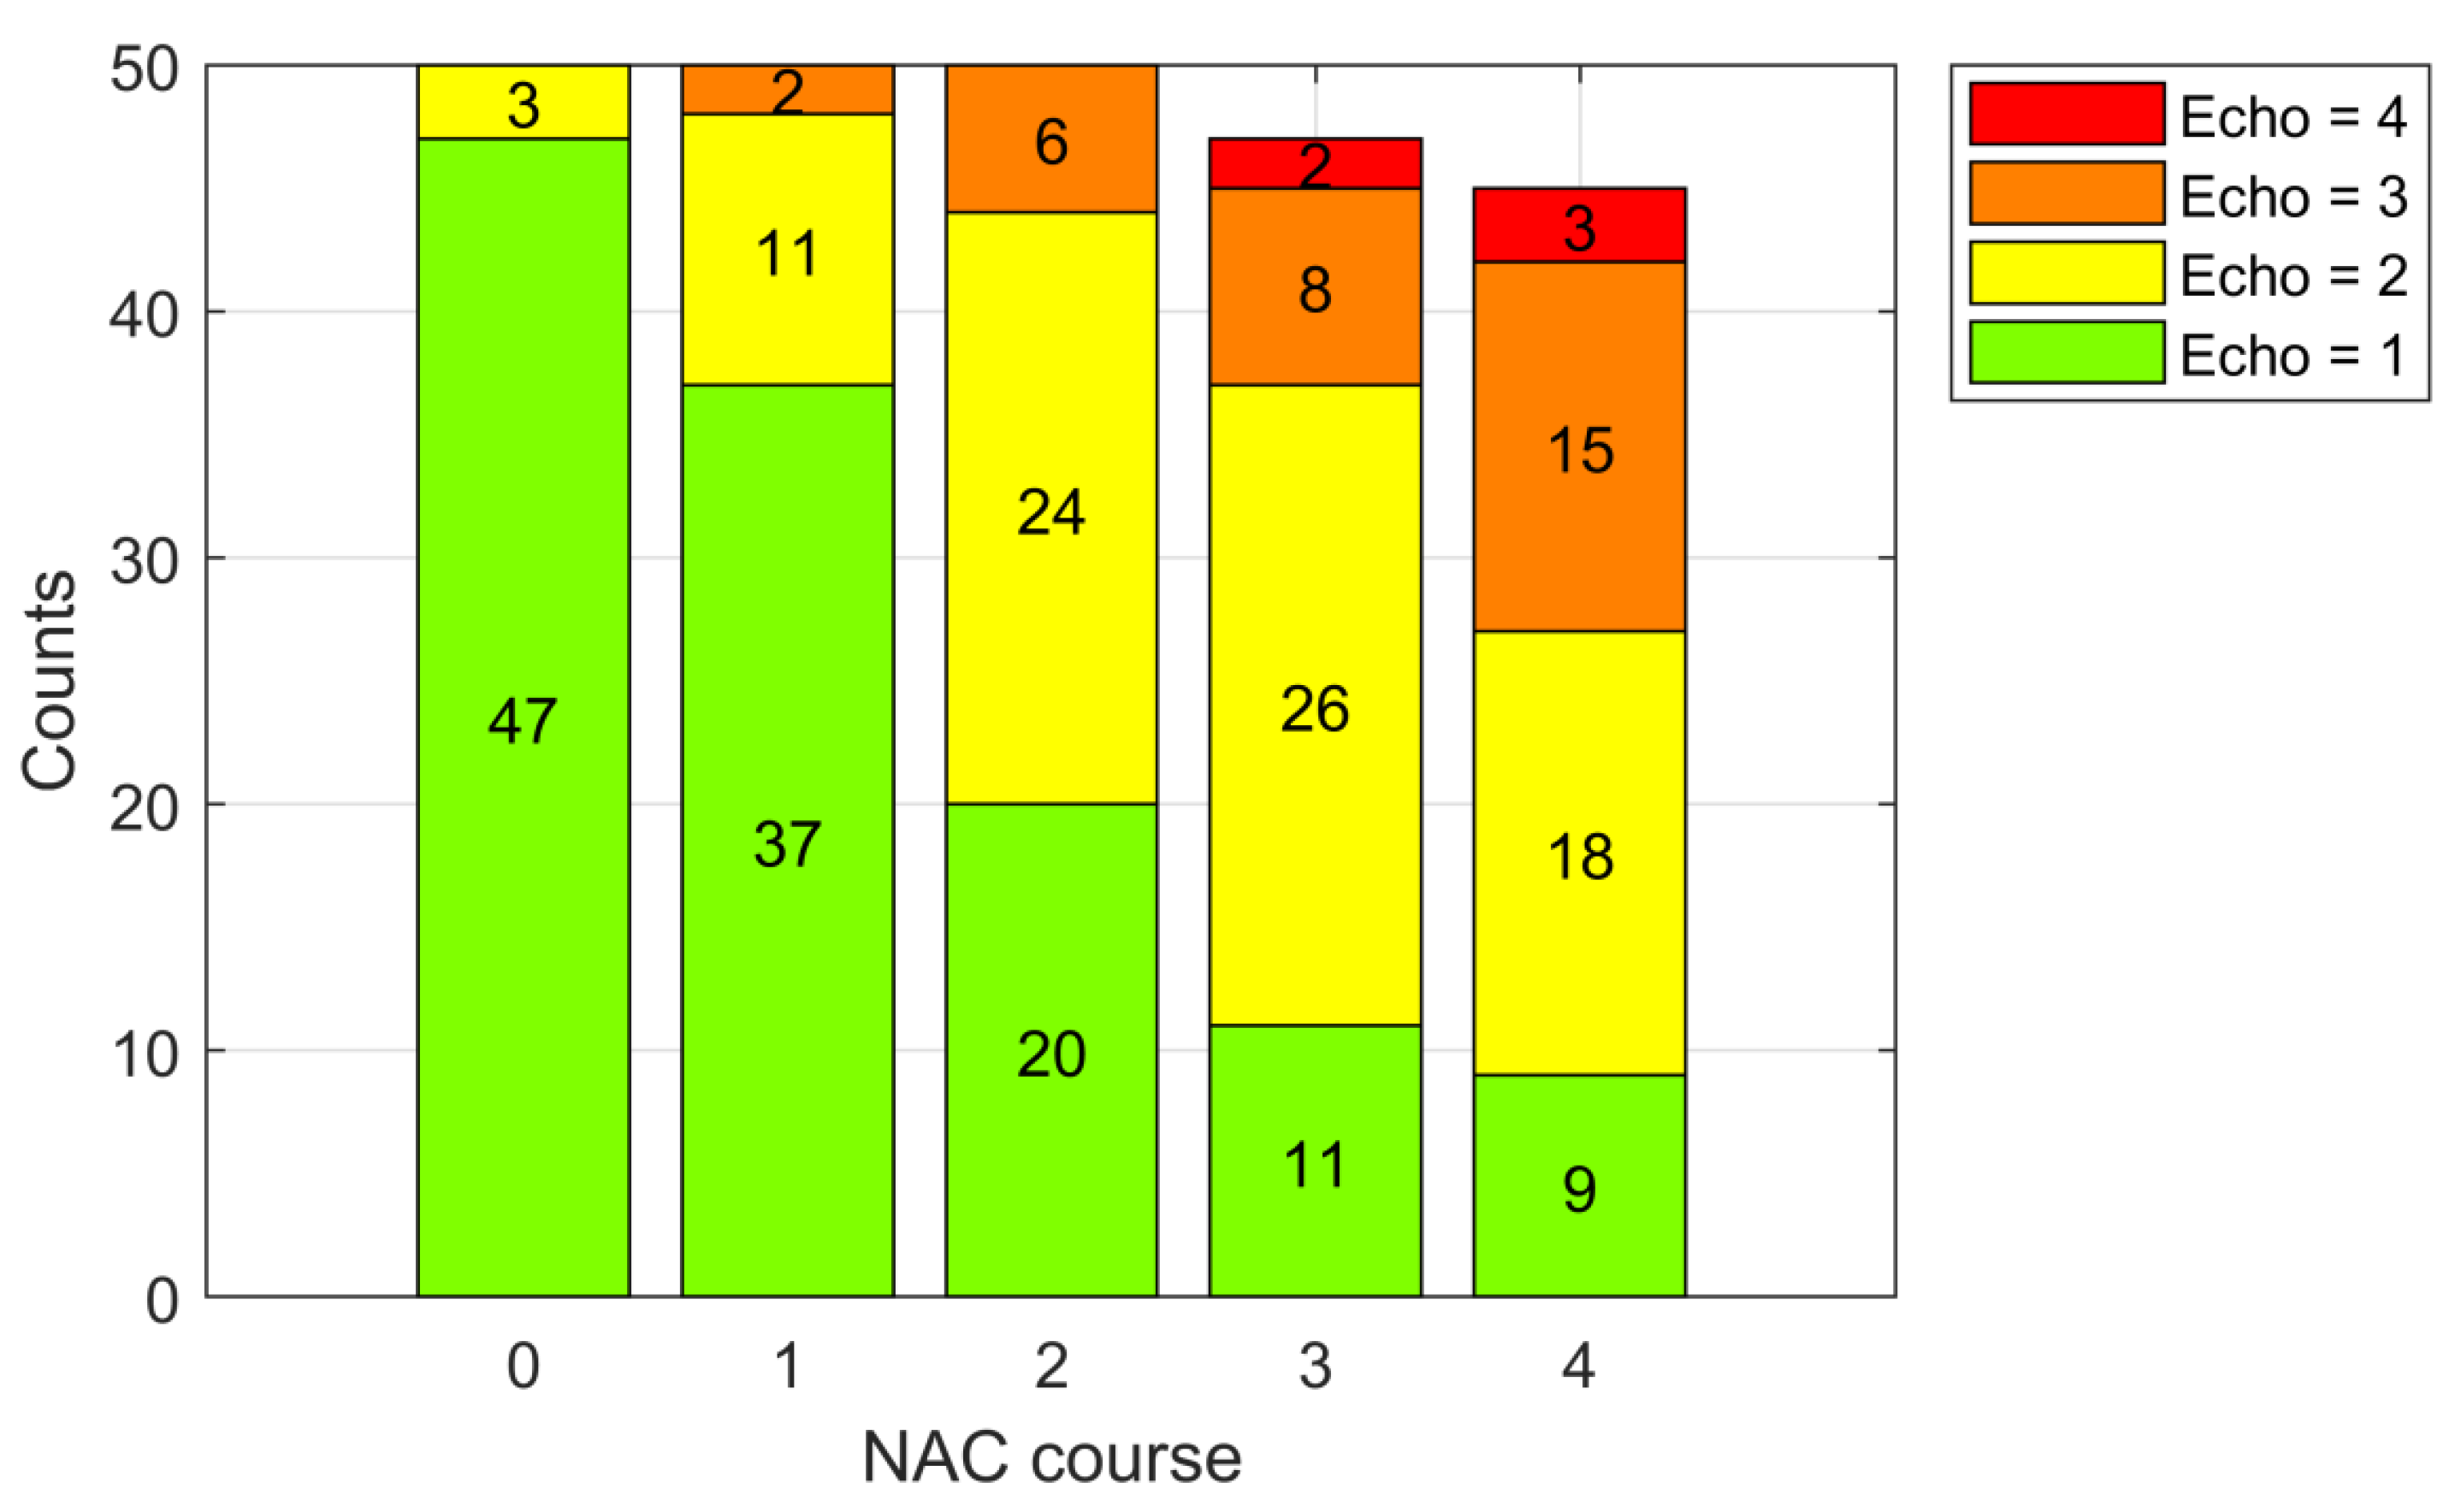
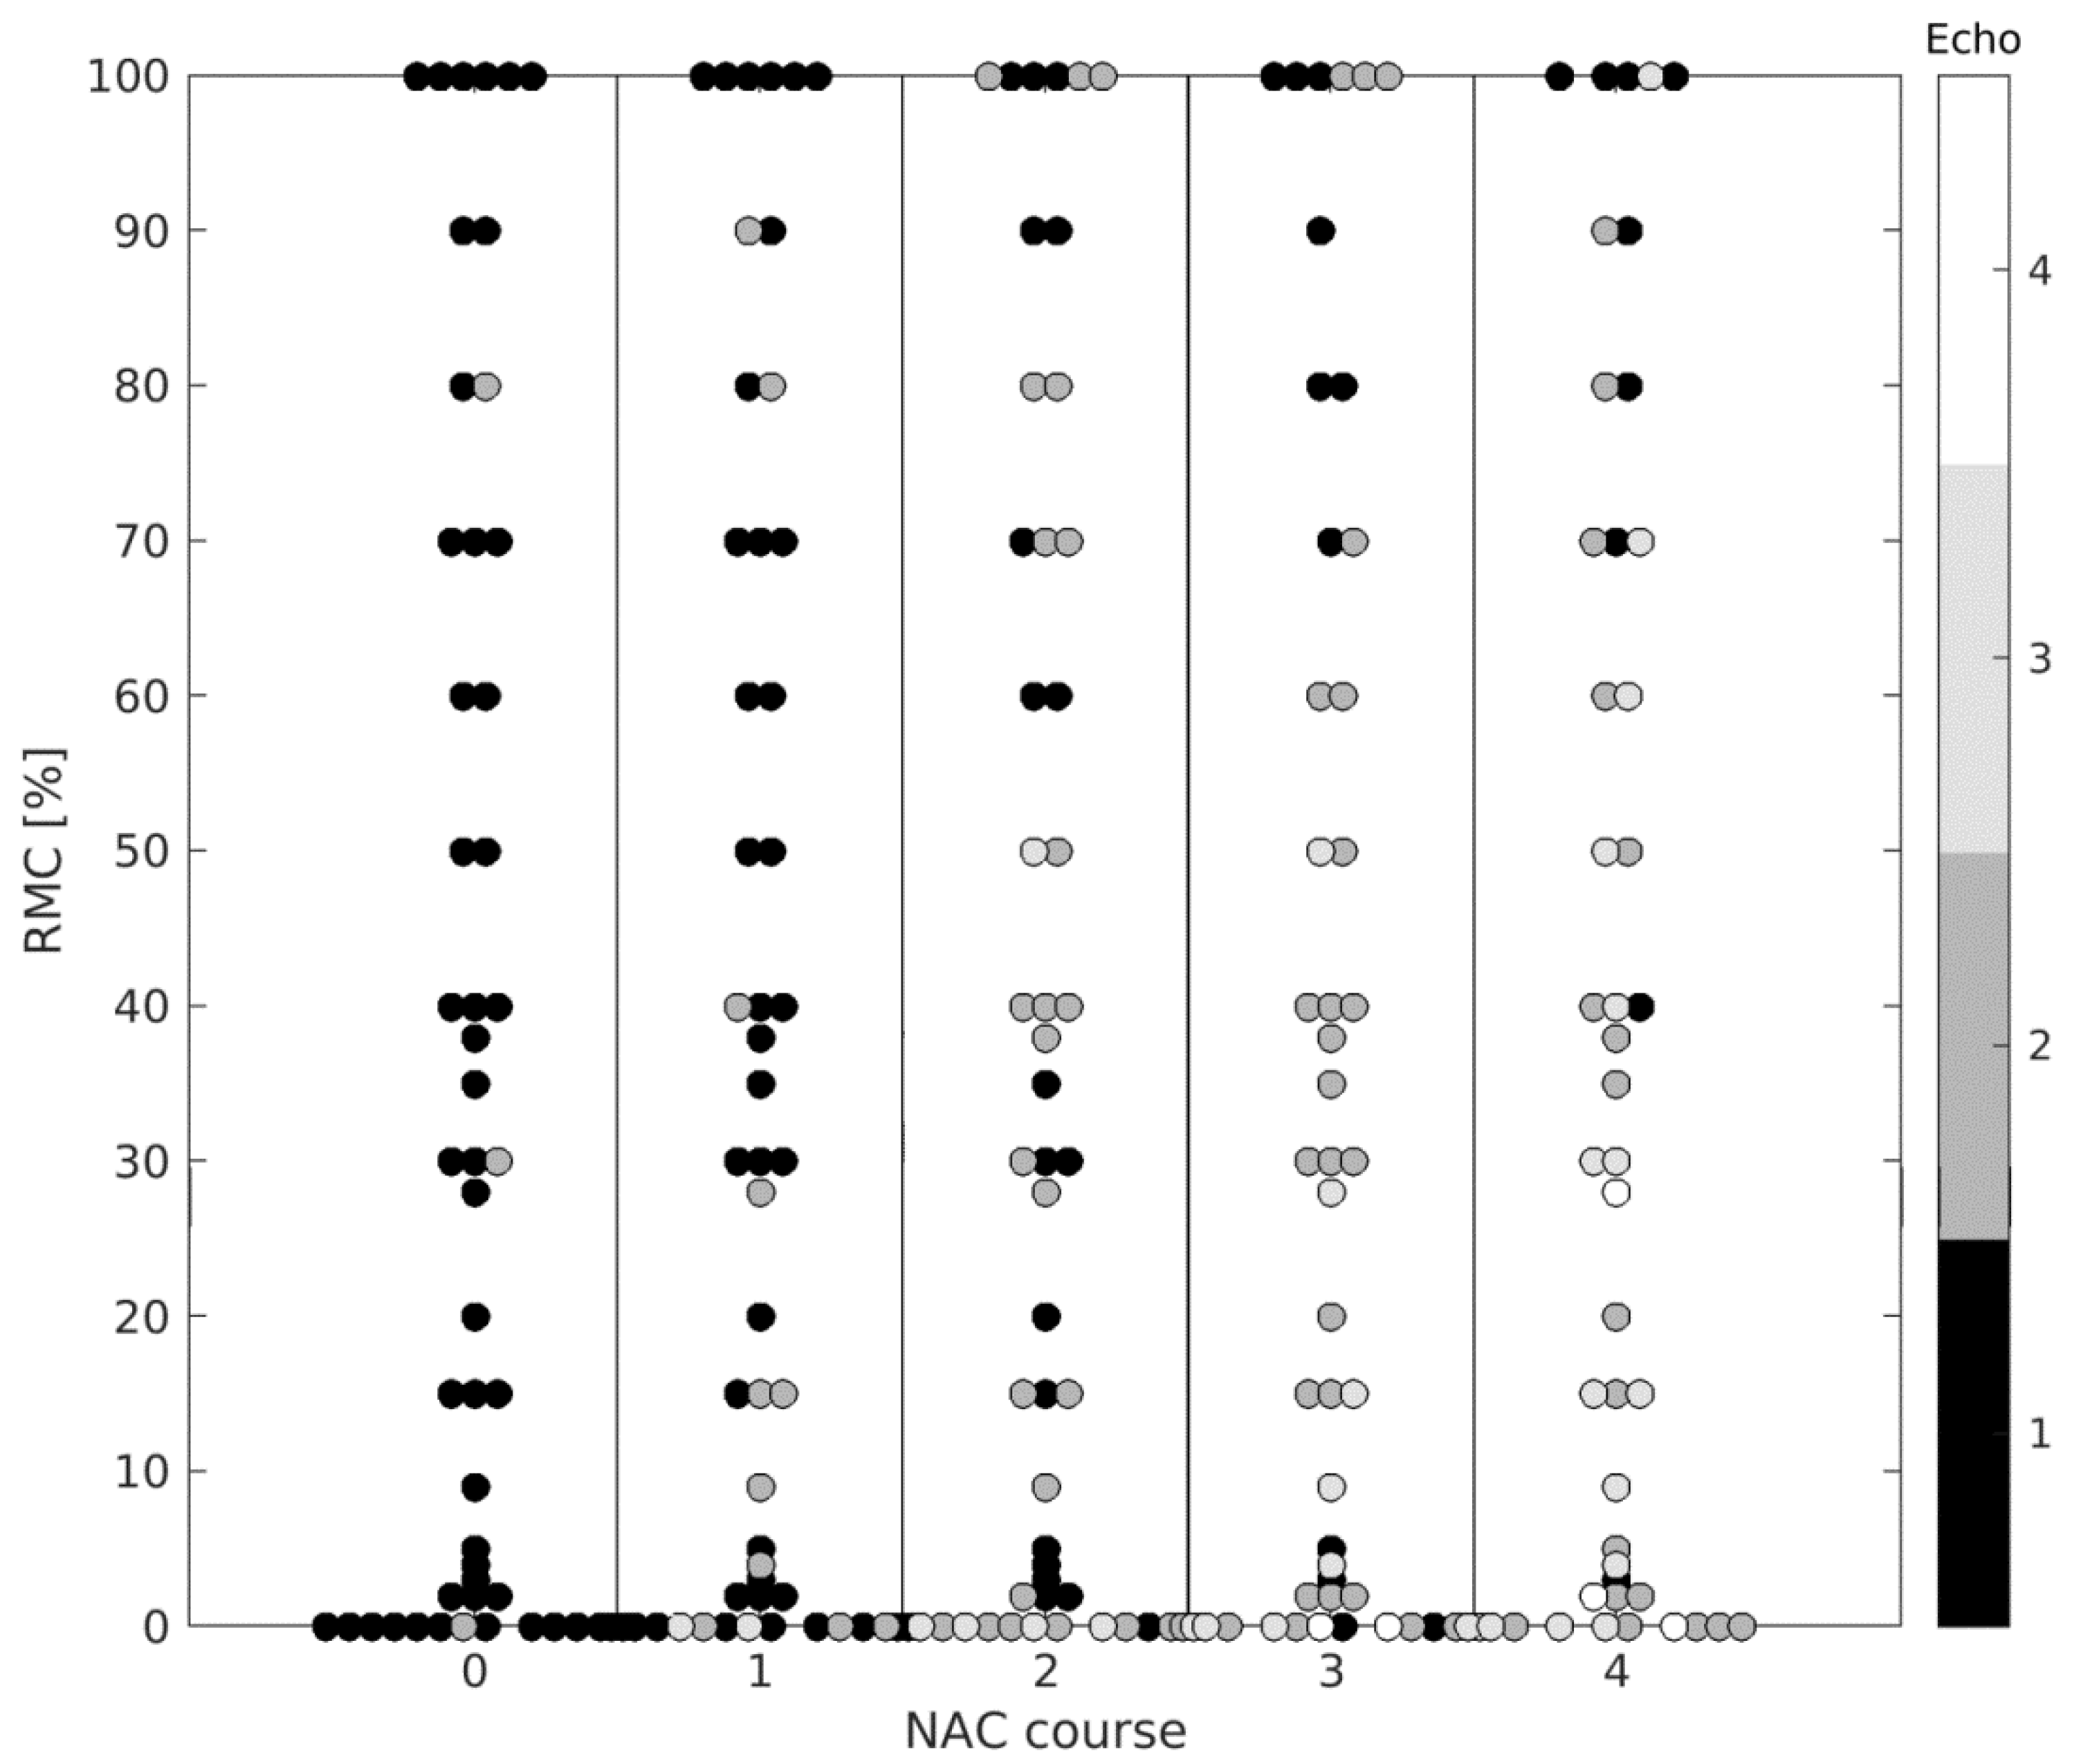
3.1. Tumor Echogenicity
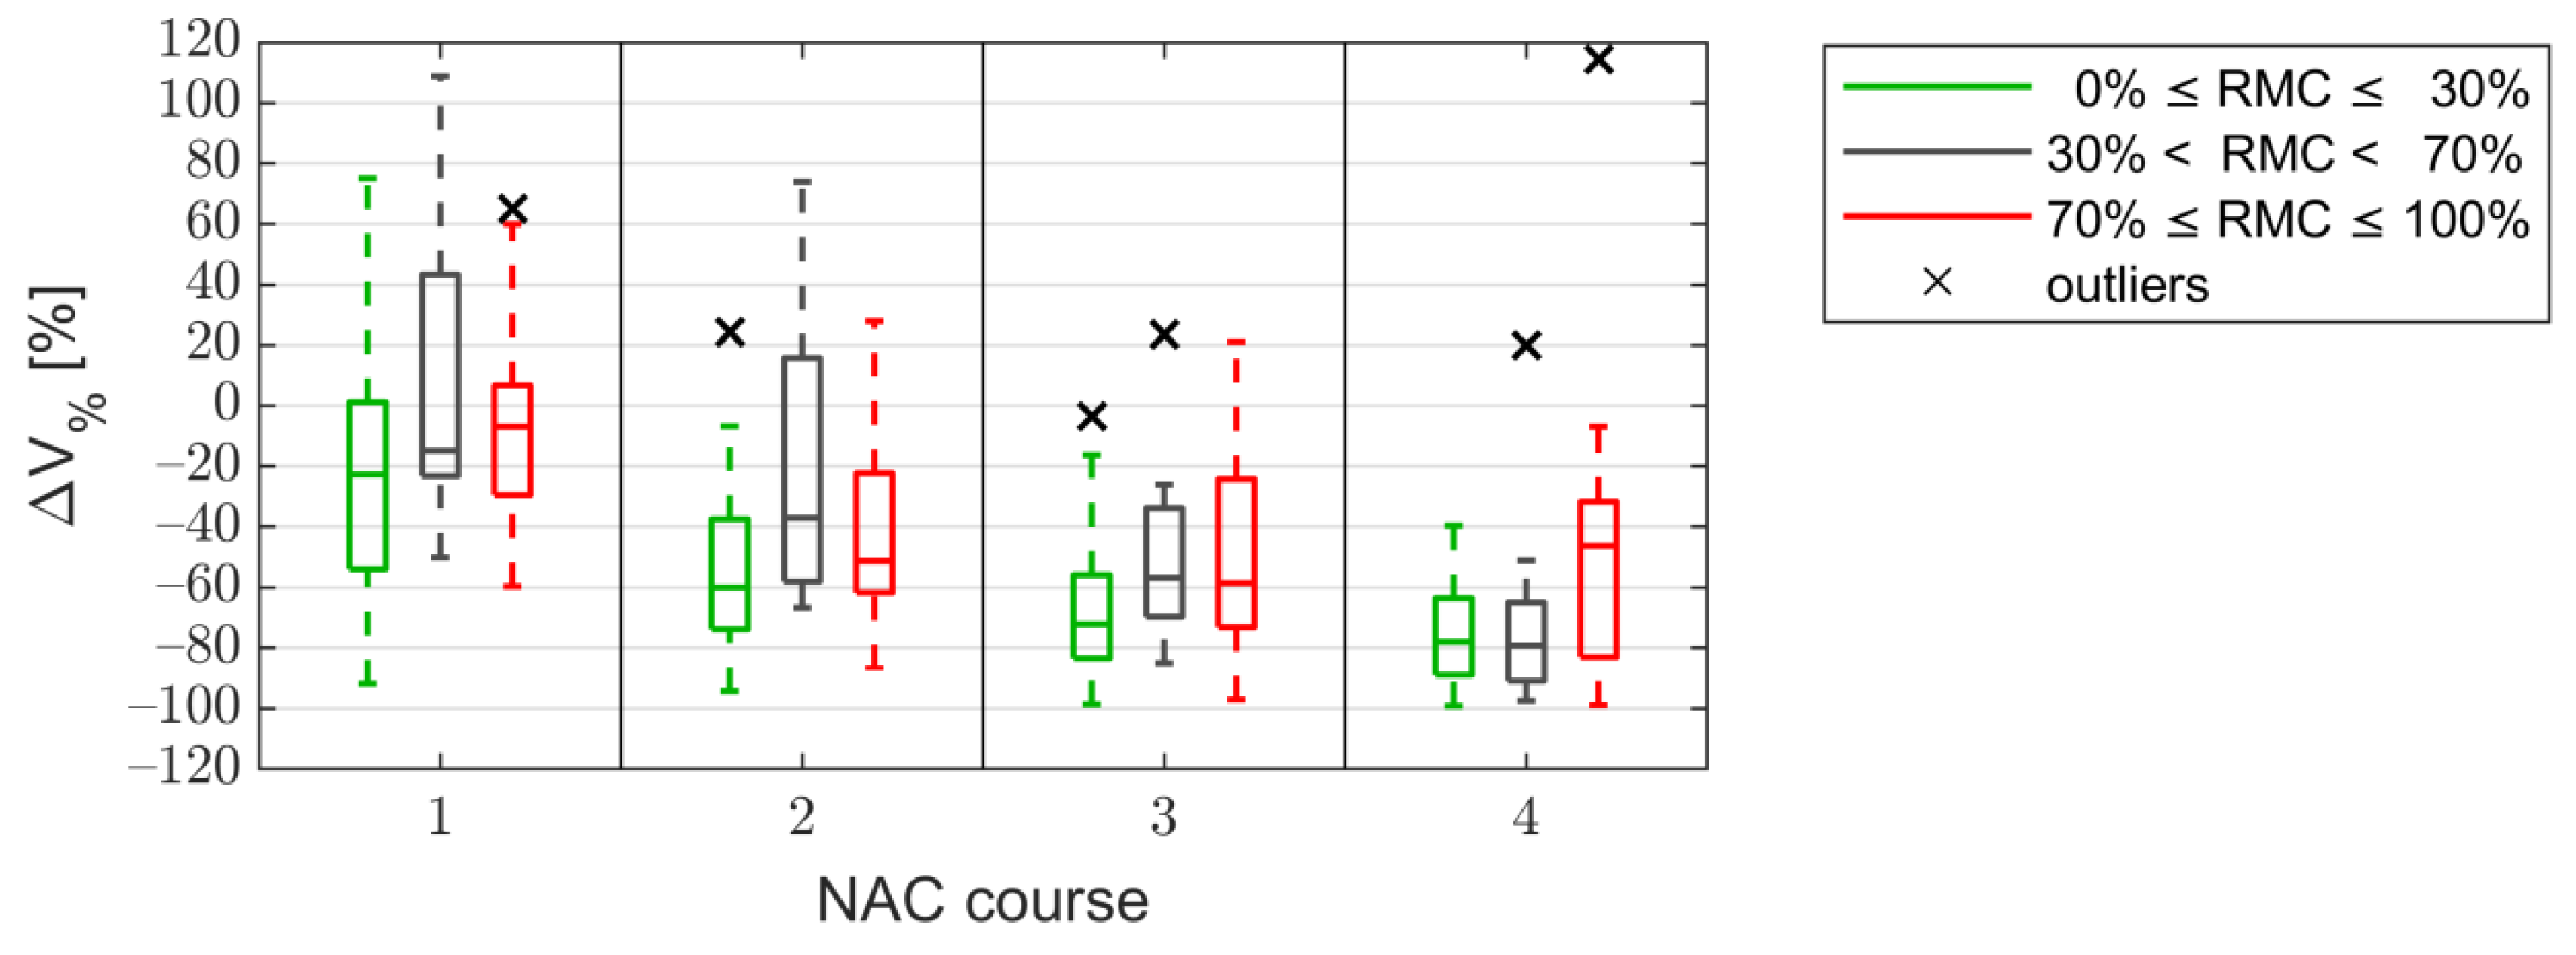
3.2. Tumor Size
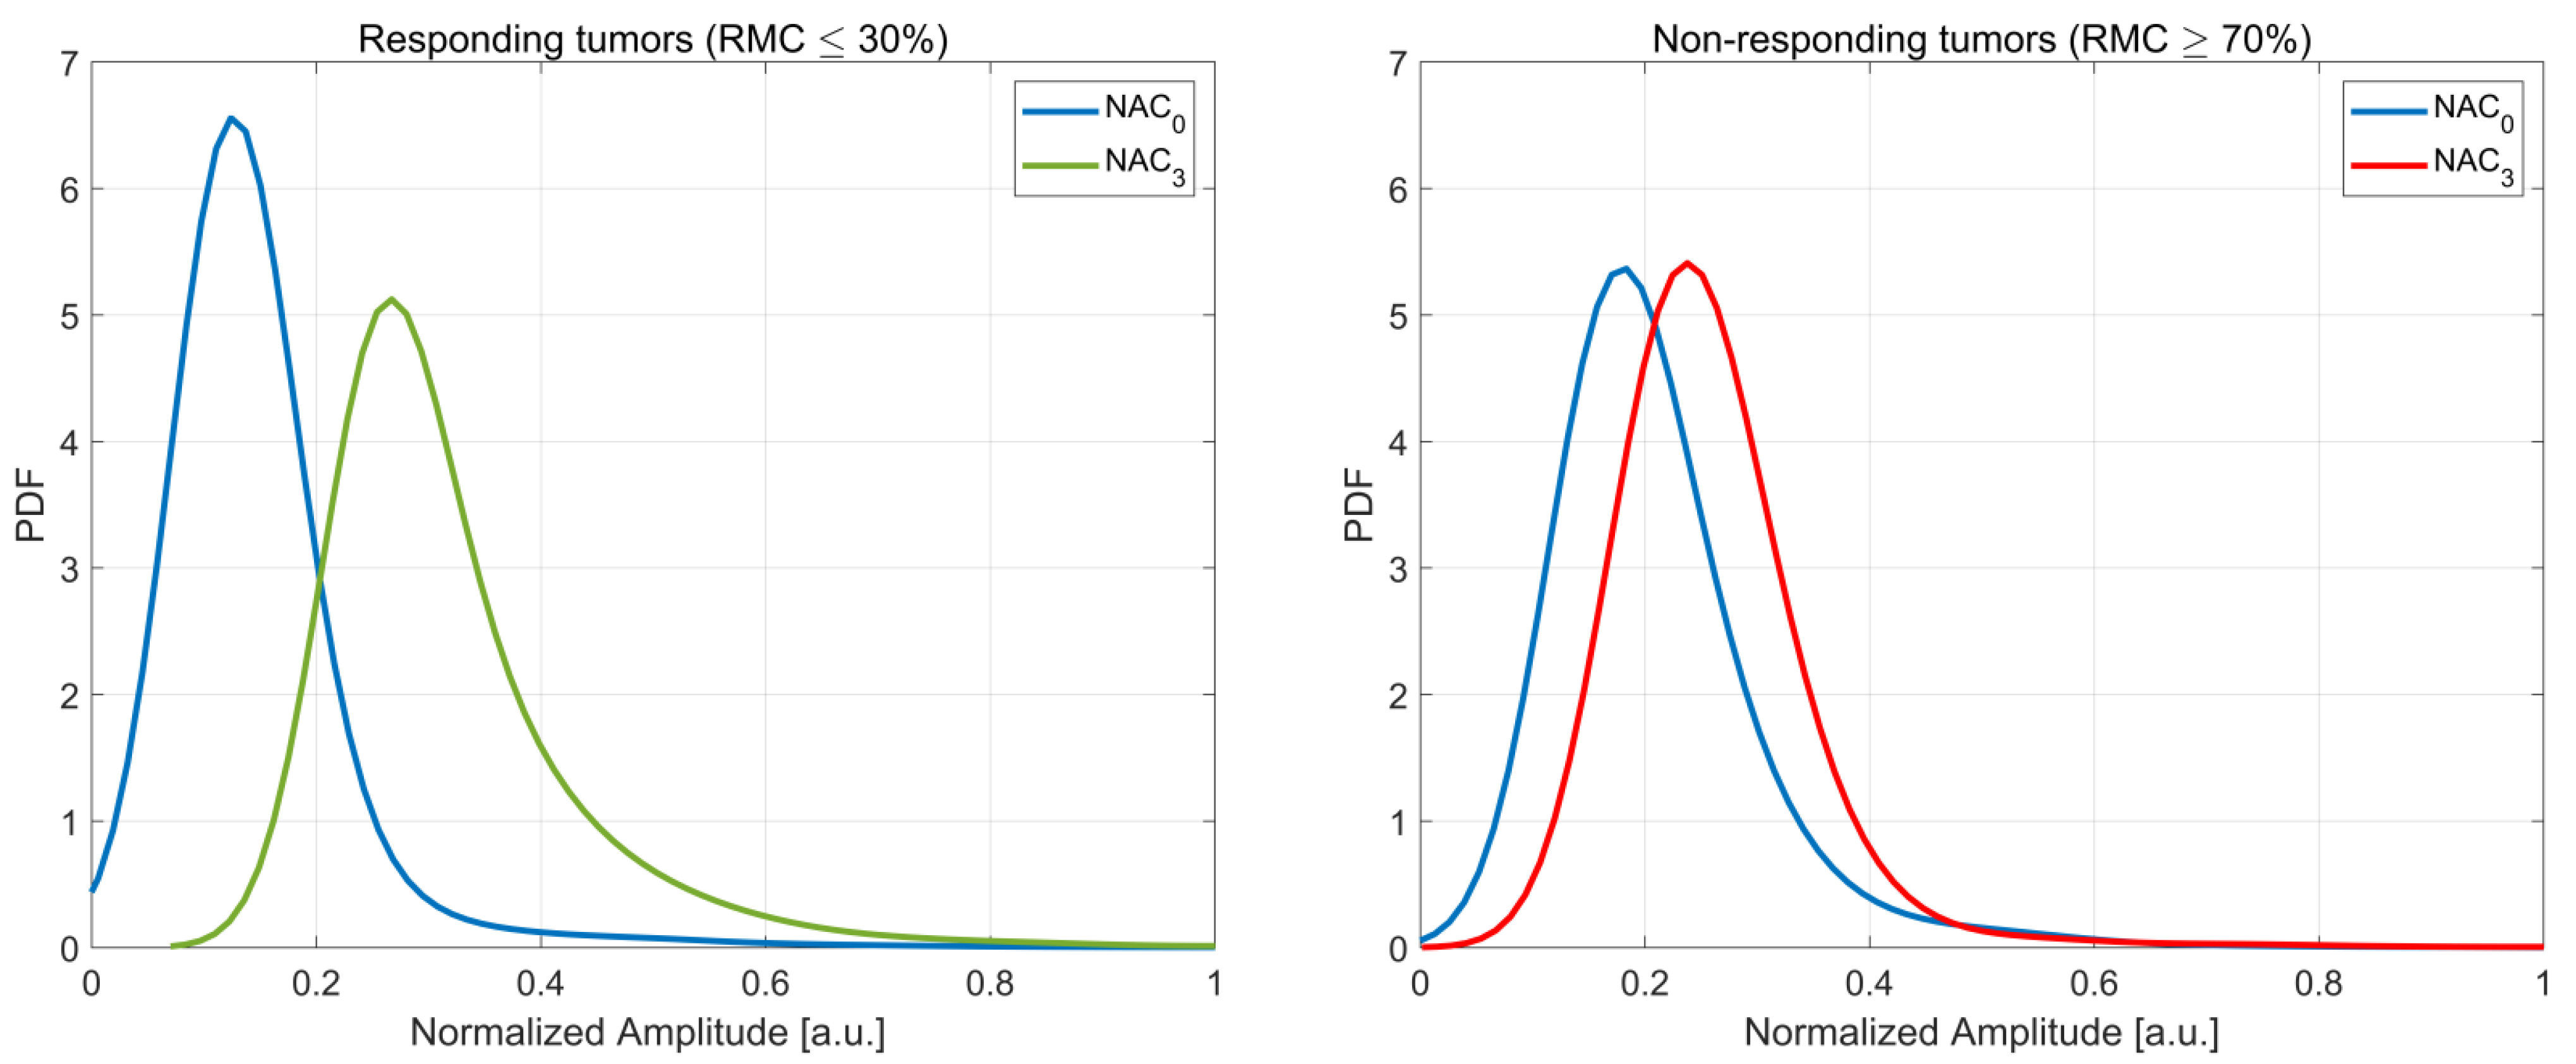
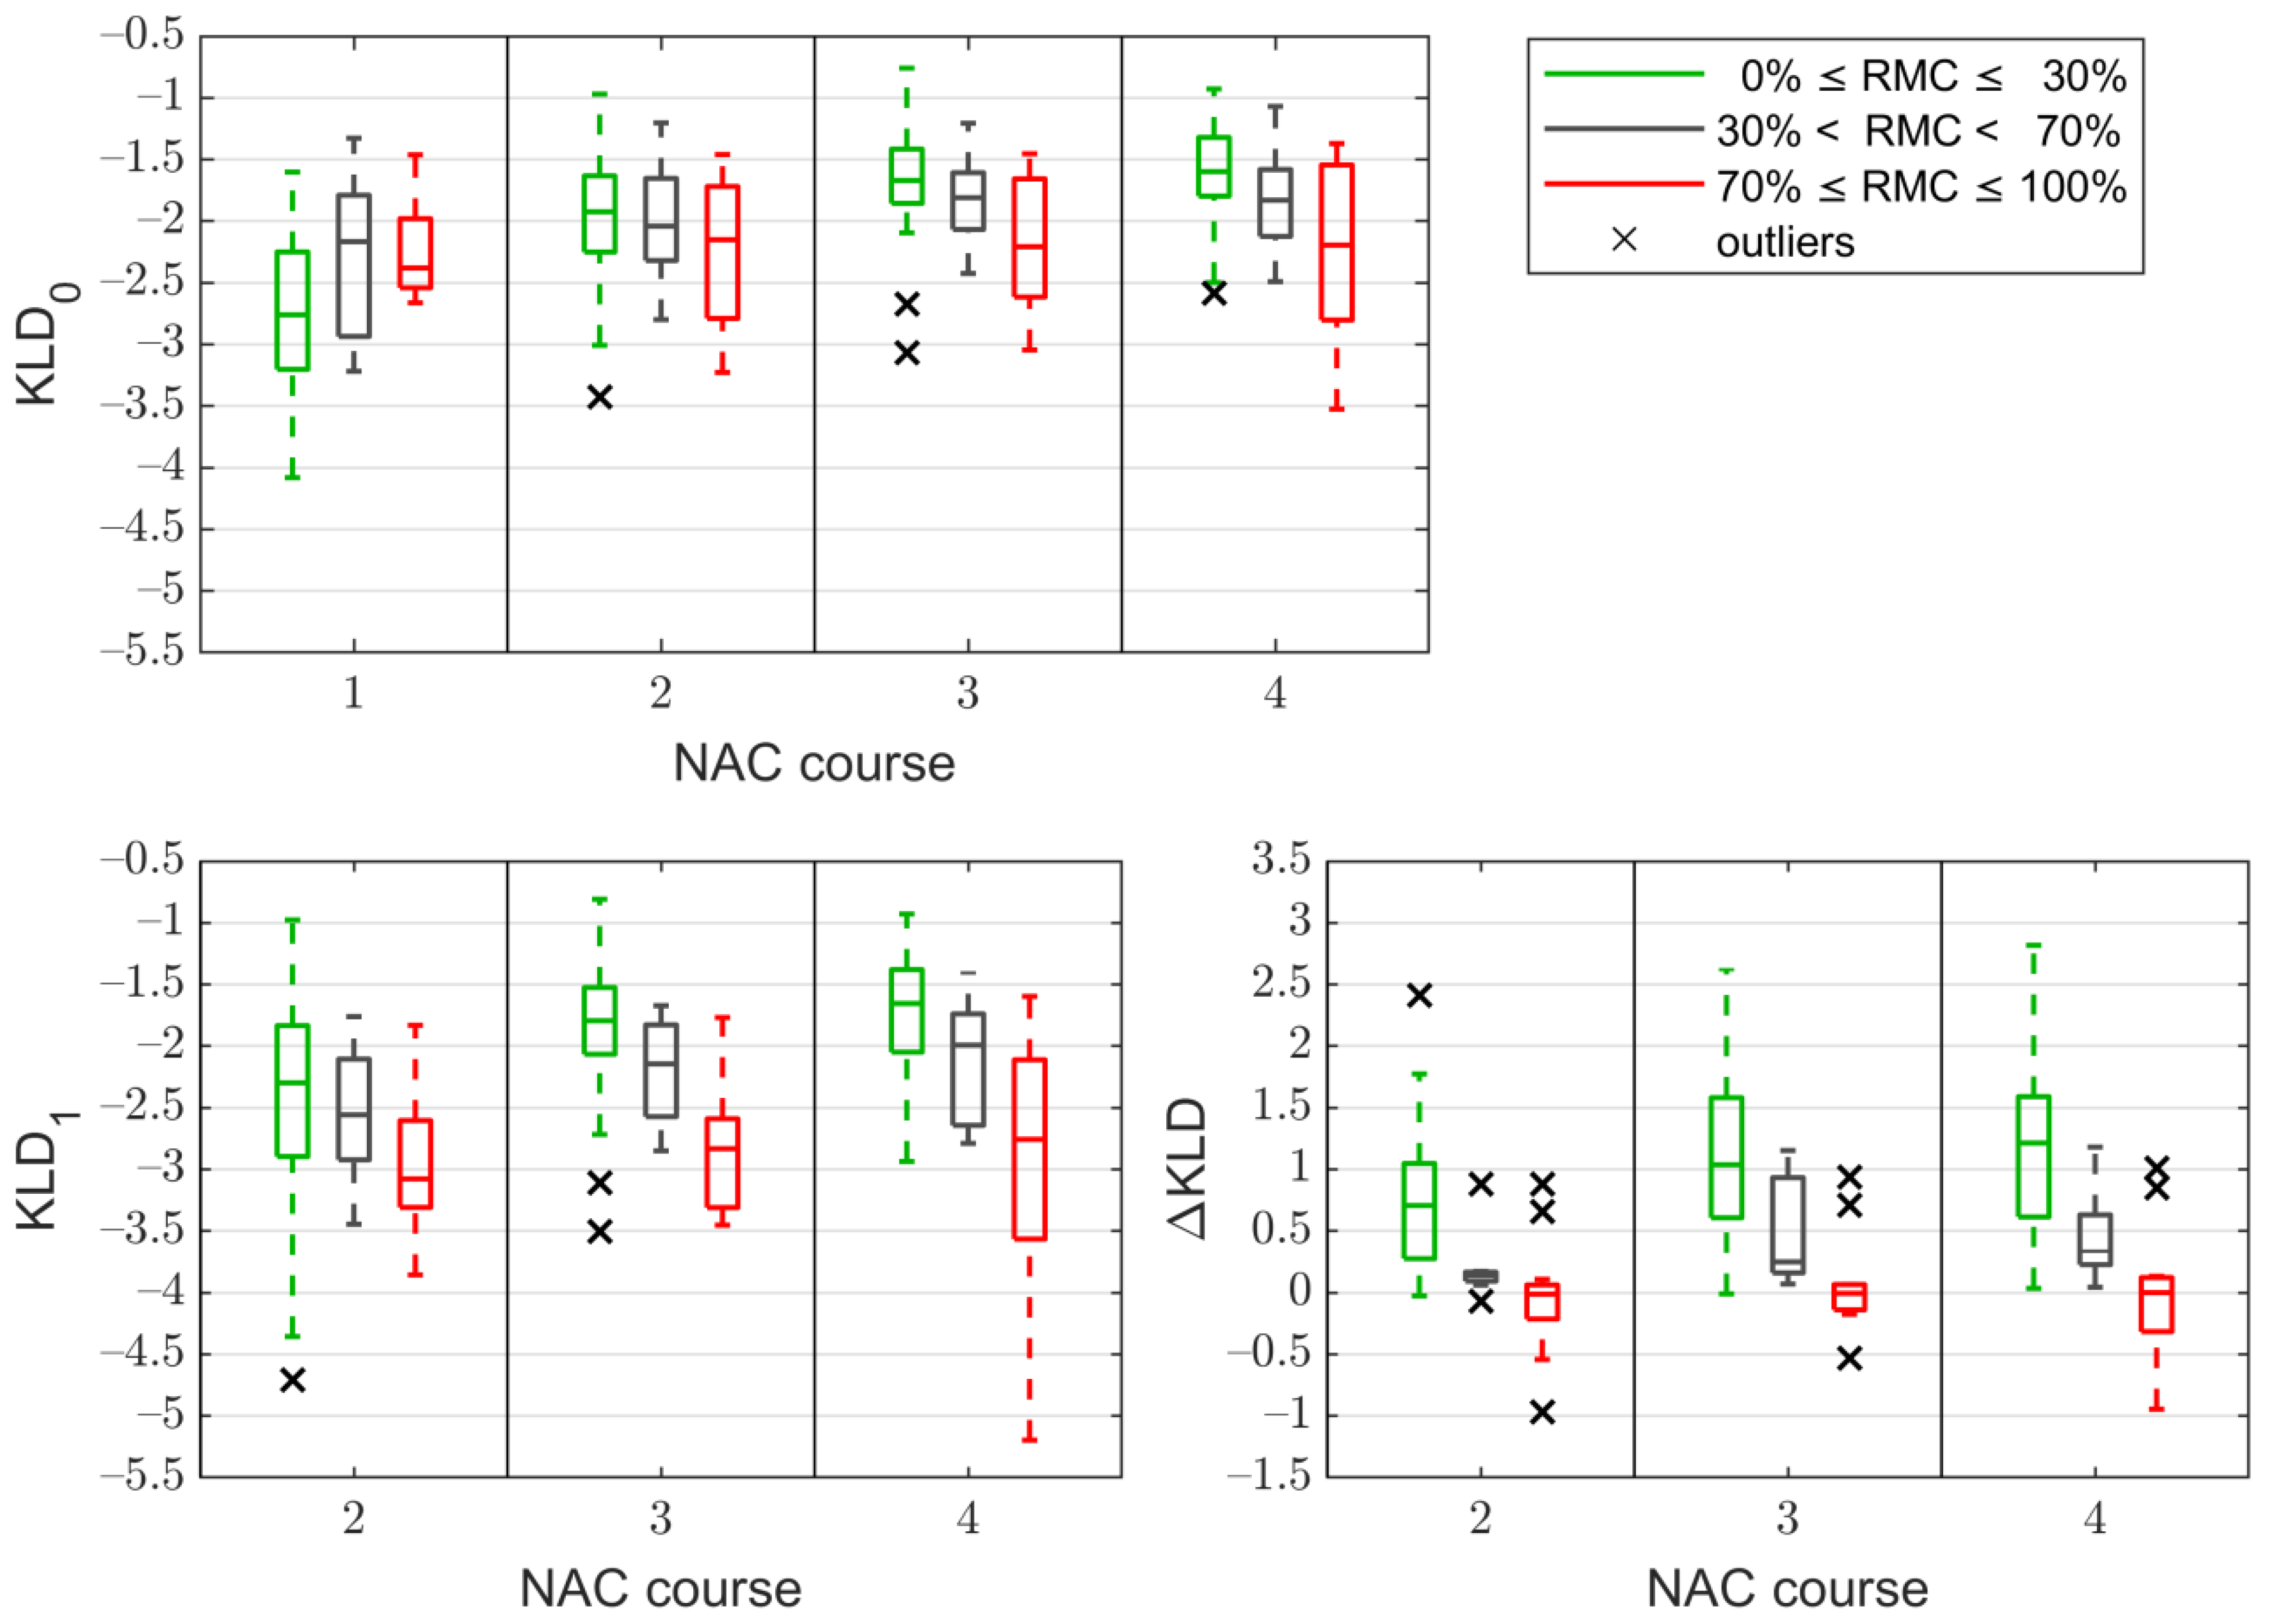
3.3. The Kullback–Leibler Divergence Based Parameters
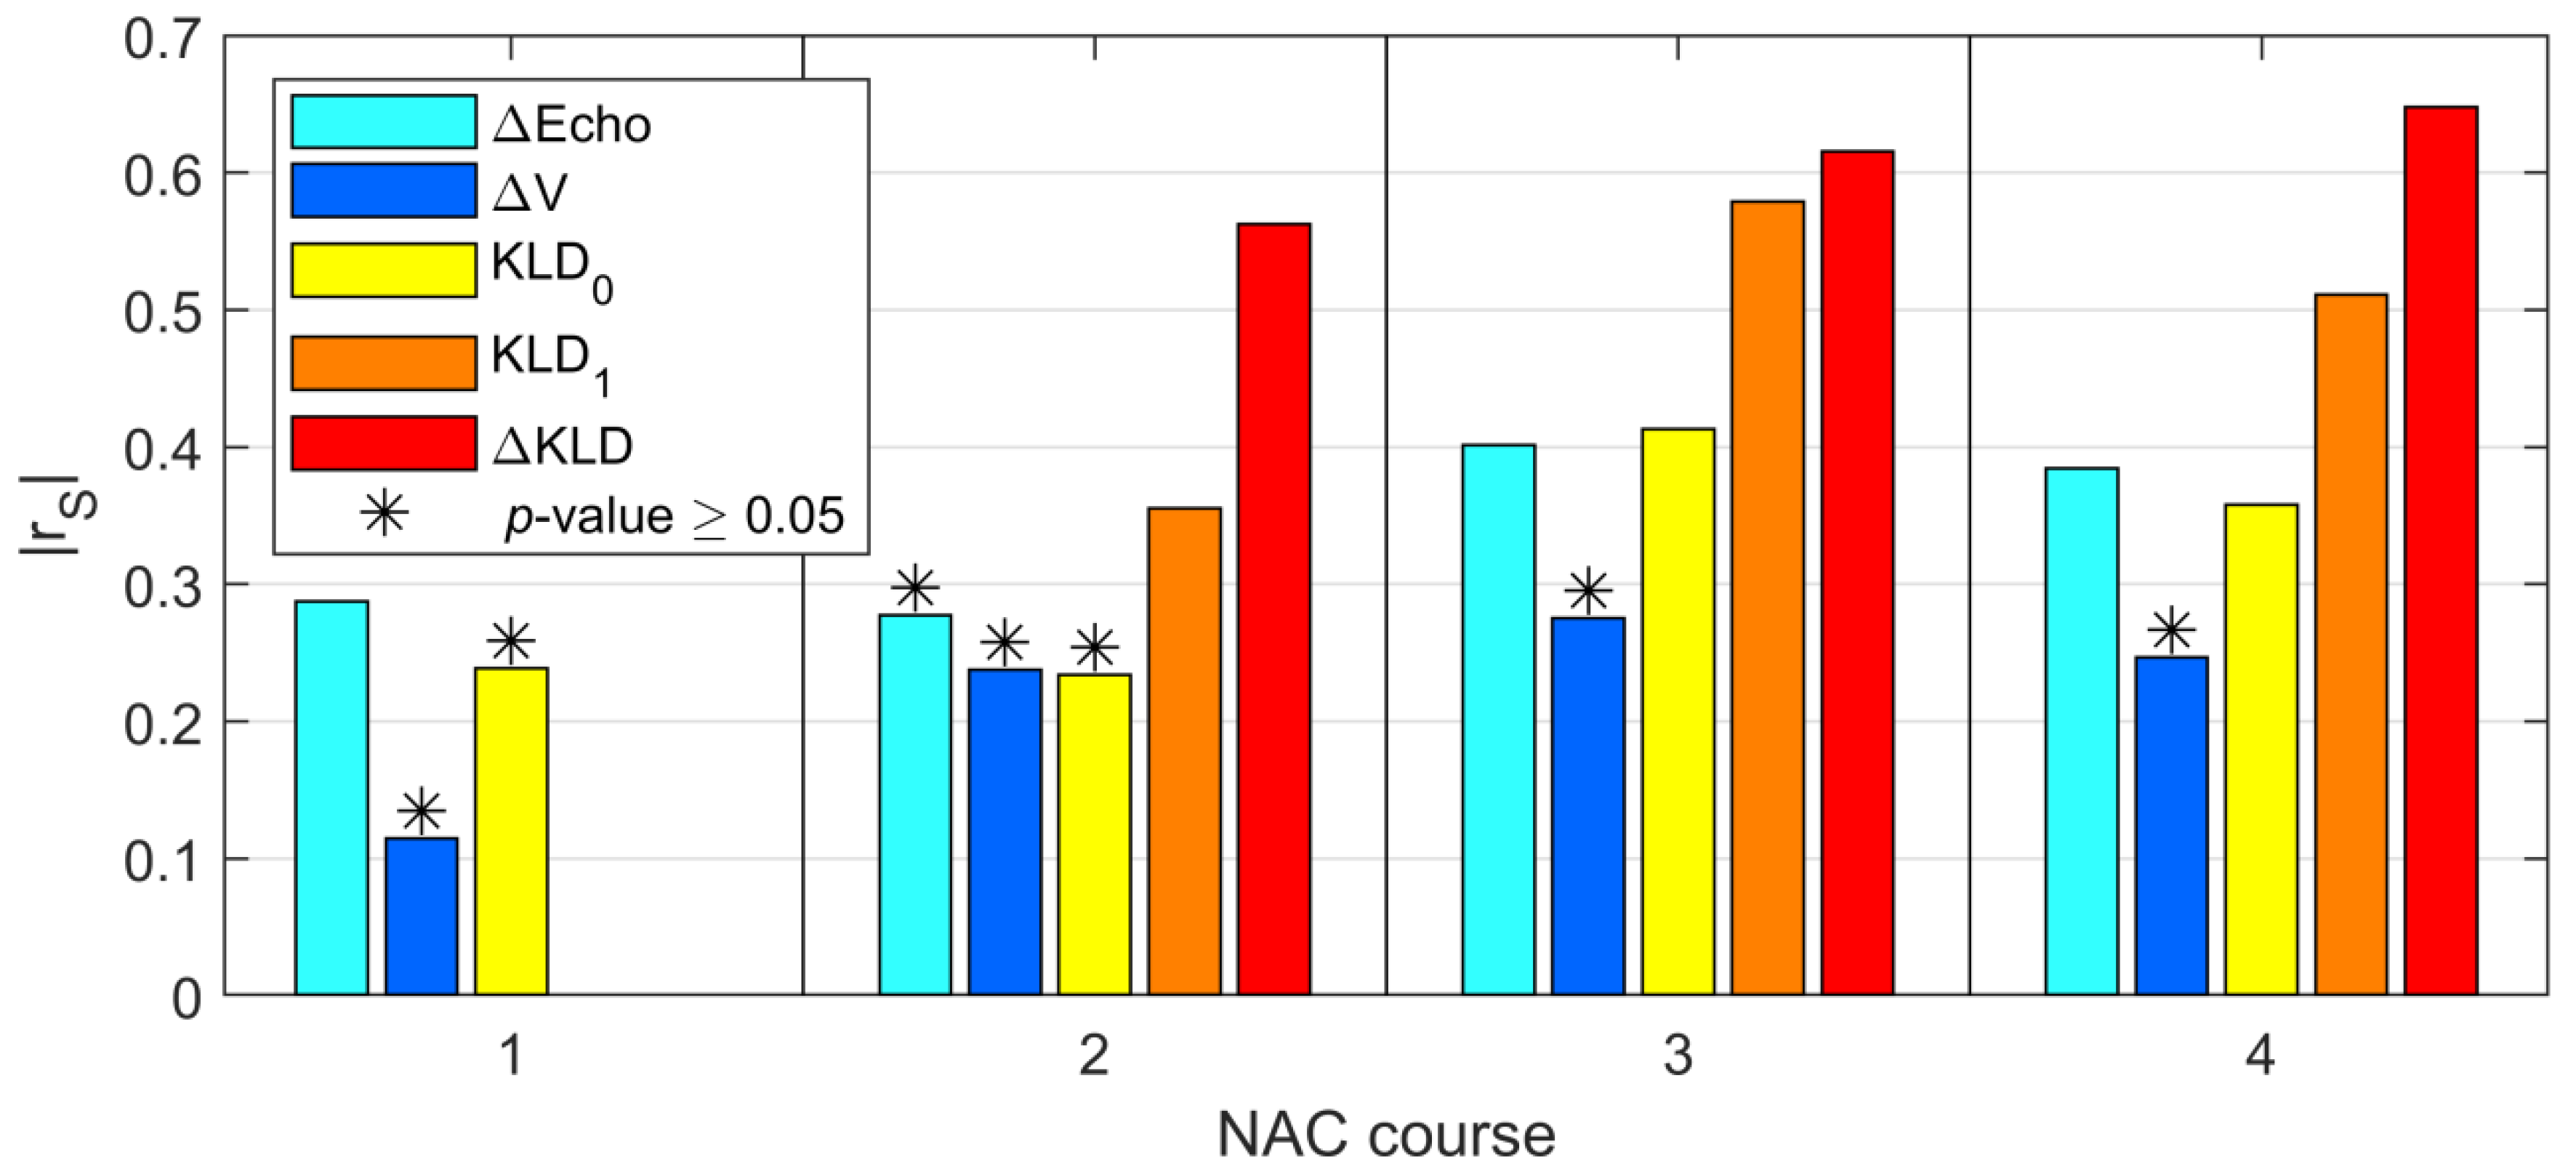
3.4. Correlation
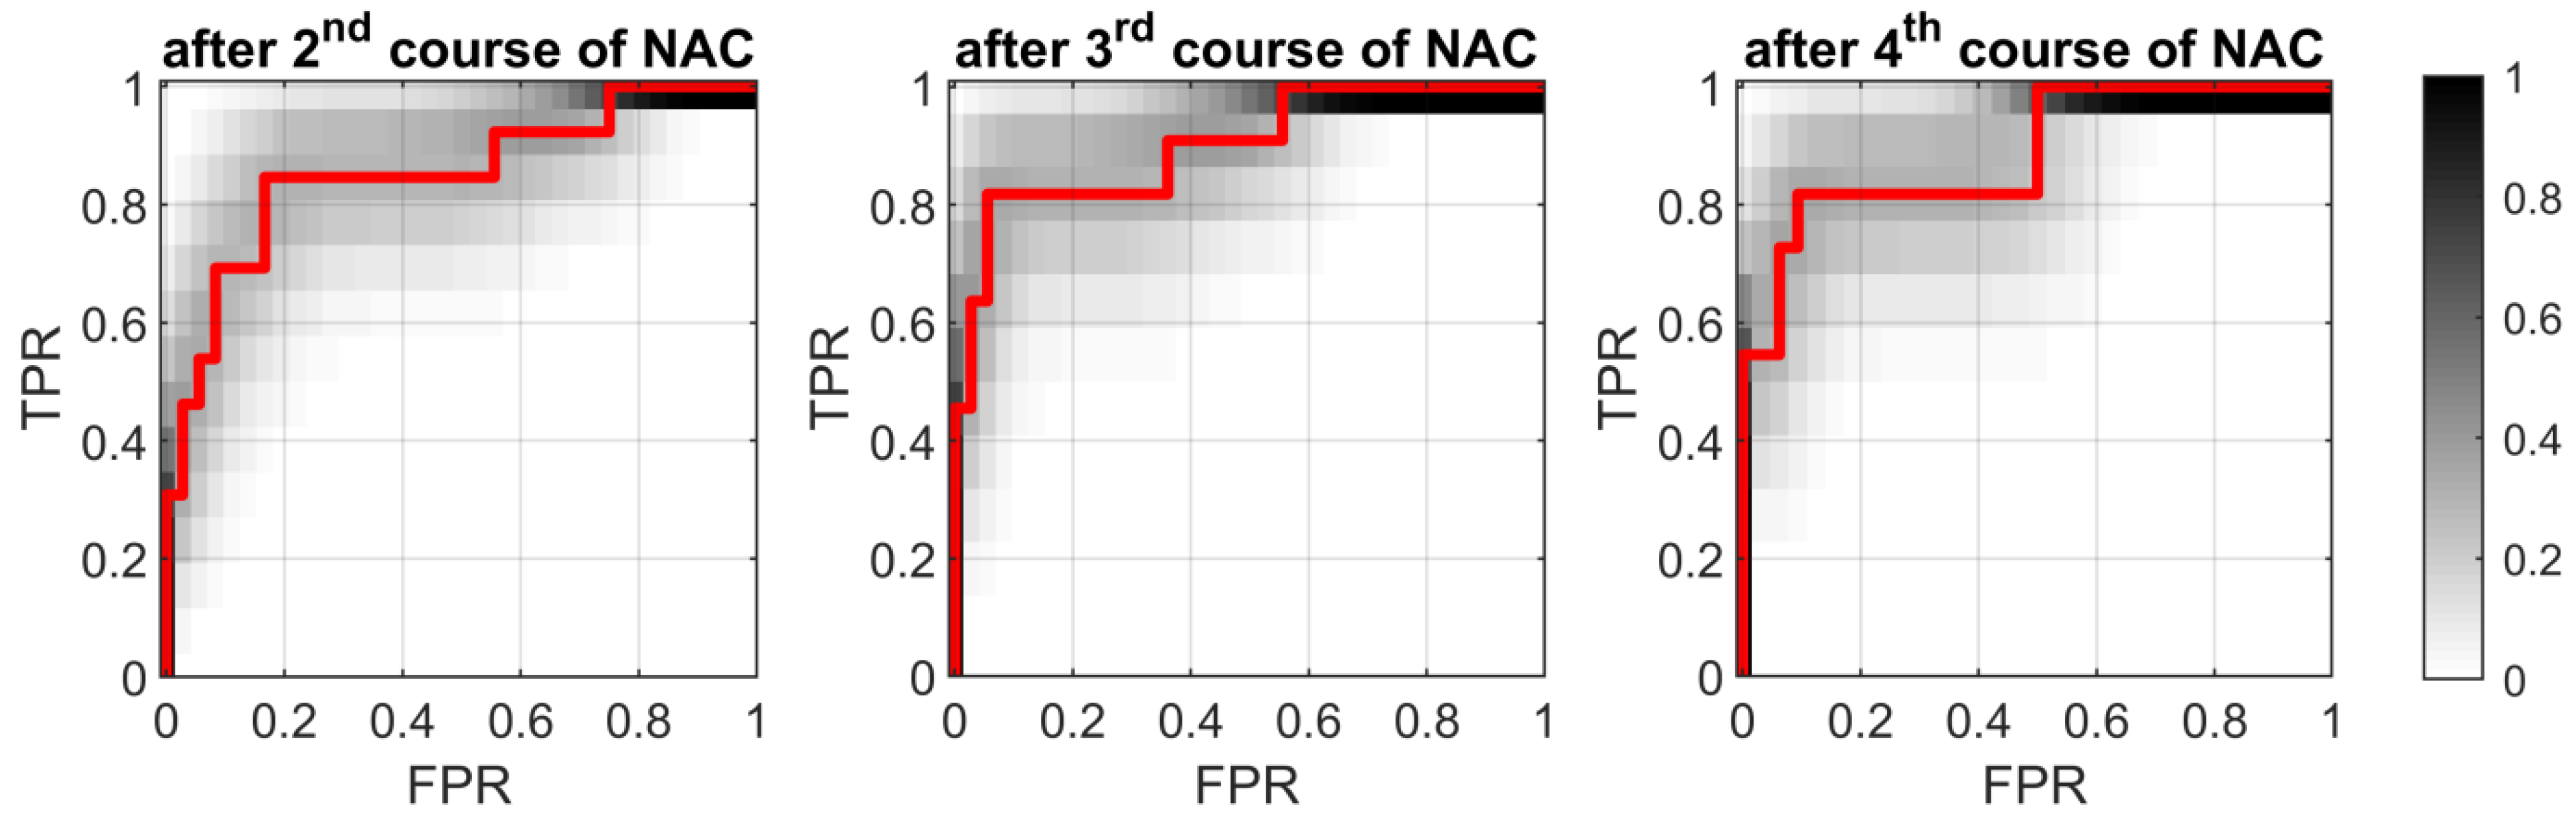
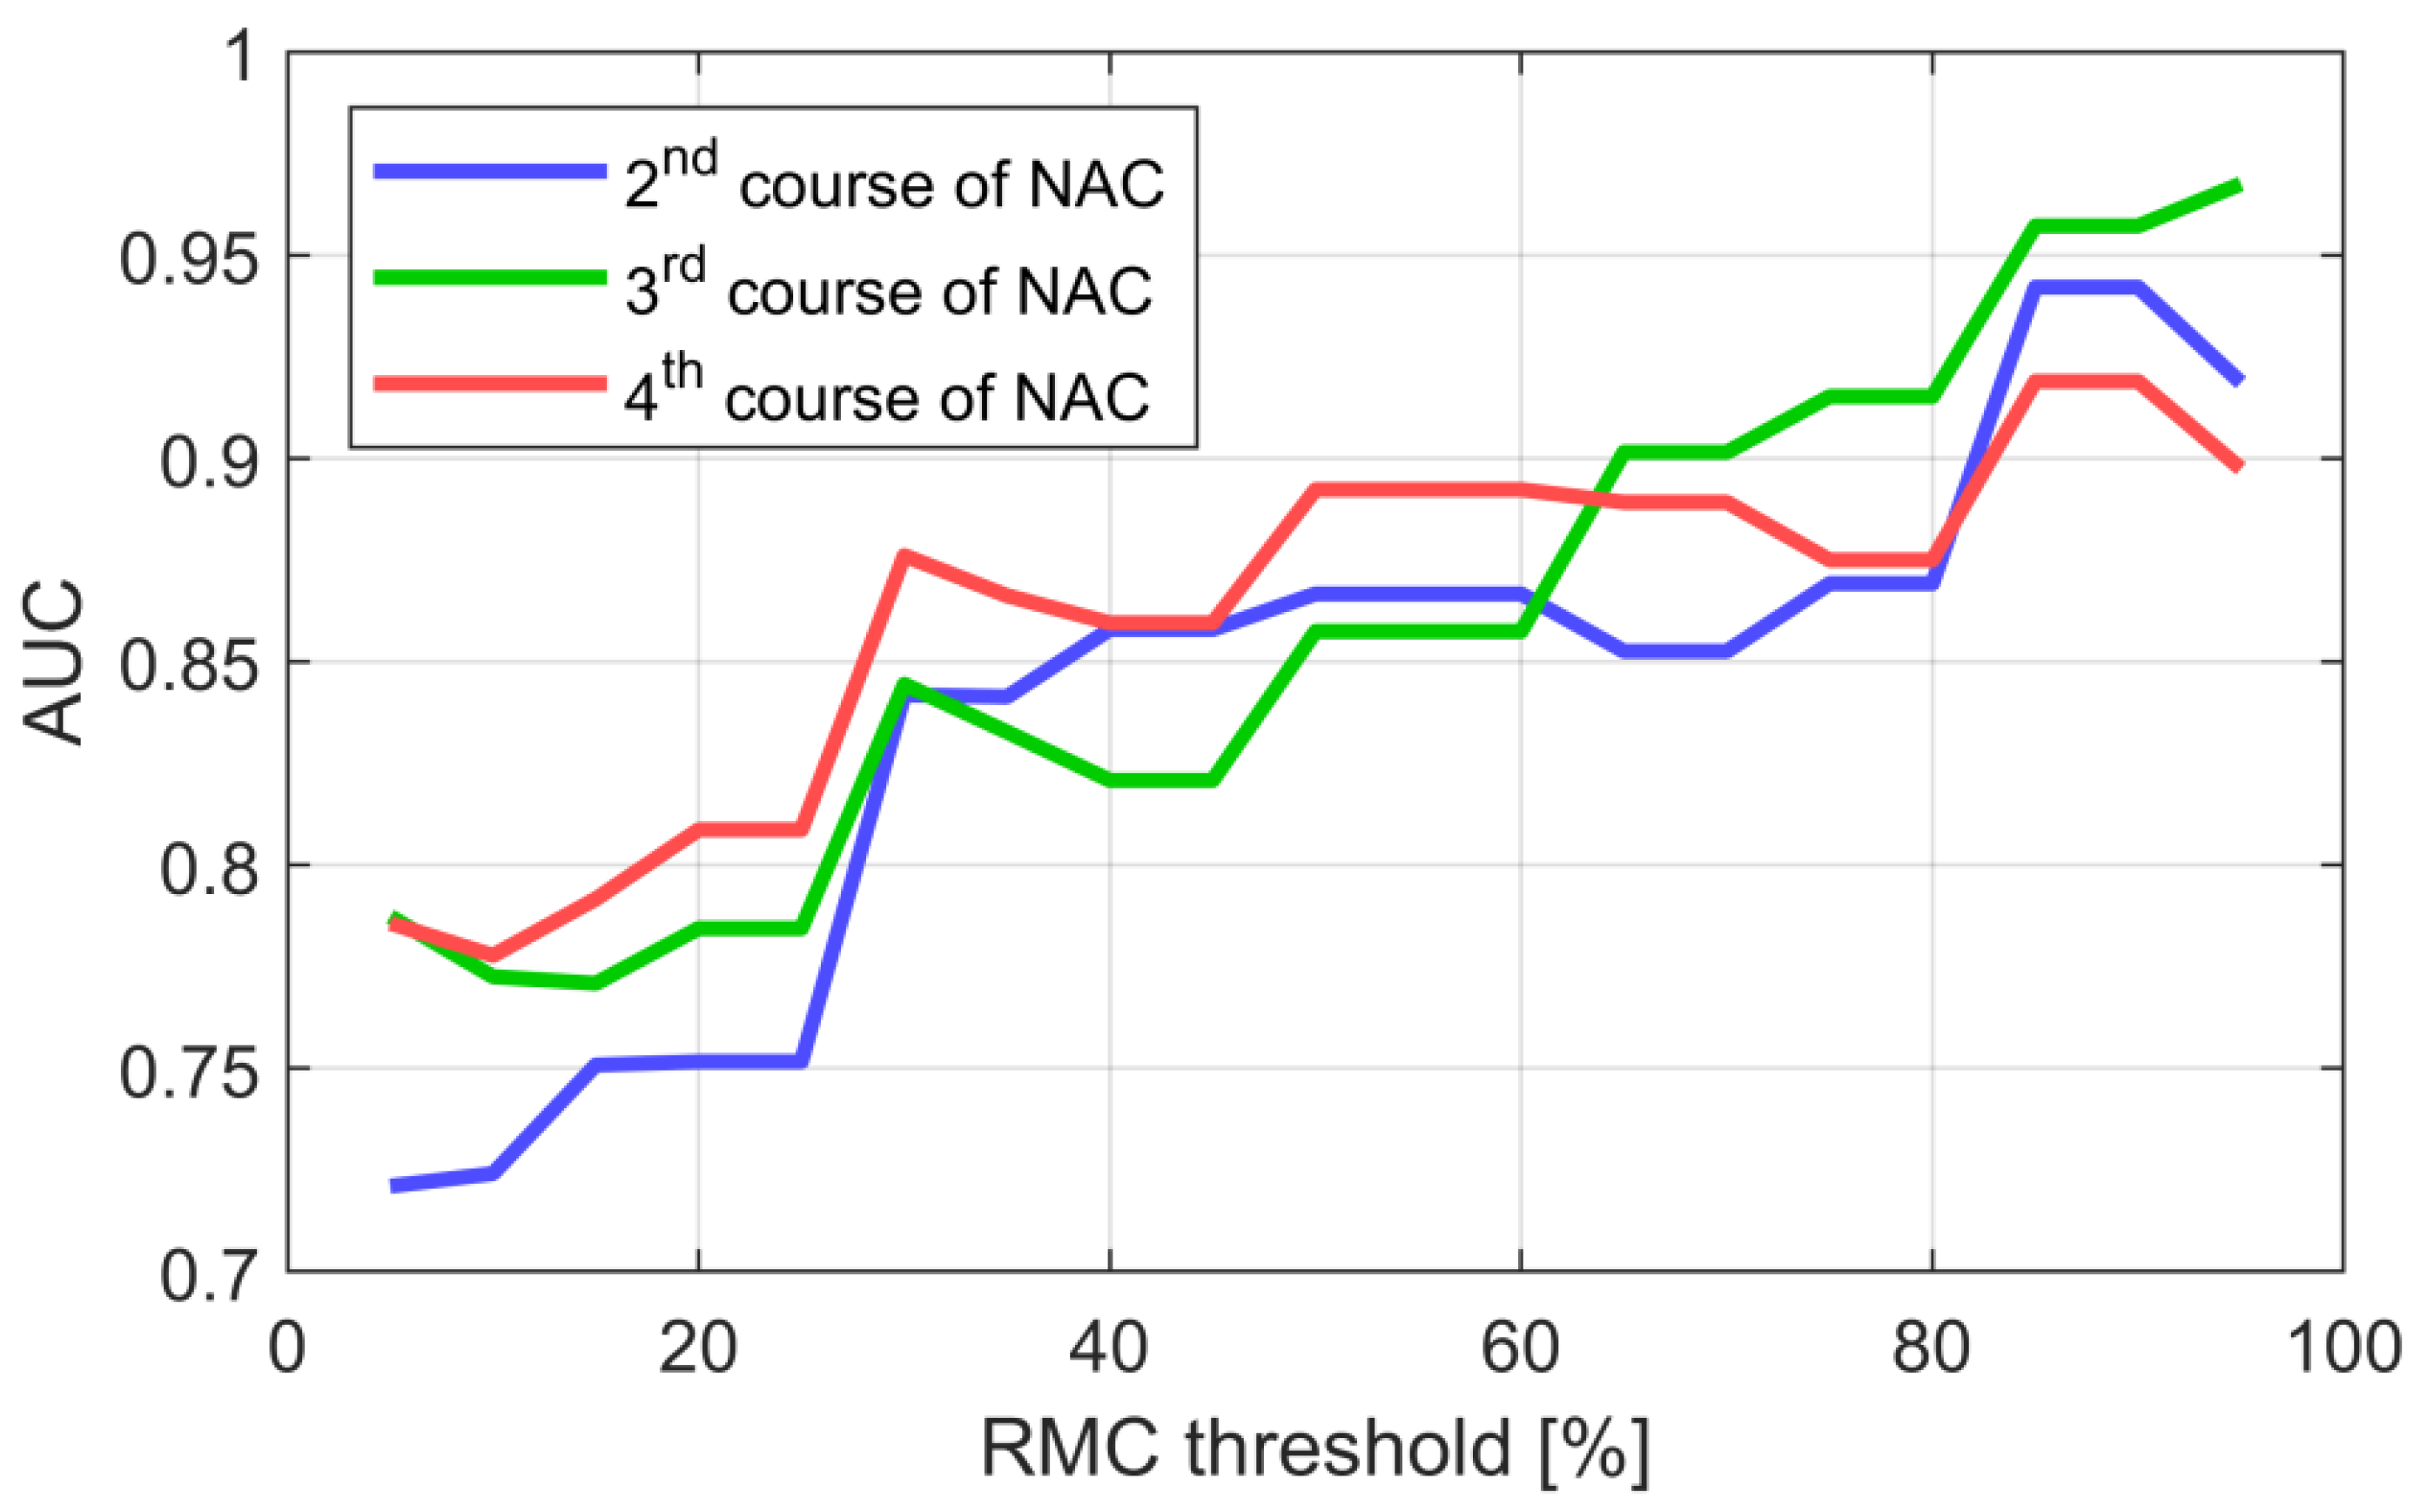
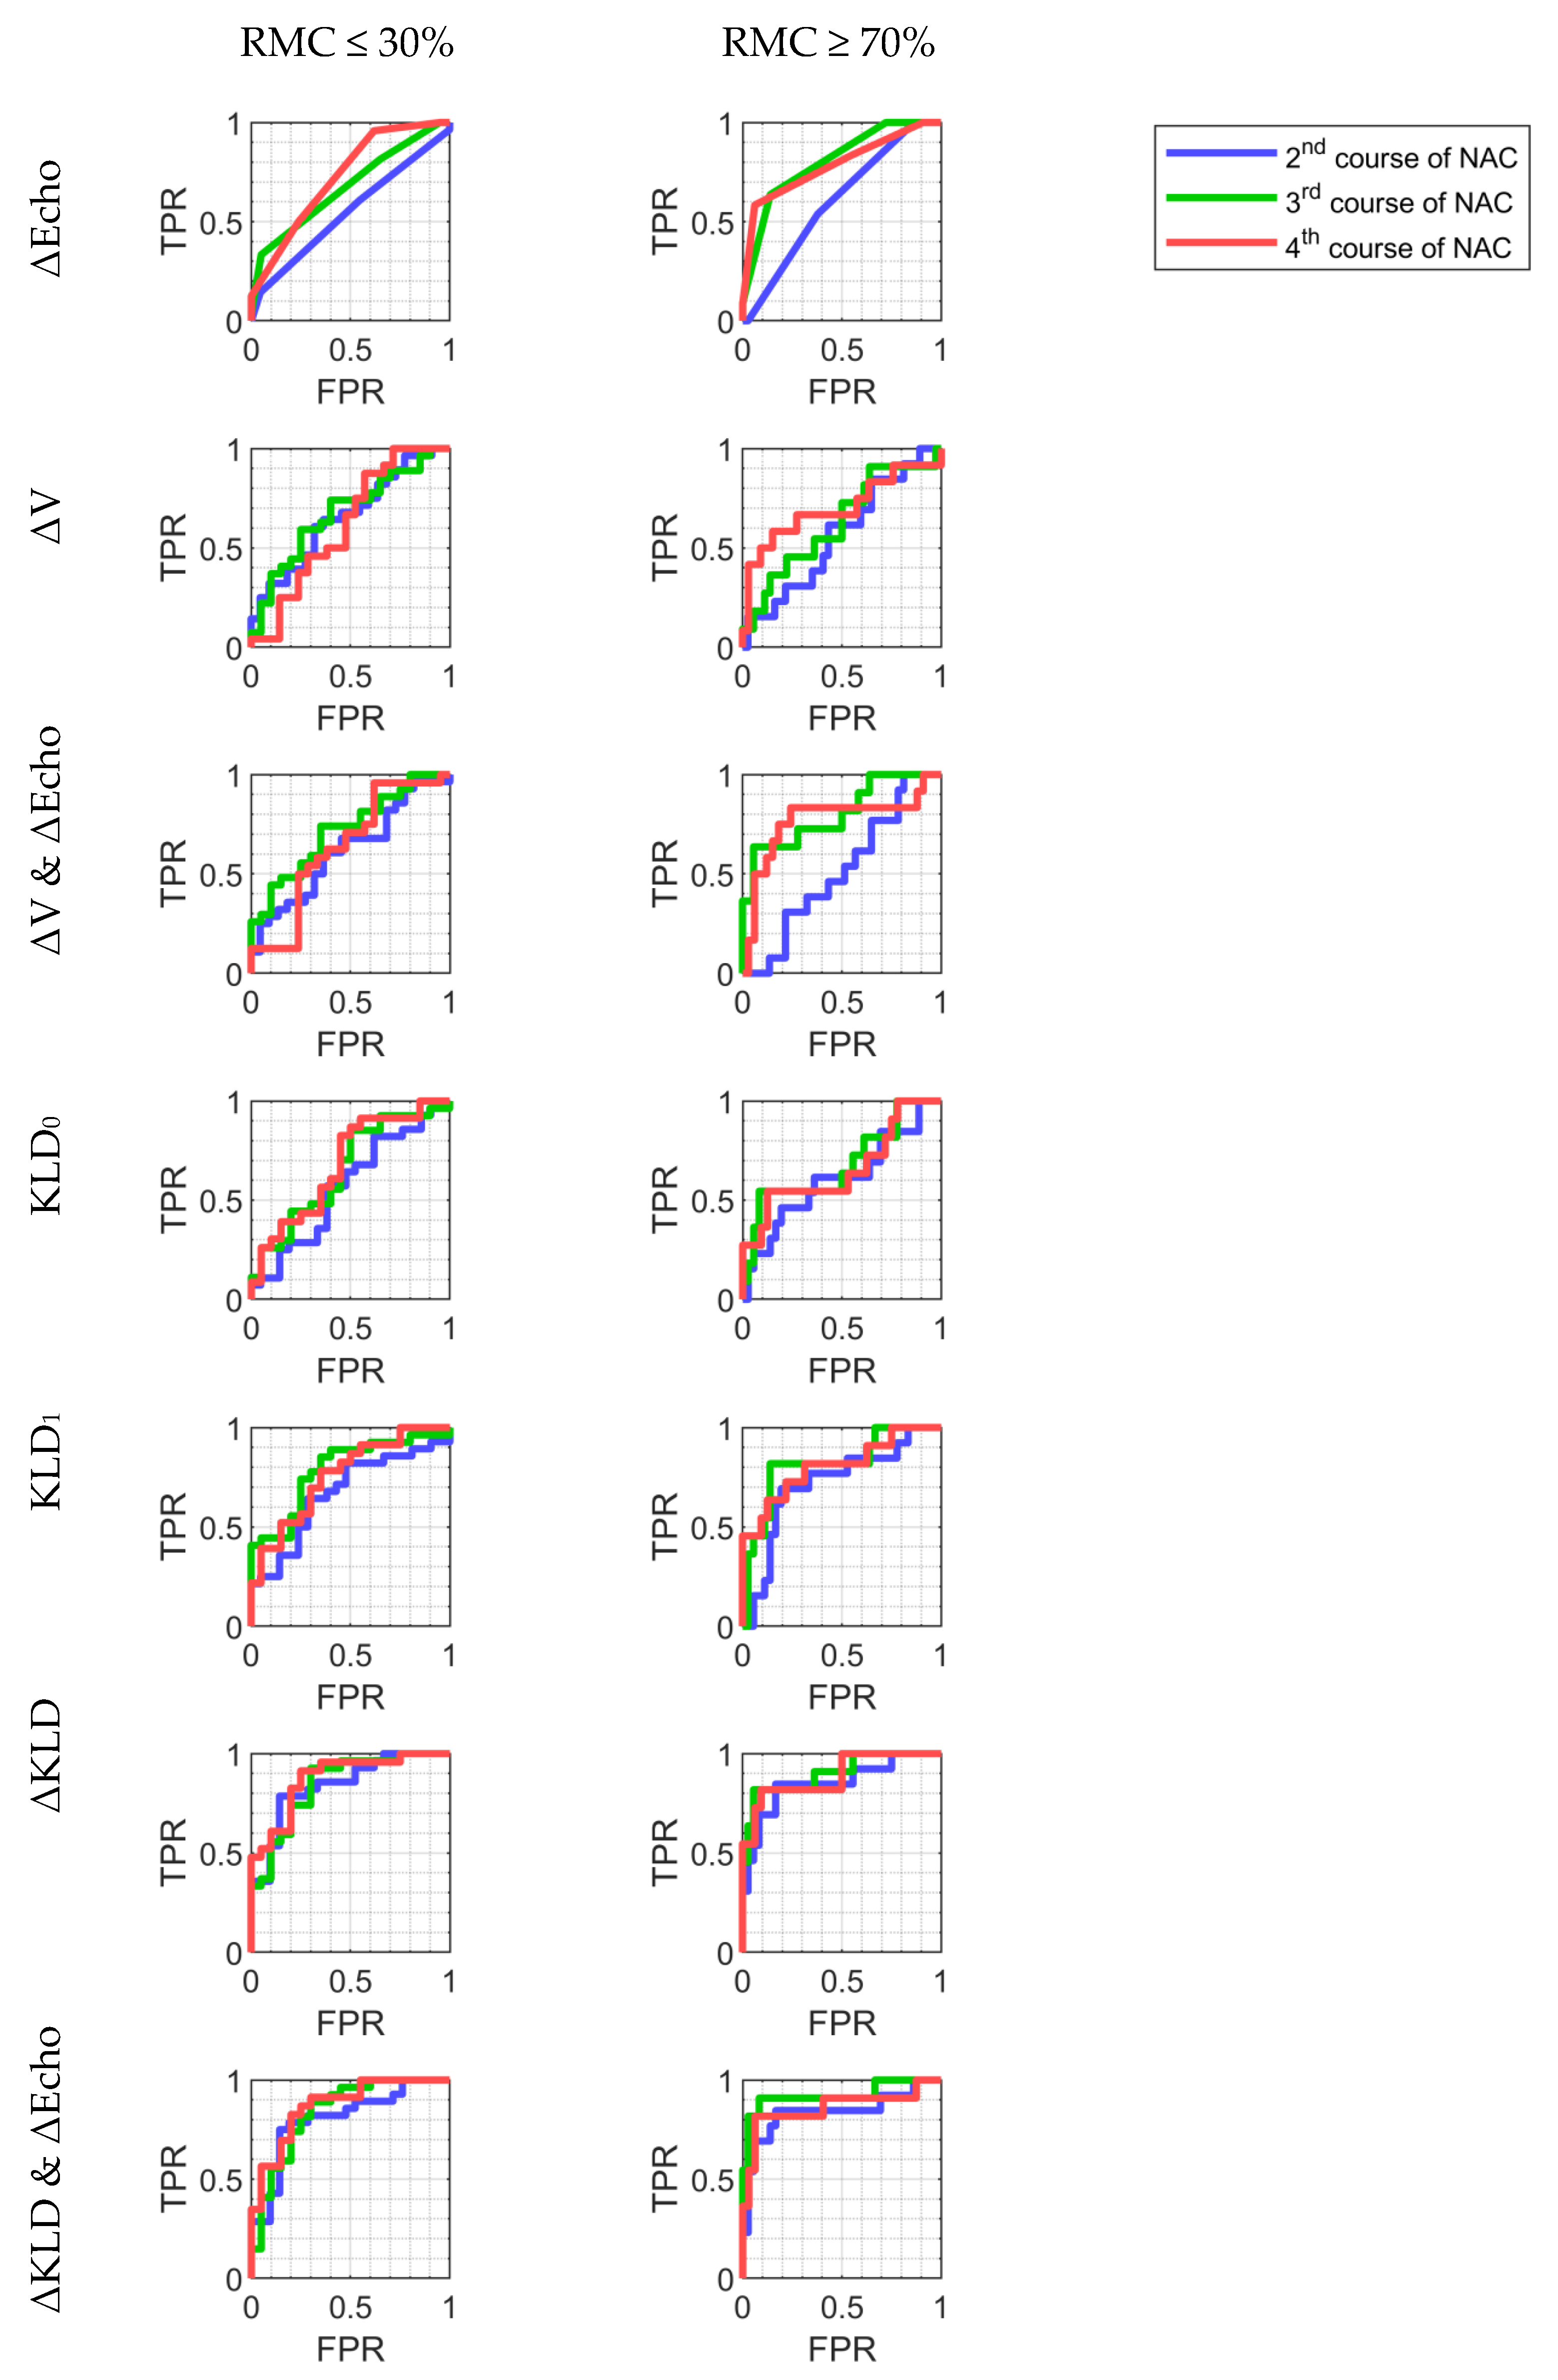
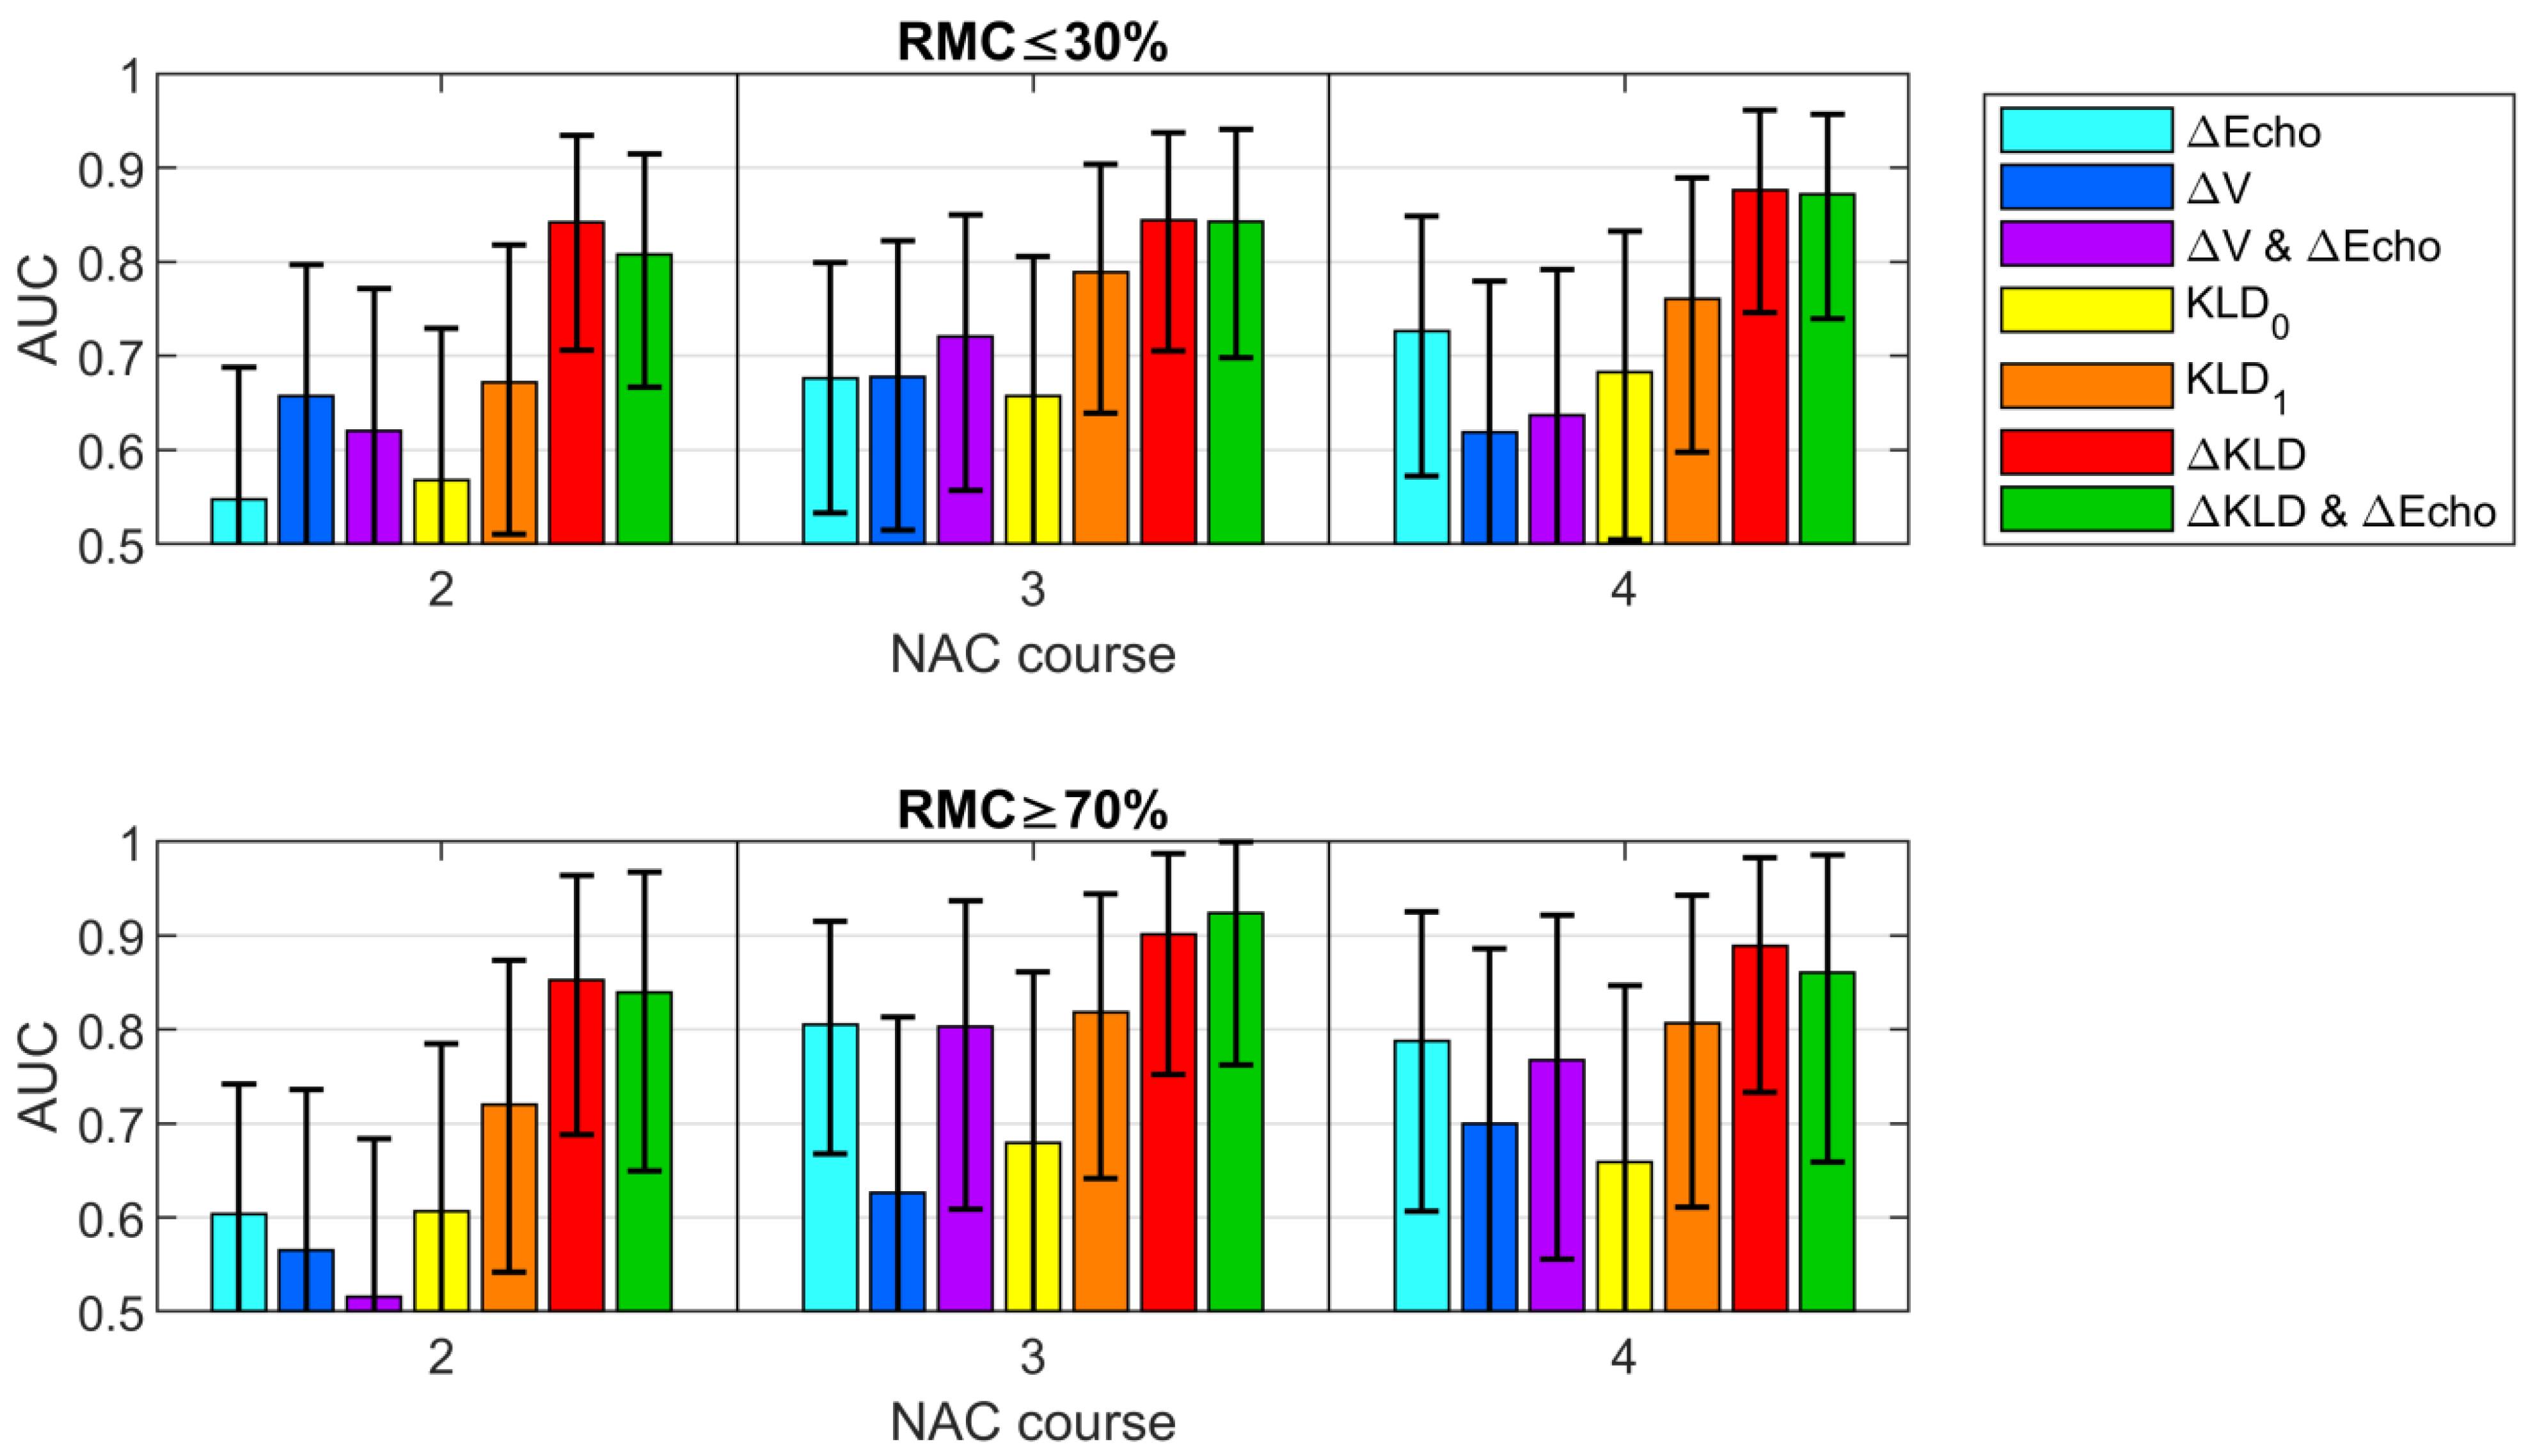
3.5. Classification
4. Discussion
5. Conclusions
Author Contributions
Funding
Institutional Review Board Statement
Informed Consent Statement
Data Availability Statement
Conflicts of Interest
Appendix A

| Parameter | 1st NAC Course | 2nd NAC Course | 3rd NAC Course | 4th NAC Course |
|---|---|---|---|---|
| ΔEcho | −0.29 (0.043) | −0.28 (0.051) | −0.40 (0.005) | −0.38 (0.009) |
| ΔV | +0.11 (0.427) | +0.24 (0.096) | +0.28 (0.061) | +0.25 (0.102) |
| KLD0 | +0.24 (0.095) | −0.23 (0.106) | −0.41 (0.004) | −0.36 (0.018) |
| KLD1 | −0.36 (0.012) | −0.58 (2 × 10⁻⁵) | −0.51 (5 × 10⁻⁴) | |
| ΔKLD | −0.56 (3 × 10⁻⁵) | −0.62 (4 × 10⁻⁶) | −0.65 (3 × 10⁻⁶) |
| Stage of Treatment | Parameter | AUC | Sensitivity | Specificity | Accuracy | PPV | NPV | |
|---|---|---|---|---|---|---|---|---|
| 1st NAC course | ΔEcho | 0.62 | 0.73 0.5 | 0.36 | 0.91 | 0.6 | 0.83 | 0.53 |
| ΔV | 0.65 | 0.79 0.49 | 0.64 | 0.73 | 0.68 | 0.75 | 0.62 | |
| ΔV & ΔEcho | 0.68 | 0.82 0.52 | 0.71 | 0.68 | 0.7 | 0.74 | 0.65 | |
| KLD0 | 0.69 | 0.82 0.53 | 0.54 | 0.86 | 0.68 | 0.83 | 0.59 | |
| KLD1 | - | - - | - | - | - | - | - | |
| ΔKLD | - | - - | - | - | - | - | - | |
| ΔKLD & ΔEcho | - | - - | - | - | - | - | - | |
| 2nd NAC course | ΔEcho | 0.55 | 0.69 0.4 | 0.61 | 0.45 | 0.54 | 0.59 | 0.48 |
| ΔV | 0.66 | 0.8 0.5 | 0.61 | 0.68 | 0.64 | 0.71 | 0.58 | |
| ΔV & ΔEcho | 0.62 | 0.76 0.45 | 0.61 | 0.64 | 0.62 | 0.68 | 0.56 | |
| KLD0 | 0.57 | 0.73 0.4 | 0.57 | 0.62 | 0.59 | 0.67 | 0.52 | |
| KLD1 | 0.67 | 0.82 0.51 | 0.64 | 0.71 | 0.67 | 0.75 | 0.6 | |
| ΔKLD | 0.84 | 0.94 0.71 | 0.79 | 0.86 | 0.82 | 0.88 | 0.75 | |
| ΔKLD & ΔEcho | 0.81 | 0.92 0.66 | 0.79 | 0.81 | 0.8 | 0.85 | 0.74 | |
| 3rd NAC course | ΔEcho | 0.68 | 0.8 0.53 | 0.33 | 0.95 | 0.6 | 0.9 | 0.51 |
| ΔV | 0.68 | 0.82 0.51 | 0.74 | 0.6 | 0.68 | 0.71 | 0.63 | |
| ΔV & ΔEcho | 0.72 | 0.85 0.55 | 0.74 | 0.65 | 0.7 | 0.74 | 0.65 | |
| KLD0 | 0.66 | 0.81 0.49 | 0.85 | 0.5 | 0.7 | 0.7 | 0.71 | |
| KLD1 | 0.79 | 0.9 0.63 | 0.74 | 0.75 | 0.74 | 0.8 | 0.68 | |
| ΔKLD | 0.84 | 0.94 0.7 | 0.93 | 0.7 | 0.83 | 0.81 | 0.88 | |
| ΔKLD & ΔEcho | 0.84 | 0.94 0.7 | 0.81 | 0.75 | 0.79 | 0.81 | 0.75 | |
| 4th NAC course | ΔEcho | 0.73 | 0.85 0.58 | 0.5 | 0.76 | 0.62 | 0.71 | 0.57 |
| ΔV | 0.62 | 0.78 0.44 | 0.75 | 0.48 | 0.62 | 0.62 | 0.63 | |
| ΔV & ΔEcho | 0.64 | 0.79 0.46 | 0.58 | 0.67 | 0.62 | 0.67 | 0.58 | |
| KLD0 | 0.68 | 0.83 0.5 | 0.83 | 0.55 | 0.7 | 0.68 | 0.73 | |
| KLD1 | 0.76 | 0.88 0.6 | 0.78 | 0.65 | 0.72 | 0.72 | 0.72 | |
| ΔKLD | 0.88 | 0.96 0.75 | 0.91 | 0.75 | 0.84 | 0.81 | 0.88 | |
| ΔKLD & ΔEcho | 0.87 | 0.95 0.74 | 0.83 | 0.8 | 0.81 | 0.83 | 0.8 | |
| Stage of treatment | Parameter | AUC | Sensitivity | Specificity | Accuracy | PPV | NPV | |
|---|---|---|---|---|---|---|---|---|
| 1st NAC course | ΔEcho | 0.6 | 0.7 0.48 | 0.92 | 0.3 | 0.46 | 0.32 | 0.92 |
| ΔV | 0.6 | 0.77 0.43 | 0.69 | 0.62 | 0.64 | 0.39 | 0.85 | |
| ΔV & ΔEcho | 0.62 | 0.78 0.45 | 0.69 | 0.68 | 0.68 | 0.43 | 0.86 | |
| KLD0 | 0.67 | 0.8 0.5 | 0.92 | 0.51 | 0.62 | 0.4 | 0.95 | |
| KLD1 | - | - - | - | - | - | - | - | |
| ΔKLD | - | - - | - | - | - | - | - | |
| ΔKLD & ΔEcho | - | - - | - | - | - | - | - | |
| 2nd NAC course | ΔEcho | 0.6 | 0.74 0.45 | 0.54 | 0.62 | 0.6 | 0.33 | 0.79 |
| ΔV | 0.57 | 0.73 0.38 | 0.62 | 0.57 | 0.58 | 0.33 | 0.81 | |
| ΔV & ΔEcho | 0.52 | 0.69 0.35 | 0.62 | 0.43 | 0.48 | 0.28 | 0.76 | |
| KLD0 | 0.61 | 0.79 0.41 | 0.62 | 0.64 | 0.63 | 0.38 | 0.82 | |
| KLD1 | 0.72 | 0.87 0.54 | 0.69 | 0.81 | 0.78 | 0.56 | 0.88 | |
| ΔKLD | 0.85 | 0.96 0.68 | 0.85 | 0.83 | 0.84 | 0.65 | 0.94 | |
| ΔKLD & ΔEcho | 0.84 | 0.97 0.65 | 0.85 | 0.83 | 0.84 | 0.65 | 0.94 | |
| 3rd NAC course | ΔEcho | 0.81 | 0.92 0.67 | 0.64 | 0.86 | 0.81 | 0.58 | 0.89 |
| ΔV | 0.63 | 0.8 0.42 | 0.73 | 0.5 | 0.55 | 0.31 | 0.86 | |
| ΔV & ΔEcho | 0.8 | 0.94 0.62 | 0.64 | 0.94 | 0.87 | 0.78 | 0.89 | |
| KLD0 | 0.68 | 0.86 0.47 | 0.55 | 0.92 | 0.83 | 0.67 | 0.87 | |
| KLD1 | 0.82 | 0.95 0.64 | 0.82 | 0.86 | 0.85 | 0.64 | 0.94 | |
| ΔKLD | 0.9 | 0.99 0.75 | 0.82 | 0.94 | 0.91 | 0.82 | 0.94 | |
| ΔKLD & ΔEcho | 0.92 | 1 0.76 | 0.91 | 0.92 | 0.91 | 0.77 | 0.97 | |
| 4th NAC course | ΔEcho | 0.79 | 0.92 0.61 | 0.58 | 0.94 | 0.84 | 0.78 | 0.86 |
| ΔV | 0.7 | 0.88 0.48 | 0.67 | 0.73 | 0.71 | 0.47 | 0.86 | |
| ΔV & ΔEcho | 0.77 | 0.92 0.56 | 0.83 | 0.76 | 0.78 | 0.56 | 0.93 | |
| KLD0 | 0.66 | 0.84 0.43 | 0.55 | 0.88 | 0.79 | 0.6 | 0.85 | |
| KLD1 | 0.81 | 0.95 0.62 | 0.73 | 0.78 | 0.77 | 0.53 | 0.89 | |
| ΔKLD | 0.89 | 0.98 0.73 | 0.82 | 0.91 | 0.88 | 0.75 | 0.94 | |
| ΔKLD & ΔEcho | 0.86 | 0.98 0.66 | 0.82 | 0.94 | 0.91 | 0.82 | 0.94 | |

References
- Available online: http://onkologia.org.pl/raporty/ (accessed on 14 July 2021).
- Early Breast Cancer Trialists’ Collaborative Group (EBCTCG). Long-term outcomes for neoadjuvant versus adjuvant chemotherapy in early breast cancer: Meta-analysis of individual patient data from ten randomised trials. Lancet Oncol. 2018, 19, 27–39. [Google Scholar] [CrossRef] [Green Version]
- Spring, L.M.; Fell, G.; Arfe, A. Pathologic Complete Response after Neoadjuvant Chemotherapy and Impact on Breast Cancer Recurrence and Survival: A Comprehensive Meta-analysis. Clin. Cancer Res. 2020, 26, 2838–2848. [Google Scholar] [CrossRef]
- Reig, B.; Heacock, L.; Lewin, A.; Cho, N.; Moy, L. Role of MRI to assess response to neoadjuvant therapy for breast cancer. J. Magn. Reson. Imaging 2020, 52, 1587–1606. [Google Scholar] [CrossRef] [PubMed]
- Haque, W.; Verma, V.; Hatch, S.; Klimberg, V.; Brian Butler, E.; Teh, B.S. Response rates and pathologic complete response by breast cancer molecular subtype following neoadjuvant chemotherapy. Breast Cancer Res. Treat. 2018, 170, 559–567. [Google Scholar] [CrossRef]
- Yun, W.; Cong, W.; Xianxin, X.; Daging, J. Meta-analysis of quantitative dynamic contrast-enhanced MRI for the assessment of neodjuvant chemotherapy in breast cancer. Am. Surg. 2019, 85, 669–677. [Google Scholar]
- Tang, S.; Xiang, C.; Yang, Q. The diagnostic performance of CESM and CE-MRI in evaluation the pathological response to neoadjuvant therapy in breast cancer: A systemic review and meta-analysis. Br. J. Radiol. 2020, 93, 20200301. [Google Scholar] [CrossRef] [PubMed]
- DiCenzo, D.; Quiaoit, K.; Fatima, K. Quantitative ultrasound radiomics in predicting response to neoadjuvant chemotherapy in patients with locally advanced breast cancer: Results from multi-institutional study. Cancer Med. 2020, 9, 5798–5806. [Google Scholar] [CrossRef] [PubMed]
- Sannachi, L.; Gangeh, M.; Tadayyon, H. Response monitoring of breast cancer patients receiving neoadjuvant chemotherapy using quantitative ultrasound, texture, and molecular features. PLoS ONE 2018, 13, e0189634. [Google Scholar] [CrossRef] [Green Version]
- Czarnota, G.; Kolios, M.; Abraham, J. Ultrasound imaging of apoptosis: High-resolution non-invasive monitoring of programmed cell death in vitro, in situ and in vivo. Br. J. Cancer 1999, 81, 520–527. [Google Scholar] [CrossRef]
- Kolios, M.C.; Czarnota, G.J.; Lee, J.; Hunt, W.; Sherar, M.D. Ultrasonic spectral parameter characterization of apoptosis. Ultrasound Med. Biol. 2002, 28, 589–597. [Google Scholar] [CrossRef]
- Quiaoit, K.; DiCenzo, D.; Fatima, K.; Bhardwaj, D.; Sannachi, L.; Gangeh, M.; Sadeghi-Naini, A.; Dasgupta, A.; Kolios, M.C.; Trudeau, M.; et al. Quantitative ultrasound radiomics for therapy response monitoring in patients with locally advanced breast cancer: Multi-Institutional study results. PLoS ONE 2020, 15, e0236182. [Google Scholar] [CrossRef] [PubMed]
- Dasgupta, A.; Brade, S.; Sannachi, L.; Quiaoit, K.; Fatima, K.; DiCenzo, D.; Osapoetra, L.O.; Saifuddin, M.; Trudeau, M.; Gandhi, S.; et al. Quantitative ultrasound radiomics using texture derivatives in prediction of treatment response to neo-adjuvant chemotherapy for locally advanced breast cancer. Oncotarget 2020, 11, 3782–3792. [Google Scholar] [CrossRef] [PubMed]
- Tadayyon, H.; Gangeh, M.; Sannachi, L.; Trudeau, M.; Pritchard, K.; Ghandi, S.; Eisen, A.; Look-Hong, N.; Holloway, C.; Wright, F.; et al. A priori prediction of breast tumour response to chemotherapy using quantitative ultrasound imaging and artificial neural networks. Oncotarget 2019, 10, 3910–3923. [Google Scholar] [CrossRef]
- Dobruch-Sobczak, K.; Piotrzkowska-Wróblewska, H.; Klimoda, Z.; Karwat, P.; Roszkowska-Purska, K.; Clauser, P.; Baltzer, P.A.T.; Litniewski, J. Multiparametric ultrasound examination for response assessment in breast cancer patients undergoing neoadjuvant therapy. Sci. Rep. 2021, 11, 2501. [Google Scholar] [CrossRef] [PubMed]
- Dobruch-Sobczak, K.; Piotrzkowska-Wróblewska, H.; Klimonda, Z.; Roszkowska-Purska, K.; Litniewski, J. Ultrasound echogenicity reveals the response of breast cancer to chemotherapy. Clin. Imaging 2019, 55, 41–46. [Google Scholar] [CrossRef] [PubMed]
- Kullback, S. Information Theory and Statistics; Courier Corporation: North Chelmsford, MA, USA, 1997. [Google Scholar]
- Morigi, C. Tailored treatments for patients with early breast cancer. In Proceedings of the Highlights from the 15th StGallen International Breast Cancer Conference, Vienna, Austria, 15–18 March 2017. [Google Scholar]
- Symmans, W.F.; Peintinger, F.; Hatzis, C.; Rajan, R.; Kuerer, H.; Valero, V.; Assad, L.; Poniecka, A.; Hennessy, B.; Green, M.; et al. Measurement of residual breast cancer burden to predict survival after neoadjuvant chemotherapy. J. Clin. Oncol. 2007, 25, 4414–4422. [Google Scholar] [CrossRef] [PubMed]
- American College of Radiology Breast Imaging Reporting and Data System (BI-RADS) 5; American College of Radiology: Reston, VA, USA, 2013.
- Jakubowski, W.; Dobruch-Sobczak, K.; Migda, B. Standards of the Polish Ultrasound Society—Update. Sonomammography examination. J. Ultrasound 2012, 12, 245–261. [Google Scholar] [CrossRef] [Green Version]
- Rosenblatt, M. Remarks on Some Nonparametric Estimates of a Density Function. Ann. Math. Stat. 1956, 27, 832–883. [Google Scholar] [CrossRef]
- Chen, Y.-C. A tutorial on kernel density estimation and recent advances. J. Epidemiol. Biostat. 2017, 1, 161–187. [Google Scholar] [CrossRef]
- Fisher, R.A. The use of multiple measurements in taxonomic problems. Ann. Eugen. 1936, 7, 179–188. [Google Scholar] [CrossRef]
- Molinaro, A.M.; Simon, R.; Pfeiffer, R.M. Prediction error estimation: A comparison of resampling methods. Bioinformatics 2005, 21, 3301–3307. [Google Scholar] [CrossRef] [Green Version]
- Hanley, J.; McNeil, B. The meaning and use of the area under a receiver operating characteristic (ROC) curve. Radiology 1982, 143, 29–36. [Google Scholar] [CrossRef] [Green Version]
- Unal, I. Defining an optimal cut-point value in ROC analysis: An alternative approach, computational and mathematical methods in medicine. Comput. Math. Methods Med. 2017, 4, 1–14. [Google Scholar] [CrossRef]
- Minarikova, L.; Bogner, W.; Pinker, K.; Valkovic, L.; Zaric, O.; Bogo-Horvath, Z.; Bartsch, R.; Helbich, T.H. Investigating the prediction value of multiparametric magnetic resonance imaging at 3 T in response to neoadjuvant chemotherapy in breast cancer. Eur. Radiol. 2017, 27, 1901–1911. [Google Scholar] [CrossRef] [Green Version]
- Chu, W.; Jin, W.; Liu, D.; Wang, J.; Geng, C.; Chen, L.; Huang, X. Diffusion-weighted imaging in identifying breast cancer pathological response to neodjuvant chemotherapy: A meta-analysis. Oncotarget 2017, 9, 7088–7100. [Google Scholar] [CrossRef] [PubMed] [Green Version]
- Partridge, S.C.; Nissan, N.; Rahbar, H.; Kitsch, A.E.; Sigmund, E.E. Diffusion-weighted breast MRI: Clinic al applications and emerging techniques. J. Magn. Reson. Imaging 2017, 45, 337–355. [Google Scholar] [CrossRef] [PubMed]
- Marinovich, M.L.; Houssami, N.; Macaskill, P.; von Mickwitz, G.; Blohmer, J.U.; Irwig, L. Accuraccy of ultrasound for predicting pathologic response during neoadjuvant therapy for breast cancer. Int. J. Cancer 2015, 136, 2730–2737. [Google Scholar] [CrossRef] [PubMed]
- Eisenhauer, E.A.; Therasse, P.; Bogaerts, J.; Schwartz, L.H.; Sargent, D.; Ford, R.; Dancey, J.; Arbuck, S.; Gwyther, S.; Mooney, M.; et al. New response evaluation criteria in solid tumours: Revised RECIST guideline (version 1.1.). Eur. J. Cancer 2009, 45, 228–247. [Google Scholar] [CrossRef] [PubMed]
- WHO. Classification of Tumours, Breast Tumors, 5th ed.; IARC: Lyon, France, 2018; p. 92. [Google Scholar]


| Category | Characteristic | Count/Value |
|---|---|---|
| Patients | Number of patients | 39 |
| Mean age (years) | 57 | |
| Age range (years) | 32–83 | |
| Tumor histology | Invasive ductal carcinoma (IDC) | 50 |
| IDC with ductal carcinoma in situ | 20 | |
| Receptor status | Luminal A | 9 |
| Luminal B | 24 | |
| TNBC | 9 | |
| HER 2+ | 8 | |
| Pathological response (RMC%) | 0 | 14 |
| ≤30 | 28 | |
| 31–69 | 9 | |
| ≥70 | 13 | |
| Surgical treatment | Mastectomy | 37 |
| Surgical treatment | BCT | 2 |
| Echogenicity | Pre-Treatment | 1st NAC Course | 2nd NAC Course | 3rd NAC Course | 4th NAC Course | ||||||||||
|---|---|---|---|---|---|---|---|---|---|---|---|---|---|---|---|
| n | μRMC | σRMC | n | μRMC | σRMC | n | μRMC | σRMC | n | μRMC | σRMC | n | μRMC | σRMC | |
| Echo = 1 | 47 | 35 | 37 | 37 | 40 | 37 | 20 | 41 | 39 | 11 | 57 | 45 | 9 | 76 | 34 |
| Echo = 2 | 3 | 37 | 40 | 11 | 26 | 32 | 24 | 38 | 36 | 26 | 34 | 32 | 18 | 28 | 31 |
| Echo = 3 | 0 | - | - | 2 | 0 | 0 | 6 | 8 | 20 | 8 | 13 | 18 | 15 | 28 | 30 |
| Echo = 4 | 0 | - | - | 0 | - | - | 0 | - | - | 2 | 0 | 0 | 3 | 10 | 16 |
| All | 50 | 35 | 36 | 50 | 35 | 36 | 50 | 35 | 36 | 47 | 34 | 36 | 45 | 37 | 36 |
| Measure of Performance | 2nd NAC Course | 3rd NAC Course | 4th NAC Course | |||||||||||||||
|---|---|---|---|---|---|---|---|---|---|---|---|---|---|---|---|---|---|---|
| ΔEcho | ΔV | ΔKLD | ΔEcho | ΔV | ΔKLD | ΔEcho | ΔV | ΔKLD | ||||||||||
| AUC | 0.60 | 0.75 | 0.57 | 0.74 | 0.85 | 0.96 | 0.81 | 0.91 | 0.63 | 0.80 | 0.90 | 0.99 | 0.79 | 0.92 | 0.70 | 0.88 | 0.89 | 0.99 |
| 0.46 | 0.37 | 0.69 | 0.66 | 0.42 | 0.75 | 0.60 | 0.48 | 0.73 | ||||||||||
| Sensitivity | 0.54 | 0.62 | 0.85 | 0.64 | 0.73 | 0.82 | 0.58 | 0.67 | 0.82 | |||||||||
| Specificity | 0.62 | 0.57 | 0.83 | 0.86 | 0.50 | 0.94 | 0.94 | 0.73 | 0.91 | |||||||||
| Accuracy | 0.60 | 0.58 | 0.84 | 0.81 | 0.55 | 0.91 | 0.84 | 0.71 | 0.88 | |||||||||
| PPV | 0.33 | 0.33 | 0.65 | 0.58 | 0.31 | 0.82 | 0.78 | 0.47 | 0.75 | |||||||||
| NPV | 0.79 | 0.81 | 0.94 | 0.89 | 0.86 | 0.94 | 0.86 | 0.86 | 0.94 | |||||||||
| Measure of Performance | 2nd NAC Course | 3rd NAC Course | 4th NAC Course | |||||||||||||||
|---|---|---|---|---|---|---|---|---|---|---|---|---|---|---|---|---|---|---|
| ΔEcho | ΔV | ΔKLD | ΔEcho | ΔV | ΔKLD | ΔEcho | ΔV | ΔKLD | ||||||||||
| AUC | 0.55 | 0.69 | 0.66 | 0.8 | 0.84 | 0.93 | 0.68 | 0.8 | 0.68 | 0.82 | 0.84 | 0.94 | 0.73 | 0.85 | 0.62 | 0.78 | 0.88 | 0.96 |
| 0.4 | 0.5 | 0.71 | 0.53 | 0.51 | 0.71 | 0.57 | 0.44 | 0.75 | ||||||||||
| Sensitivity | 0.61 | 0.61 | 0.79 | 0.33 | 0.74 | 0.93 | 0.5 | 0.75 | 0.91 | |||||||||
| Specificity | 0.45 | 0.68 | 0.86 | 0.95 | 0.6 | 0.7 | 0.76 | 0.48 | 0.75 | |||||||||
| Accuracy | 0.54 | 0.64 | 0.82 | 0.6 | 0.68 | 0.83 | 0.62 | 0.62 | 0.84 | |||||||||
| PPV | 0.59 | 0.71 | 0.88 | 0.9 | 0.71 | 0.81 | 0.71 | 0.62 | 0.81 | |||||||||
| NPV | 0.48 | 0.58 | 0.75 | 0.51 | 0.63 | 0.88 | 0.57 | 0.63 | 0.88 | |||||||||
| RMC ≥ 70% | 1st NAC Course | 2nd NAC Course | 3rd NAC Course | 4th NAC Course |
|---|---|---|---|---|
| AUC | 0.62 | 0.52 | 0.8 | 0.77 |
| Sensitivity | 0.69 | 0.62 | 0.64 | 0.83 |
| Specificity | 0.68 | 0.43 | 0.94 | 0.76 |
| Accuracy | 0.68 | 0.48 | 0.87 | 0.78 |
| PPV | 0.43 | 0.28 | 0.78 | 0.56 |
| NPV | 0.86 | 0.76 | 0.89 | 0.93 |
Publisher’s Note: MDPI stays neutral with regard to jurisdictional claims in published maps and institutional affiliations. |
© 2021 by the authors. Licensee MDPI, Basel, Switzerland. This article is an open access article distributed under the terms and conditions of the Creative Commons Attribution (CC BY) license (https://creativecommons.org/licenses/by/4.0/).
Share and Cite
Dobruch-Sobczak, K.S.; Piotrzkowska-Wróblewska, H.; Karwat, P.; Klimonda, Z.; Markiewicz-Grodzicka, E.; Litniewski, J. Quantitative Assessment of the Echogenicity of a Breast Tumor Predicts the Response to Neoadjuvant Chemotherapy. Cancers 2021, 13, 3546. https://doi.org/10.3390/cancers13143546
Dobruch-Sobczak KS, Piotrzkowska-Wróblewska H, Karwat P, Klimonda Z, Markiewicz-Grodzicka E, Litniewski J. Quantitative Assessment of the Echogenicity of a Breast Tumor Predicts the Response to Neoadjuvant Chemotherapy. Cancers. 2021; 13(14):3546. https://doi.org/10.3390/cancers13143546
Chicago/Turabian StyleDobruch-Sobczak, Katarzyna Sylwia, Hanna Piotrzkowska-Wróblewska, Piotr Karwat, Ziemowit Klimonda, Ewa Markiewicz-Grodzicka, and Jerzy Litniewski. 2021. "Quantitative Assessment of the Echogenicity of a Breast Tumor Predicts the Response to Neoadjuvant Chemotherapy" Cancers 13, no. 14: 3546. https://doi.org/10.3390/cancers13143546
APA StyleDobruch-Sobczak, K. S., Piotrzkowska-Wróblewska, H., Karwat, P., Klimonda, Z., Markiewicz-Grodzicka, E., & Litniewski, J. (2021). Quantitative Assessment of the Echogenicity of a Breast Tumor Predicts the Response to Neoadjuvant Chemotherapy. Cancers, 13(14), 3546. https://doi.org/10.3390/cancers13143546