
Deciphering the Nature of Trp73 Isoforms in Mouse Embryonic Stem Cell Models: Generation of Isoform-Specific Deficient Cell Lines Using the CRISPR/Cas9 Gene Editing System

 , and
, and 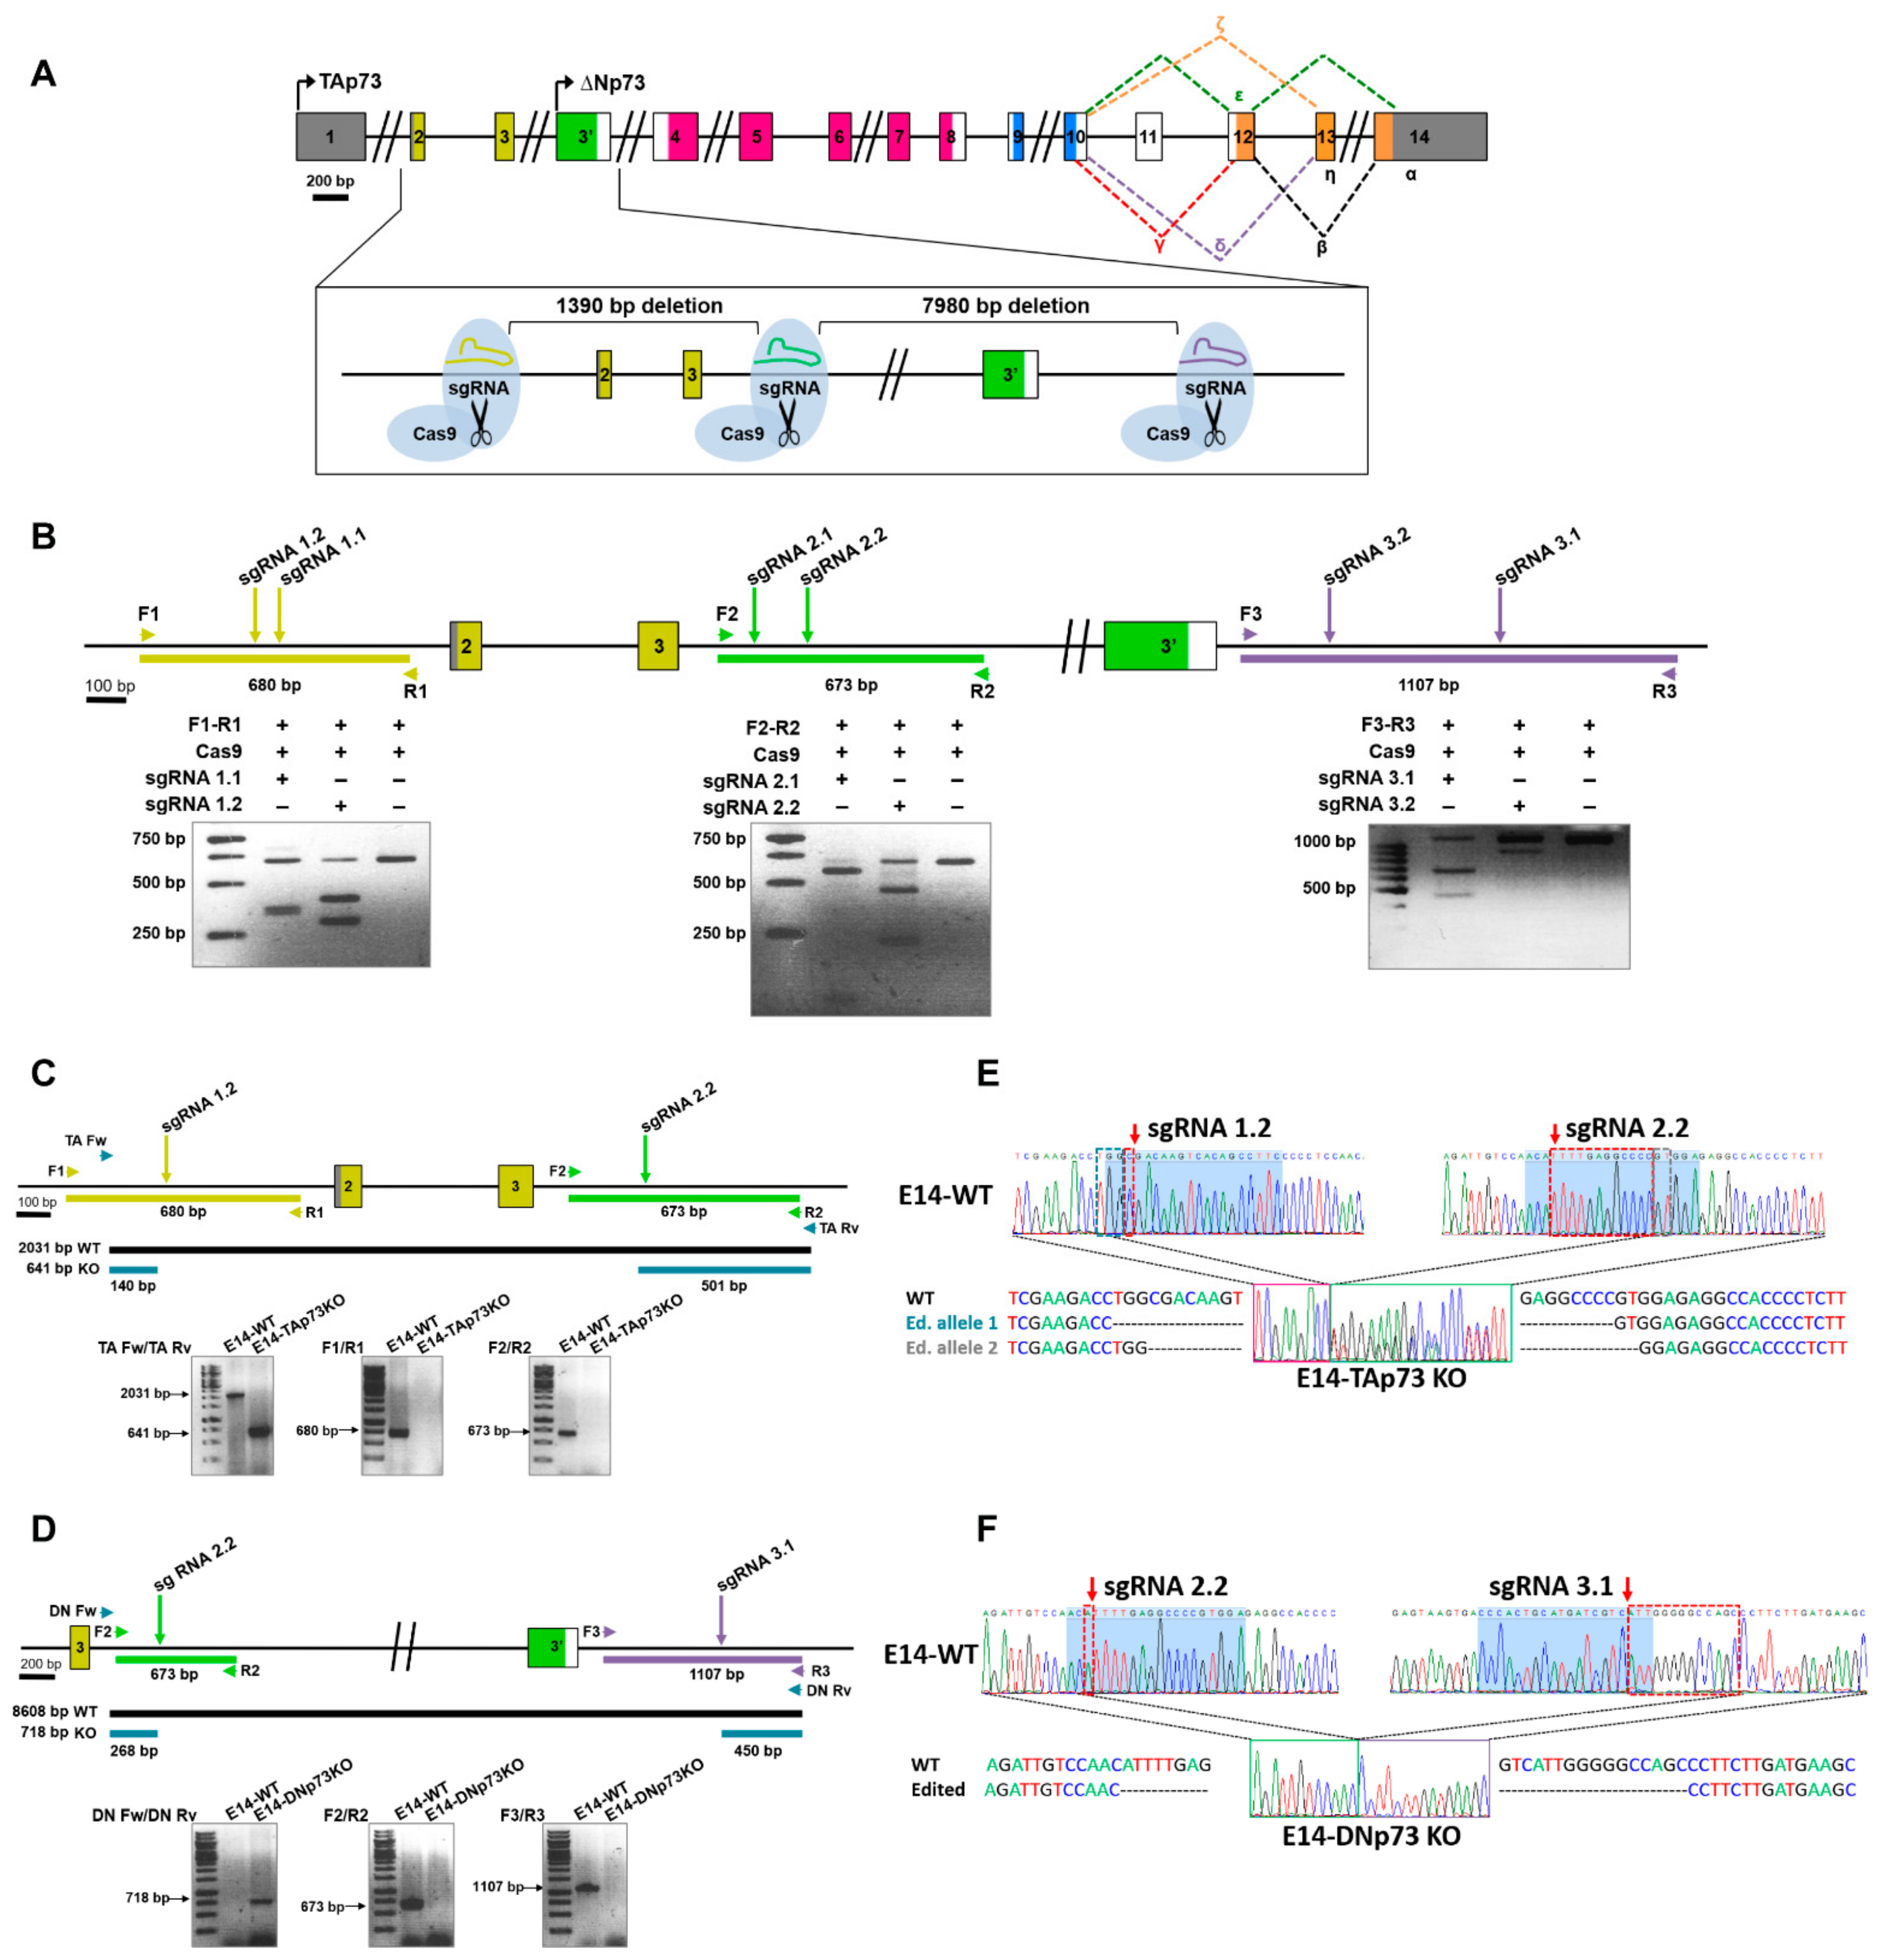
Abstract
:Simple Summary
Abstract
1. Introduction
2. Materials and Methods
2.1. Cell Culture
2.2. Single Guide RNA (sgRNA) Design and Validation
- Guide 1.1 TAAACCTACAATGACGGCCAGGG (position 34875-34898, strand −, score 94)
- Guide 1.2 GAAGGCTGTGACTTGTCGCCAGG (position 34812-34835, strand −, score 92.6)
- Guide 2.1 CCCGAAGCTCTTCCTACCGCTGG (position 36063-36086, strand −, score 92.9)
- Guide 2.2 TCCACGGGGCCTCAAAATGTTGG (position 36202-36225, strand −, score 91.2)
- Guide 3.1 CCCACTGCATGATCGTCATTGGG (position 44081-44104, strand +, score 97.3)
- Guide 3.2 ACCTCTTTGCAGCGCTCCTAGGG (position 43663-43686, strand −, score 89.8)
2.3. Gene Editing of mESC
2.4. Gene Expression Analysis
2.5. 2D-Diferentiation Assay
2.6. RNA Sequencing and Transcriptome Data Analysis
2.7. Cell Growth Kinetics and Cell Cycle Analysis
2.8. Immunofluorescence
2.9. Immunoblotting
2.10. Alkaline Phosphatase (AP) Staining
2.11. Statistical Analysis
3. Results and Discussion
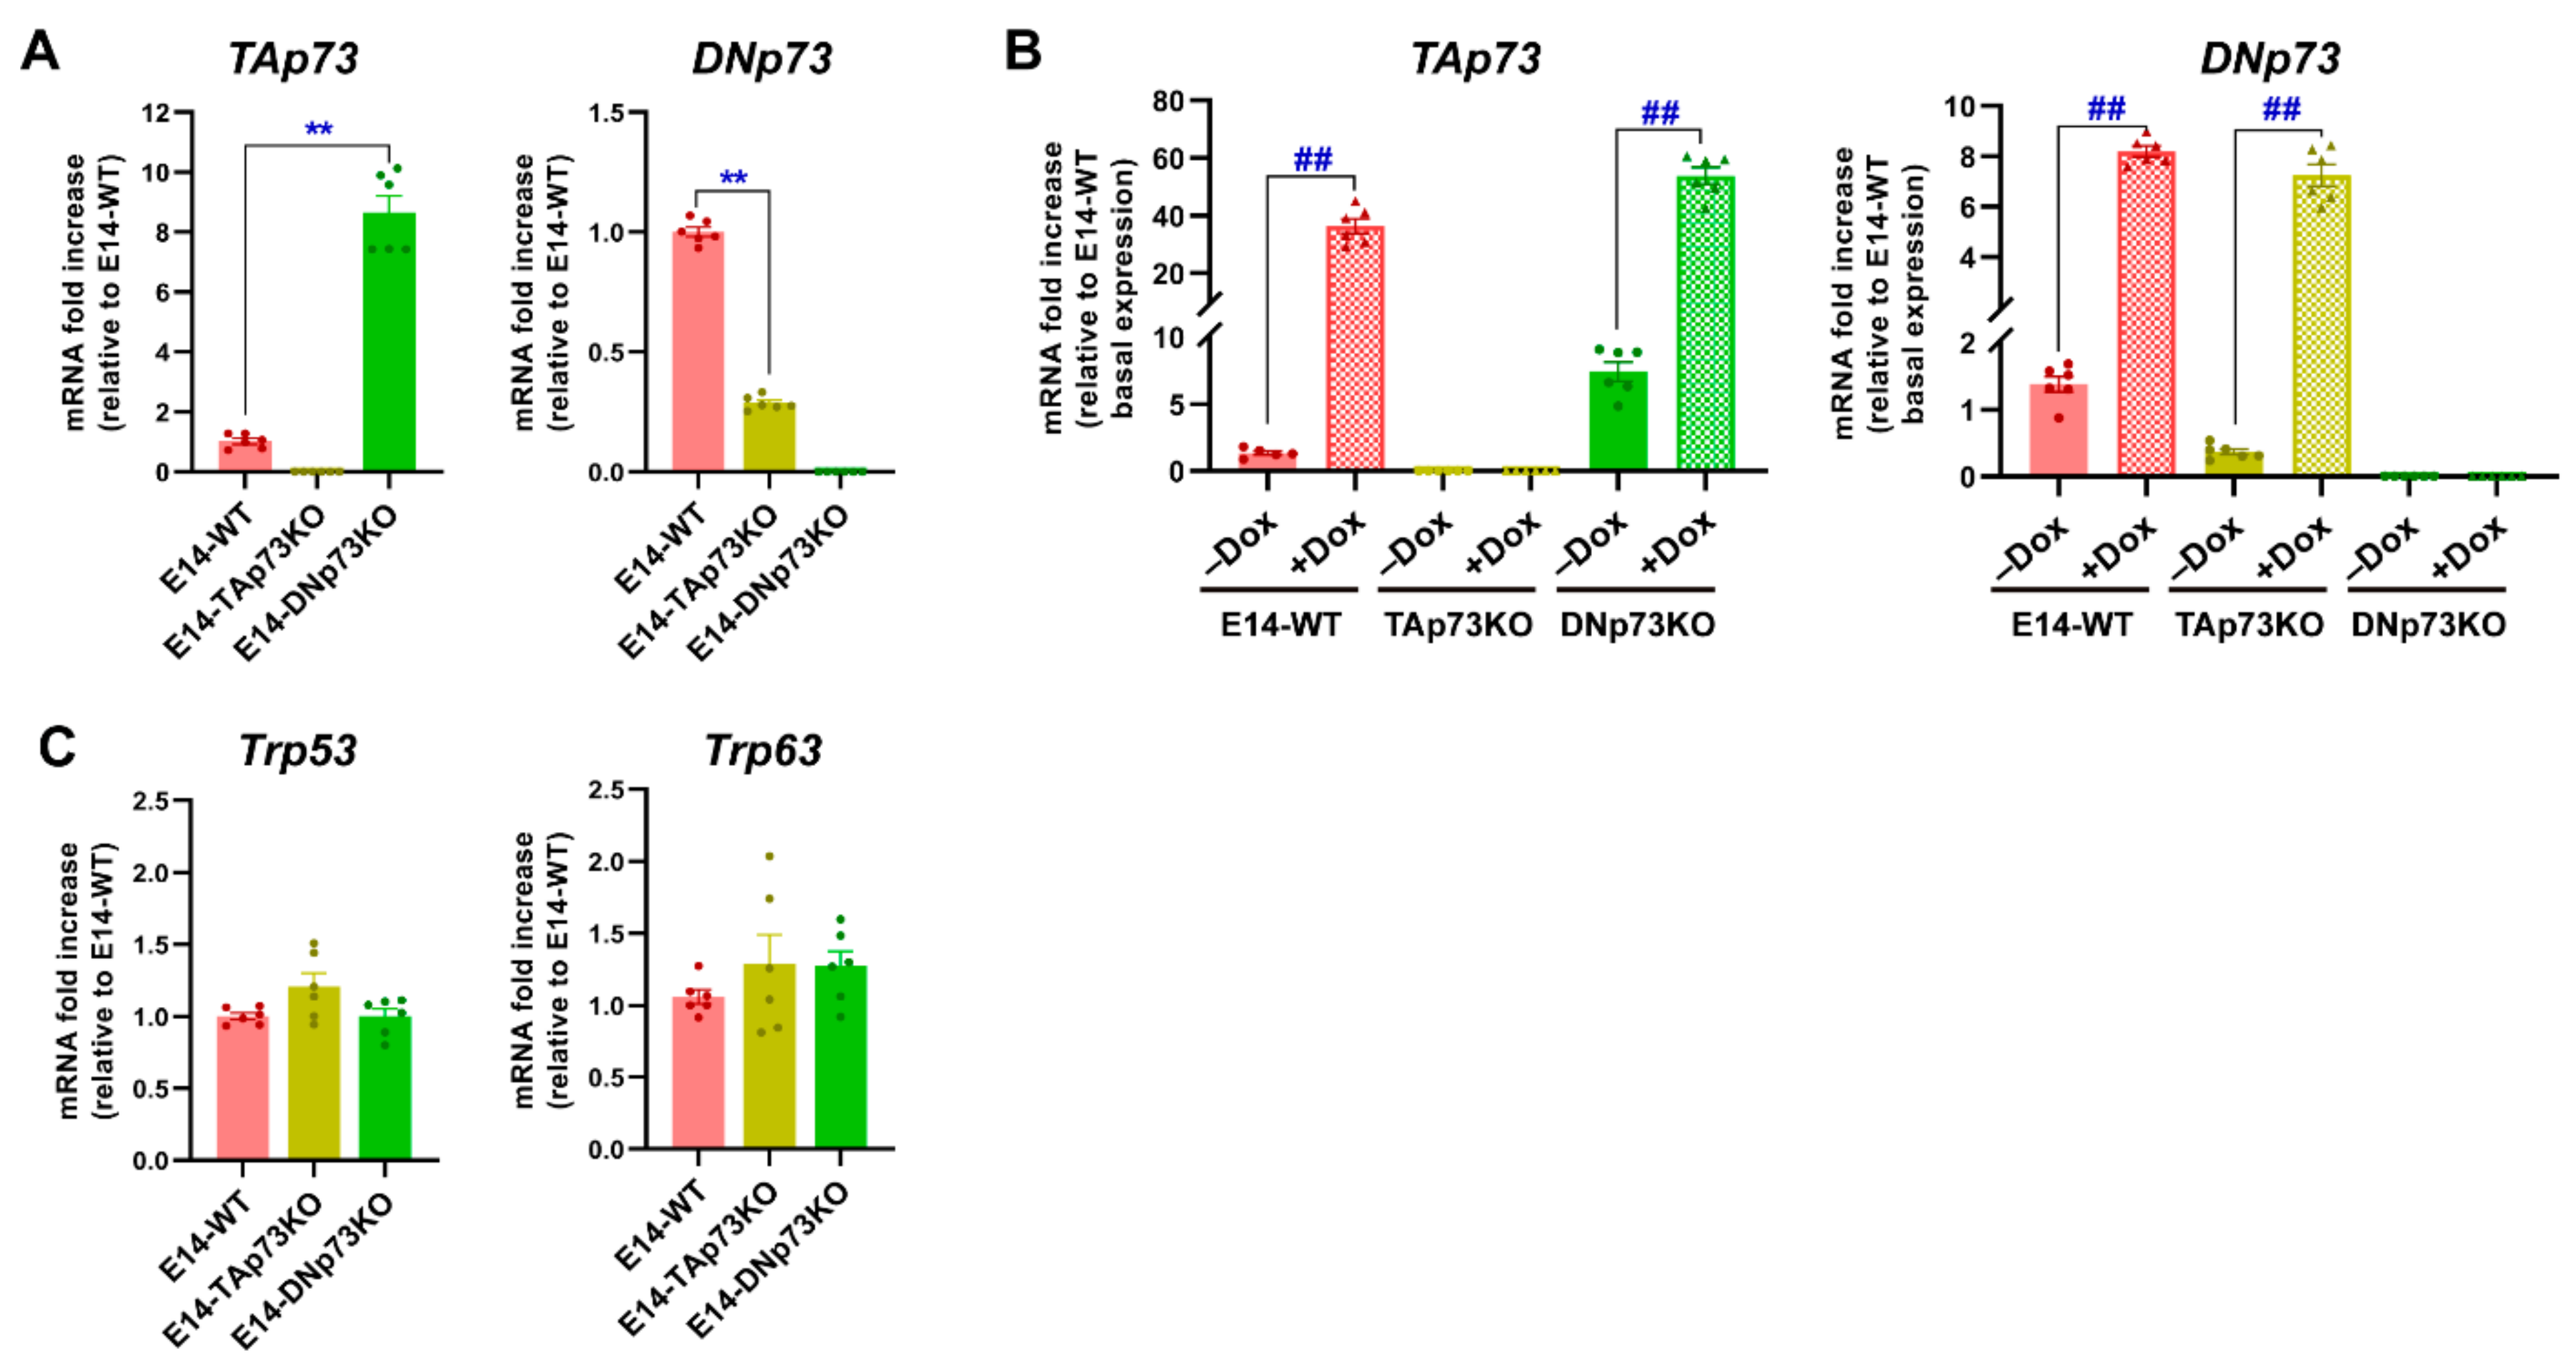
3.1. Generation of TA- and DN-p73-Specific Knockout mESC by CRISPR/Cas9 Gene Editing
3.2. Elimination of TA- or DN-p73 Isoforms Induces Isoform-Specific Changes in the mESC Transcriptional Profiles
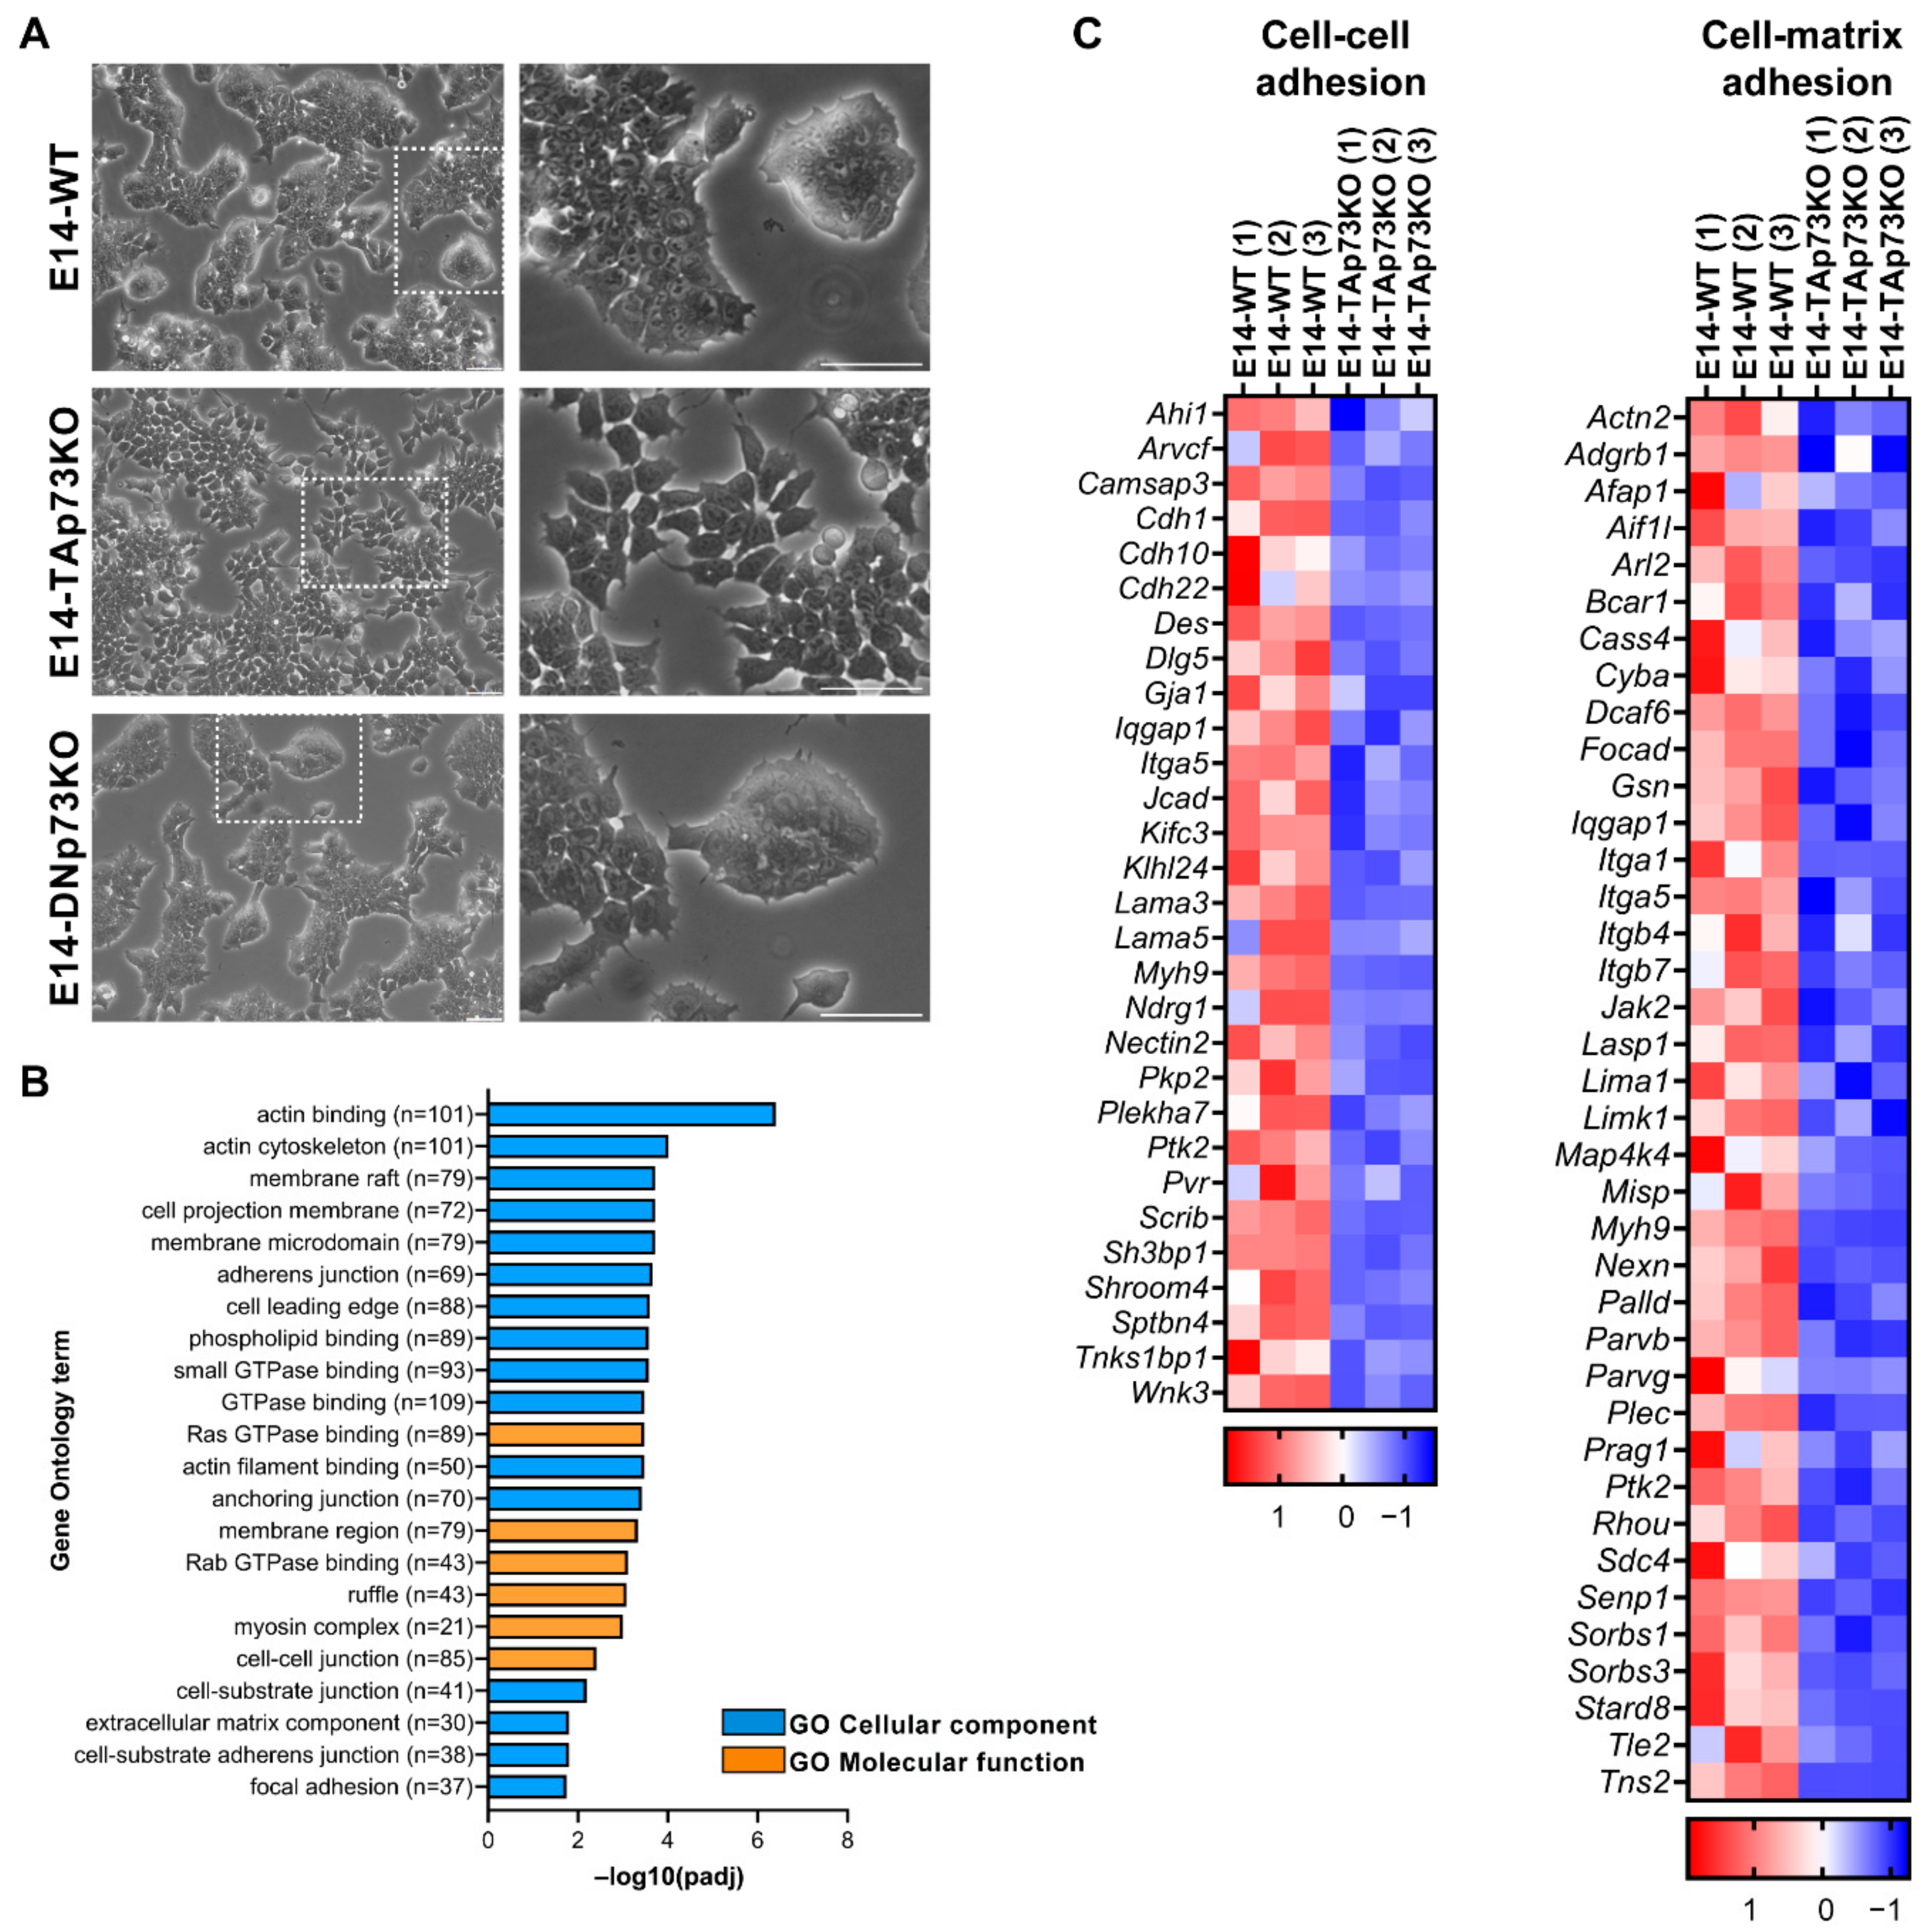
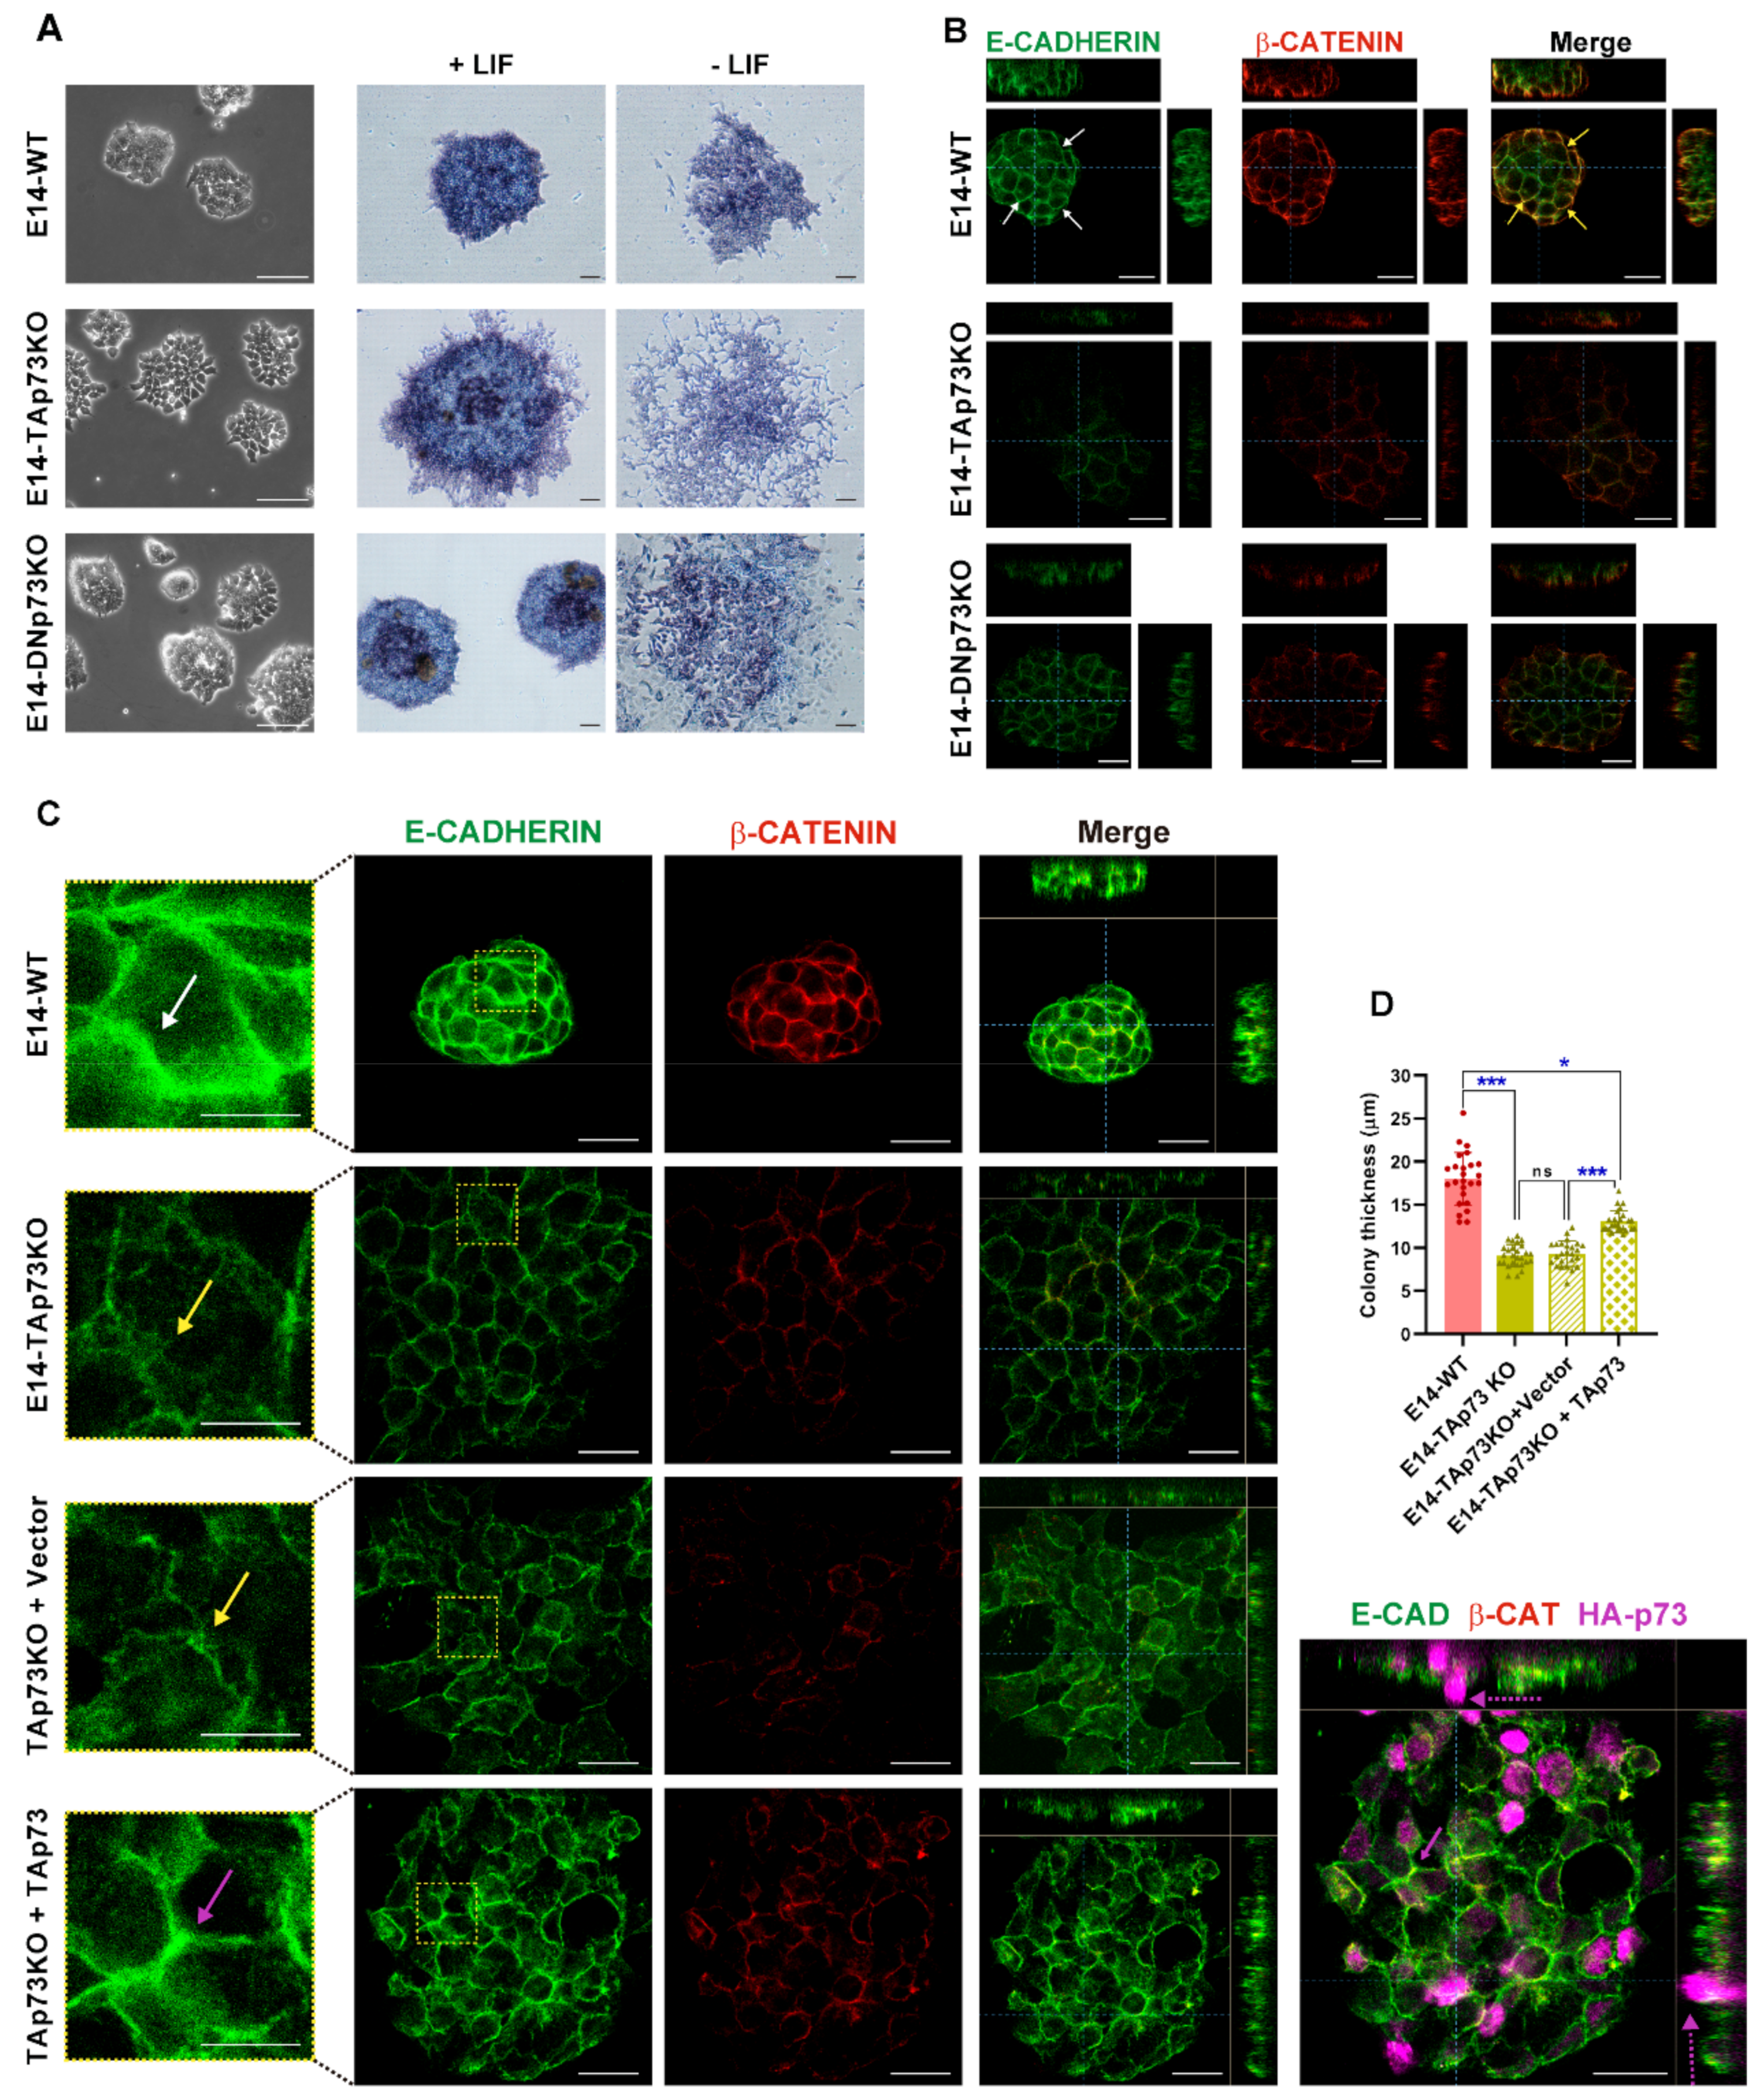
3.3. TAp73 Is a Regulator Hub of Cell Adhesion Transcriptional Networks
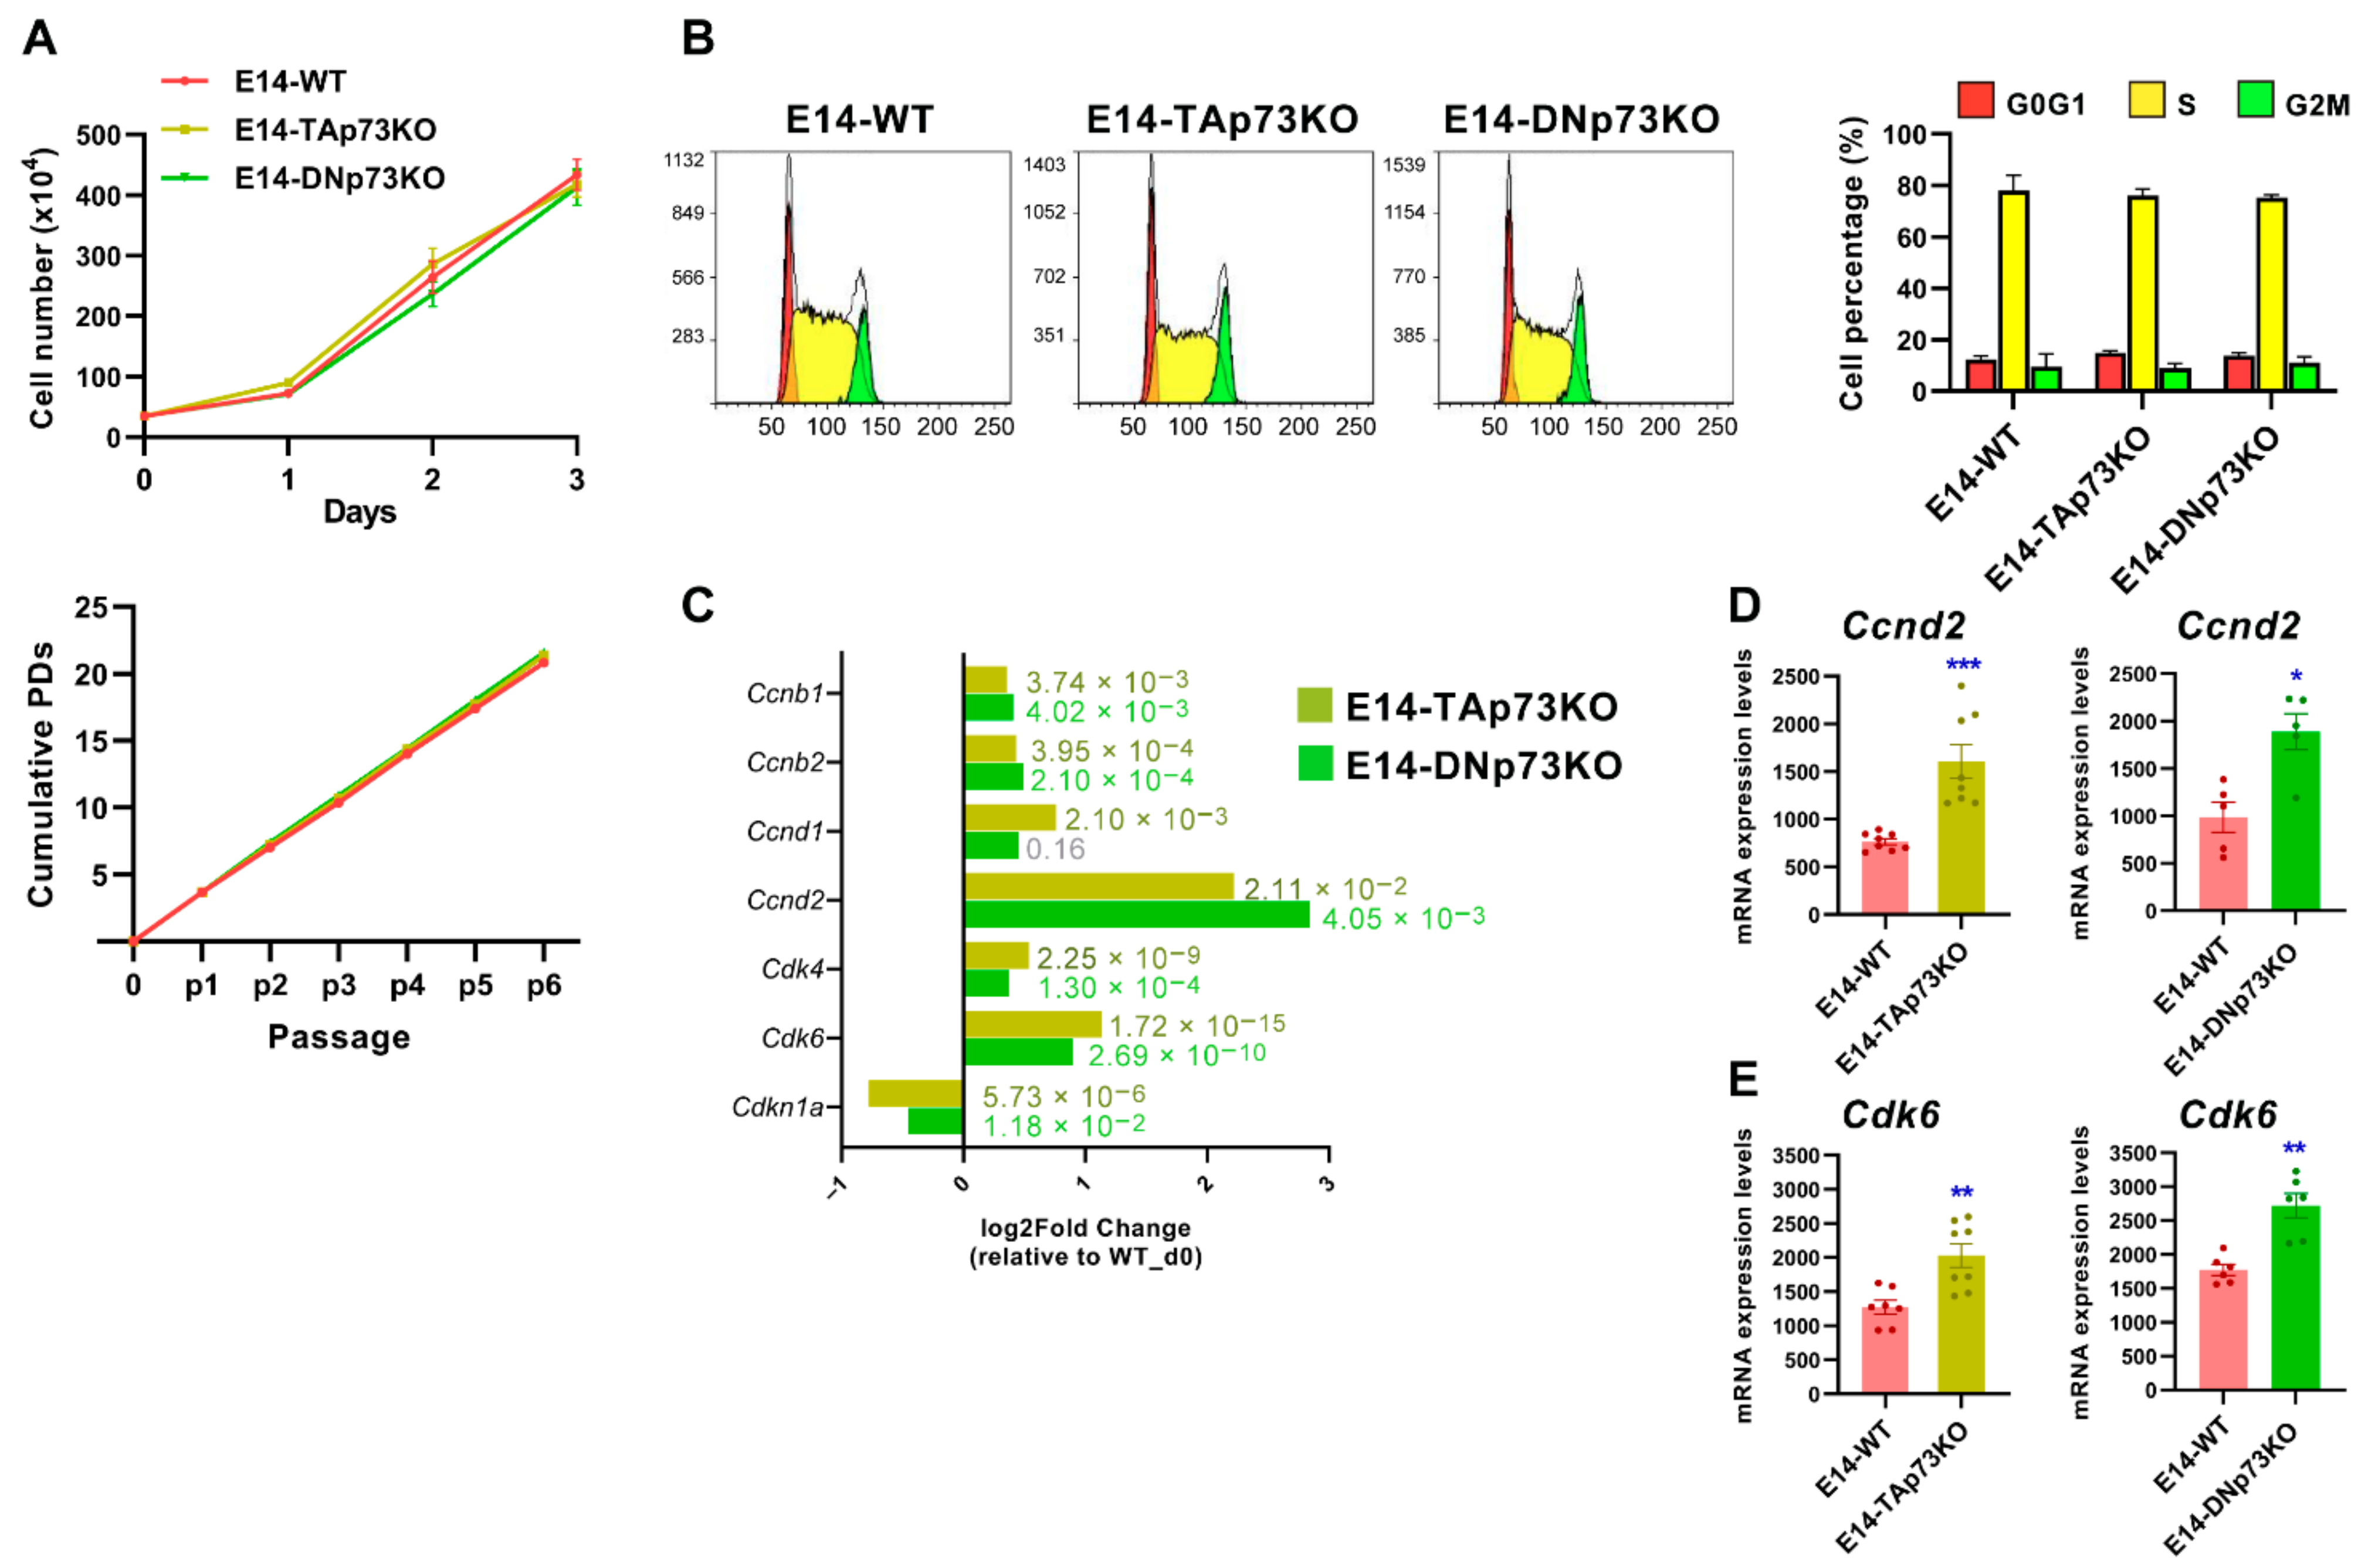
3.4. p73-Isoforms Are Expendable for mESC Self-Renewal But Are Important in the Control of G1 Phase, a Permissive Phase for the Initiation of Cell Fate Decision in mESC
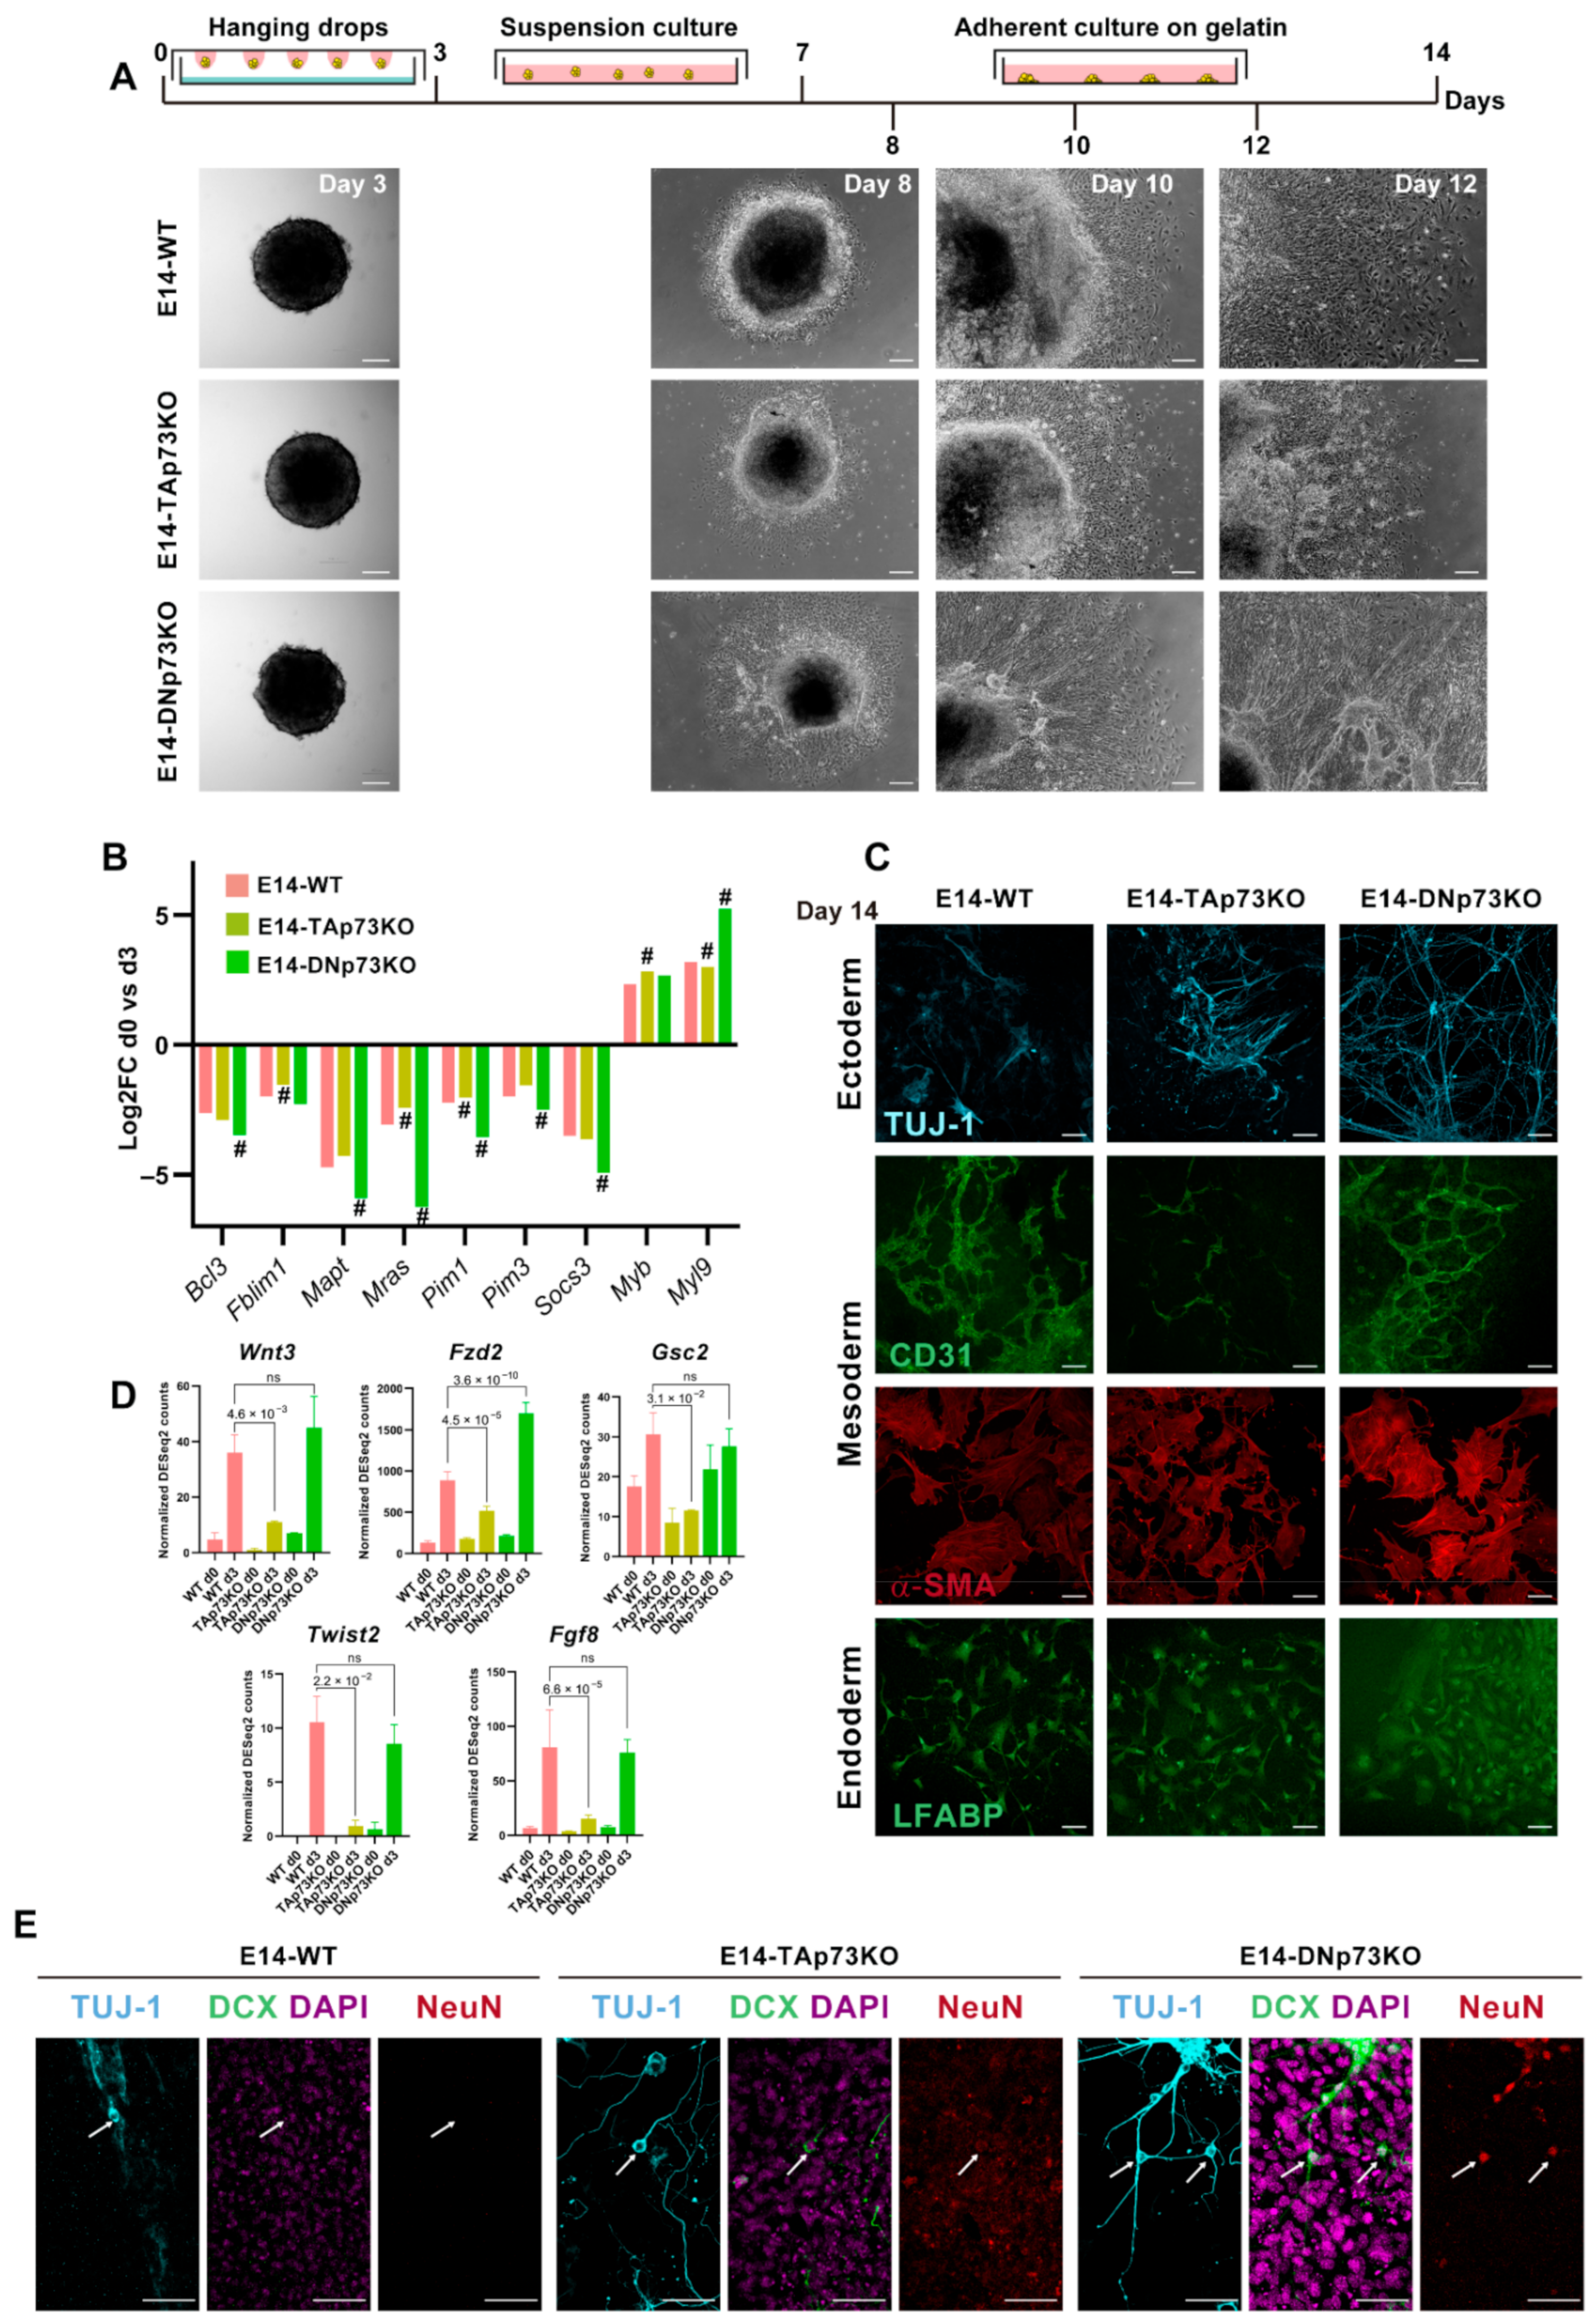
3.5. Inactivation of p73 Isoforms Is Compatible with mESC Pluripotency, but It Predisposes Naïve Pluripotent mESC to Transition into Primed Cells, and Compromises Adequate Lineage Differentiation in an Isoform-Specific Manner
4. Conclusions
Supplementary Materials
Author Contributions
Funding
Institutional Review Board Statement
Informed Consent Statement
Data Availability Statement
Acknowledgments
Conflicts of Interest
References
- Van Nostrand, J.L.; Bowen, M.E.; Vogel, H.; Barna, M.; Attardi, L.D. The p53 family members have distinct roles during mammalian embryonic development. Cell Death Differ. 2017, 24, 575–579. [Google Scholar] [CrossRef] [PubMed] [Green Version]
- Wang, Q.; Zou, Y.; Nowotschin, S.; Kim, S.Y.; Li, Q.V.; Soh, C.-L.; Su, J.; Zhang, C.; Shu, W.; Xi, Q.; et al. The p53 Family Coordinates Wnt and Nodal Inputs in Mesendodermal Differentiation of Embryonic Stem Cells. Cell Stem Cell 2017, 20, 70–86. [Google Scholar] [CrossRef] [Green Version]
- Amelio, I.; Inoue, S.; Markert, E.K.; Levine, A.J.; Knight, R.A.; Mak, T.W.; Melino, G. TAp73 opposes tumor angiogenesis by promoting hypoxia-inducible factor 1α degradation. Proc. Natl. Acad. Sci. USA 2015, 112, 226–231. [Google Scholar] [CrossRef] [Green Version]
- Dulloo, I.; Phang, B.H.; Othman, R.; Tan, S.Y.; Vijayaraghavan, A.; Goh, L.K.; Martin-Lopez, M.; Marques, M.M.; Li, C.W.; Wang, D.Y.; et al. Hypoxia-inducible TAp73 supports tumorigenesis by regulating the angiogenic transcriptome. Nat. Cell Biol. 2015, 17, 511. [Google Scholar] [CrossRef] [PubMed]
- Fernandez-Alonso, R.; Martin-Lopez, M.; Gonzalez-Cano, L.; Garcia, S.; Castrillo, F.; Diez-Prieto, I.; Fernandez-Corona, A.; Lorenzo-Marcos, M.E.; Li, X.; Claesson-Welsh, L.; et al. p73 is required for endothelial cell differentiation, migration and the formation of vascular networks regulating VEGF and TGFbeta signaling. Cell Death Differ. 2015, 22, 1287–1299. [Google Scholar] [CrossRef] [PubMed] [Green Version]
- Stantic, M.; Sakil, H.A.M.; Zirath, H.; Fang, T.; Sanz, G.; Fernandez-Woodbridge, A.; Marin, A.; Susanto, E.; Mak, T.W.; Arsenian Henriksson, M.; et al. TAp73 suppresses tumor angiogenesis through repression of proangiogenic cytokines and HIF-1α activity. Proc. Natl. Acad. Sci. USA 2015, 112, 220–225. [Google Scholar] [CrossRef] [Green Version]
- Agostini, M.; Tucci, P.; Chen, H.; Knight, R.A.; Bano, D.; Nicotera, P.; McKeon, F.; Melino, G. p73 regulates maintenance of neural stem cell. Biochem. Biophys. Res. Commun. 2010, 403, 13–17. [Google Scholar] [CrossRef] [PubMed]
- Fujitani, M.; Cancino, G.I.; Dugani, C.B.; Weaver, I.C.; Gauthier-Fisher, A.; Paquin, A.; Mak, T.W.; Wojtowicz, M.J.; Miller, F.D.; Kaplan, D.R. TAp73 acts via the bHLH Hey2 to promote long-term maintenance of neural precursors. Curr. Biol. 2010, 20, 2058–2065. [Google Scholar] [CrossRef] [Green Version]
- Gonzalez-Cano, L.; Herreros-Villanueva, M.; Fernandez-Alonso, R.; Ayuso-Sacido, A.; Meyer, G.; Garcia-Verdugo, J.M.; Silva, A.; Marques, M.M.; Marin, M.C. p73 deficiency results in impaired self renewal and premature neuronal differentiation of mouse neural progenitors independently of p53. Cell Death Dis. 2010, 1, e109. [Google Scholar] [CrossRef] [Green Version]
- Talos, F.; Abraham, A.; Vaseva, A.V.; Holembowski, L.; Tsirka, S.E.; Scheel, A.; Bode, D.; Dobbelstein, M.; Bruck, W.; Moll, U.M. p73 is an essential regulator of neural stem cell maintenance in embryonal and adult CNS neurogenesis. Cell Death Differ. 2010, 17, 1816–1829. [Google Scholar] [CrossRef] [Green Version]
- Gonzalez-Cano, L.; Fuertes-Alvarez, S.; Robledinos-Anton, N.; Bizy, A.; Villena-Cortes, A.; Farinas, I.; Marques, M.M.; Marin, M.C. p73 is required for ependymal cell maturation and neurogenic SVZ cytoarchitecture. Dev. Neurobiol. 2016, 76, 730–747. [Google Scholar] [CrossRef] [Green Version]
- Rufini, A.; Niklison-Chirou, M.V.; Inoue, S.; Tomasini, R.; Harris, I.S.; Marino, A.; Federici, M.; Dinsdale, D.; Knight, R.A.; Melino, G.; et al. TAp73 depletion accelerates aging through metabolic dysregulation. Genes Dev. 2012, 26, 2009–2014. [Google Scholar] [CrossRef] [Green Version]
- Agostini, M.; Annicchiarico-Petruzzelli, M.; Melino, G.; Rufini, A. Metabolic pathways regulated by TAp73 in response to oxidative stress. Oncotarget 2016, 7, 29881–29900. [Google Scholar] [CrossRef] [PubMed] [Green Version]
- Napoli, M.; Flores, E.R. The p53 family orchestrates the regulation of metabolism: Physiological regulation and implications for cancer therapy. Br. J. Cancer 2017, 116, 149–155. [Google Scholar] [CrossRef] [Green Version]
- Martin-Lopez, M.; Maeso-Alonso, L.; Fuertes-Alvarez, S.; Balboa, D.; Rodriguez-Cortez, V.; Weltner, J.; Diez-Prieto, I.; Davis, A.; Wu, Y.; Otonkoski, T.; et al. p73 is required for appropriate BMP-induced mesenchymal-to-epithelial transition during somatic cell reprogramming. Cell Death Dis. 2017, 8, e3034. [Google Scholar] [CrossRef] [PubMed] [Green Version]
- Marshall, C.B.; Mays, D.J.; Beeler, J.S.; Rosenbluth, J.M.; Boyd, K.L.; Santos Guasch, G.L.; Shaver, T.M.; Tang, L.J.; Liu, Q.; Shyr, Y.; et al. p73 Is Required for multiciliogenesis and regulates the Foxj1-associated gene network. Cell Rep. 2016, 14, 2289–2300. [Google Scholar] [CrossRef] [PubMed] [Green Version]
- Nemajerova, A.; Kramer, D.; Siller, S.S.; Herr, C.; Shomroni, O.; Pena, T.; Gallinas Suazo, C.; Glaser, K.; Wildung, M.; Steffen, H.; et al. TAp73 is a central transcriptional regulator of airway multiciliogenesis. Genes Dev. 2016, 30, 1300–1312. [Google Scholar] [CrossRef]
- Fuertes-Alvarez, S.; Maeso-Alonso, L.; Villoch-Fernandez, J.; Wildung, M.; Martin-Lopez, M.; Marshall, C.; Villena-Cortes, A.J.; Diez-Prieto, I.; Pietenpol, J.A.; Tissir, F.; et al. p73 regulates ependymal planar cell polarity by modulating actin and microtubule cytoskeleton. Cell Death Dis. 2018, 9, 1183. [Google Scholar] [CrossRef] [Green Version]
- Bourdon, J.C. p53 and its isoforms in cancer. Br. J. Cancer 2007, 97, 277–282. [Google Scholar] [CrossRef] [PubMed]
- Engelmann, D.; Meier, C.; Alla, V.; Pützer, B.M. A balancing act: Orchestrating amino-truncated and full-length p73 variants as decisive factors in cancer progression. Oncogene 2015, 34, 4287–4299. [Google Scholar] [CrossRef] [PubMed] [Green Version]
- Wang, C.; Teo, C.R.; Sabapathy, K. p53-related transcription targets of TAp73 in cancer cells-bona fide or distorted reality? Int. J. Mol. Sci. 2020, 21, 1346. [Google Scholar] [CrossRef] [Green Version]
- Di, C.; Yang, L.; Zhang, H.; Ma, X.; Zhang, X.; Sun, C.; Li, H.; Xu, S.; An, L.; Li, X.; et al. Mechanisms, function and clinical applications of DNp73. Cell Cycle 2013, 12, 1861–1867. [Google Scholar] [CrossRef] [Green Version]
- Marqués-García, F.; Ferrandiz, N.; Fernández-Alonso, R.; González-Cano, L.; Herreros-Villanueva, M.; Rosa-Garrido, M.; Fernández-García, B.; Vaque, J.P.; Marqués, M.M.; Alonso, M.E.; et al. p73 plays a role in erythroid differentiation through GATA1 induction. J. Biol. Chem. 2009, 284, 21139–21156. [Google Scholar] [CrossRef] [PubMed] [Green Version]
- Niemantsverdriet, M.; Nagle, P.; Chiu, R.K.; Langendijk, J.A.; Kampinga, H.H.; Coppes, R.P. ΔNp73 enhances promoter activity of TGF-β induced genes. PLoS ONE 2012, 7, e50815. [Google Scholar] [CrossRef] [PubMed] [Green Version]
- Strano, S.; Rossi, M.; Fontemaggi, G.; Munarriz, E.; Soddu, S.; Sacchi, A.; Blandino, G. From p63 to p53 across p73. FEBS Lett. 2001, 490, 163–170. [Google Scholar] [CrossRef] [Green Version]
- Murray-Zmijewski, F.; Lane, D.P.; Bourdon, J.C. p53/p63/p73 isoforms: An orchestra of isoforms to harmonise cell differentiation and response to stress. Cell Death Differ. 2006, 13, 962–972. [Google Scholar] [CrossRef]
- Yang, A.; Walker, N.; Bronson, R.; Kaghad, M.; Oosterwegel, M.; Bonnin, J.; Vagner, C.; Bonnet, H.; Dikkes, P.; Sharpe, A.; et al. p73-deficient mice have neurological, pheromonal and inflammatory defects but lack spontaneous tumours. Nature 2000, 404, 99–103. [Google Scholar] [CrossRef]
- Tomasini, R.; Tsuchihara, K.; Wilhelm, M.; Fujitani, M.; Rufini, A.; Cheung, C.C.; Khan, F.; Itie-Youten, A.; Wakeham, A.; Tsao, M.S.; et al. TAp73 knockout shows genomic instability with infertility and tumor suppressor functions. Genes Dev. 2008, 22, 2677–2691. [Google Scholar] [CrossRef] [Green Version]
- Tissir, F.; Ravni, A.; Achouri, Y.; Riethmacher, D.; Meyer, G.; Goffinet, A.M. DeltaNp73 regulates neuronal survival in vivo. Proc. Natl. Acad. Sci. USA 2009, 106, 16871–16876. [Google Scholar] [CrossRef] [Green Version]
- Wilhelm, M.T.; Rufini, A.; Wetzel, M.K.; Tsuchihara, K.; Inoue, S.; Tomasini, R.; Itie-Youten, A.; Wakeham, A.; Arsenian-Henriksson, M.; Melino, G.; et al. Isoform-specific p73 knockout mice reveal a novel role for ΔNp73 in the DNA damage response pathway. Genes Dev. 2010, 24, 549–560. [Google Scholar] [CrossRef] [Green Version]
- Amelio, I.; Panatta, E.; Niklison-Chirou, M.V.; Steinert, J.R.; Agostini, M.; Morone, N.; Knight, R.A.; Melino, G. The C terminus of p73 is essential for hippocampal development. Proc. Natl. Acad. Sci. USA 2020, 117, 15694. [Google Scholar] [CrossRef]
- Rufini, A.; Agostini, M.; Grespi, F.; Tomasini, R.; Sayan, B.S.; Niklison-Chirou, M.V.; Conforti, F.; Velletri, T.; Mastino, A.; Mak, T.W.; et al. p73 in Cancer. Genes Cancer 2011, 2, 491–502. [Google Scholar] [CrossRef]
- Nemajerova, A.; Moll, U.M. Tissue-specific roles of p73 in development and homeostasis. J. Cell Sci. 2019, 132, jcs233338. [Google Scholar] [CrossRef] [PubMed] [Green Version]
- Marques, M.M.; Villoch-Fernandez, J.; Maeso-Alonso, L.; Fuertes-Alvarez, S.; Marin, M.C. The Trp73 Mutant Mice: A ciliopathy model that uncouples ciliogenesis from planar cell polarity. Front. Genet. 2019, 10, 154. [Google Scholar] [CrossRef] [PubMed] [Green Version]
- Liu, C.; Oikonomopoulos, A.; Sayed, N.; Wu, J.C. Modeling human diseases with induced pluripotent stem cells: From 2D to 3D and beyond. Development 2018, 145, dev156166. [Google Scholar] [CrossRef] [PubMed] [Green Version]
- Hong, Y.J.; Do, J.T. Neural lineage differentiation from pluripotent stem cells to mimic human brain tissues. Front. Bioeng. Biotechnol. 2019, 7, 400. [Google Scholar] [CrossRef] [Green Version]
- Hooper, M.; Hardy, K.; Handyside, A.; Hunter, S.; Monk, M. HPRT-deficient (Lesch–Nyhan) mouse embryos derived from germline colonization by cultured cells. Nature 1987, 326, 292–295. [Google Scholar] [CrossRef]
- Atlasi, Y.; Jafarnejad, S.M.; Gkogkas, C.G.; Vermeulen, M.; Sonenberg, N.; Stunnenberg, H.G. The translational landscape of ground state pluripotency. Nat. Commun. 2020, 11, 1617. [Google Scholar] [CrossRef]
- Ingolia, N.T.; Lareau, L.F.; Weissman, J.S. Ribosome profiling of mouse embryonic stem cells reveals the complexity and dynamics of mammalian proteomes. Cell 2011, 147, 789–802. [Google Scholar] [CrossRef] [Green Version]
- Lu, R.; Markowetz, F.; Unwin, R.D.; Leek, J.T.; Airoldi, E.M.; MacArthur, B.D.; Lachmann, A.; Rozov, R.; Ma’ayan, A.; Boyer, L.A.; et al. Systems-level dynamic analyses of fate change in murine embryonic stem cells. Nature 2009, 462, 358–362. [Google Scholar] [CrossRef] [Green Version]
- Oliveros, J.C.; Franch, M.; Tabas-Madrid, D.; San-León, D.; Montoliu, L.; Cubas, P.; Pazos, F. Breaking-Cas-interactive design of guide RNAs for CRISPR-Cas experiments for ENSEMBL genomes. Nucleic Acids Res. 2016, 44, W267–W271. [Google Scholar] [CrossRef] [PubMed] [Green Version]
- Irwin, M.S.; Kondo, K.; Marin, M.C.; Cheng, L.S.; Hahn, W.C.; Kaelin, W.G. Chemosensitivity linked to p73 function. Cancer Cell 2003, 3, 403–410. [Google Scholar] [CrossRef] [Green Version]
- Huang, D.W.; Sherman, B.T.; Lempicki, R.A. Systematic and integrative analysis of large gene lists using DAVID bioinformatics resources. Nat. Protoc. 2009, 4, 44–57. [Google Scholar] [CrossRef]
- Madeira, F.; Park, Y.M.; Lee, J.; Buso, N.; Gur, T.; Madhusoodanan, N.; Basutkar, P.; Tivey, A.R.N.; Potter, S.C.; Finn, R.D.; et al. The EMBL-EBI search and sequence analysis tools APIs in 2019. Nucleic Acids Res. 2019, 47, W636–W641. [Google Scholar] [CrossRef] [Green Version]
- Grob, T.J.; Novak, U.; Maisse, C.; Barcaroli, D.; Lüthi, A.U.; Pirnia, F.; Hügli, B.; Graber, H.U.; de Laurenzi, V.; Fey, M.F.; et al. Human ΔNp73 regulates a dominant negative feedback loop for TAp73 and p53. Cell Death Differ. 2001, 8, 1213. [Google Scholar] [CrossRef] [Green Version]
- Yu, J.; Baron, V.; Mercola, D.; Mustelin, T.; Adamson, E.D. A network of p73, p53 and Egr1 is required for efficient apoptosis in tumor cells. Cell Death Differ. 2007, 14, 436–446. [Google Scholar] [CrossRef] [PubMed]
- Dulloo, I.; Gopalan, G.; Melino, G.; Sabapathy, K. The antiapoptotic DeltaNp73 is degraded in a c-Jun-dependent manner upon genotoxic stress through the antizyme-mediated pathway. Proc. Natl. Acad. Sci. USA 2010, 107, 4902–4907. [Google Scholar] [CrossRef] [Green Version]
- Testoni, B.; Schinzari, V.; Guerrieri, F.; Gerbal-Chaloin, S.; Blandino, G.; Levrero, M. p53-paralog DNp73 oncogene is repressed by IFNα/STAT2 through the recruitment of the Ezh2 polycomb group transcriptional repressor. Oncogene 2011, 30, 2670–2678. [Google Scholar] [CrossRef] [PubMed] [Green Version]
- He, H.; Wang, C.; Dai, Q.; Li, F.; Bergholz, J.; Li, Z.; Li, Q.; Xiao, Z.-X. p53 and p73 Regulate Apoptosis but Not Cell-Cycle Progression in Mouse Embryonic Stem Cells upon DNA Damage and Differentiation. Stem Cell Rep. 2016, 7, 1087–1098. [Google Scholar] [CrossRef] [Green Version]
- Cancino, G.I.; Fatt, M.P.; Miller, F.D.; Kaplan, D.R. Conditional ablation of p63 indicates that it is essential for embryonic development of the central nervous system. Cell Cycle 2015, 14, 3270–3281. [Google Scholar] [CrossRef] [PubMed]
- Lutzker, S.G.; Levine, A.J. A functionally inactive p53 protein interatocarcinoma cells is activated by either DNA damage or cellular differentiation. Nat. Med. 1996, 2, 804–810. [Google Scholar] [CrossRef]
- Schmid, P.; Lorenz, A.; Hameister, H.; Montenarh, M. Expression of p53 during mouse embryogenesis. Development 1991, 113, 857. [Google Scholar] [CrossRef]
- Medawar, A.; Virolle, T.; Rostagno, P.; de la Forest-Divonne, S.; Gambaro, K.; Rouleau, M.; Aberdam, D. DeltaNp63 is essential for epidermal commitment of embryonic stem cells. PLoS ONE 2008, 3, e3441. [Google Scholar] [CrossRef]
- Baillie-Benson, P.; Moris, N.; Martinez Arias, A. Pluripotent stem cell models of early mammalian development. Curr. Opin. Cell Biol. 2020, 66, 89–96. [Google Scholar] [CrossRef]
- Gloss, B.S.; Signal, B.; Cheetham, S.W.; Gruhl, F.; Kaczorowski, D.C.; Perkins, A.C.; Dinger, M.E. High resolution temporal transcriptomics of mouse embryoid body development reveals complex expression dynamics of coding and noncoding loci. Sci. Rep. 2017, 7, 6731. [Google Scholar] [CrossRef] [PubMed] [Green Version]
- Park, D.M.; Jung, J.; Masjkur, J.; Makrogkikas, S.; Ebermann, D.; Saha, S.; Rogliano, R.; Paolillo, N.; Pacioni, S.; McKay, R.D.; et al. Hes3 regulates cell number in cultures from glioblastoma multiforme with stem cell characteristics. Sci. Rep. 2013, 3, 1095. [Google Scholar] [CrossRef] [PubMed]
- Zhu, B.; Rippe, C.; Holmberg, J.; Zeng, S.; Perisic, L.; Albinsson, S.; Hedin, U.; Uvelius, B.; Swärd, K. Nexilin/NEXN controls actin polymerization in smooth muscle and is regulated by myocardin family coactivators and YAP. Sci. Rep. 2018, 8, 13025. [Google Scholar] [CrossRef] [PubMed]
- Gasparyan, M.; Lo, M.-C.; Jiang, H.; Lin, C.-C.; Sun, D. Combined p53- and PTEN-deficiency activates expression of mesenchyme homeobox 1 (MEOX1) required for growth of triple-negative breast cancer. J. Biol. Chem. 2020, 295, 12188–12202. [Google Scholar] [CrossRef] [PubMed]
- Yan, W.; Chen, X. GPX2, a Direct Target of p63, inhibits oxidative stress-induced apoptosis in a p53-dependent manner. J. Biol. Chem. 2006, 281, 7856–7862. [Google Scholar] [CrossRef] [Green Version]
- Lennicke, C.; Rahn, J.; Wickenhauser, C.; Lichtenfels, R.; Müller, A.S.; Wessjohann, L.A.; Kipp, A.P.; Seliger, B. Loss of epithelium-specific GPx2 results in aberrant cell fate decisions during intestinal differentiation. Oncotarget 2017, 9, 539–552. [Google Scholar] [CrossRef] [PubMed] [Green Version]
- Fontemaggi, G.; Kela, I.; Amariglio, N.; Rechavi, G.; Krishnamurthy, J.; Strano, S.; Sacchi, A.; Givol, D.; Blandino, G. Identification of direct p73 target genes combining DNA microarray and chromatin immunoprecipitation analyses. J. Biol. Chem. 2002, 277, 43359–43368. [Google Scholar] [CrossRef] [Green Version]
- Santos Guasch, G.L.; Beeler, J.S.; Marshall, C.B.; Shaver, T.M.; Sheng, Q.; Johnson, K.N.; Boyd, K.L.; Venters, B.J.; Cook, R.S.; Pietenpol, J.A. p73 Is required for ovarian follicle development and regulates a gene network involved in cell-to-cell adhesion. iScience 2018, 8, 236–249. [Google Scholar] [CrossRef] [Green Version]
- Xie, N.; Vikhreva, P.; Annicchiarico-Petruzzelli, M.; Amelio, I.; Barlev, N.; Knight, R.A.; Melino, G. Integrin-β4 is a novel transcriptional target of TAp73. Cell Cycle 2018, 17, 589–594. [Google Scholar] [CrossRef] [PubMed] [Green Version]
- Redmer, T.; Diecke, S.; Grigoryan, T.; Quiroga-Negreira, A.; Birchmeier, W.; Besser, D. E-cadherin is crucial for embryonic stem cell pluripotency and can replace OCT4 during somatic cell reprogramming. EMBO Rep. 2011, 12, 720–726. [Google Scholar] [CrossRef] [PubMed] [Green Version]
- Talos, F.; Nemajerova, A.; Flores, E.R.; Petrenko, O.; Moll, U.M. p73 suppresses polyploidy and aneuploidy in the absence of functional p53. Mol. Cell 2007, 27, 647–659. [Google Scholar] [CrossRef] [PubMed]
- Savatier, P.; Lapillonne, H.; Jirmanova, L.; Vitelli, L.; Samarut, J. Analysis of the cell cycle in mouse embryonic stem cells. Methods Mol. Biol. 2002, 185, 27–33. [Google Scholar] [PubMed]
- Ter Huurne, M.; Chappell, J.; Dalton, S.; Stunnenberg, H.G. Distinct cell-cycle control in two different states of mouse pluripotency. Cell Stem Cell 2017, 21, 449–455. [Google Scholar] [CrossRef] [Green Version]
- Ozaki, T.; Kubo, N.; Nakagawara, A. p73-binding partners and their functional significance. Int. J. Proteom. 2010, 2010, 283863. [Google Scholar] [CrossRef]
- Lefkimmiatis, K.; Caratozzolo, M.F.; Merlo, P.; D’Erchia, A.M.; Navarro, B.; Levrero, M.; Sbisa’, E.; Tullo, A. p73 and p63 sustain cellular growth by transcriptional activation of cell cycle progression genes. Cancer Res. 2009, 69, 8563. [Google Scholar] [CrossRef] [PubMed] [Green Version]
- Liu, L.; Michowski, W.; Kolodziejczyk, A.; Sicinski, P. The cell cycle in stem cell proliferation, pluripotency and differentiation. Nat. Cell Biol. 2019, 21, 1060–1067. [Google Scholar] [CrossRef]
- Zang, Y.; Yu, L.-F.; Nan, F.-J.; Feng, L.-Y.; Li, J. AMP-activated protein kinase is involved in neural stem cell growth suppression and cell cycle arrest by 5-aminoimidazole-4-carboxamide-1-β-d-ribofuranoside and glucose deprivation by down-regulating phospho-retinoblastoma protein and cyclin D. J. Biol. Chem. 2009, 284, 6175–6184. [Google Scholar] [CrossRef] [PubMed] [Green Version]
- Dalton, S. Linking the cell cycle to cell fate decisions. Trends Cell Biol. 2015, 25, 592–600. [Google Scholar] [CrossRef] [Green Version]
- Pauklin, S.; Vallier, L. The cell-cycle state of stem cells determines cell fate propensity. Cell 2013, 155, 135–147. [Google Scholar] [CrossRef] [PubMed] [Green Version]
- Yiangou, L.; Grandy, R.A.; Osnato, A.; Ortmann, D.; Sinha, S.; Vallier, L. Cell cycle regulators control mesoderm specification in human pluripotent stem cells. J. Biol. Chem. 2019, 294, 17903–17914. [Google Scholar] [CrossRef] [PubMed] [Green Version]
- Ghimire, S.; van der Jeught, M.; Neupane, J.; Roost, M.S.; Anckaert, J.; Popovic, M.; van Nieuwerburgh, F.; Mestdagh, P.; Vandesompele, J.; Deforce, D.; et al. Comparative analysis of naive, primed and ground state pluripotency in mouse embryonic stem cells originating from the same genetic background. Sci. Rep. 2018, 8, 5884. [Google Scholar] [CrossRef] [Green Version]
- Rosowski, K.A.; Mertz, A.F.; Norcross, S.; Dufresne, E.R.; Horsley, V. Edges of human embryonic stem cell colonies display distinct mechanical properties and differentiation potential. Sci. Rep. 2015, 5, 14218. [Google Scholar] [CrossRef] [PubMed] [Green Version]
- Morgani, S.; Nichols, J.; Hadjantonakis, A.-K. The many faces of Pluripotency: In vitro adaptations of a continuum of in vivo states. BMC Dev. Biol. 2017, 17, 7. [Google Scholar] [CrossRef] [Green Version]
- Liu, X.; Yu, T.; Sun, Y.; Wang, H. Characterization of novel alternative splicing variants of Oct4 gene expressed in mouse pluripotent stem cells. J. Cell. Physiol. 2018, 233, 5468–5477. [Google Scholar] [CrossRef]
- Trubiani, O.; Zalzal, S.F.; Paganelli, R.; Marchisio, M.; Giancola, R.; Pizzicannella, J.; Bühring, H.-J.; Piattelli, M.; Caputi, S.; Nanci, A. Expression profile of the embryonic markers nanog, OCT-4, SSEA-1, SSEA-4, and frizzled-9 receptor in human periodontal ligament mesenchymal stem cells. J. Cell. Physiol. 2010, 225, 123–131. [Google Scholar] [CrossRef]
- Parisi, S.; Cozzuto, L.; Tarantino, C.; Passaro, F.; Ciriello, S.; Aloia, L.; Antonini, D.; de Simone, V.; Pastore, L.; Russo, T. Direct targets of Klf5 transcription factor contribute to the maintenance of mouse embryonic stem cell undifferentiated state. BMC Biol. 2010, 8, 128. [Google Scholar] [CrossRef] [Green Version]
- Azami, T.; Matsumoto, K.; Jeon, H.; Waku, T.; Muratani, M.; Niwa, H.; Takahashi, S.; Ema, M. Klf5 suppresses ERK signaling in mouse pluripotent stem cells. PLoS ONE 2018, 13, e0207321. [Google Scholar] [CrossRef]
- Long, X.; Singla, D.K. Inactivation of Klf5 by zinc finger nuclease downregulates expression of pluripotent genes and attenuates colony formation in embryonic stem cells. Mol. Cell. Biochem. 2013, 382, 113–119. [Google Scholar] [CrossRef]
- Ema, M.; Mori, D.; Niwa, H.; Hasegawa, Y.; Yamanaka, Y.; Hitoshi, S.; Mimura, J.; Kawabe, Y.-I.; Hosoya, T.; Morita, M.; et al. Krüppel-like factor 5 is essential for blastocyst development and the normal self-renewal of mouse ESCs. Cell Stem Cell 2008, 3, 555–567. [Google Scholar] [CrossRef] [PubMed] [Green Version]
- Kalkan, T.; Olova, N.; Roode, M.; Mulas, C.; Lee, H.J.; Nett, I.; Marks, H.; Walker, R.; Stunnenberg, H.G.; Lilley, K.S.; et al. Tracking the embryonic stem cell transition from ground state pluripotency. Development 2017, 144, 1221. [Google Scholar] [CrossRef] [Green Version]
- Yang, S.-H.; Andrabi, M.; Biss, R.; Murtuza Baker, S.; Iqbal, M.; Sharrocks, A.D. ZIC3 controls the transition from naive to primed pluripotency. Cell Rep. 2019, 27, 3215–3227. [Google Scholar] [CrossRef] [Green Version]
- Kim, B.-J.; Lee, Y.-A.; Kim, K.-J.; Kim, Y.-H.; Jung, M.-S.; Ha, S.-J.; Kang, H.-G.; Jung, S.-E.; Kim, B.-G.; Choi, Y.-R.; et al. Effects of paracrine factors on CD24 expression and neural differentiation of male germline stem cells. Int. J. Mol. Med. 2015, 36, 255–262. [Google Scholar] [CrossRef] [PubMed]
- Acampora, D.; di Giovannantonio, L.G.; Simeone, A. Otx2 is an intrinsic determinant of the embryonic stem cell state and is required for transition to a stable epiblast stem cell condition. Development 2013, 140, 43. [Google Scholar] [CrossRef] [Green Version]
- Liyang, G.; Abdullah, S.; Rosli, R.; Nordin, N. Neural commitment of embryonic stem cells through the formation of embryoid bodies (EBs). Malays. J. Med. Sci. 2014, 21, 8–16. [Google Scholar]
- Hailesellasse Sene, K.; Porter, C.J.; Palidwor, G.; Perez-Iratxeta, C.; Muro, E.M.; Campbell, P.A.; Rudnicki, M.A.; Andrade-Navarro, M.A. Gene function in early mouse embryonic stem cell differentiation. BMC Genom. 2007, 8, 85. [Google Scholar] [CrossRef] [Green Version]
- Keller, G. Embryonic stem cell differentiation: Emergence of a new era in biology and medicine. Genes Dev. 2005, 19, 1129–1155. [Google Scholar] [CrossRef] [PubMed] [Green Version]
- Weinstein, D.C.; Hemmati-Brivanlou, A. Neural induction. Annu. Rev. Cell Dev. Biol. 1999, 15, 411–433. [Google Scholar] [CrossRef] [PubMed]
- Watanabe, K.; Kamiya, D.; Nishiyama, A.; Katayama, T.; Nozaki, S.; Kawasaki, H.; Watanabe, Y.; Mizuseki, K.; Sasai, Y. Directed differentiation of telencephalic precursors from embryonic stem cells. Nat. Neurosci. 2005, 8, 288–296. [Google Scholar] [CrossRef] [PubMed] [Green Version]
- Niklison-Chirou, M.V.; Killick, R.; Knight, R.A.; Nicotera, P.; Melino, G.; Agostini, M. How does p73 cause neuronal defects? Mol. Neurobiol. 2016, 53, 4509–4520. [Google Scholar] [CrossRef] [PubMed]


Publisher’s Note: MDPI stays neutral with regard to jurisdictional claims in published maps and institutional affiliations. |
© 2021 by the authors. Licensee MDPI, Basel, Switzerland. This article is an open access article distributed under the terms and conditions of the Creative Commons Attribution (CC BY) license (https://creativecommons.org/licenses/by/4.0/).
Share and Cite
López-Ferreras, L.; Martínez-García, N.; Maeso-Alonso, L.; Martín-López, M.; Díez-Matilla, Á.; Villoch-Fernandez, J.; Alonso-Olivares, H.; Marques, M.M.; Marin, M.C. Deciphering the Nature of Trp73 Isoforms in Mouse Embryonic Stem Cell Models: Generation of Isoform-Specific Deficient Cell Lines Using the CRISPR/Cas9 Gene Editing System. Cancers 2021, 13, 3182. https://doi.org/10.3390/cancers13133182
López-Ferreras L, Martínez-García N, Maeso-Alonso L, Martín-López M, Díez-Matilla Á, Villoch-Fernandez J, Alonso-Olivares H, Marques MM, Marin MC. Deciphering the Nature of Trp73 Isoforms in Mouse Embryonic Stem Cell Models: Generation of Isoform-Specific Deficient Cell Lines Using the CRISPR/Cas9 Gene Editing System. Cancers. 2021; 13(13):3182. https://doi.org/10.3390/cancers13133182
Chicago/Turabian StyleLópez-Ferreras, Lorena, Nicole Martínez-García, Laura Maeso-Alonso, Marta Martín-López, Ángela Díez-Matilla, Javier Villoch-Fernandez, Hugo Alonso-Olivares, Margarita M. Marques, and Maria C. Marin. 2021. "Deciphering the Nature of Trp73 Isoforms in Mouse Embryonic Stem Cell Models: Generation of Isoform-Specific Deficient Cell Lines Using the CRISPR/Cas9 Gene Editing System" Cancers 13, no. 13: 3182. https://doi.org/10.3390/cancers13133182