Simple Summary
PRC2 (Polycomb repressive complex 2) is a catalytic multi-subunit complex involved in transcriptional repression through the methylation of lysine 27 at histone 3 (H3K27me1/2/3). Dysregulation of PRC2 has been linked to tumor development and progression. Here, we performed a comprehensive analysis of data in the genomic and transcriptomic (cBioPortal, KMplot) database portals of clinical tumor samples and evaluated clinical correlations of EZH2, SUZ12, and EED. Next, we developed an original Python application enabling the identification of genes cooperating with PRC2 in oncogenic processes for the analysis of the DepMap CRISPR knockout database. Our study identified cancer types that are most likely to be responsive to PRC2 inhibitors. By analyzing co-dependencies with other genes, this analysis also provides indications of prognostic biomarkers and new therapeutic regimens.
Abstract
PRC2 (Polycomb repressive complex 2) is an evolutionarily conserved protein complex required to maintain transcriptional repression. The core PRC2 complex includes EZH2, SUZ12, and EED proteins and methylates histone H3K27. PRC2 is known to contribute to carcinogenesis and several small molecule inhibitors targeting PRC2 have been developed. The present study aimed to identify the cancer types in which PRC2 targeting drugs could be beneficial. We queried genomic and transcriptomic (cBioPortal, KMplot) database portals of clinical tumor samples to evaluate clinical correlations of PRC2 subunit genes. EZH2, SUZ12, and EED gene amplification was most frequently found in prostate cancer, whereas lymphoid malignancies (DLBCL) frequently showed EZH2 mutations. In both cases, PRC2 alterations were associated with poor prognosis. Moreover, higher expression of PRC2 subunits was correlated with poor survival in renal and liver cancers as well as gliomas. Finally, we generated a Python application to analyze the correlation of EZH2/SUZ12/EED gene knockouts by CRISPR with the alterations detected in the cancer cell lines using DepMap data. As a result, we were able to identify mutations that correlated significantly with tumor cell sensitivity to PRC2 knockout, including SWI/SNF, COMPASS/COMPASS-like subunits and BCL2, warranting the investigation of these genes as potential markers of sensitivity to PRC2-targeting drugs.
Keywords:
PRC2; EZH2; cancer; oncology; PRC2 inhibitors; EZH2 inhibitors; biomarkers; SWI/SNF; SMARCB1; BCL2; Polycomb 1. Introduction
The maintenance of tissue-specific gene expression profiles is required for a normal development and physiology of multicellular organisms. In particular, epigenetic control of transcriptional repression is implemented by the Polycomb group (PcG) proteins that function as a part of multiprotein complexes recruited to the chromatin [1,2,3,4,5]. The Polycomb repressive complex 2 (PRC2) in mammals consists of three core subunits: EZH2 (Enhancer of Zeste Homolog 2), SUZ12 (Suppressor of Zeste 12), and EED (Embryonic Ectoderm Development) proteins [6,7,8]. The enzymatic component of the complex is EZH2, a histone methyltransferase (HMT) that catalyzes an addition of up to three methyl groups to the histone H3 lysine 27 (H3K27me1/2/3) via its SET domain [9,10,11,12]. The HMTase activity of EZH2 requires the presence of the SUZ12 and EED subunits [13,14,15].
The PRC2 complex is vital for mammalian development. Mouse embryos with deletions in the EZH2, EED or SUZ12 genes fail to develop and die during the post-implantation period [15,16,17], while EZH2−/− human ESCs (hESCs) demonstrate self-renewal and differentiation defects [18].
Numerous studies have shown that PRC2 is broadly implicated in cancer biology, and alterations of its subunits can be associated with poor survival [2,4,19,20,21,22,23]. These alterations include both the overexpression of PRC2 genes and mutations that either enhance or inhibit PRC2 catalytic activity. EZH2 overexpression is frequently accompanied by amplification of the EZH2 gene; less is known about SUZ12 and EED. The suppression of PRC2 activity has been shown to inhibit the growth of certain tumors. Several small molecule inhibitors targeting PRC2 have been developed; some are undergoing clinical trials [24,25]. The first-in-class compound tazemetostat targeting the EZH2 protein was recently approved in the USA for the treatment of patients with metastatic or locally advanced epithelioid sarcoma [26,27,28] and for adult patients with relapsed or refractory (R/R) follicular lymphoma (FL) [29]. In epithelioid sarcoma, the sensitivity to tazemetostat is associated with a loss of SMARCB1, a component of the SWI/SNF remodeling complex of Trithorax group (TrxG) proteins that antagonize PcG repression [27].
Despite the progress made in recent years, many aspects of the role of PRC2 in cancer remain unaddressed. Are SUZ12 and EED implicated in various tumor types? What are the clinical implications of different PRC2 subunits? What other mutations, besides for the SWI/SNF members, could confer tumor sensitivity to inhibitors of PRC2 subunits and could be used as clinically relevant markers?
In the present study we analyzed publicly available genomic and transcriptomic database portals to identify cancers in which the PRC2 subunits are likely to play essential roles.
2. Materials and Methods
The cBioPortal for cancer genomics (https://www.cbioportal.org/, accessed on 2 November 2020) [30] was used to query alterations in EZH2/SUZ12/EED genes in clinical samples. DNA analysis was carried out using a set of 185 studies (TCGA- and non-TCGA) that were manually curated with no overlapping samples (total 48,045 samples). In the analysis of the frequency of a specific alteration, only samples tested with available information (e.g., the copy number or missense/gain-of-function (GOF) mutations) were taken into account.
For multiple myeloma survival analysis, we used RNAseq data of 674 newly diagnosed MM patients with longitudinal follow-up from the Multiple Myeloma Research Foundation CoMMpass trial (NCT01454297; version IA11a), termed in the following CoMMpass cohort [31]. The statistical significance of differences in overall survival between patients’ groups was calculated using the log-rank test and survival curves were plotted using the Kaplan-Meier method. For other tumor types, the survival analysis was carried out using the Pan-Cancer datasets of the online tool www.kmplot.com (accessed on 15 January 2021) [32]. The Pan-Cancer dataset is based on TCGA data generated using the Illumina HiSeq 2000 platform with survival information derived from the published sources [33]. In the survival analysis, each cutoff between the lower and upper quartiles was analyzed by Cox proportional hazards regression; the best performing cutoff was used in the final analysis. The Kaplan-Meier survival plots were generated, and the hazard rates with 95% confidence intervals were computed to numerically assess the difference between the two cohorts.
DepMap (https://depmap.org/portal/, accessed on 6 October 2020) analysis of the dependency of a panel of tumor cell lines on individual genes was conducted using the CRISPR (Avana) Public 20Q3 (DepMap, Broad (2020): DepMap 20Q3 Public. figshare. Dataset doi:10.6084/m9.figshare.12931238.v1.) [34,35]. The following files of the Public 20Q3 release were downloaded for the analysis: “Achilles_gene_effect.csv” (Genetic Dependency CRISPR (Avana) Public 20Q3, Genes 18119, 789 Cell lines, 30 Primary Diseases, 27 lineages); ”CCLE_mutations.csv” (Cellular Models Mutation Public 20Q3, 18802 Genes, 1741 Cell Lines, 35 Primary Diseases, 37 Lineages); “sample_info.csv” (Cellular Models Cell Line Sample Info, 1804 Cell lines, 35 primary diseases, 38 lineages). For gene ontology data the Uniprot (https://www.uniprot.org/, accessed on 22 February 2021) database was used. The Power Query Microsoft Excel Tool was used to combine the data from different files. In total, the DepMap 20Q3 release contains the results of the experimental analyses of the effects of EZH2, SUZ12 or EED gene knockout by the CRISPR/Cas9 method on the proliferation of 777 cancer cell lines (Supplementary File S1 “CRISPR (AVANA) Public 20Q3 PRC2 cell lines info”).
To calculate p-values for the dependence hypotheses between the sensitivity of cell lines to EZH2, SUZ12, or EED knockouts and the presence of each documented non-silent mutation, we developed an original application termed Genes.py. Genes.py is written in Python and uses the Scipy, Numpy, and Pandas libraries. The silent mutations were excluded from the analysis using the attribute ‘Variant_Classification’ in ‘Cellular Models Mutation Public 20Q3′ file. Source code of the analysis is available at the following link: https://github.com/genesolution/PRC2_data (uploaded on 25 March 2021).
3. Results
3.1. Analysis of EZH2, SUZ12, and EED DNA Alterations in Patients’ Samples
Depending on the cancer type, alterations in the PRC2 methyltransferase complex have been demonstrated to be both pro- and anti-oncogenic [36]. Candidate cancers that might be sensitive to PRC2 inhibitors are those in which PRC2 plays an oncogenic function. These are the tumors characterized by overexpression of PRC2 encoding genes or by GOF mutations in the EZH2 gene leading to an increased PRC2 catalytic activity [2,19,20]. Amplification of the EZH2 coding region has been detected in different tumors [37,38,39,40]. Similarly, the SUZ12 gene is amplified in several tumors [41], nevertheless, there is a lack of information regarding the SUZ12 and EED amplification. Furthermore, amplification frequencies of individual PRC2 components have not been described.
To characterize the amplification of EZH2, EED, and SUZ12 in different tumor types we analyzed clinical samples for the amplified PRC2 subunit genes using the cBioPortal database (https://www.cbioportal.org/, accessed on 2 November 2020) [30]. The samples were grouped by tissue origin and only cohorts with at least 500 samples were analyzed. We found that the amplification of EZH2 as well as EED and SUZ12 subunits was not limited to a specific tumor type (Figure 1A,B). Furthermore, the amplification frequency of specific subunits differed significantly among tumor types (Figure 1A,B). Interestingly, simultaneous amplification of several PRC2 subunit genes can be detected in the same clinical sample (Supplementary File S2).
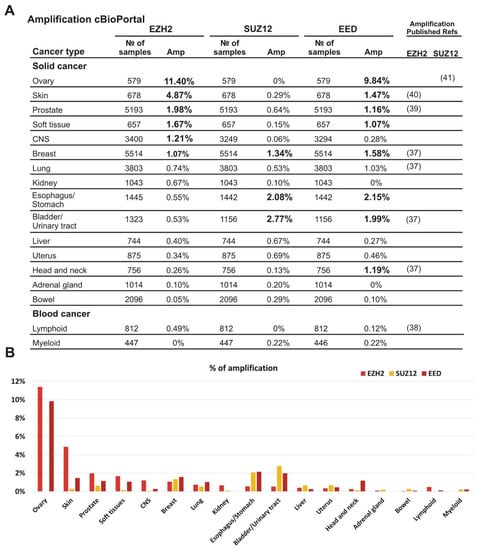
Figure 1.
Amplification of EZH2, SUZ12 and EED is frequently present in clinical cancer samples. (A) The analysis was performed using the cBioPortal database, which includes 185 studies and 48,045 non-overlapping samples. The cancer types containing more than 500 samples in the database are listed. The exact number of samples analyzed and the percent of cases with amplification is shown for each cancer type. All values above 1% are shown in bold; for convenience. The references to previous studies identifying amplification for EZH2 or SUZ12 are indicated on the left. (B) Graphical representation of EZH2, SUZ12 and EED frequencies of the amplifications.
The most frequent EZH2 amplification (11.4%) was observed in ovarian cancer. In this tumor type, EED was amplified in 9.84% of cases, while amplification of the SUZ12 was not observed. Similar tendency for the higher rate of EZH2 and EED amplification was found for skin, prostate, and soft tissue tumors (Figure 1A,B). Breast carcinomas showed approximately similar amplification rates for each of the three PRC2 genes. In CNS tumors, a higher amplification was observed for EZH2, while bladder/urinary tract and esophagus/stomach cancers displayed a more frequent amplification of EED and SUZ12. Head and neck tumors demonstrated a higher level of EED amplification than EZH2 and SUZ12. The adrenal gland and bowel cancers, as well as lymphoid and myeloid malignancies showed the lowest percentage of cases with amplification (Figure 1A,B). Thus, although the amplification of the EZH2, EED, and SUZ12 genes encoding the PRC2 subunits was detectable in the tumors derived from different tissues, the combinations of amplified genes and the frequency of this alteration varied significantly.
The analysis of tumor subtypes revealed a distribution of alterations in the EZH2, EED, and SUZ12 genes (amplifications, deep deletions, mutations, fusions, and multiple alterations) in the 20 most common tumor subtypes (at least 50 samples per each subtype). The highest alteration frequency for any PRC2 genes was observed for the castration-resistant prostate cancer (CRPC; 33%), germinal center B-cell-like diffuse large B-cell lymphoma (GCB-DLBCL) (25%), and prostate neuroendocrine carcinoma (20%) (Figure 2A).
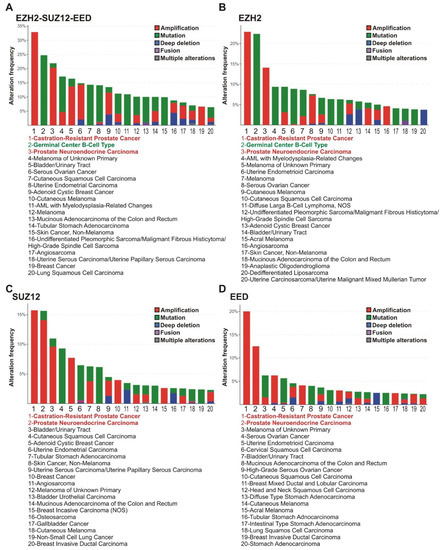
Figure 2.
PRC2 genes are most frequently altered in subtypes of prostate and lymphoid cancers. (A) Alterations of any PRC2 core genes. The frequencies of alterations (gene amplifications, mutations, deep deletions, fusions or multiple alterations) of PRC2 genes in clinical samples of different cancer types were analyzed using cBioPortal. Red—CRPC and prostate neuroendocrine carcinoma; Green - GCB-DLBCL lymphoma. (B–D) Data for EZH2, SUZ12 and EED, respectively. Please note that for some cases, the gene values for PRC2 subunits individually are lower due to co-occurrence of two or three cases of impairments (demonstrated in Supplementary File S2).
Individual examination of the EZH2, SUZ12, and EED genes (Figure 2B–D) showed that CRPC and prostate neuroendocrine carcinoma demonstrated an association with frequent alterations in each of the PRC2 encoding genes, while in GCB-DLBCL lymphoma a high correlation was found only with alterations in the EZH2 gene. In accordance with tissue origin data (Figure 1), the majority of alterations in the EZH2, SUZ12, and EED genes in prostate cancer are represented by amplifications. Unlike prostate cancer, the principal EZH2 gene abnormalities in the GCB-DLBCL are missense mutations (Figure 2).
Next, we queried the cBioPortal database to identify the prognostic role of PRC2 impairment in prostate cancer and in DLBCL lymphoma. Figure 3A,B show that amplifications of both EZH2 (logrank p = 1.8 × 10⁻⁷ ) and EED (logrank p = 1.4 × 10⁻¹⁰) in prostate cancer were associated with poor prognosis (data from [33,42,43]). For the SUZ12 gene, only two samples with amplifications and survival data are available, making the results uninterpretable.
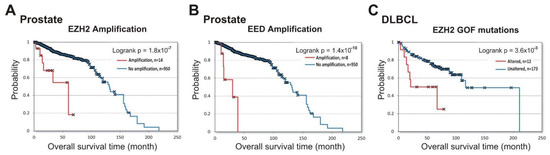
Figure 3.
Alterations in PRC2 subunits at DNA level correlate with shorter patient survival in prostate cancer (EZH2 and EED) and DLBCL (EZH2). Analysis of correlation between alterations in DNA with patient survival was performed using cBioPortal. (A) Correlation between the overall survival and amplification of the EZH2 gene in prostate cancer. The amplification (red) vs. unaltered group (blue) is shown. (B) Correlation between the overall survival and amplification of the EED gene in prostate cancer. (C) Correlation between the overall survival and the presence of EZH2 GOF mutations in DLBCL. The group with EZH2 GOF mutation (red) vs. unaltered group (blue) is shown.
In GCB-DLBCL, up to 21.7% of samples contained GOF missense mutations in the EZH2 SET domain [44,45] leading to an increased PRC2 catalytic activity [46,47]. In a previous study, a high GOF frequency in GCB-DLBCL was correlated with longer patient survival [48]. However, using the available prognostic data for the DLBCL lymphoma patients from three independent studies [33,49,50], we found that GOF mutations correlate with negative overall survival (logrank p =3.6 × 10⁻³) (Figure 3C). These results strongly suggest that EZH2 amplification in prostate cancer, and GOF mutations in DLBCL lymphoma, are predictors of disease progression.
3.2. Correlations between the EZH2, SUZ12, EED Transcription and Patient Survival
We next investigated the correlation of transcription of the EZH2, SUZ12 and EED genes with patient prognosis. Investigating the survival prognosis in multiple myeloma (MM) patients, we have shown that PRC2 core genes, EZH2, SUZ12 and EED, were significantly overexpressed in MM cells compared to normal plasma cells, making these cells sensitive to EPZ-6438, an inhibitor of EZH2 [51]. Moreover, high EZH2 expression correlated with poor prognosis in MM [52]. Herein, we studied the correlation of the elevated transcription of PRC2 core genes with the survival rate. RNAseq data were obtained from 674 newly diagnosed MM patients with longitudinal follow-up (Multiple Myeloma Research Foundation CoMMpass trial; NCT01454297; version IA11a). Patients were divided into two cohorts based on high (Figure 4A, red lines) or low (Figure 4A, green lines) mRNA levels of PRC2 subunits. The life expectancy (overall survival; OS) was analyzed for these two groups. Figure 4A demonstrates that the increased EZH2 transcription was significantly (logrank p = 2.98 × 10⁻¹³) correlated with poor prognosis. At the same time, high abundance of SUZ12 and EED transcripts showed no significant correlation with survival, suggesting that EZH2 expression is the strongest PRC2 prognostic marker in MM.
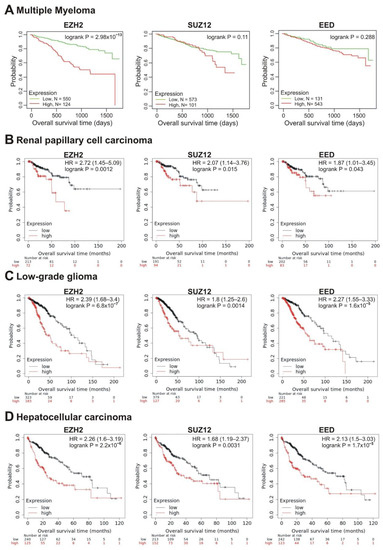
Figure 4.
Correlation between the overall survival and the levels of EZH2, SUZ12 or EED gene expression. (A) Data from the Multiple Myeloma Research Foundation CoMMpass trial (NCT01454297; version IA11a). The patients were divided into two cohorts—with low (green) or high (red) levels of gene expression. (B–D) The analysis was performed using the KMplot resource for renal papillary cell carcinoma (B), low-grade glioma (C) and hepatocellular carcinoma (D). The cohort with low level of gene expression is colored in black, cohort with high expression is colored in red.
To analyze the correlations of EZH2, SUZ12 and EED expression with the survival of patients with other tumors, we used RNAseq data in the Pan-Cancer dataset of the Kaplan-Maier plotter website (www.kmplot.com, accessed on 15 January 2021). The results are summarized in Table 1.

Table 1.
Correlations of EZH2, SUZ12 and EED gene expression with overall survival in different tumor types. The hazard ratio (HR) and p-values are shown in red when higher gene expression is correlated with a shorter survival, and in blue in case of a longer survival. logrank p < 0.05 are boldfaced. The “Refs to poor prognosis” columns indicate references to previous studies showing the correlation with poor survival of the respective PRC2 subunit.
In total, in 10 tumor types, the higher expression of at least one of the EZH2, SUZ12, or EED genes was significantly correlated with poor prognosis (logrank p < 0.05) (Table 1). In renal papillary cell carcinoma, low-grade glioma and hepatocellular carcinoma, poor prognosis was significantly correlated with high expression of all three genes, EZH2, SUZ12, and EED (Table 1, Figure 4B–D).
The strongest correlation between high mRNA abundance and poor survival was observed for EZH2 and EED in prostate adenocarcinoma (logrank p < 0.01; hazard ratio 6.52 and 5.16, respectively). The high expression of SUZ12 in this tumor also marked a tendency to poor prognosis (hazard ratio = 5.11, logrank p = 0.088) (Table 1, Figure 5A). A significant correlation with poor prognosis was also observed for high EZH2 and SUZ12 expression in sarcoma (Table 1, Figure 5B) and in lung adenocarcinoma (Table 1, Figure 5C); for EZH2 in breast cancer (Table 1, Figure 6A); for EZH2 and EED expression in ovarian cancer (Table 1, Figure 6B).
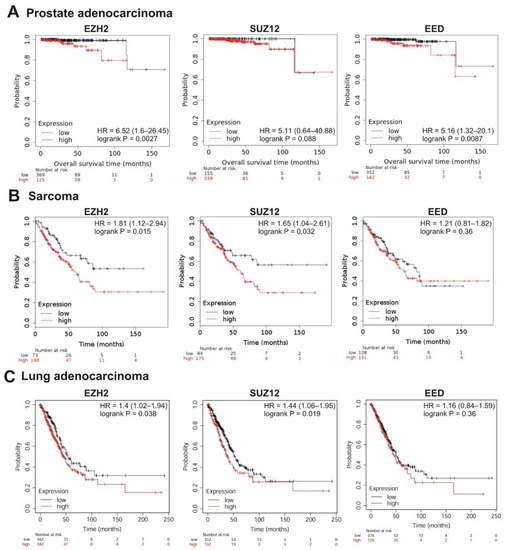
Figure 5.
Correlation between the overall survival and the levels of EZH2, SUZ12 or EED gene expression. (A) Prostate adenocarcinoma, (B) sarcoma, and (C) lung adenocarcinoma. The analysis was performed using KMplot resource.
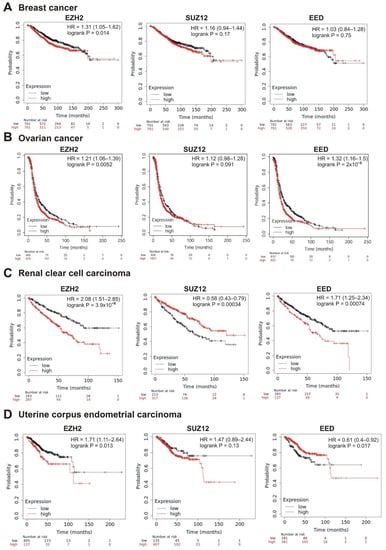
Figure 6.
Correlation between the overall survival and the levels of EZH2, SUZ12 or EED gene expression. (A) Breast cancer, (B) ovarian cancer, (C) renal clear cell carcinoma, and (D) uterine corpus endometrial carcinoma.
Intriguingly, in several cases, higher expression of PRC2 genes was differently but significantly correlated with patient survival. In renal clear cell carcinoma, higher expression of EZH2 and EED was significantly correlated with poor prognosis, whereas high levels of SUZ12 were associated with longer survival (Table 1, Figure 6C). For the uterine corpus endometrial carcinoma, high expression of EZH2 was correlated with poor survival, although higher expression of EED was associated with a longer survival (Table 1, Figure 6D).
Remarkably, opposite correlations were observed for EZH2, SUZ12, and EED in some cancers, with higher expression being associated with a longer survival, suggesting a tumor suppressor role for PRC2 in those cases. In particular, the higher expression of either of the PRC2 genes correlated with a longer patient survival in gastric cancer and thymoma (Table 1, Supplementary File S3).
3.3. Dependency of Tumor Cell Lines on EZH2, SUZ12, and EED
An alternative approach to identifying PRC2-dependent tumors is the screening of a large panel of cell lines of different tissues-of-origin for growth inhibition upon suppression of PRC2 function. Currently, an online project called DepMap (www.depmap.org, accessed on 6 October 2020) allows one to predict and approximate the results of such screening [34,35]. In DepMap, a comprehensive library of human genes has been knocked down by RNAi or, more recently, knocked out through CRISPR technology in large panels of human cell lines representing different tumor types. The probability of dependency of each cell line on the queried gene is represented as the dependency scores, where strong negative values mark the cases where a given gene is especially important for growth or survival of the respective cell lines. The cell line is considered dependent if the probability of dependency is >0.5; a score of 0 is equivalent to a non-essential gene, whereas a score of −1 corresponds to the median of all common essential genes, respectively. For gene effects, a score of <−0.5 indicates sensitive cell lines (depletion of most cells), while <−1 represents strong killing.
Figure 7A–C demonstrates that, for all PRC2 subunits, CRISPR knockout showed a stronger inhibitory effect on cell growth than RNAi knockdown. Figure 7B,C shows that upon CRISPR knockout the SUZ12 and EED genes appeared as ‘strongly selective’ and were important for growth/survival of 86/777 and 238/777 cell lines, respectively. For EZH2, only 15/777 lines were sensitive (Figure 7A). One factor of the differential roles of individual PRC2 subunits is the EZH2 paralog protein EZH1 (Enhancer of Zeste Homolog 1). This paralog has much lower methyltransferase activity [79] and is less important for development [80]. However, EZH1 can partially replace EZH2 in cells where EZH2 expression is impaired [81,82,83]. Consistent with this possibility, there are no homologs for the SUZ12 and EED proteins in humans. Due to a higher sensitivity of cell lines upon gene knockout, further analysis was based on CRISPR/Cas9 data.
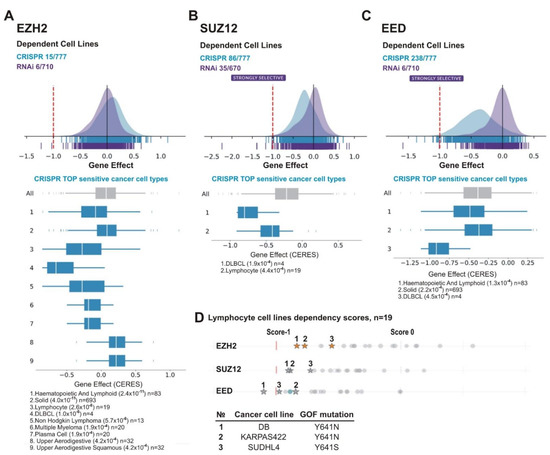
Figure 7.
Lymphoid cancer cell lines are particularly sensitive to PRC2 knockout. The analysis was performed using DepMap database. (A) EZH2, (B) SUZ12 and (C) EED. (A–C) UP: schematic representation of the effects of gene knockout (by CRISPR, blue) or knockdown (by RNAi, purple) on cells growth and viability. X-axis: dependency scores (Gene Effect) reflect the dependence of cell growth and survival upon depletion of a particular gene. Negative values indicate that cell proliferation is decreasing upon the gene depletion and score less than −0.5 indicates that the gene is required for survival of a given cancer cell line. Numbers next to “CRISPR” and “RNAi” indicate the amount of sensitive cell lines with score <−0.5/total number of cell lines in each case. DOWN: The TOP sensitive cancer cell types to knockout of EZH2 (A), SUZ12 (B), and EED (C) by CRISPR are shown. (D) Lymphoma lines carrying EZH2 GOF mutations are in TOP of cell lines sensitive to EZH2, SUZ12 or EED knockout. UP: The dependency scores for a panel of lymphoma lines upon knockout of PRC2 genes by CRISPR. Asterisks indicate the cell lines with GOF mutations in the EZH2 SET domain, grey circles—lines without GOF mutations. DOWN: The GOF mutations in test cell lines are indicated.
We thus queried the DepMap CRISPR EZH2, SUZ12, or EED knockout data for Top Co-dependency Pearson correlations. In the case of each gene knockout (EZH2, SUZ12, or EED), two other subunits were identified as Top co-dependent (Table 2). This is in accordance with their cooperative function in regulation of transcription. Thus, DepMap corroborates biochemical data indicating the validity of this analysis.
Table 2.
The Top Co-dependency Pearson correlations upon knockout of PRC2 components by CRISPR/Cas9 technology in tumor cell lines (DepMap project data). Bold—subunits of PRC2 complex.
We next analyzed cell lines of various tissue origin. Among the most sensitive types for each of the PRC2 gene knockouts were lymphoma cell lines including DLBCL (Figure 7A–C). This is consistent with findings suggesting that lymphoma cells, in particular, DLBCL, are sensitive to EZH2 depletion and EZH2 inhibitors [84,85,86,87]. Because this malignancy is frequently characterized by GOF missense mutations of the EZH2 SET domain [44,45,88], we focused on lymphocyte cell lines. The panel in the DepMap project includes three DLBCL cell lines with EZH2 GOF mutations: DB (Y641N), KARPAS422 (Y641N) and SUDHL4 (Y641S). Noteworthy, these cell lines are among the most sensitive to knockouts of each of PRC2 subunits (Figure 7D), with DB being among the Top10 of the sensitive lines upon depletion of any of PRC2 subunit (Table 3). This suggests that GOF mutations in the SET domain of EZH2 can augment the sensitivity of lymphoma cells to the inhibition of either EZH2, SUZ12, or EED.
Table 3.
Top cell lines most sensitive to EZH2, SUZ12, and EED knockouts by CRISPR/Cas9. Red—cancer cell lines present in TOP15 sensitive upon depletion of any PRC2 subunit; purple—present in case of depletion of any of two of PRC2 subunits.
Along with lymphoma, the cell lines of other tissue origins were among the most sensitive to PRC2 knockouts (Table 3, Supplementary File S1). These included TUHR10TKB kidney cancer cell line sensitive to depletion of either of the PRC2 subunits (Table 3); the OC316 ovarian cancer line that was in the Top10 for EZH2 and EED (Table 3) and in the Top40 for SUZ12 (Supplementary File S1) and, finally, the VCAP prostate cancer line—in the Top10 for EZH2 and SUZ12 (Table 3) and in the Top40 for EED (Supplementary File S1).
Recent data retrieved a few genetic markers associated with sensitivity of tumor cells to PRC2 inhibition. The epithelioid sarcoma (for which tazemetostat has been approved by the FDA [26,27,28]) is deficient in the SMARCB1 (also known as INI1 or SNF5) subunit of the SWI/SNF family [27]. Several other SMARCB1 mutant cancers, including malignant rhabdoid tumors (MRT) and atypical teratoid rhabdoid tumors (ATRT) are candidates for treatment with EZH2 inhibitors [89,90]. Several components of the SWI/SNF complex (SMARCA2, SMARCA4, ARID1A, PBRM1) are also promising targets for the PRC2 inhibitor therapy. Preclinical and Phase 1 studies suggest an efficacy of tazemetostat in the treatment of SCCOHT (small cell carcinoma of the ovary hypercalcaemic type) deficient in SMARCA4 (also known as BRG1) and SMARCA2 (a.k.a. BRM) [91]. In addition, cell lines carrying ARID1A- and PBRM1 mutants are sensitive to EZH2 inhibition [92,93,94].
With this information, we aimed to identify more gene candidates as markers for sensitivity to PRC2 inhibition. In so doing, we generated a Python application to challenge a hypothesis of dependence between the growth inhibition upon knockout of EZH2, SUZ12, or EED, and the presence of each documented mutation (https://github.com/genesolution/PRC2_data, uploaded on 25 March 2021). For the test hypothesis, a cell line was considered to be “sensitive” if it had a score <−0.5 (inhibition of the majority of cells). This value was provided to us as the universal effect limit for the DepMap tables due to the normalization that had been previously done by the DepMap table authors. In our analysis, we used all types of genetic alterations, except synonymous mutations marked as “silent” (using Variant_Classification column).
The level of p-value significance was set at p < 0.05. All mutations for which the test hypothesis was found to be significant (p < 0.05) are listed in Supplementary File S4 “PRC2 significant p-value_no_silent EZH2, SUZ12, EED”. The number of some gene mutations is very low (there are initially only a few of them, or most are classified as “Silent”). In this case, it is inappropriate to use the p-value to draw a reliable conclusion about their effect. However, we kept all the obtained values to indicate the possibly promising genes for further analysis. For the detailed analysis, the cases with the mutation present in at least 10 cell lines were suggested as statistically relevant.
To validate the analysis, we first tested the presence of SMARCB1 and other SWI/SNF subunits in the resulting list (Figure 8). Additionally, we paid attention to mutations of transcriptional activators from the Trithorax group, i.e., the subunits of COMPASS- and COMPASS-like complexes that antagonize PcG activity [2,4,5,95]. Figure 8 shows that SMARCB1 alteration was correlated with the sensitivity of cell lines to EZH2 (p = 0.0019) and SUZ12 (p = 0.0457) knockdown. Impairment of two SWI/SNF subunits, SMARCA4 (p = 0.0317) and ARID1B (p = 0.0479), was correlated with the sensitivity to EED knockout. Furthermore, among COMPASS/COMPASS-like complexes, depletion of KMT2D (p = 0.0435) and KMT2B (p = 0.0325) histone methyltransferases correlated with knockouts of SUZ12 and EED, respectively.
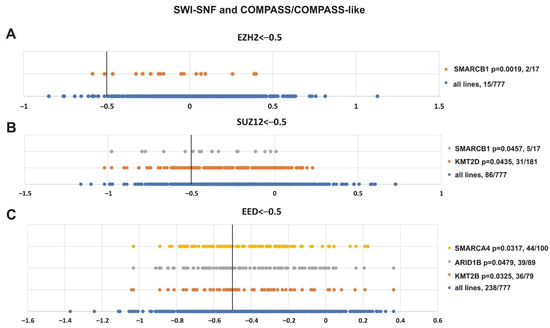
Figure 8.
Mutations in genes encoding subunits of the SWI/SNF and COMPASS-like complexes correlate with sensitivity to PRC2 knockout. (A) EZH2, (B) SUZ12 and (C) EED. The X-axis shows the dependency scores of the lines with alterations of a particular gene (orange, grey and yellow circles) vs. all cell lines (blue circles, 777 in total). Black bold vertical line indicates the dependency score −0.5 (the score <−0.5 mean that gene is critical for cells survival). p-value—the statistical significancy for hypothesis that the cell lines with SWI/SNF or COMPASS mutations will have a score of less than −0.5. The number of cancer cell lines bearing an altered gene with a score <−0.5/total number of cell lines bearing the altered gene is indicated at the right.
While SMARCB1 was in the resulting list, this marker was not among the top correlated genes. Figure 9 shows the genes whose impairment demonstrated the best correlation with the sensitivity of cell lines to knockouts of EZH2 (Figure 9A), SUZ12 (Figure 9B) and EED (Figure 9C).
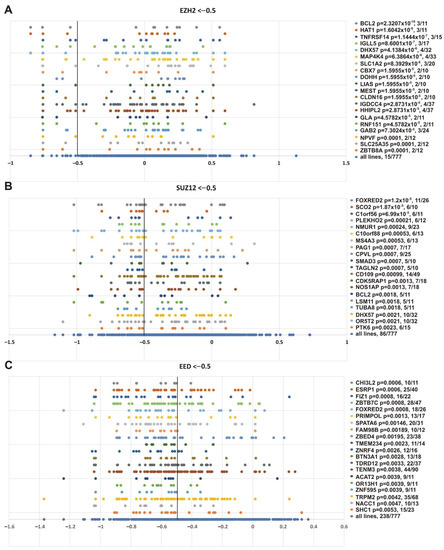
Figure 9.
Top 20 genes showing the best correlation with the sensitivity of cancer cell lines to PRC2 genes knockout. (A) EZH2, (B) SUZ12 and (C) EED. Other designations as in Figure 8.
This analysis produced several interesting observations. First, some genes with the lowest p-values are known to be functionally connected to PcG or TrxG systems. CPVL (carboxypeptidase, vitellogenic-like), which was significant in SUZ12 knockout (p = 0.0007), can be co-purified with the Polycomb repressive complex 1 (PRC1) subunits PCGF2 and PHC2 in affinity-capture MS [96]. SMAD3 was significant for SUZ12 knockout (p = 0.0007); it is an important component of the transforming growth factor β (TGFβ) signaling, and interacts with the BRG1 SWI/SNF complex (subunits SMARCA4, ARID1B/BAF250b, SMARCC2/BAF170, and SMARCC1/BAF155) [97] and CREBBP [97,98,99]. ESRP1 (epithelial splicing regulatory protein 1) and FAM98B (family with sequence similarity 98, member B) were significant in EED knockout (p = 0.0006 and p = 0.00189); they are minor components of cPRC1 purified via BMI1 (PCGF4) [100]. Among the markers sensitive to EZH2 knockout, CBX7 (EZH2, p = 1.5955 × 10⁻⁵) is a subunit of PRC1 [96], and ZBTB8A (EZH2, p = 0.0001) interacts with CBX8 in two hybrid screening [101]. IGLL5 (immunoglobulin lambda-like polypeptide 5), significant for EZH2 (p = 8.6001 × 10⁻⁷), is a minor component of PRC2 purified via EZH2 or SUZ12, and of PRC1 purified with antibodies against RNF2/RING1B [100].
Second, several genes were correlated with knockouts of several PRC2 subunits (Figure 9 and Supplementary File S4). This group is of special interest, since different PRC2 subunits are expected to function together and all are required for the PRC2 catalytic activity. In particular, the TOP list contains FOXRED2 gene impairment, which showed the best correlation dependency with SUZ12 knockout (p = 1.2 × 10⁻⁵) and correlated with EED knockout (p = 0.0008). BCL2 showed the best correlation with EZH2 knockout (p = 2.3207 × 10⁻¹⁰) and correlated with SUZ12 (p = 0.0018) knockout. The DHX57 gene was correlated with SUZ12 (p = 0.0021) and EZH2 (p = 4.1384 × 10⁻⁶ knockout, respectively. The DHX57 gene has been attributed to the PcG system, since DHX57 interacts with CBX2 in two hybrid screening [101,102].
Finally, we were interested in finding genes whose impairment was correlated with inhibition of the three PRC2 subunits. Figure 10 shows that alterations in SUSD2 (sushi domain containing 2), FIZ1 (FLT3 interacting zinc finger 1) and FBXW11 (F-box and WD repeat domain containing 11) genes correlated with knockout of EZH2 (p = 0.0319, p = 0.0097, p = 0.0519, respectively), SUZ12 (p = 0.0027, p = 0.0092, p = 0.0131, respectively) and EED (p = 0.0472, p = 0.0008, p = 0.0081, respectively). Intriguingly, FBXW11 co-purifies with EED [103], SUZ12 and EZH2 [104].
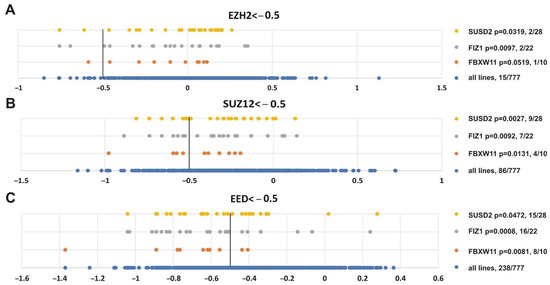
Figure 10.
Genes showing significant correlation with the sensitivity of cancer cell lines to knockout of any PRC2 subunit. (A) EZH2, (B) SUZ12 or (C) EED. Other designations as in Figure 8.
4. Discussion
The PRC2 repressor complex plays a central role in maintaining the correct pattern of gene expression in multicellular organisms. Dysfunction of this complex is associated with many pathologies, including cancer. The development of small-molecule PRC2 inhibitors requires the identification of types and subtypes of tumors that are dependent on the PRC2 function. Current data are largely focused on the impairment of the EZH2 methyltransferase, a core PRC2 subunit, in cancer. Two other core PRC2 subunits, SUZ12 and EED, have been less studied. Here, we analyzed the role of all core PRC2 subunits in a series of clinical tumor samples (cBioPortal and Kaplan-Maier plotter resources) and in a panel of tumor cell lines (assayed in the DepMap project).
The analysis of cBioPortal clinical data indicates that amplification of EZH2, SUZ12, and EED genes was not limited to one particular malignancy but varied between different tumor types. The ovarian, skin, prostate and soft tissue tumors are characterized by over 1% amplification frequency of EZH2 and EED genes with the highest frequency in ovarian cancer: 11.4% and 9.84%, respectively. The SUZ12 gene was amplified in >1% of breast, esophagus/stomach, and bladder/urinary tract tumors where its amplification correlated with >1% of EED amplification. In addition, over 1% of EED amplification was observed in the head and neck cancer specimens.
Detailed analysis of tumor subtypes identified CRPC and prostate neuroendocrine carcinoma as the tumors with the highest amplification rate (12–23%) of EZH2, SUZ12 and EED genes. The amplification of EZH2 in prostate cancer was first shown by Saramaki et al. [39] where it was significantly (p < 0.05) correlated with increased EZH2 protein levels. Subsequent studies of prostate cancer demonstrated that high EZH2 and SUZ12 expression correlate with metastasis progression [60], and for EZH2high, with poor survival prognosis [58,59]. Here, we show that amplification and higher expression of EZH2 and EED correlate with poor survival, further supporting the involvement of EZH2 and its PRC2 protein partners in prostate cancer.
Missense mutations of EZH2, but not SUZ12 or EED, were most frequent in GCB-DLBCL (over 20%, cBioPortal clinical data). Missense mutations in GCB-DLBCL are frequently represented by GOF mutations in the EZH2 SET domain [44,45] that enhance PRC2 methyltransferase activity, leading to an abnormally high level of the chromatin repressive H3K27me3 mark [46,47]. The survival analysis based on three independent studies [33,49,50] indicates that GOF mutations in EZH2 correlate with poor prognosis in DLBCL. Remarkably, the DLBCL cell lines (DepMap project) with GOF mutations in EZH2 were among the most sensitive to PRC2 knockout.
The high EZH2, SUZ12, and EED expression in tumor samples has been attributed to the decreased patient survival in several tumor types [2,19,20]. Here we demonstrated that along with prostate adenocarcinoma, other tumor types show a correlation between high EZH2, SUZ12 and EED levels and a shorter survival, suggesting that these cancers could be potential targets for EZH2/SUZ12/EED inhibitor therapy. Importantly, the high expression of either of the PRC2 subunits correlate with poor prognosis in patients with renal papillary cell carcinoma, low-grade glioma and hepatocellular carcinoma. Furthermore, poor prognosis was revealed for sarcoma and lung adenocarcinomas (EZH2high and SUZ12high); ovarian, renal clear cell carcinomas (EZH2high and EEDhigh); and for MM, as well as breast and endometrial carcinomas (EZH2high).
The EZH2 sensitivity to inhibitor therapy was shown to be dependent on the presence of mutations in secondary genes. In particular, the SWI/SNF subunit SMARCB1 has been approved as an effective marker of metastatic or locally advanced epithelioid sarcoma sensitivity to tazemetostat [26,27,28], while SMARCA2, SMARCA4, ARID1A, and PBRM1 are potential marker candidates [91,92,93,94,105]. The analysis of correlation between impairment of individual genes and the sensitivity of 777 cell lines to knockout of EZH2, SUZ12, or EED genes allowed us to predict new gene mutations as tentative markers for PRC2 inhibitor therapy. The list of these genes includes the genes encoding SWI/SNF complex subunits, namely, SMARCB1, SMARCA4, and ARID1B. Furthermore, impairment of KMT2D and KMT2B COMPASS-like genes was also significant. Both SWI/SNF and COMPASS-like are the Trithorax group complexes that counteract the repressive activity of PRC2 suggesting that SWI/SNF and COMPASS-like members can be directly involved in the regulation of PRC2 mediated carcinogenesis. Accordingly, loss-of-function mutations in KMT2D can occur in B-cell lymphomas together with GOF mutations of the EZH2 gene [106]. Moreover, similarly to EZH2 GOF, the loss of KMT2D promotes lymphomagenesis [107,108].
A significant overlap between DNA methylation and H3K27me3 binding in EZH2 inhibitor target genes was described in MM in association with resistance to the EZH2 inhibitor [51]. These two repressive marks have been shown to be mechanistically linked [109]. Of interest, the addition of a low dose of DNMT inhibitor can resensitise EZH2 inhibitor-resistant MM cells to EZH2 inhibition [51], suggesting that combination of EZH2 and DNMT inhibitors could be of therapeutic interest.
Impairment of several newly identified genes showed even higher correlations with sensitivity of tumor cell lines to PRC2 knockout. Alterations of BCL2 (B-cell CLL/lymphoma 2) showed the best correlation with EZH2 and correlated significantly with SUZ12 knockout. Alterations in BCL2 frequently co-occur with EZH2 in DLBCL, and combined inhibition of BCL2 and EZH2 has been considered a rational therapeutic approach [110].
Several other factors, including CPVL, SMAD3, CBX7, ESRP1, FAM98B, IGLL5, DHX57, and FBXW11 were shown to be physically connected to PcG or TrxG systems. Among these factors SMAD3 (significant in SUZ12 knockout) is an important component of TGFβ signaling. In response to TGFβ SMAD3 interacts with and is acetylated by histone acetyltransferase CREBBP [97,98,99]. SMAD3 acetylation has been shown to be critical for potentially oncogenic Epstein-Barr virus lytic program [99]. Moreover, the recruitment of RbBP5 component of COMPASS-like complexes and the formation of H3K4me3 at SNAIL transcription start site during epithelial-mesenchymal transition are dependent on SMAD3 and CBP in the DU145 prostate cancer cell line [111].
Finally, we note that, while higher expression of PRC2 components is frequently associated with poor prognosis, in a significant number of cases, the opposite correlation was observed. This is consistent with previous reports identifying inactivating PRC2 mutations in hematological cancers, indicating that PRC2 can play a context-dependent tumor suppressor role. EZH2 inactivating mutations have been reported in myeloid hemopathies including chronic myelomonocytic leukemia (CML), myelofibrosis, myelodysplastic syndrome (MDS) and AML [112,113,114]. Furthermore, EZH2-loss-of-function mutations were associated with a poor outcome in MDS, CML and myelofibrosis [112,113,115]. EZH2-loss of function mutations can also contribute to the development of T-ALL [116,117]. It has been shown that PRC2 inhibits the self-renewal potential of immature lymphoid progenitors [118,119,120], whereas it stimulates mature cell proliferation [51,52,121,122,123]. Therefore, PRC2 may act as an oncogenic factor in mature hematopoietic cells while exerting tumor suppressor activities in undifferentiated or immature cells. While these tumors might be insensitive to EZH2 inhibitors, a correlation between higher expression of PRC2 and good prognosis might be of interest as it might suggest a possible sensitivity of these tumors to inhibitors of KDM6 that demethylate H3K27me3 [124], or of active chromatin components, such as those previously reported for SUZ12 inactivating mutations that sensitize several cancer types to inhibitors of Bromodomain and Extra-Terminal motif (BET) proteins, a family of proteins that counteract gene silencing with a chromatin activation function [125].
5. Conclusions
In summary, we performed bioinformatic analysis of genomic and transcriptomic data across multiple tumor types to identify clinically significant trends related to PRC2. With this analysis, we identified new tumors that could benefit from targeted PRC2 treatment. Moreover, DepMap interactive genes could present new potential markers of tumors that are more sensitive to PRC2 inhibitors. The next step would be to elucidate the functional role of identified genes in PRC2 oncogenic function and sensitivity to inhibitors directly. Furthermore, studies are needed to assess the cellular and molecular effects of PRC2 inhibitors. For instance, while PRC2 is frequently overexpressed in breast cancer, single-cell analysis suggests that drug-resistant cells may downregulate H3K27me3 at many loci [126]. Our analysis makes it possible to filter individual genetic factors related to tumor sensitivity to PRC2 inhibition. These factors could set the stage for the selection of patients for individualized treatment with PRC2-targeting drugs.
Supplementary Materials
The following are available online at https://www.mdpi.com/article/10.3390/cancers13133155/s1, Supplementary File S1: CRISPR (AVANA) Public 20Q3 PRC2 cell lines info, Supplementary File S2: cBioPortal oncoprint representation of PRC2 alterations identified in different cancers, Supplementary File S3: Survival prognosis data for gastric cancer and thymoma, Supplementary File S4: PRC2 significant p-value_no_silent EZH2, SUZ12, EED.
Author Contributions
Conceptualization and design of the project, M.E., O.C., I.B.R., J.M., P.G., G.C. and D.C.; Investigation, M.E., V.V.T., V.M., A.A.S. and D.C. (cBioportal analysis), M.E., B.G., J.M. and G.C. (Survival analysis), M.E., O.C. and D.C. (DepMap analysis); Software, O.C. (DepMap Python programming and statistical analysis); Visualization, M.E., B.G. and D.C.; Writing—Original Draft Preparation, M.E., O.C. and D.C.; Writing—Review & Editing, all authors. All authors read and approved the final manuscript. M.E. and O.C. contributed equally to this work. All authors have read and agreed to the published version of the manuscript.
Funding
This study was supported by the Russian Science Foundation (RSF) 20-74-10099 to Maksim Erokhin (DepMap data analysis); by grants from the European Research Council (Advanced Grant 3DEpi, under grant agreement No 788972), the European Union’s Horizon 2020 research and innovation programme (ChromDesign, under the Martie Sklodowska-Curie grant agreement No 813327), the Agence Nationale de la Recherche (ANR-18-CE15-0010 PLASMADIFF3D), the Fondation pour la Recherche Médicale (DEI20151234396), the MSDAVENIR foundation (Project GENE-IGH), the INSERM and the French National Cancer Institute (INCa PLBIO18-362—PIT-MM) to Giacomo Cavalli; by the French National Cancer Institute (INCa PLBIO18-362—PIT-MM and PLBIO19-098 INCA_13832 FATidique), the Agence Nationale de la Recherche (ANR-18-CE15-0010 PLASMADIFF3D and TIE-Skip; 2017-CE15-0024-01), the ITMO PCSI 2020 SMOOTH-MM, Labex EpiGenMed and Institut Universitaire de France to Jerome Moreaux; by the 2018-2.1.17-TET-KR-00001 and 2018-1.3.1-VKE-2018-00032 grants and by the Higher Education Institutional Excellence Programme (2020-4.1.1.-TKP2020) of the Ministry for Innovation and Technology in Hungary, within the framework of the Bionic thematic programme of the Semmelweis University to Balázs Győrffy; by the Megagrant (Agreement № 14.W03.31.0020 between the Ministry of Science and Education of the Russian Federation and Institute of Gene Biology, Russian Academy of Sciences).
Institutional Review Board Statement
Not applicable.
Informed Consent Statement
Not applicable.
Data Availability Statement
All relevant data are within the paper and its Supporting Information. Source code of the analysis can be found here: https://github.com/genesolution/PRC2_data (uploaded on 25 March 2021).
Acknowledgments
We thank the Center for Precision Genome Editing and Genetic Technologies for Biomedicine, IGB RAS for the required equipment.
Conflicts of Interest
The authors declare no conflict of interest.
References
- Bracken, A.P.; Brien, G.L.; Verrijzer, C.P. Dangerous liaisons: Interplay between SWI/SNF, NuRD, and Polycomb in chromatin regulation and cancer. Genes Dev. 2019, 33, 936–959. [Google Scholar] [CrossRef] [PubMed]
- Chetverina, D.A.; Lomaev, D.V.; Erokhin, M.M. Polycomb and Trithorax Group Proteins: The Long Road from Mutations in Drosophila to Use in Medicine. Acta Nat. 2020, 12, 66–85. [Google Scholar] [CrossRef] [PubMed]
- Kuroda, M.I.; Kang, H.; De, S.; Kassis, J.A. Dynamic Competition of Polycomb and Trithorax in Transcriptional Programming. Annu. Rev. Biochem. 2020. [Google Scholar] [CrossRef] [PubMed]
- Piunti, A.; Shilatifard, A. Epigenetic balance of gene expression by Polycomb and COMPASS families. Science 2016, 352, aad9780. [Google Scholar] [CrossRef] [PubMed]
- Schuettengruber, B.; Bourbon, H.M.; Di Croce, L.; Cavalli, G. Genome Regulation by Polycomb and Trithorax: 70 Years and Counting. Cell 2017, 171, 34–57. [Google Scholar] [CrossRef]
- Deevy, O.; Bracken, A.P. PRC2 functions in development and congenital disorders. Development 2019, 146. [Google Scholar] [CrossRef] [PubMed]
- Kouznetsova, V.L.; Tchekanov, A.; Li, X.; Yan, X.; Tsigelny, I.F. Polycomb repressive 2 complex-Molecular mechanisms of function. Protein Sci. A Publ. Protein Soc. 2019, 28, 1387–1399. [Google Scholar] [CrossRef] [PubMed]
- Yu, J.R.; Lee, C.H.; Oksuz, O.; Stafford, J.M.; Reinberg, D. PRC2 is high maintenance. Genes Dev. 2019, 33, 903–935. [Google Scholar] [CrossRef]
- Cao, R.; Wang, L.; Wang, H.; Xia, L.; Erdjument-Bromage, H.; Tempst, P.; Jones, R.S.; Zhang, Y. Role of histone H3 lysine 27 methylation in Polycomb-group silencing. Science 2002, 298, 1039–1043. [Google Scholar] [CrossRef]
- Ferrari, K.J.; Scelfo, A.; Jammula, S.; Cuomo, A.; Barozzi, I.; Stutzer, A.; Fischle, W.; Bonaldi, T.; Pasini, D. Polycomb-dependent H3K27me1 and H3K27me2 regulate active transcription and enhancer fidelity. Mol. Cell 2014, 53, 49–62. [Google Scholar] [CrossRef] [PubMed]
- Hojfeldt, J.W.; Laugesen, A.; Willumsen, B.M.; Damhofer, H.; Hedehus, L.; Tvardovskiy, A.; Mohammad, F.; Jensen, O.N.; Helin, K. Accurate H3K27 methylation can be established de novo by SUZ12-directed PRC2. Nat. Struct. Mol. Biol. 2018, 25, 225–232. [Google Scholar] [CrossRef] [PubMed]
- Kuzmichev, A.; Nishioka, K.; Erdjument-Bromage, H.; Tempst, P.; Reinberg, D. Histone methyltransferase activity associated with a human multiprotein complex containing the Enhancer of Zeste protein. Genes Dev. 2002, 16, 2893–2905. [Google Scholar] [CrossRef]
- Cao, R.; Zhang, Y. SUZ12 is required for both the histone methyltransferase activity and the silencing function of the EED-EZH2 complex. Mol. Cell 2004, 15, 57–67. [Google Scholar] [CrossRef]
- Montgomery, N.D.; Yee, D.; Chen, A.; Kalantry, S.; Chamberlain, S.J.; Otte, A.P.; Magnuson, T. The murine polycomb group protein Eed is required for global histone H3 lysine-27 methylation. Curr. Biol. 2005, 15, 942–947. [Google Scholar] [CrossRef] [PubMed]
- Pasini, D.; Bracken, A.P.; Jensen, M.R.; Lazzerini Denchi, E.; Helin, K. Suz12 is essential for mouse development and for EZH2 histone methyltransferase activity. EMBO J. 2004, 23, 4061–4071. [Google Scholar] [CrossRef]
- Faust, C.; Schumacher, A.; Holdener, B.; Magnuson, T. The eed mutation disrupts anterior mesoderm production in mice. Development 1995, 121, 273–285. [Google Scholar] [CrossRef]
- O’Carroll, D.; Erhardt, S.; Pagani, M.; Barton, S.C.; Surani, M.A.; Jenuwein, T. The polycomb-group gene Ezh2 is required for early mouse development. Mol. Cell. Biol. 2001, 21, 4330–4336. [Google Scholar] [CrossRef] [PubMed]
- Collinson, A.; Collier, A.J.; Morgan, N.P.; Sienerth, A.R.; Chandra, T.; Andrews, S.; Rugg-Gunn, P.J. Deletion of the Polycomb-Group Protein EZH2 Leads to Compromised Self-Renewal and Differentiation Defects in Human Embryonic Stem Cells. Cell Rep. 2016, 17, 2700–2714. [Google Scholar] [CrossRef] [PubMed]
- Comet, I.; Riising, E.M.; Leblanc, B.; Helin, K. Maintaining cell identity: PRC2-mediated regulation of transcription and cancer. Nat. Rev. Cancer 2016, 16, 803–810. [Google Scholar] [CrossRef]
- Kim, K.H.; Roberts, C.W. Targeting EZH2 in cancer. Nat. Med. 2016, 22, 128–134. [Google Scholar] [CrossRef]
- Lue, J.K.; Amengual, J.E. Emerging EZH2 Inhibitors and Their Application in Lymphoma. Curr. Hematol. Malig. Rep. 2018, 13, 369–382. [Google Scholar] [CrossRef]
- Yamagishi, M.; Uchimaru, K. Targeting EZH2 in cancer therapy. Curr. Opin. Oncol. 2017, 29, 375–381. [Google Scholar] [CrossRef]
- Varlet, E.; Ovejero, S.; Martinez, A.M.; Cavalli, G.; Moreaux, J. Role of Polycomb Complexes in Normal and Malignant Plasma Cells. Int. J. Mol. Sci. 2020, 21, 8047. [Google Scholar] [CrossRef]
- Richart, L.; Margueron, R. Drugging histone methyltransferases in cancer. Curr. Opin. Chem. Biol. 2020, 56, 51–62. [Google Scholar] [CrossRef]
- Rugo, H.S.; Jacobs, I.; Sharma, S.; Scappaticci, F.; Paul, T.A.; Jensen-Pergakes, K.; Malouf, G.G. The Promise for Histone Methyltransferase Inhibitors for Epigenetic Therapy in Clinical Oncology: A Narrative Review. Adv. Ther. 2020, 37, 3059–3082. [Google Scholar] [CrossRef]
- Hoy, S.M. Tazemetostat: First Approval. Drugs 2020, 80, 513–521. [Google Scholar] [CrossRef] [PubMed]
- Italiano, A. Targeting epigenetics in sarcomas through EZH2 inhibition. J. Hematol. Oncol. 2020, 13, 33. [Google Scholar] [CrossRef] [PubMed]
- Rothbart, S.B.; Baylin, S.B. Epigenetic Therapy for Epithelioid Sarcoma. Cell 2020, 181, 211. [Google Scholar] [CrossRef] [PubMed]
- Morschhauser, F.; Tilly, H.; Chaidos, A.; McKay, P.; Phillips, T.; Assouline, S.; Batlevi, C.L.; Campbell, P.; Ribrag, V.; Damaj, G.L.; et al. Tazemetostat for patients with relapsed or refractory follicular lymphoma: An open-label, single-arm, multicentre, phase 2 trial. Lancet Oncol. 2020, 21, 1433–1442. [Google Scholar] [CrossRef]
- Cerami, E.; Gao, J.; Dogrusoz, U.; Gross, B.E.; Sumer, S.O.; Aksoy, B.A.; Jacobsen, A.; Byrne, C.J.; Heuer, M.L.; Larsson, E.; et al. The cBio cancer genomics portal: An open platform for exploring multidimensional cancer genomics data. Cancer Discov. 2012, 2, 401–404. [Google Scholar] [CrossRef] [PubMed]
- Keats, J.J.; Craig, D.W.; Liang, W.; Venkata, Y.; Kurdoglu, A.; Aldrich, J.; Auclair, D.; Allen, K.; Harrison, B.; Jewell, S.; et al. Interim Analysis Of The Mmrf Commpass Trial, a Longitudinal Study In Multiple Myeloma Relating Clinical Outcomes To Genomic and Immunophenotypic Profiles. Blood 2013, 122. [Google Scholar] [CrossRef]
- Gyorffy, B.; Lanczky, A.; Eklund, A.C.; Denkert, C.; Budczies, J.; Li, Q.; Szallasi, Z. An online survival analysis tool to rapidly assess the effect of 22,277 genes on breast cancer prognosis using microarray data of 1809 patients. Breast Cancer Res. Treat. 2010, 123, 725–731. [Google Scholar] [CrossRef]
- Liu, J.; Lichtenberg, T.; Hoadley, K.A.; Poisson, L.M.; Lazar, A.J.; Cherniack, A.D.; Kovatich, A.J.; Benz, C.C.; Levine, D.A.; Lee, A.V.; et al. An Integrated TCGA Pan-Cancer Clinical Data Resource to Drive High-Quality Survival Outcome Analytics. Cell 2018, 173, 400–416.e11. [Google Scholar] [CrossRef] [PubMed]
- Dempster, J.M.; Rossen, J.; Kazachkova, M.; Pan, J.; Kugener, G.; Root, D.E.; Tsherniak, A. Extracting Biological Insights from the Project Achilles Genome-Scale CRISPR Screens in Cancer Cell Lines. bioRxiv 2019, 720243. [Google Scholar] [CrossRef]
- Meyers, R.M.; Bryan, J.G.; McFarland, J.M.; Weir, B.A.; Sizemore, A.E.; Xu, H.; Dharia, N.V.; Montgomery, P.G.; Cowley, G.S.; Pantel, S.; et al. Computational correction of copy number effect improves specificity of CRISPR-Cas9 essentiality screens in cancer cells. Nat. Genet. 2017, 49, 1779–1784. [Google Scholar] [CrossRef]
- Yan, K.S.; Lin, C.Y.; Liao, T.W.; Peng, C.M.; Lee, S.C.; Liu, Y.J.; Chan, W.P.; Chou, R.H. EZH2 in Cancer Progression and Potential Application in Cancer Therapy: A Friend or Foe? Int. J. Mol. Sci. 2017, 18, 1172. [Google Scholar] [CrossRef]
- Bracken, A.P.; Pasini, D.; Capra, M.; Prosperini, E.; Colli, E.; Helin, K. EZH2 is downstream of the pRB-E2F pathway, essential for proliferation and amplified in cancer. EMBO J. 2003, 22, 5323–5335. [Google Scholar] [CrossRef]
- Okosun, J.; Bodor, C.; Wang, J.; Araf, S.; Yang, C.Y.; Pan, C.; Boller, S.; Cittaro, D.; Bozek, M.; Iqbal, S.; et al. Integrated genomic analysis identifies recurrent mutations and evolution patterns driving the initiation and progression of follicular lymphoma. Nat. Genet. 2014, 46, 176–181. [Google Scholar] [CrossRef]
- Saramaki, O.R.; Tammela, T.L.; Martikainen, P.M.; Vessella, R.L.; Visakorpi, T. The gene for polycomb group protein enhancer of zeste homolog 2 (EZH2) is amplified in late-stage prostate cancer. Genes Chromosomes Cancer 2006, 45, 639–645. [Google Scholar] [CrossRef]
- Hersey, P.; Tiffen, J.; Gallagher, S.; Filipp, F. Somatic copy number amplification and activating somatic mutations of EZH2 Y641 drive melanoma by epigenetic remodeling. J. Clin. Oncol. 2015, 33, e22072. [Google Scholar] [CrossRef]
- Martin-Perez, D.; Sanchez, E.; Maestre, L.; Suela, J.; Vargiu, P.; Di Lisio, L.; Martinez, N.; Alves, J.; Piris, M.A.; Sanchez-Beato, M. Deregulated expression of the polycomb-group protein SUZ12 target genes characterizes mantle cell lymphoma. Am. J. Pathol. 2010, 177, 930–942. [Google Scholar] [CrossRef] [PubMed]
- Abida, W.; Cyrta, J.; Heller, G.; Prandi, D.; Armenia, J.; Coleman, I.; Cieslik, M.; Benelli, M.; Robinson, D.; Van Allen, E.M.; et al. Genomic correlates of clinical outcome in advanced prostate cancer. Proc. Natl. Acad. Sci. USA 2019, 116, 11428–11436. [Google Scholar] [CrossRef] [PubMed]
- Grasso, C.S.; Wu, Y.M.; Robinson, D.R.; Cao, X.; Dhanasekaran, S.M.; Khan, A.P.; Quist, M.J.; Jing, X.; Lonigro, R.J.; Brenner, J.C.; et al. The mutational landscape of lethal castration-resistant prostate cancer. Nature 2012, 487, 239–243. [Google Scholar] [CrossRef]
- Morin, R.D.; Johnson, N.A.; Severson, T.M.; Mungall, A.J.; An, J.; Goya, R.; Paul, J.E.; Boyle, M.; Woolcock, B.W.; Kuchenbauer, F.; et al. Somatic mutations altering EZH2 (Tyr641) in follicular and diffuse large B-cell lymphomas of germinal-center origin. Nat. Genet. 2010, 42, 181–185. [Google Scholar] [CrossRef] [PubMed]
- Ryan, R.J.; Nitta, M.; Borger, D.; Zukerberg, L.R.; Ferry, J.A.; Harris, N.L.; Iafrate, A.J.; Bernstein, B.E.; Sohani, A.R.; Le, L.P. EZH2 codon 641 mutations are common in BCL2-rearranged germinal center B cell lymphomas. PLoS ONE 2011, 6, e28585. [Google Scholar] [CrossRef]
- Sneeringer, C.J.; Scott, M.P.; Kuntz, K.W.; Knutson, S.K.; Pollock, R.M.; Richon, V.M.; Copeland, R.A. Coordinated activities of wild-type plus mutant EZH2 drive tumor-associated hypertrimethylation of lysine 27 on histone H3 (H3K27) in human B-cell lymphomas. Proc. Natl. Acad. Sci. USA 2010, 107, 20980–20985. [Google Scholar] [CrossRef]
- Yap, D.B.; Chu, J.; Berg, T.; Schapira, M.; Cheng, S.W.; Moradian, A.; Morin, R.D.; Mungall, A.J.; Meissner, B.; Boyle, M.; et al. Somatic mutations at EZH2 Y641 act dominantly through a mechanism of selectively altered PRC2 catalytic activity, to increase H3K27 trimethylation. Blood 2011, 117, 2451–2459. [Google Scholar] [CrossRef]
- Reddy, A.; Zhang, J.; Davis, N.S.; Moffitt, A.B.; Love, C.L.; Waldrop, A.; Leppa, S.; Pasanen, A.; Meriranta, L.; Karjalainen-Lindsberg, M.L.; et al. Genetic and Functional Drivers of Diffuse Large B Cell Lymphoma. Cell 2017, 171, 481–494.e15. [Google Scholar] [CrossRef]
- Chapuy, B.; Stewart, C.; Dunford, A.J.; Kim, J.; Kamburov, A.; Redd, R.A.; Lawrence, M.S.; Roemer, M.G.M.; Li, A.J.; Ziepert, M.; et al. Molecular subtypes of diffuse large B cell lymphoma are associated with distinct pathogenic mechanisms and outcomes. Nat. Med. 2018, 24, 679–690. [Google Scholar] [CrossRef]
- Morin, R.D.; Mendez-Lago, M.; Mungall, A.J.; Goya, R.; Mungall, K.L.; Corbett, R.D.; Johnson, N.A.; Severson, T.M.; Chiu, R.; Field, M.; et al. Frequent mutation of histone-modifying genes in non-Hodgkin lymphoma. Nature 2011, 476, 298–303. [Google Scholar] [CrossRef]
- Herviou, L.; Kassambara, A.; Boireau, S.; Robert, N.; Requirand, G.; Muller-Tidow, C.; Vincent, L.; Seckinger, A.; Goldschmidt, H.; Cartron, G.; et al. PRC2 targeting is a therapeutic strategy for EZ score defined high-risk multiple myeloma patients and overcome resistance to IMiDs. Clin. Epigenet. 2018, 10, 121. [Google Scholar] [CrossRef]
- Pawlyn, C.; Bright, M.D.; Buros, A.F.; Stein, C.K.; Walters, Z.; Aronson, L.I.; Mirabella, F.; Jones, J.R.; Kaiser, M.F.; Walker, B.A.; et al. Overexpression of EZH2 in multiple myeloma is associated with poor prognosis and dysregulation of cell cycle control. Blood Cancer J. 2017, 7, e549. [Google Scholar] [CrossRef]
- Wagener, N.; Macher-Goeppinger, S.; Pritsch, M.; Husing, J.; Hoppe-Seyler, K.; Schirmacher, P.; Pfitzenmaier, J.; Haferkamp, A.; Hoppe-Seyler, F.; Hohenfellner, M. Enhancer of zeste homolog 2 (EZH2) expression is an independent prognostic factor in renal cell carcinoma. BMC Cancer 2010, 10, 524. [Google Scholar] [CrossRef] [PubMed]
- Eichenauer, T.; Simmendinger, L.; Fraune, C.; Mandelkow, T.; Blessin, N.C.; Kluth, M.; Hube-Magg, C.; Moller, K.; Clauditz, T.; Weidemann, S.; et al. High level of EZH2 expression is linked to high density of CD8-positive T-lymphocytes and an aggressive phenotype in renal cell carcinoma. World J. Urol. 2020. [Google Scholar] [CrossRef] [PubMed]
- Liu, L.; Xu, Z.; Zhong, L.; Wang, H.; Jiang, S.; Long, Q.; Xu, J.; Guo, J. Prognostic value of EZH2 expression and activity in renal cell carcinoma: A prospective study. PLoS ONE 2013, 8, e81484. [Google Scholar] [CrossRef] [PubMed]
- Guo, B.; Tan, X.; Cen, H. EZH2 is a negative prognostic biomarker associated with immunosuppression in hepatocellular carcinoma. PLoS ONE 2020, 15, e0242191. [Google Scholar] [CrossRef] [PubMed]
- Xue, C.; Wang, K.; Jiang, X.; Gu, C.; Yu, G.; Zhong, Y.; Liu, S.; Nie, Y.; Zhou, Y.; Yang, H. The Down-Regulation of SUZ12 Accelerates the Migration and Invasion of Liver Cancer Cells via Activating ERK1/2 Pathway. J. Cancer 2019, 10, 1375–1384. [Google Scholar] [CrossRef]
- Bachmann, I.M.; Halvorsen, O.J.; Collett, K.; Stefansson, I.M.; Straume, O.; Haukaas, S.A.; Salvesen, H.B.; Otte, A.P.; Akslen, L.A. EZH2 expression is associated with high proliferation rate and aggressive tumor subgroups in cutaneous melanoma and cancers of the endometrium, prostate, and breast. J. Clin. Oncol. Off. J. Am. Soc. Clin. Oncol. 2006, 24, 268–273. [Google Scholar] [CrossRef]
- Varambally, S.; Dhanasekaran, S.M.; Zhou, M.; Barrette, T.R.; Kumar-Sinha, C.; Sanda, M.G.; Ghosh, D.; Pienta, K.J.; Sewalt, R.G.; Otte, A.P.; et al. The polycomb group protein EZH2 is involved in progression of prostate cancer. Nature 2002, 419, 624–629. [Google Scholar] [CrossRef]
- Crea, F.; Hurt, E.M.; Mathews, L.A.; Cabarcas, S.M.; Sun, L.; Marquez, V.E.; Danesi, R.; Farrar, W.L. Pharmacologic disruption of Polycomb Repressive Complex 2 inhibits tumorigenicity and tumor progression in prostate cancer. Mol. Cancer 2011, 10, 40. [Google Scholar] [CrossRef]
- Cho, Y.J.; Kim, S.H.; Kim, E.K.; Han, J.W.; Shin, K.H.; Hu, H.; Kim, K.S.; Choi, Y.D.; Kim, S.; Lee, Y.H.; et al. Prognostic implications of polycomb proteins ezh2, suz12, and eed1 and histone modification by H3K27me3 in sarcoma. BMC Cancer 2018, 18, 158. [Google Scholar] [CrossRef]
- Yalcinkaya, U.; Ugras, N.; Ozgun, G.; Ocakoglu, G.; Deligonul, A.; Cetintas, S.K.; Bilgen, M.S. Enhancer of zeste homologue 2 (EZH2) expression in synovial sarcomas as a promising indicator of prognosis. Bosn. J. Basic Med Sci. 2017, 17, 302–308. [Google Scholar] [CrossRef][Green Version]
- Cao, W.; Ribeiro Rde, O.; Liu, D.; Saintigny, P.; Xia, R.; Xue, Y.; Lin, R.; Mao, L.; Ren, H. EZH2 promotes malignant behaviors via cell cycle dysregulation and its mRNA level associates with prognosis of patient with non-small cell lung cancer. PLoS ONE 2012, 7, e52984. [Google Scholar] [CrossRef]
- Kikuchi, J.; Kinoshita, I.; Shimizu, Y.; Kikuchi, E.; Konishi, J.; Oizumi, S.; Kaga, K.; Matsuno, Y.; Nishimura, M.; Dosaka-Akita, H. Distinctive expression of the polycomb group proteins Bmi1 polycomb ring finger oncogene and enhancer of zeste homolog 2 in nonsmall cell lung cancers and their clinical and clinicopathologic significance. Cancer 2010, 116, 3015–3024. [Google Scholar] [CrossRef]
- Liu, H.; Li, W.; Yu, X.; Gao, F.; Duan, Z.; Ma, X.; Tan, S.; Yuan, Y.; Liu, L.; Wang, J.; et al. EZH2-mediated Puma gene repression regulates non-small cell lung cancer cell proliferation and cisplatin-induced apoptosis. Oncotarget 2016, 7, 56338–56354. [Google Scholar] [CrossRef]
- Takawa, M.; Masuda, K.; Kunizaki, M.; Daigo, Y.; Takagi, K.; Iwai, Y.; Cho, H.S.; Toyokawa, G.; Yamane, Y.; Maejima, K.; et al. Validation of the histone methyltransferase EZH2 as a therapeutic target for various types of human cancer and as a prognostic marker. Cancer Sci. 2011, 102, 1298–1305. [Google Scholar] [CrossRef]
- Kleer, C.G.; Cao, Q.; Varambally, S.; Shen, R.; Ota, I.; Tomlins, S.A.; Ghosh, D.; Sewalt, R.G.; Otte, A.P.; Hayes, D.F.; et al. EZH2 is a marker of aggressive breast cancer and promotes neoplastic transformation of breast epithelial cells. Proc. Natl. Acad. Sci. USA 2003, 100, 11606–11611. [Google Scholar] [CrossRef] [PubMed]
- Pietersen, A.M.; Horlings, H.M.; Hauptmann, M.; Langerod, A.; Ajouaou, A.; Cornelissen-Steijger, P.; Wessels, L.F.; Jonkers, J.; van de Vijver, M.J.; van Lohuizen, M. EZH2 and BMI1 inversely correlate with prognosis and TP53 mutation in breast cancer. Breast Cancer Res. 2008, 10, R109. [Google Scholar] [CrossRef] [PubMed]
- Puppe, J.; Drost, R.; Liu, X.; Joosse, S.A.; Evers, B.; Cornelissen-Steijger, P.; Nederlof, P.; Yu, Q.; Jonkers, J.; van Lohuizen, M.; et al. BRCA1-deficient mammary tumor cells are dependent on EZH2 expression and sensitive to Polycomb Repressive Complex 2-inhibitor 3-deazaneplanocin A. Breast Cancer Res. 2009, 11, R63. [Google Scholar] [CrossRef] [PubMed]
- Li, H.; Cai, Q.; Wu, H.; Vathipadiekal, V.; Dobbin, Z.C.; Li, T.; Hua, X.; Landen, C.N.; Birrer, M.J.; Sanchez-Beato, M.; et al. SUZ12 promotes human epithelial ovarian cancer by suppressing apoptosis via silencing HRK. Mol. Cancer Res. 2012, 10, 1462–1472. [Google Scholar] [CrossRef] [PubMed]
- He, L.J.; Cai, M.Y.; Xu, G.L.; Li, J.J.; Weng, Z.J.; Xu, D.Z.; Luo, G.Y.; Zhu, S.L.; Xie, D. Prognostic significance of overexpression of EZH2 and H3k27me3 proteins in gastric cancer. Asian Pac. J. Cancer Prev. 2012, 13, 3173–3178. [Google Scholar] [CrossRef] [PubMed]
- Pan, Y.M.; Wang, C.G.; Zhu, M.; Xing, R.; Cui, J.T.; Li, W.M.; Yu, D.D.; Wang, S.B.; Zhu, W.; Ye, Y.J.; et al. STAT3 signaling drives EZH2 transcriptional activation and mediates poor prognosis in gastric cancer. Mol. Cancer 2016, 15, 79. [Google Scholar] [CrossRef] [PubMed]
- Xia, R.; Jin, F.Y.; Lu, K.; Wan, L.; Xie, M.; Xu, T.P.; De, W.; Wang, Z.X. SUZ12 promotes gastric cancer cell proliferation and metastasis by regulating KLF2 and E-cadherin. Tumour Biol. J. Int. Soc. Oncodev. Biol. Med. 2015, 36, 5341–5351. [Google Scholar] [CrossRef] [PubMed]
- Chang, J.W.; Gwak, S.Y.; Shim, G.A.; Liu, L.; Lim, Y.C.; Kim, J.M.; Jung, M.G.; Koo, B.S. EZH2 is associated with poor prognosis in head-and-neck squamous cell carcinoma via regulating the epithelial-to-mesenchymal transition and chemosensitivity. Oral Oncol. 2016, 52, 66–74. [Google Scholar] [CrossRef]
- Wu, Y.; Hu, H.; Zhang, W.; Li, Z.; Diao, P.; Wang, D.; Zhang, W.; Wang, Y.; Yang, J.; Cheng, J. SUZ12 is a novel putative oncogene promoting tumorigenesis in head and neck squamous cell carcinoma. J. Cell. Mol. Med. 2018, 22, 3582–3594. [Google Scholar] [CrossRef]
- Masudo, K.; Suganuma, N.; Nakayama, H.; Oshima, T.; Rino, Y.; Iwasaki, H.; Matsuzu, K.; Sugino, K.; Ito, K.; Kondo, T.; et al. EZH2 Overexpression as a Useful Prognostic Marker for Aggressive Behaviour in Thyroid Cancer. In Vivo 2018, 32, 25–31. [Google Scholar] [CrossRef]
- Lee, S.R.; Roh, Y.G.; Kim, S.K.; Lee, J.S.; Seol, S.Y.; Lee, H.H.; Kim, W.T.; Kim, W.J.; Heo, J.; Cha, H.J.; et al. Activation of EZH2 and SUZ12 Regulated by E2F1 Predicts the Disease Progression and Aggressive Characteristics of Bladder Cancer. Clin. Cancer Res. Off. J. Am. Assoc. Cancer Res. 2015, 21, 5391–5403. [Google Scholar] [CrossRef]
- Abudurexiti, M.; Xie, H.; Jia, Z.; Zhu, Y.; Zhu, Y.; Shi, G.; Zhang, H.; Dai, B.; Wan, F.; Shen, Y.; et al. Development and External Validation of a Novel 12-Gene Signature for Prediction of Overall Survival in Muscle-Invasive Bladder Cancer. Front. Oncol. 2019, 9, 856. [Google Scholar] [CrossRef]
- Margueron, R.; Li, G.; Sarma, K.; Blais, A.; Zavadil, J.; Woodcock, C.L.; Dynlacht, B.D.; Reinberg, D. Ezh1 and Ezh2 maintain repressive chromatin through different mechanisms. Mol. Cell 2008, 32, 503–518. [Google Scholar] [CrossRef] [PubMed]
- Ezhkova, E.; Lien, W.H.; Stokes, N.; Pasolli, H.A.; Silva, J.M.; Fuchs, E. EZH1 and EZH2 cogovern histone H3K27 trimethylation and are essential for hair follicle homeostasis and wound repair. Genes Dev. 2011, 25, 485–498. [Google Scholar] [CrossRef]
- Shen, X.; Liu, Y.; Hsu, Y.J.; Fujiwara, Y.; Kim, J.; Mao, X.; Yuan, G.C.; Orkin, S.H. EZH1 mediates methylation on histone H3 lysine 27 and complements EZH2 in maintaining stem cell identity and executing pluripotency. Mol. Cell 2008, 32, 491–502. [Google Scholar] [CrossRef]
- Son, J.; Shen, S.S.; Margueron, R.; Reinberg, D. Nucleosome-binding activities within JARID2 and EZH1 regulate the function of PRC2 on chromatin. Genes Dev. 2013, 27, 2663–2677. [Google Scholar] [CrossRef]
- Wassef, M.; Luscan, A.; Aflaki, S.; Zielinski, D.; Jansen, P.; Baymaz, H.I.; Battistella, A.; Kersouani, C.; Servant, N.; Wallace, M.R.; et al. EZH1/2 function mostly within canonical PRC2 and exhibit proliferation-dependent redundancy that shapes mutational signatures in cancer. Proc. Natl. Acad. Sci. USA 2019, 116, 6075–6080. [Google Scholar] [CrossRef] [PubMed]
- Knutson, S.K.; Wigle, T.J.; Warholic, N.M.; Sneeringer, C.J.; Allain, C.J.; Klaus, C.R.; Sacks, J.D.; Raimondi, A.; Majer, C.R.; Song, J.; et al. A selective inhibitor of EZH2 blocks H3K27 methylation and kills mutant lymphoma cells. Nat. Chem. Biol. 2012, 8, 890–896. [Google Scholar] [CrossRef] [PubMed]
- McCabe, M.T.; Ott, H.M.; Ganji, G.; Korenchuk, S.; Thompson, C.; Van Aller, G.S.; Liu, Y.; Graves, A.P.; Della Pietra, A., 3rd; Diaz, E.; et al. EZH2 inhibition as a therapeutic strategy for lymphoma with EZH2-activating mutations. Nature 2012, 492, 108–112. [Google Scholar] [CrossRef] [PubMed]
- Qi, W.; Chan, H.; Teng, L.; Li, L.; Chuai, S.; Zhang, R.; Zeng, J.; Li, M.; Fan, H.; Lin, Y.; et al. Selective inhibition of Ezh2 by a small molecule inhibitor blocks tumor cells proliferation. Proc. Natl. Acad. Sci. USA 2012, 109, 21360–21365. [Google Scholar] [CrossRef] [PubMed]
- Brach, D.; Johnston-Blackwell, D.; Drew, A.; Lingaraj, T.; Motwani, V.; Warholic, N.M.; Feldman, I.; Plescia, C.; Smith, J.J.; Copeland, R.A.; et al. EZH2 Inhibition by Tazemetostat Results in Altered Dependency on B-cell Activation Signaling in DLBCL. Mol. Cancer Ther. 2017, 16, 2586–2597. [Google Scholar] [CrossRef]
- Lohr, J.G.; Stojanov, P.; Lawrence, M.S.; Auclair, D.; Chapuy, B.; Sougnez, C.; Cruz-Gordillo, P.; Knoechel, B.; Asmann, Y.W.; Slager, S.L.; et al. Discovery and prioritization of somatic mutations in diffuse large B-cell lymphoma (DLBCL) by whole-exome sequencing. Proc. Natl. Acad. Sci. USA 2012, 109, 3879–3884. [Google Scholar] [CrossRef]
- Knutson, S.K.; Warholic, N.M.; Wigle, T.J.; Klaus, C.R.; Allain, C.J.; Raimondi, A.; Porter Scott, M.; Chesworth, R.; Moyer, M.P.; Copeland, R.A.; et al. Durable tumor regression in genetically altered malignant rhabdoid tumors by inhibition of methyltransferase EZH2. Proc. Natl. Acad. Sci. USA 2013, 110, 7922–7927. [Google Scholar] [CrossRef]
- Wilson, B.G.; Wang, X.; Shen, X.; McKenna, E.S.; Lemieux, M.E.; Cho, Y.J.; Koellhoffer, E.C.; Pomeroy, S.L.; Orkin, S.H.; Roberts, C.W. Epigenetic antagonism between polycomb and SWI/SNF complexes during oncogenic transformation. Cancer Cell 2010, 18, 316–328. [Google Scholar] [CrossRef]
- Chan-Penebre, E.; Armstrong, K.; Drew, A.; Grassian, A.R.; Feldman, I.; Knutson, S.K.; Kuplast-Barr, K.; Roche, M.; Campbell, J.; Ho, P.; et al. Selective Killing of SMARCA2- and SMARCA4-deficient Small Cell Carcinoma of the Ovary, Hypercalcemic Type Cells by Inhibition of EZH2: In Vitro and In Vivo Preclinical Models. Mol. Cancer Ther. 2017, 16, 850–860. [Google Scholar] [CrossRef] [PubMed]
- Bitler, B.G.; Aird, K.M.; Garipov, A.; Li, H.; Amatangelo, M.; Kossenkov, A.V.; Schultz, D.C.; Liu, Q.; Shih Ie, M.; Conejo-Garcia, J.R.; et al. Synthetic lethality by targeting EZH2 methyltransferase activity in ARID1A-mutated cancers. Nat. Med. 2015, 21, 231–238. [Google Scholar] [CrossRef] [PubMed]
- Caumanns, J.J.; Wisman, G.B.A.; Berns, K.; van der Zee, A.G.J.; de Jong, S. ARID1A mutant ovarian clear cell carcinoma: A clear target for synthetic lethal strategies. Biochim. Et Biophys. Acta. Rev. Cancer 2018, 1870, 176–184. [Google Scholar] [CrossRef] [PubMed]
- Kim, K.H.; Kim, W.; Howard, T.P.; Vazquez, F.; Tsherniak, A.; Wu, J.N.; Wang, W.; Haswell, J.R.; Walensky, L.D.; Hahn, W.C.; et al. SWI/SNF-mutant cancers depend on catalytic and non-catalytic activity of EZH2. Nat. Med. 2015, 21, 1491–1496. [Google Scholar] [CrossRef]
- Schuettengruber, B.; Martinez, A.M.; Iovino, N.; Cavalli, G. Trithorax group proteins: Switching genes on and keeping them active. Nat. Reviews. Mol. Cell Biol. 2011, 12, 799–814. [Google Scholar] [CrossRef]
- Hauri, S.; Comoglio, F.; Seimiya, M.; Gerstung, M.; Glatter, T.; Hansen, K.; Aebersold, R.; Paro, R.; Gstaiger, M.; Beisel, C. A High-Density Map for Navigating the Human Polycomb Complexome. Cell Rep. 2016, 17, 583–595. [Google Scholar] [CrossRef]
- Xi, Q.; He, W.; Zhang, X.H.; Le, H.V.; Massague, J. Genome-wide impact of the BRG1 SWI/SNF chromatin remodeler on the transforming growth factor beta transcriptional program. J. Biol. Chem. 2008, 283, 1146–1155. [Google Scholar] [CrossRef]
- Inoue, Y.; Itoh, Y.; Abe, K.; Okamoto, T.; Daitoku, H.; Fukamizu, A.; Onozaki, K.; Hayashi, H. Smad3 is acetylated by p300/CBP to regulate its transactivation activity. Oncogene 2007, 26, 500–508. [Google Scholar] [CrossRef] [PubMed]
- Oussaief, L.; Hippocrate, A.; Ramirez, V.; Rampanou, A.; Zhang, W.; Meyers, D.; Cole, P.; Khelifa, R.; Joab, I. Phosphatidylinositol 3-kinase/Akt pathway targets acetylation of Smad3 through Smad3/CREB-binding protein interaction: Contribution to transforming growth factor beta1-induced Epstein-Barr virus reactivation. J. Biol. Chem. 2009, 284, 23912–23924. [Google Scholar] [CrossRef]
- Cao, Q.; Wang, X.; Zhao, M.; Yang, R.; Malik, R.; Qiao, Y.; Poliakov, A.; Yocum, A.K.; Li, Y.; Chen, W.; et al. The central role of EED in the orchestration of polycomb group complexes. Nat. Commun. 2014, 5, 3127. [Google Scholar] [CrossRef]
- Luck, K.; Kim, D.K.; Lambourne, L.; Spirohn, K.; Begg, B.E.; Bian, W.; Brignall, R.; Cafarelli, T.; Campos-Laborie, F.J.; Charloteaux, B.; et al. A reference map of the human binary protein interactome. Nature 2020, 580, 402–408. [Google Scholar] [CrossRef]
- Rolland, T.; Tasan, M.; Charloteaux, B.; Pevzner, S.J.; Zhong, Q.; Sahni, N.; Yi, S.; Lemmens, I.; Fontanillo, C.; Mosca, R.; et al. A proteome-scale map of the human interactome network. Cell 2014, 159, 1212–1226. [Google Scholar] [CrossRef] [PubMed]
- Huttlin, E.L.; Bruckner, R.J.; Paulo, J.A.; Cannon, J.R.; Ting, L.; Baltier, K.; Colby, G.; Gebreab, F.; Gygi, M.P.; Parzen, H.; et al. Architecture of the human interactome defines protein communities and disease networks. Nature 2017, 545, 505–509. [Google Scholar] [CrossRef] [PubMed]
- Kim, T.Y.; Siesser, P.F.; Rossman, K.L.; Goldfarb, D.; Mackinnon, K.; Yan, F.; Yi, X.; MacCoss, M.J.; Moon, R.T.; Der, C.J.; et al. Substrate trapping proteomics reveals targets of the betaTrCP2/FBXW11 ubiquitin ligase. Mol. Cell. Biol. 2015, 35, 167–181. [Google Scholar] [CrossRef] [PubMed]
- Sasaki, M.; Ogiwara, H. Synthetic lethal therapy based on targeting the vulnerability of SWI/SNF chromatin remodeling complex-deficient cancers. Cancer Sci. 2020, 111, 774–782. [Google Scholar] [CrossRef]
- Lunning, M.A.; Green, M.R. Mutation of chromatin modifiers; an emerging hallmark of germinal center B-cell lymphomas. Blood Cancer J. 2015, 5, e361. [Google Scholar] [CrossRef] [PubMed]
- Caganova, M.; Carrisi, C.; Varano, G.; Mainoldi, F.; Zanardi, F.; Germain, P.L.; George, L.; Alberghini, F.; Ferrarini, L.; Talukder, A.K.; et al. Germinal center dysregulation by histone methyltransferase EZH2 promotes lymphomagenesis. J. Clin. Investig. 2013, 123, 5009–5022. [Google Scholar] [CrossRef] [PubMed]
- Zhang, J.; Dominguez-Sola, D.; Hussein, S.; Lee, J.E.; Holmes, A.B.; Bansal, M.; Vlasevska, S.; Mo, T.; Tang, H.; Basso, K.; et al. Disruption of KMT2D perturbs germinal center B cell development and promotes lymphomagenesis. Nat. Med. 2015, 21, 1190–1198. [Google Scholar] [CrossRef]
- Vire, E.; Brenner, C.; Deplus, R.; Blanchon, L.; Fraga, M.; Didelot, C.; Morey, L.; Van Eynde, A.; Bernard, D.; Vanderwinden, J.M.; et al. The Polycomb group protein EZH2 directly controls DNA methylation. Nature 2006, 439, 871–874. [Google Scholar] [CrossRef]
- Scholze, H.; Stephenson, R.E.; Reynolds, R.; Shah, S.; Puri, R.; Butler, S.D.; Trujillo-Alonso, V.; Teater, M.R.; van Besien, H.; Gibbs-Curtis, D.; et al. Combined EZH2 and Bcl-2 inhibitors as precision therapy for genetically defined DLBCL subtypes. Blood Adv. 2020, 4, 5226–5231. [Google Scholar] [CrossRef]
- Li, D.; Sun, H.; Sun, W.J.; Bao, H.B.; Si, S.H.; Fan, J.L.; Lin, P.; Cui, R.J.; Pan, Y.J.; Wen, S.M.; et al. Role of RbBP5 and H3K4me3 in the vicinity of Snail transcription start site during epithelial-mesenchymal transition in prostate cancer cell. Oncotarget 2016, 7, 65553–65567. [Google Scholar] [CrossRef] [PubMed]
- Ernst, T.; Chase, A.J.; Score, J.; Hidalgo-Curtis, C.E.; Bryant, C.; Jones, A.V.; Waghorn, K.; Zoi, K.; Ross, F.M.; Reiter, A.; et al. Inactivating mutations of the histone methyltransferase gene EZH2 in myeloid disorders. Nat. Genet. 2010, 42, 722–726. [Google Scholar] [CrossRef]
- Nikoloski, G.; Langemeijer, S.M.; Kuiper, R.P.; Knops, R.; Massop, M.; Tonnissen, E.R.; van der Heijden, A.; Scheele, T.N.; Vandenberghe, P.; de Witte, T.; et al. Somatic mutations of the histone methyltransferase gene EZH2 in myelodysplastic syndromes. Nat. Genet. 2010, 42, 665–667. [Google Scholar] [CrossRef]
- Stasik, S.; Middeke, J.M.; Kramer, M.; Rollig, C.; Kramer, A.; Scholl, S.; Hochhaus, A.; Crysandt, M.; Brummendorf, T.H.; Naumann, R.; et al. EZH2 mutations and impact on clinical outcome: An analysis in 1,604 patients with newly diagnosed acute myeloid leukemia. Haematologica 2020, 105, e228–e231. [Google Scholar] [CrossRef] [PubMed]
- Guglielmelli, P.; Biamonte, F.; Score, J.; Hidalgo-Curtis, C.; Cervantes, F.; Maffioli, M.; Fanelli, T.; Ernst, T.; Winkelman, N.; Jones, A.V.; et al. EZH2 mutational status predicts poor survival in myelofibrosis. Blood 2011, 118, 5227–5234. [Google Scholar] [CrossRef] [PubMed]
- Ntziachristos, P.; Tsirigos, A.; Van Vlierberghe, P.; Nedjic, J.; Trimarchi, T.; Flaherty, M.S.; Ferres-Marco, D.; da Ros, V.; Tang, Z.; Siegle, J.; et al. Genetic inactivation of the polycomb repressive complex 2 in T cell acute lymphoblastic leukemia. Nat. Med. 2012, 18, 298–301. [Google Scholar] [CrossRef]
- Simon, C.; Chagraoui, J.; Krosl, J.; Gendron, P.; Wilhelm, B.; Lemieux, S.; Boucher, G.; Chagnon, P.; Drouin, S.; Lambert, R.; et al. A key role for EZH2 and associated genes in mouse and human adult T-cell acute leukemia. Genes Dev. 2012, 26, 651–656. [Google Scholar] [CrossRef]
- Herrera-Merchan, A.; Arranz, L.; Ligos, J.M.; de Molina, A.; Dominguez, O.; Gonzalez, S. Ectopic expression of the histone methyltransferase Ezh2 in haematopoietic stem cells causes myeloproliferative disease. Nat. Commun. 2012, 3, 623. [Google Scholar] [CrossRef]
- Mochizuki-Kashio, M.; Mishima, Y.; Miyagi, S.; Negishi, M.; Saraya, A.; Konuma, T.; Shinga, J.; Koseki, H.; Iwama, A. Dependency on the polycomb gene Ezh2 distinguishes fetal from adult hematopoietic stem cells. Blood 2011, 118, 6553–6561. [Google Scholar] [CrossRef] [PubMed]
- Xie, H.; Xu, J.; Hsu, J.H.; Nguyen, M.; Fujiwara, Y.; Peng, C.; Orkin, S.H. Polycomb repressive complex 2 regulates normal hematopoietic stem cell function in a developmental-stage-specific manner. Cell Stem Cell 2014, 14, 68–80. [Google Scholar] [CrossRef]
- Ezponda, T.; Dupere-Richer, D.; Will, C.M.; Small, E.C.; Varghese, N.; Patel, T.; Nabet, B.; Popovic, R.; Oyer, J.; Bulic, M.; et al. UTX/KDM6A Loss Enhances the Malignant Phenotype of Multiple Myeloma and Sensitizes Cells to EZH2 inhibition. Cell Rep. 2017, 21, 628–640. [Google Scholar] [CrossRef]
- Good-Jacobson, K.L. Regulation of germinal center, B-cell memory, and plasma cell formation by histone modifiers. Front. Immunol. 2014, 5, 596. [Google Scholar] [CrossRef] [PubMed]
- Su, I.H.; Basavaraj, A.; Krutchinsky, A.N.; Hobert, O.; Ullrich, A.; Chait, B.T.; Tarakhovsky, A. Ezh2 controls B cell development through histone H3 methylation and Igh rearrangement. Nat. Immunol. 2003, 4, 124–131. [Google Scholar] [CrossRef]
- Zhang, J.; Ying, Y.; Li, M.; Wang, M.; Huang, X.; Jia, M.; Zeng, J.; Ma, C.; Zhang, Y.; Li, C.; et al. Targeted inhibition of KDM6 histone demethylases eradicates tumor-initiating cells via enhancer reprogramming in colorectal cancer. Theranostics 2020, 10, 10016–10030. [Google Scholar] [CrossRef]
- De Raedt, T.; Beert, E.; Pasmant, E.; Luscan, A.; Brems, H.; Ortonne, N.; Helin, K.; Hornick, J.L.; Mautner, V.; Kehrer-Sawatzki, H.; et al. PRC2 loss amplifies Ras-driven transcription and confers sensitivity to BRD4-based therapies. Nature 2014, 514, 247–251. [Google Scholar] [CrossRef] [PubMed]
- Grosselin, K.; Durand, A.; Marsolier, J.; Poitou, A.; Marangoni, E.; Nemati, F.; Dahmani, A.; Lameiras, S.; Reyal, F.; Frenoy, O.; et al. High-throughput single-cell ChIP-seq identifies heterogeneity of chromatin states in breast cancer. Nat. Genet. 2019, 51, 1060–1066. [Google Scholar] [CrossRef] [PubMed]


Publisher’s Note: MDPI stays neutral with regard to jurisdictional claims in published maps and institutional affiliations. |
© 2021 by the authors. Licensee MDPI, Basel, Switzerland. This article is an open access article distributed under the terms and conditions of the Creative Commons Attribution (CC BY) license (https://creativecommons.org/licenses/by/4.0/).