
Cav1/EREG/YAP Axis in the Treatment Resistance of Cav1-Expressing Head and Neck Squamous Cell Carcinoma

 , , , , , , , and
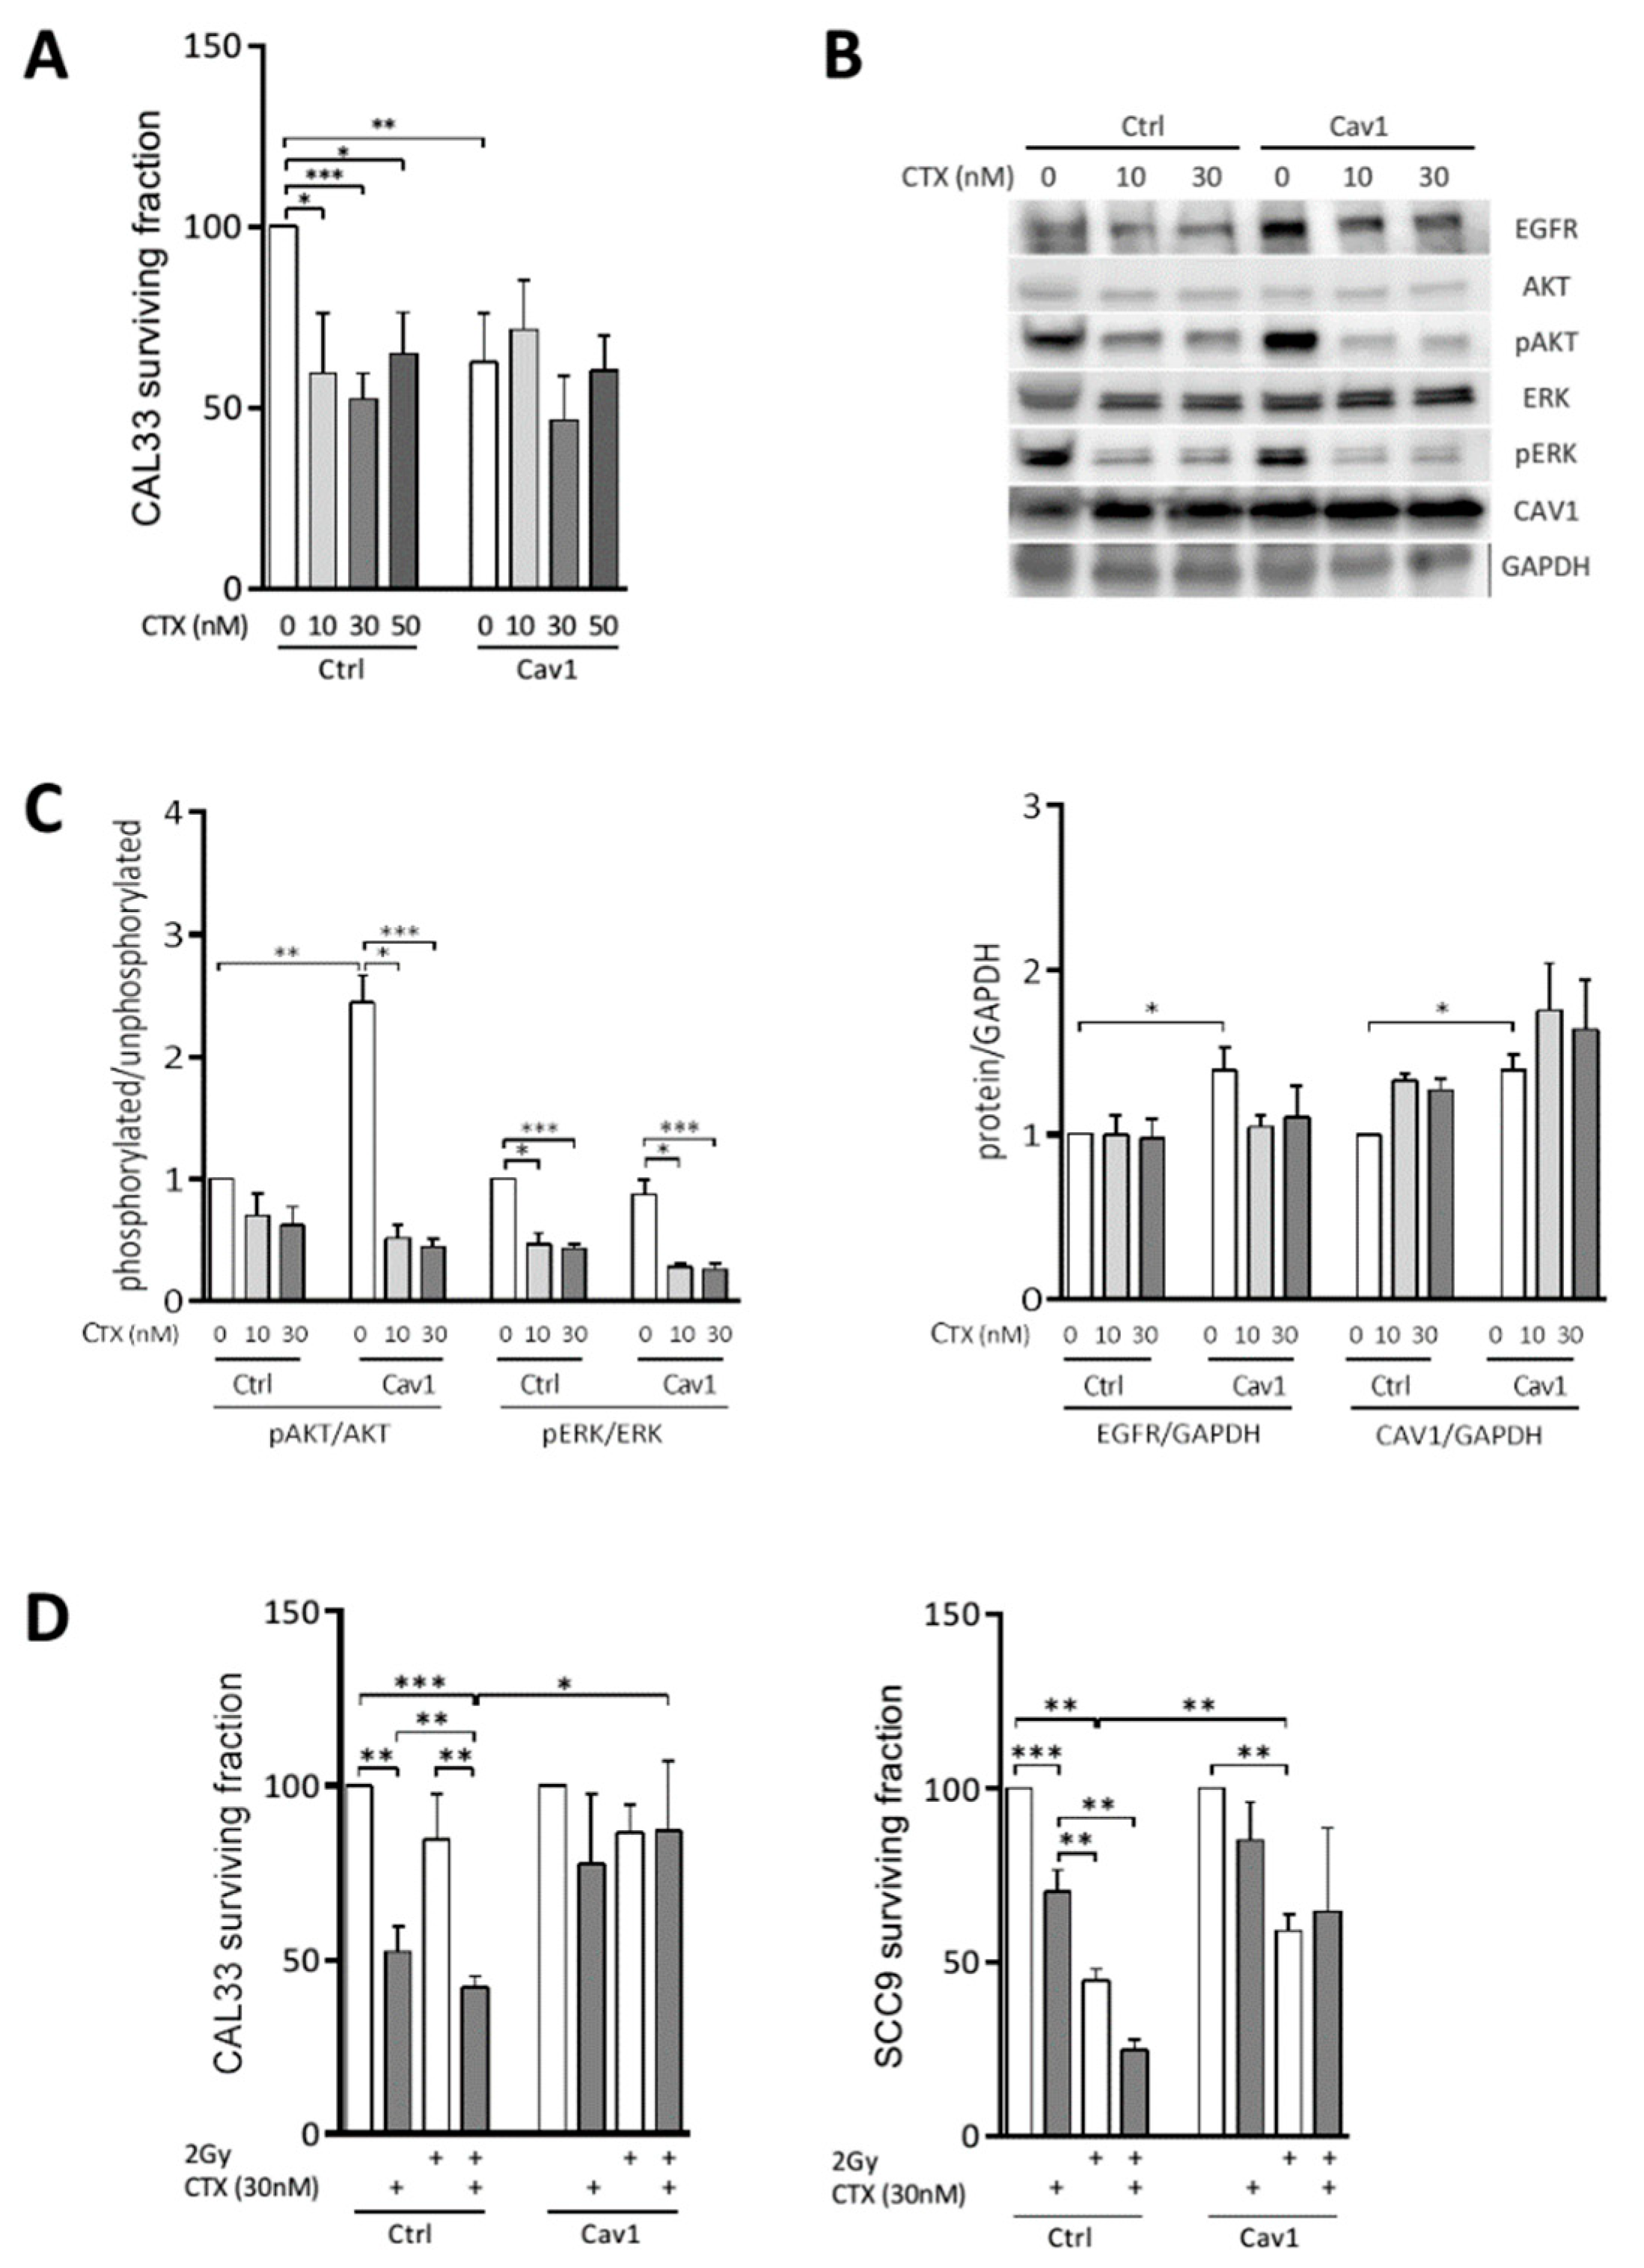
Abstract
Simple Summary
Abstract
1. Introduction
2. Materials and Methods
2.1. Cell Culture, Transfection and Drugs
2.2. Irradiation
2.3. Clonogenic Survival Assay
2.4. IncuCyte® Assay
2.5. Western Blot
2.6. Cell Cycle and Apoptosis Analysis
2.7. Metabolic Assay
2.8. Sphere Evasion Assay
2.9. Human Tissue Samples
2.10. Immunohistochemistry on Human Tissue Samples
2.11. Immunohistochemistry on Cells
2.12. Real-Time Quantitative PCR on Human Tissues Samples
2.13. Real-Time Quantitative PCR on Cells
3. Statistical Analysis
3.1. Descriptive and Univariate Analyses
3.2. Survival Analyses
3.3. Measures Interrater Agreement
4. Results
4.1. Overexpression of Cav1 Enables Cells to Survive Long-Term Exposure to Cetuximab Alone and in Combination with Radiation
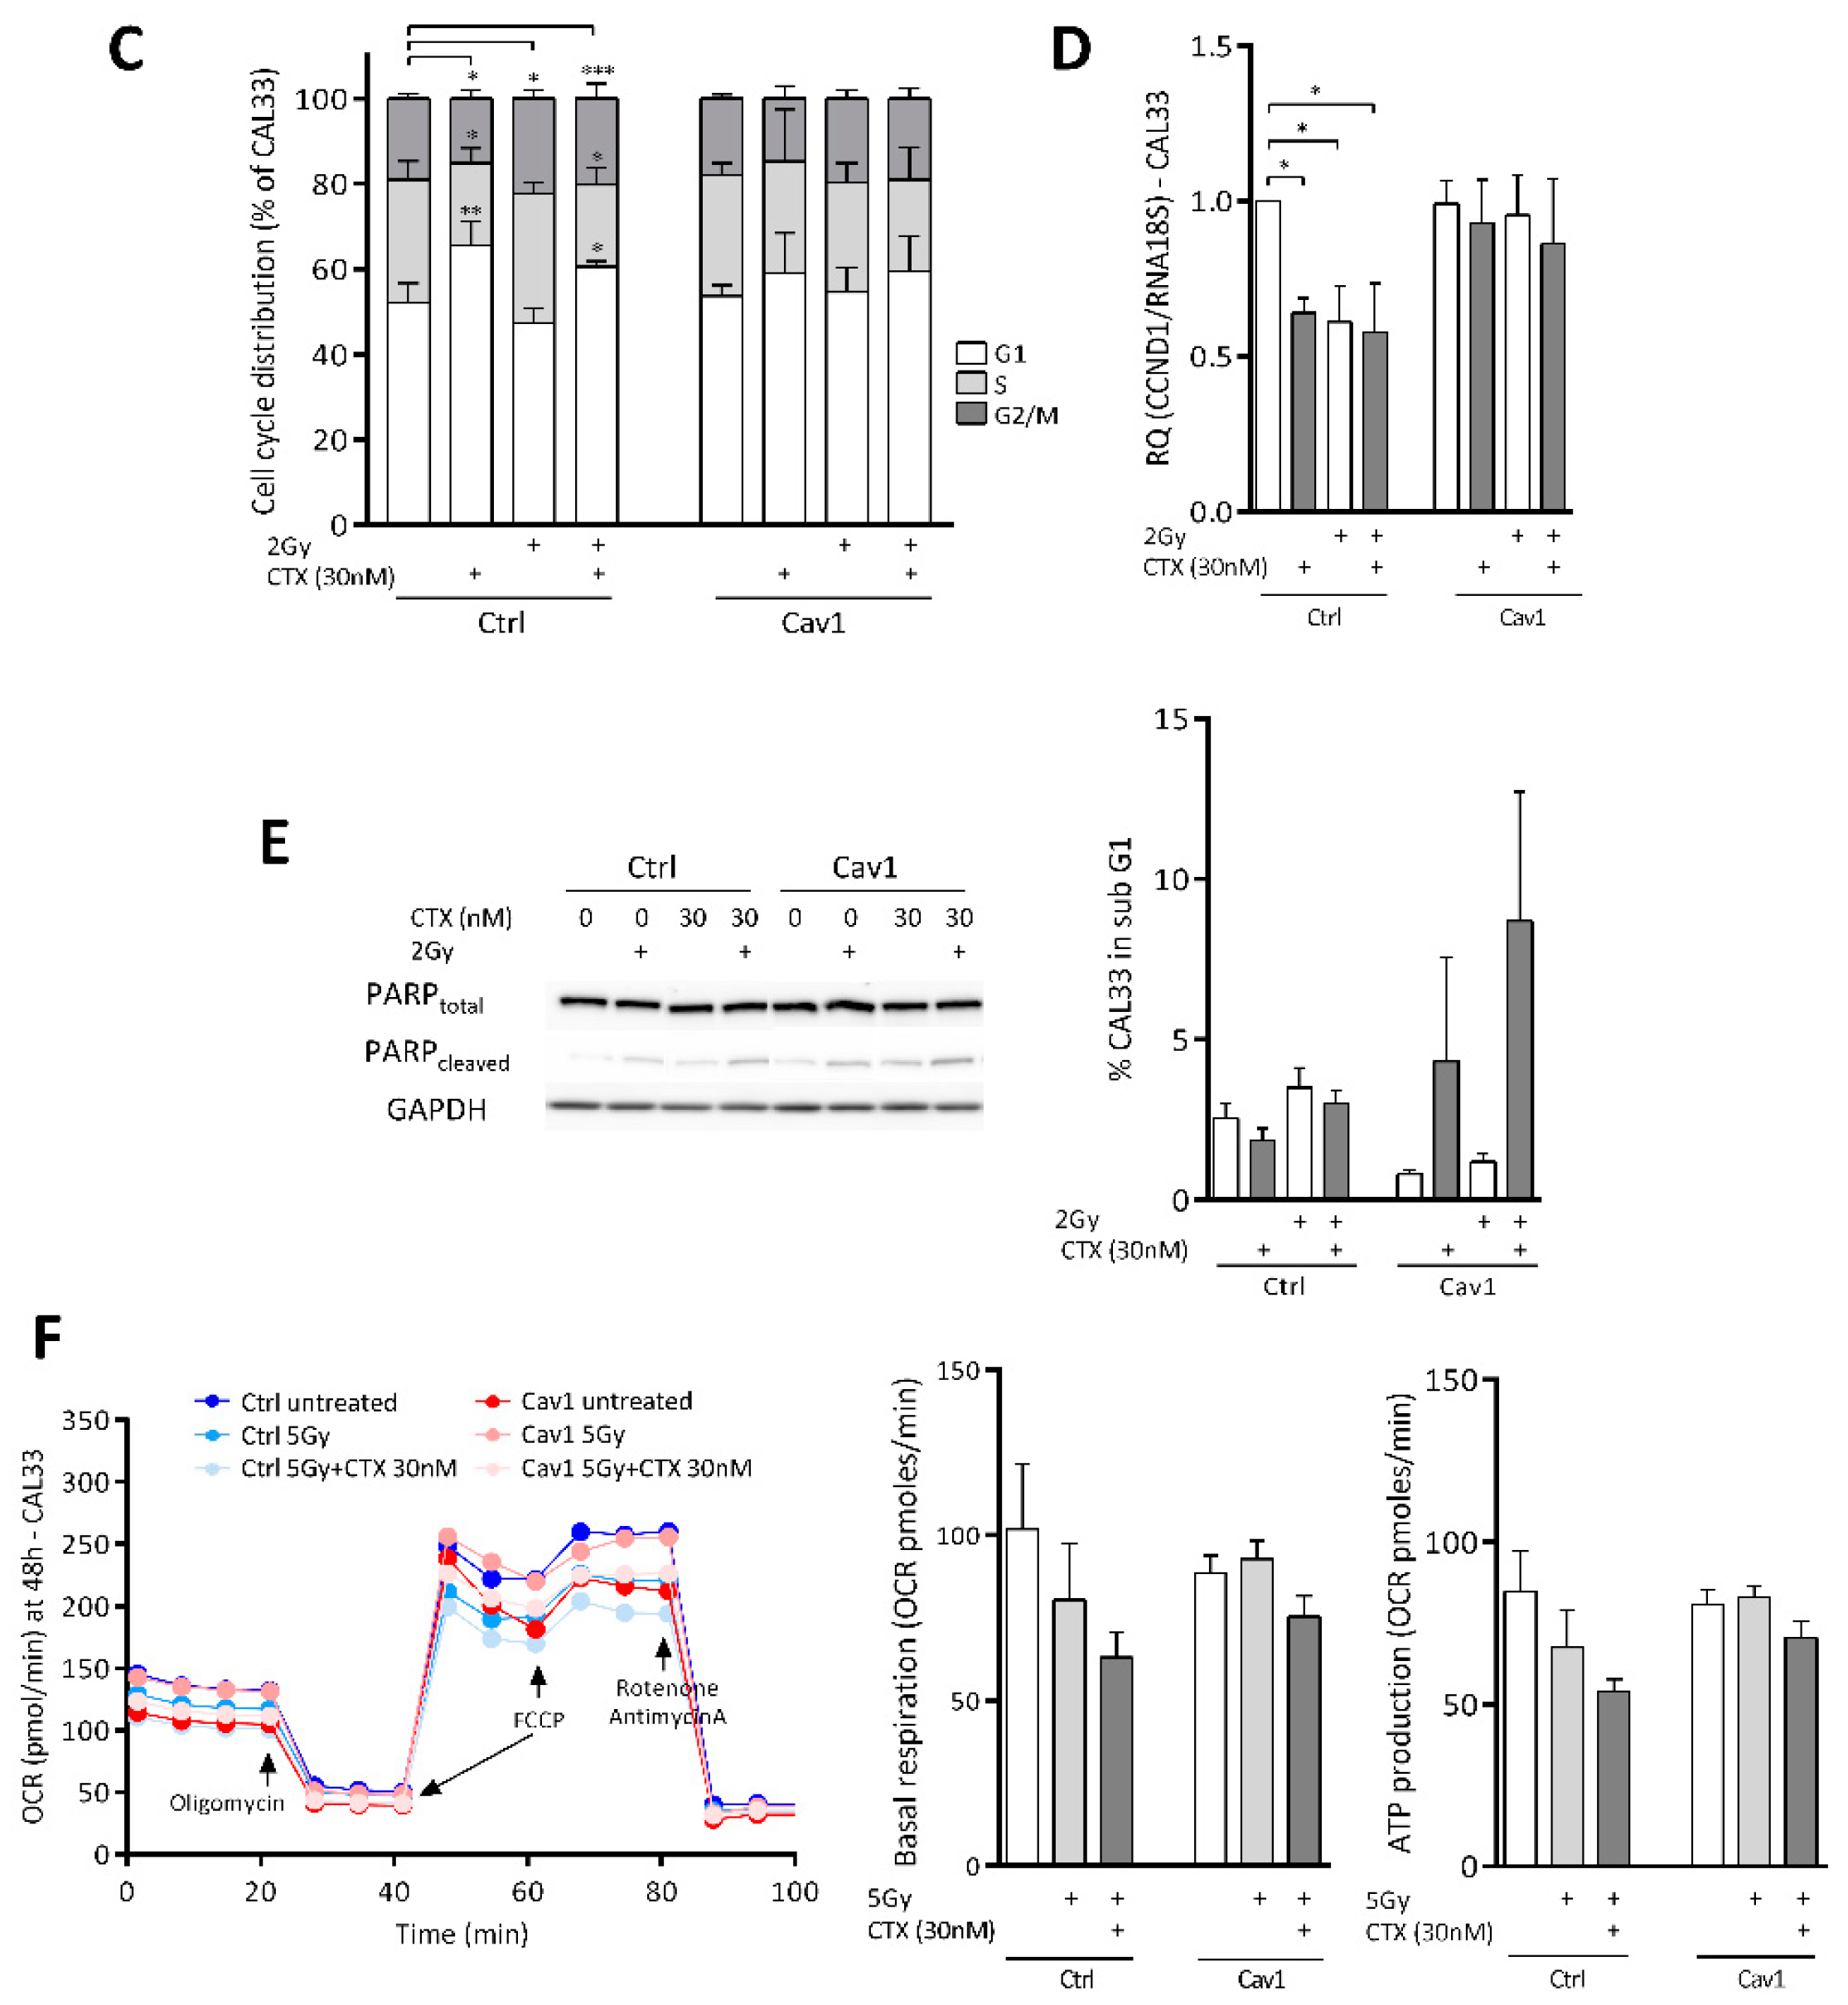
4.2. Overexpression of Cav1 Protects Cells Against the Cytostatic Effect of Cetuximab Alone or Combined with Irradiation
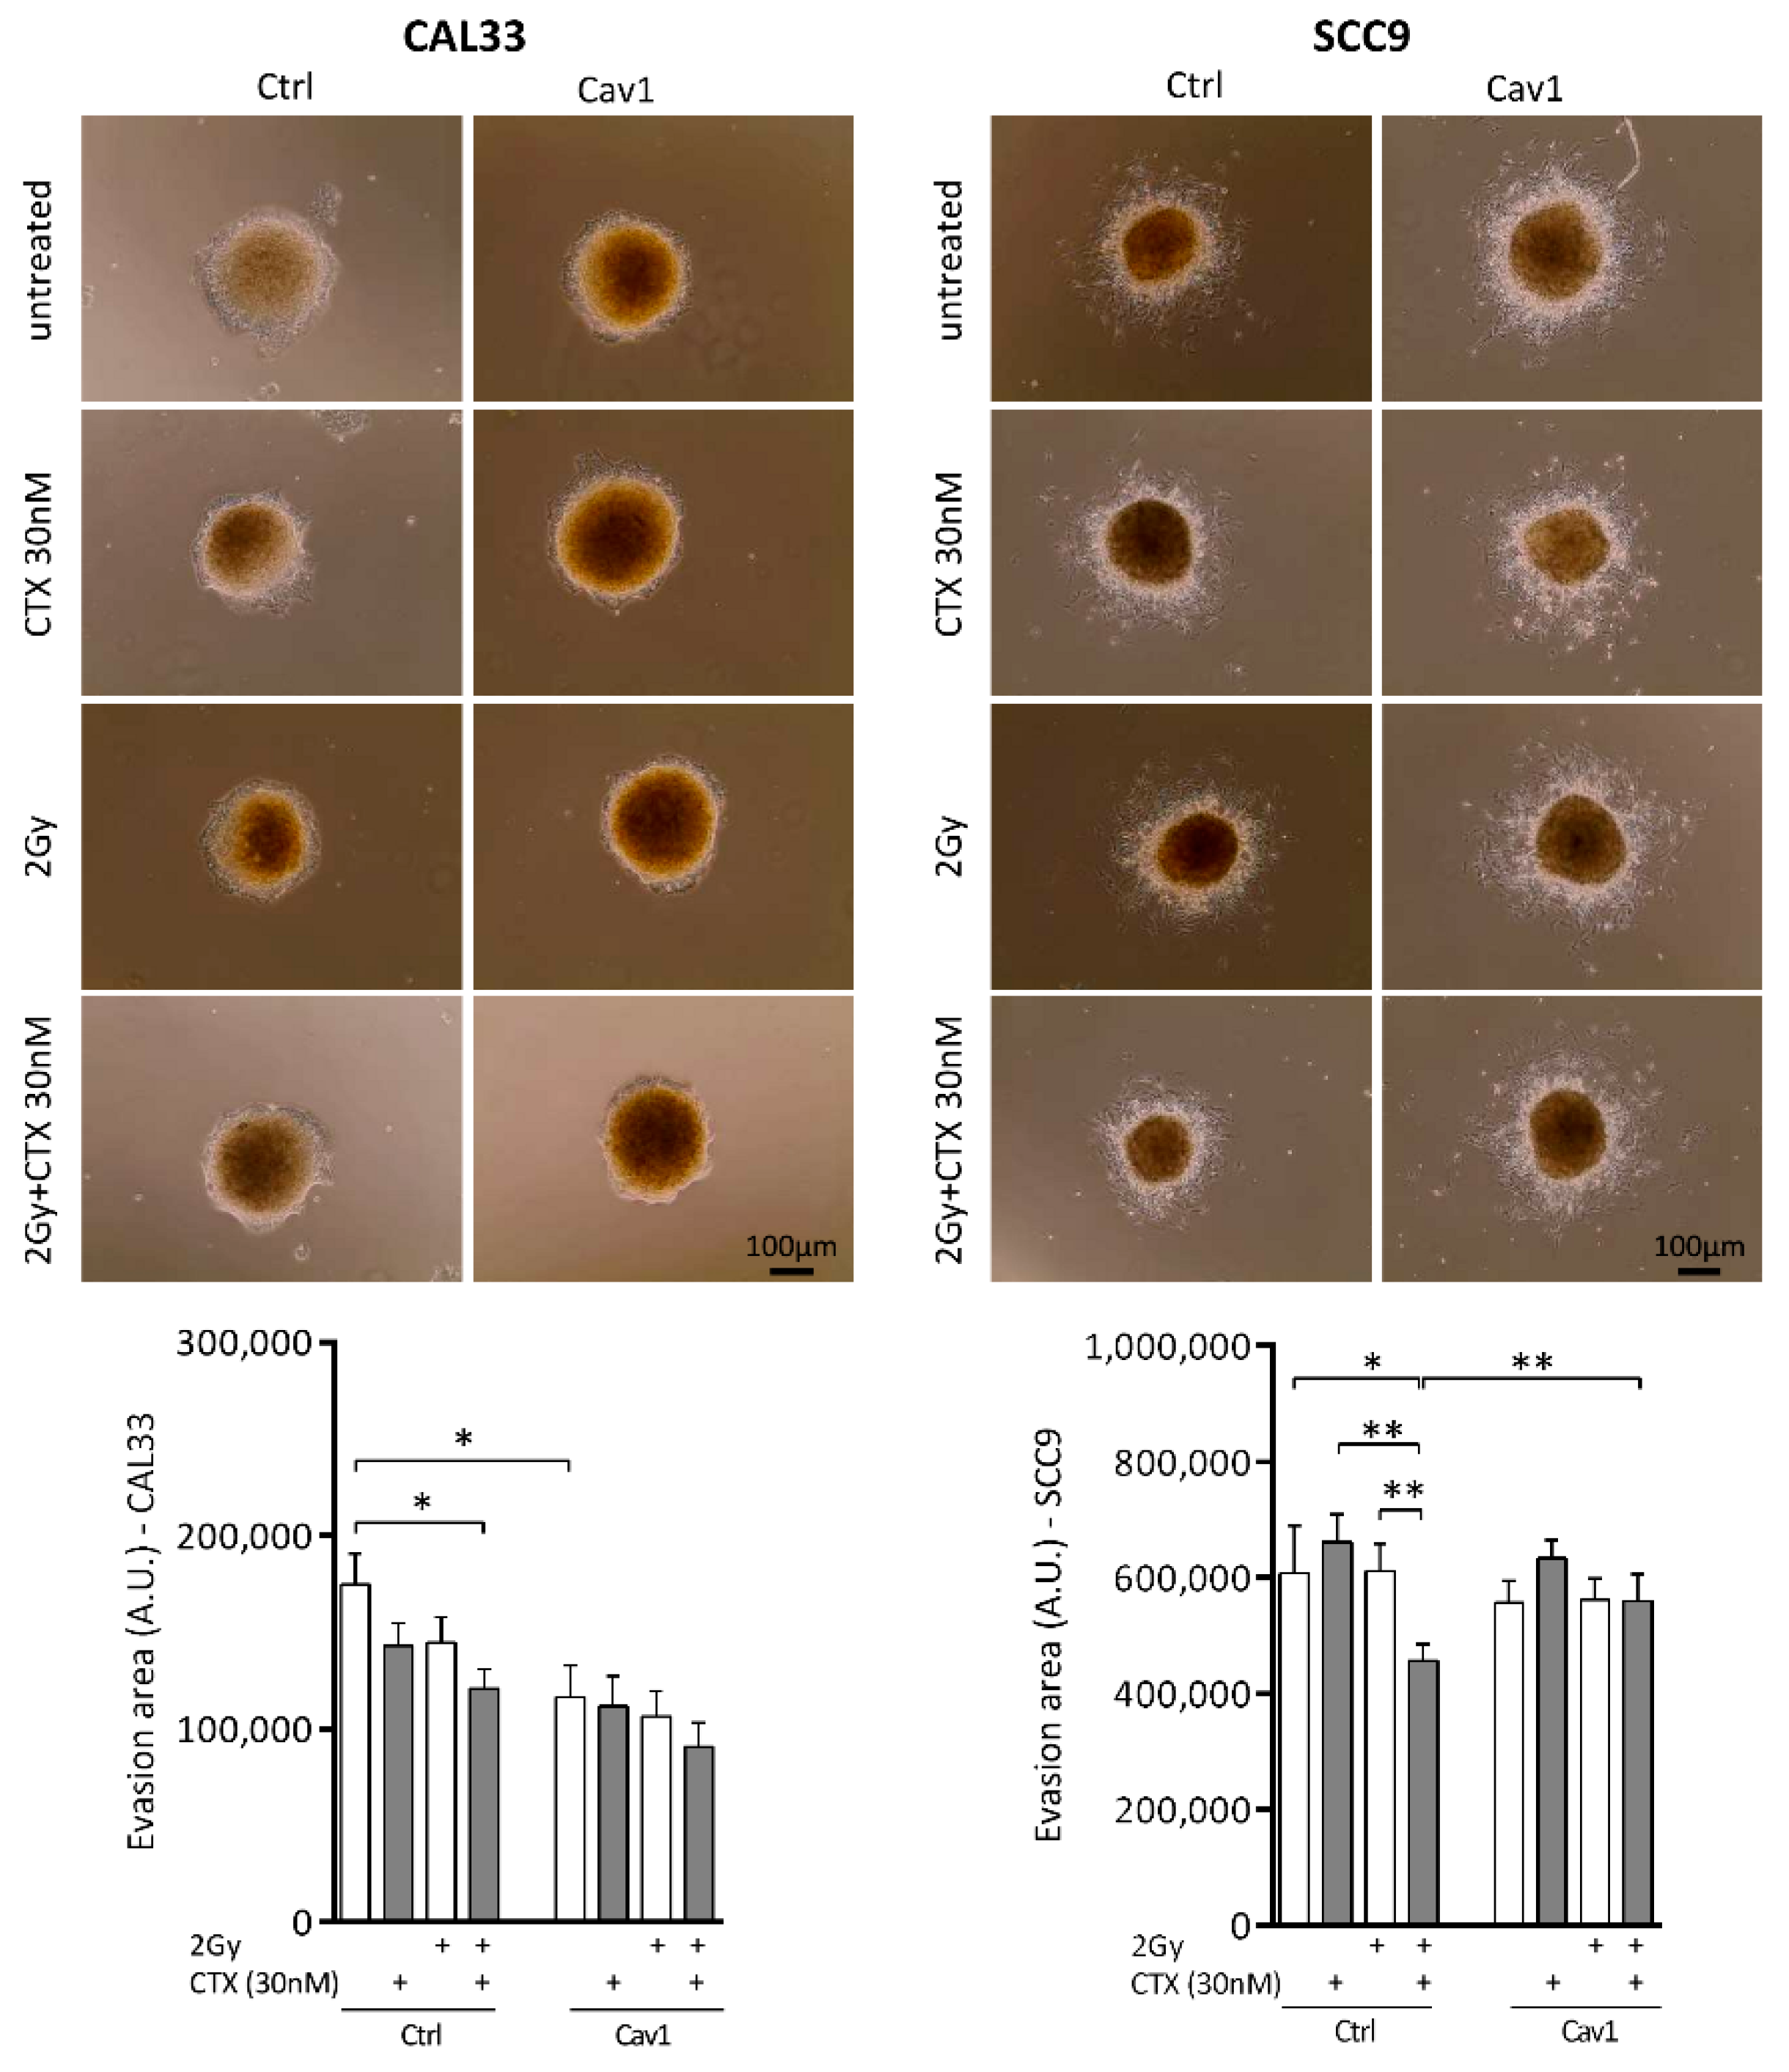
4.3. Overexpression of Cav1 Maintains the Evasive Potency of Cells Exposed to Cetuximab Alone or Combined with Irradiation
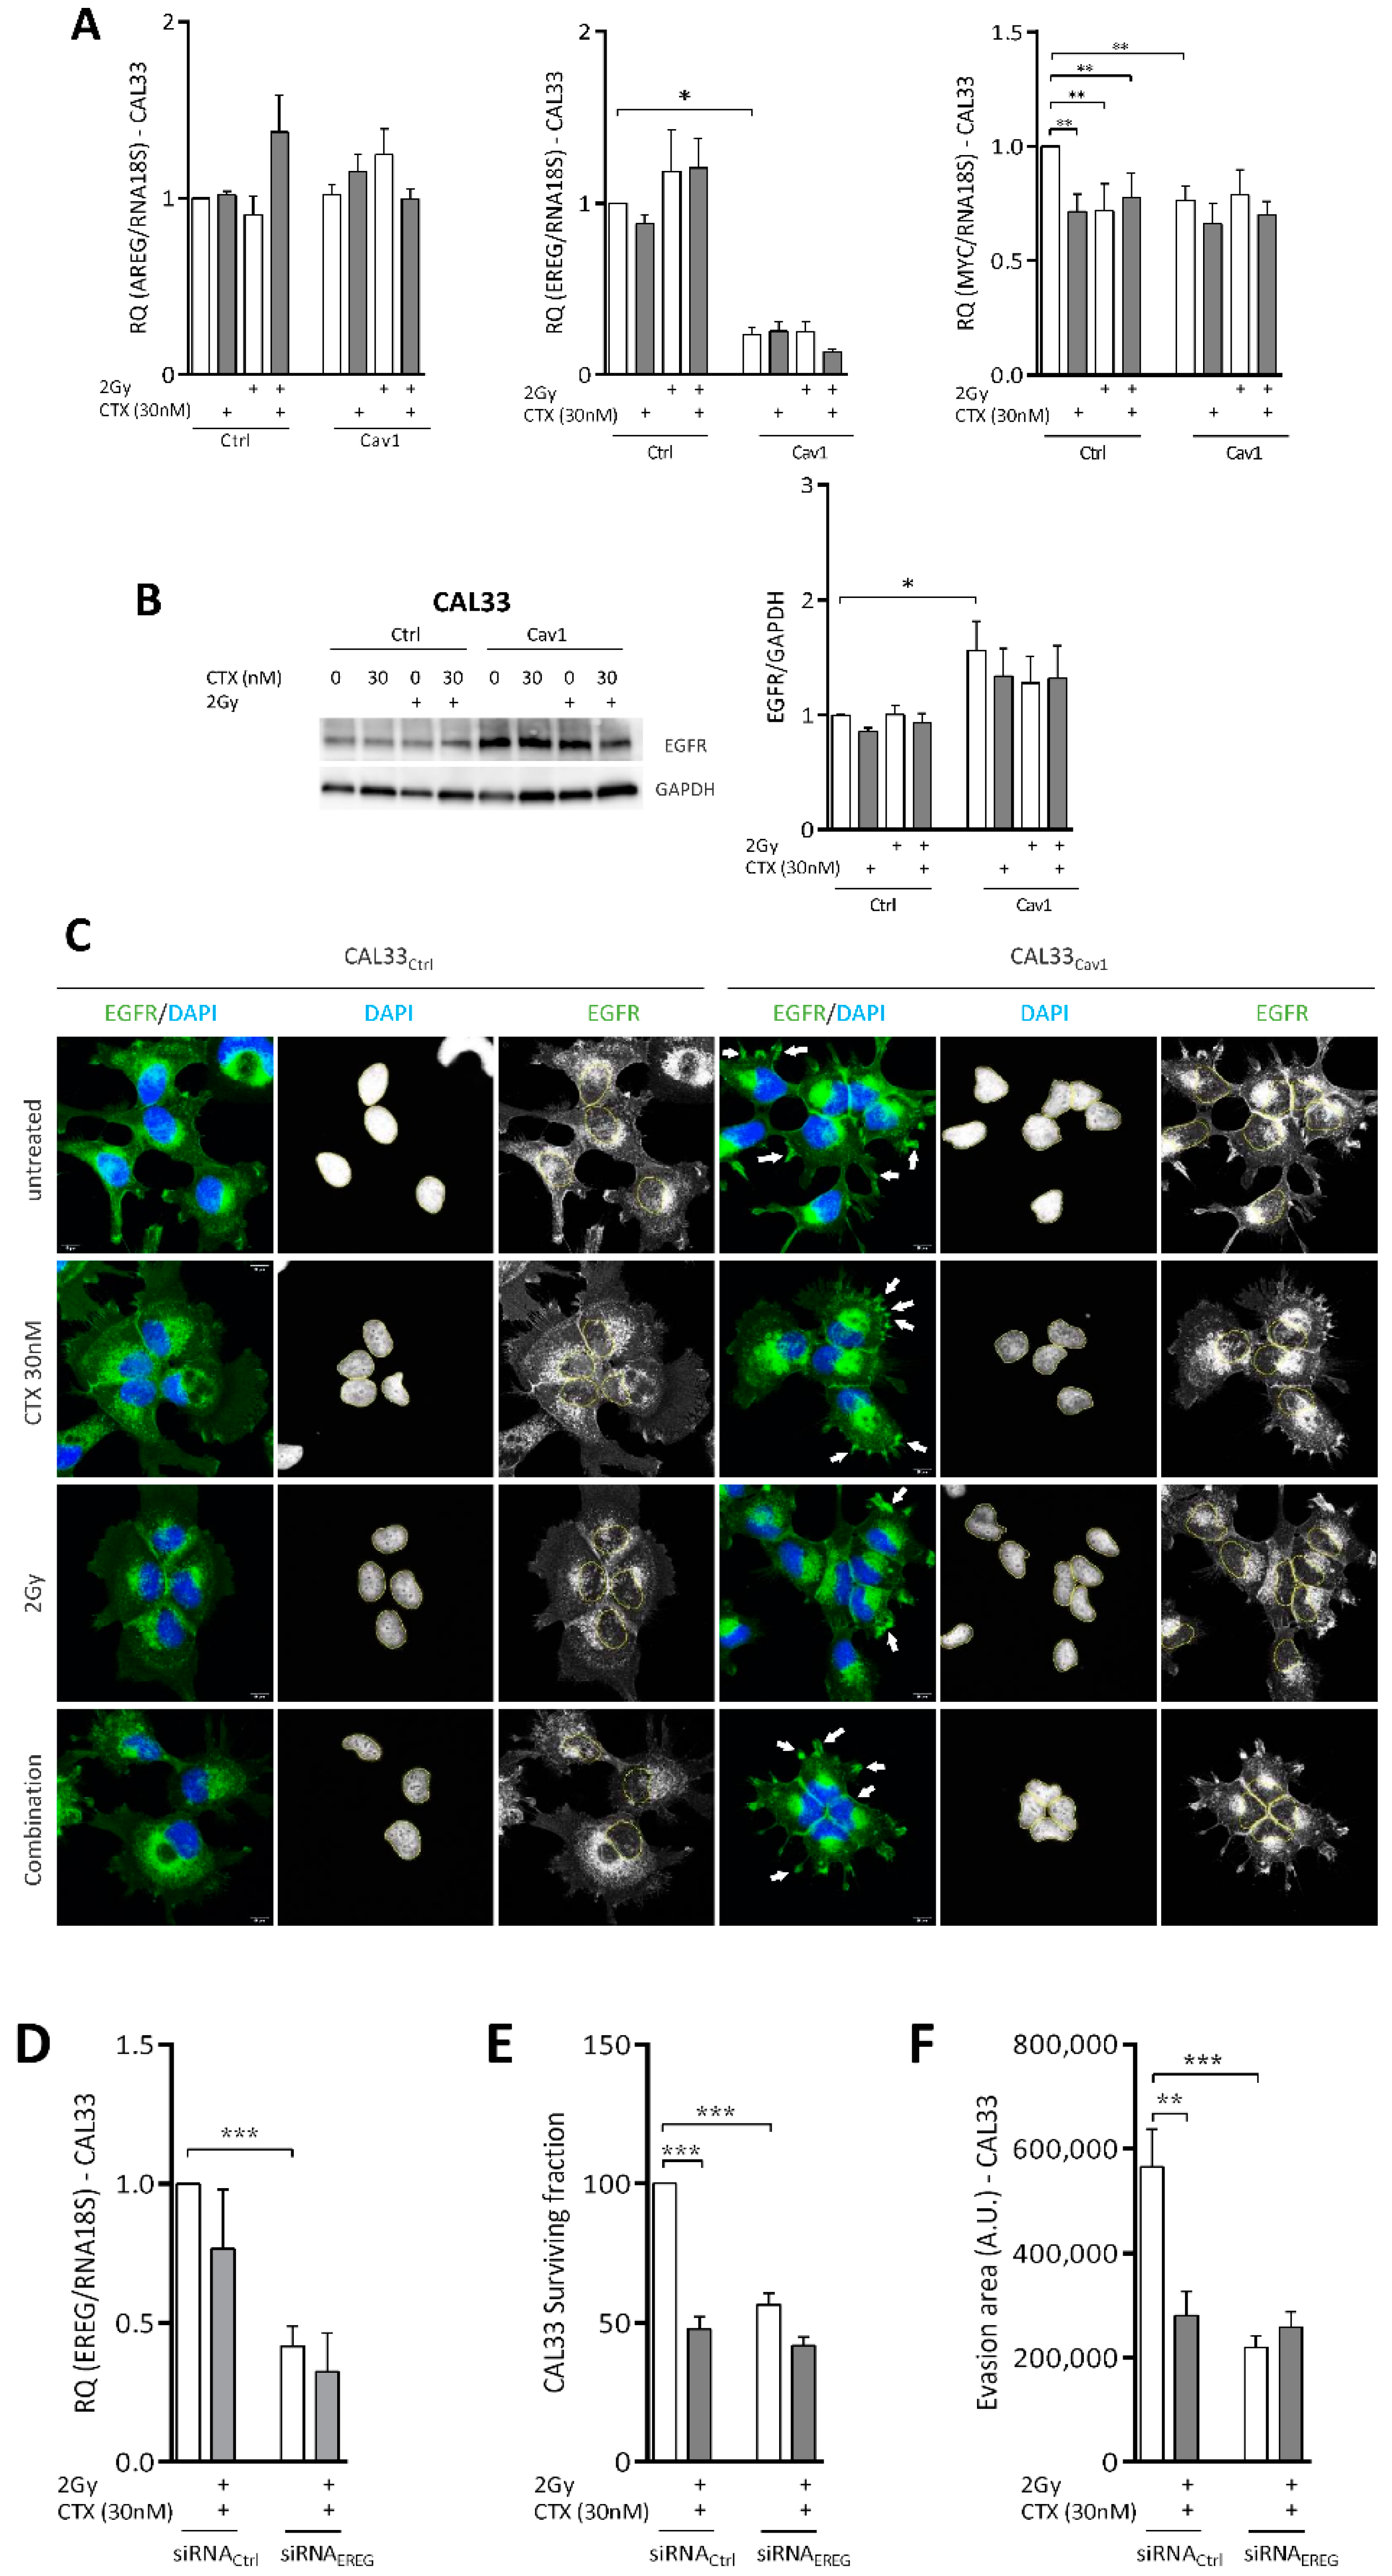
4.4. Overexpression of Cav1 Is Associated with a Decrease in EREG-Driven Oncogenic Addiction
4.5. Repression of EREG by Cav1 Is Associated With the Activation of the Hippo-YAP Pathway
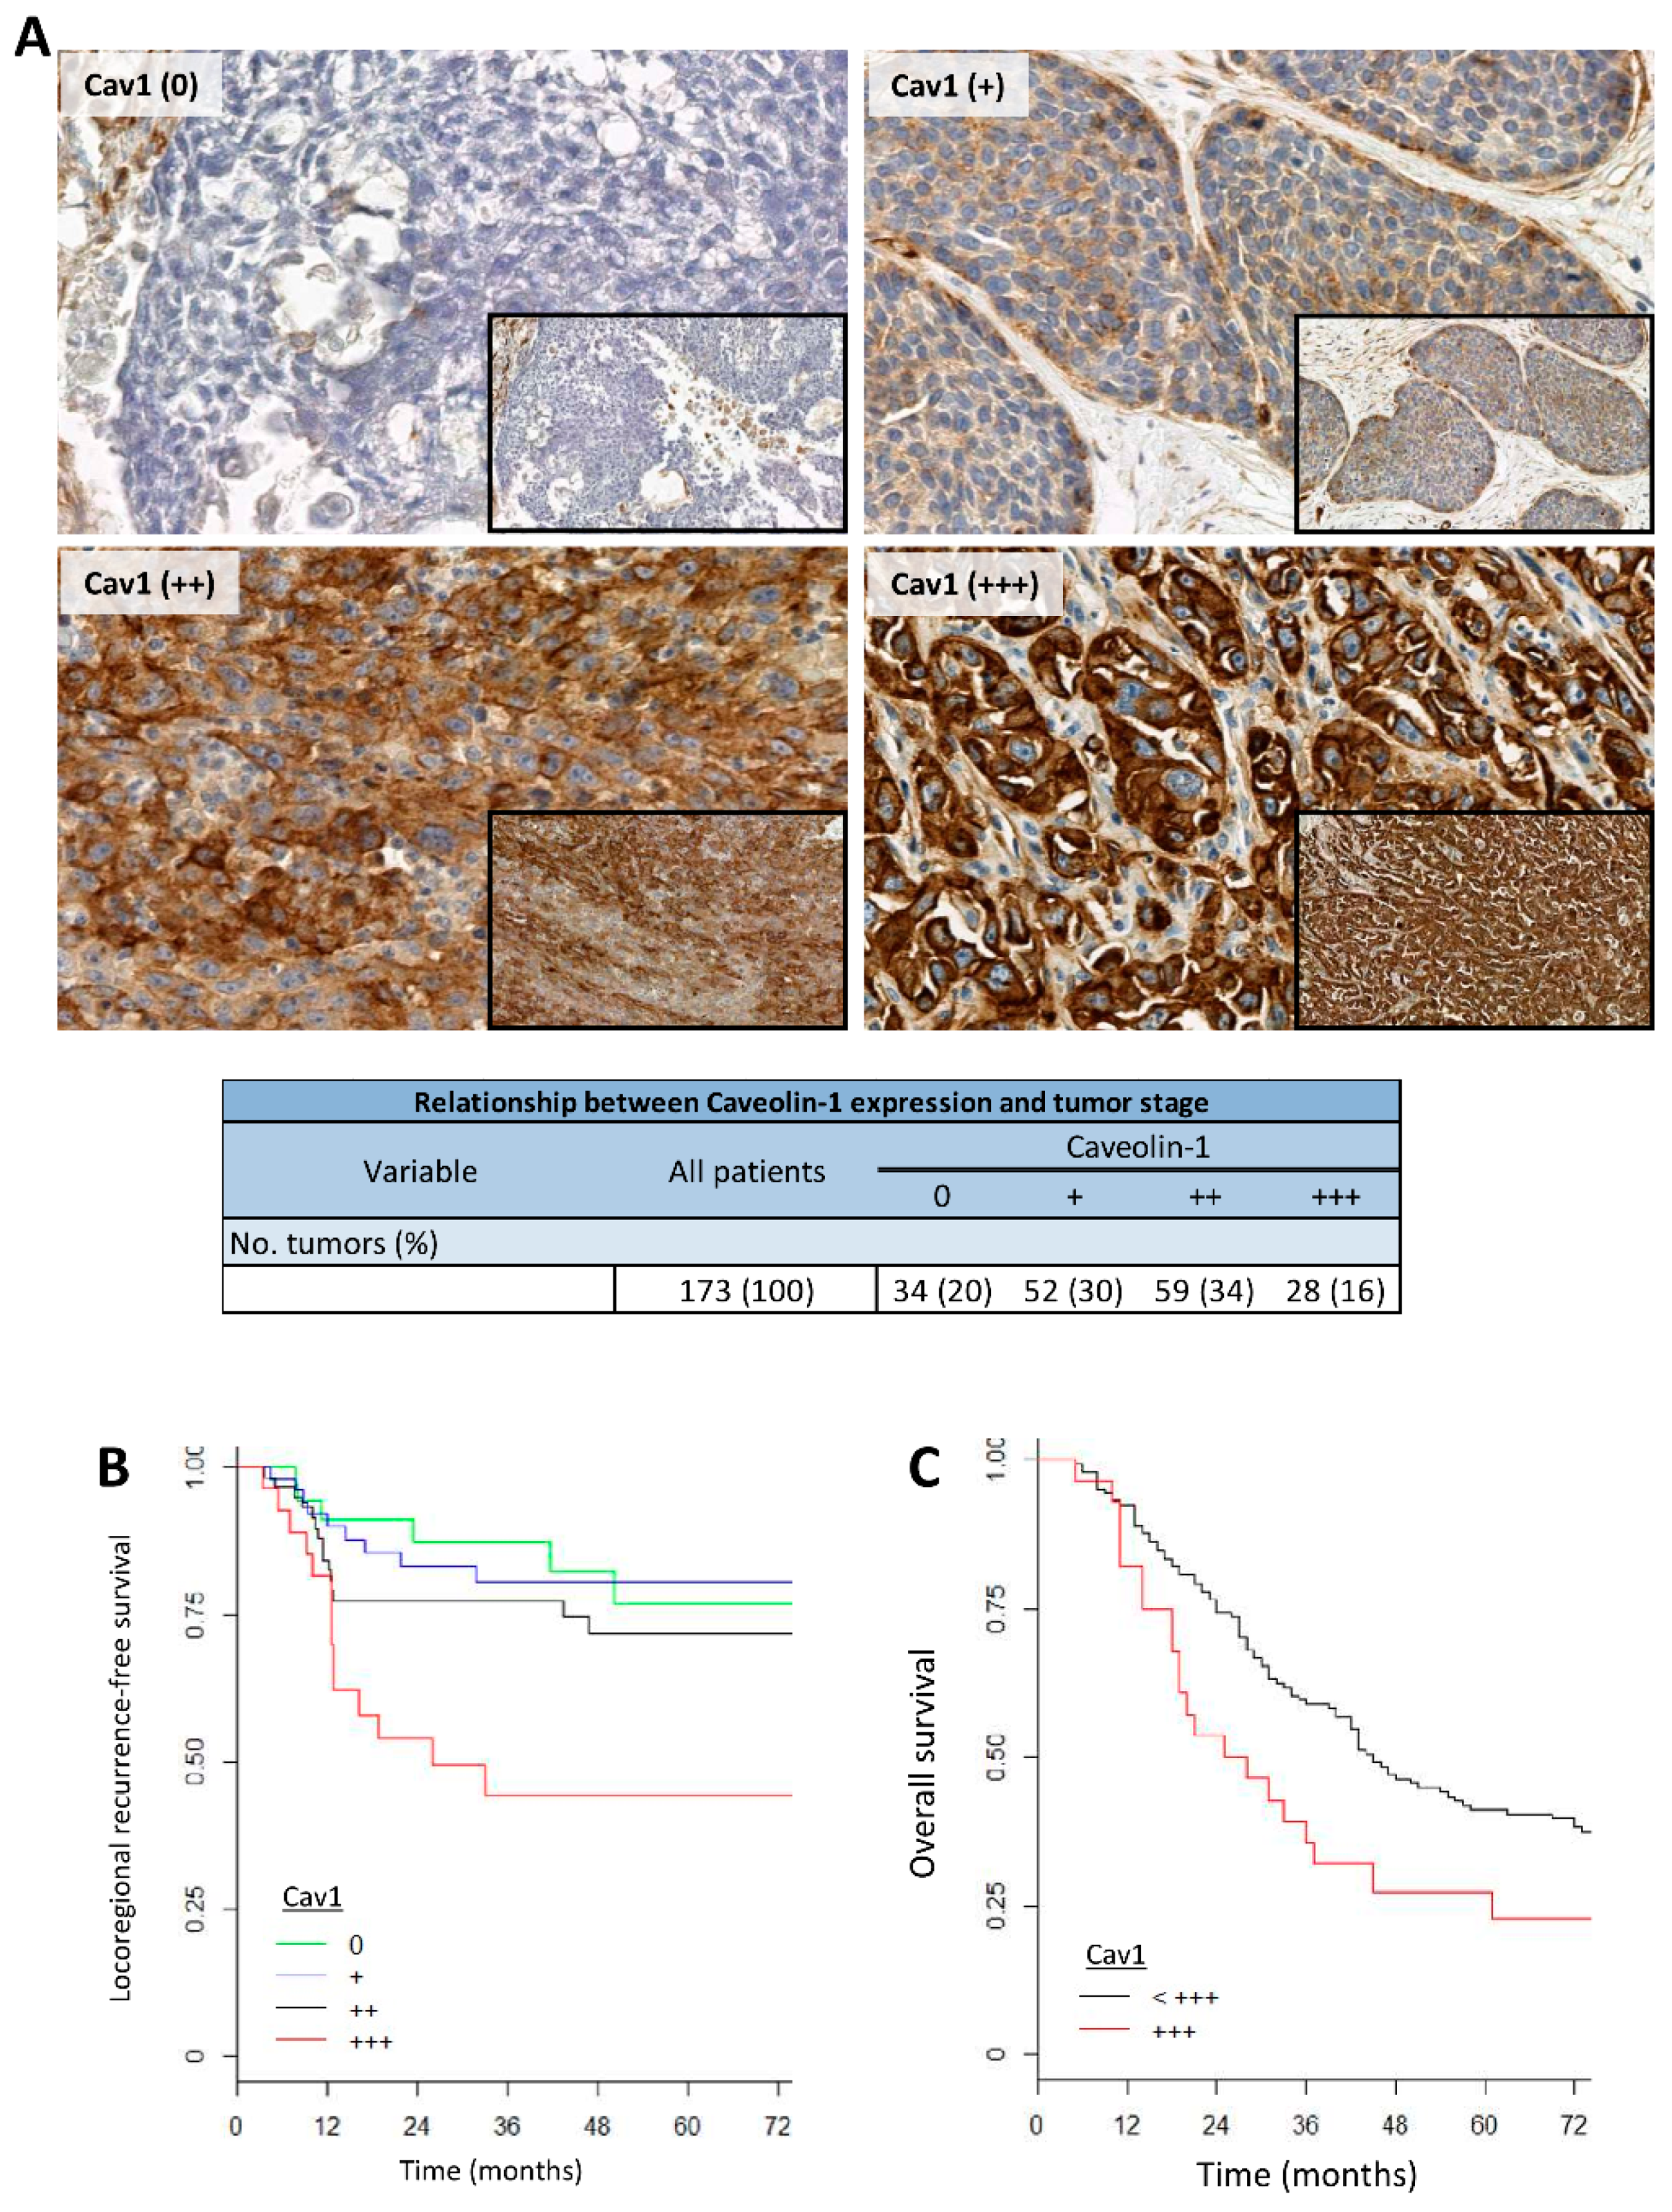
4.6. Tumors Overexpressing Cav1 Give Rise to Locoregional Relapse and Have a Poor Prognosis
5. Discussion
6. Conclusions
Supplementary Materials
Author Contributions
Funding
Institutional Review Board Statement
Informed Consent Statement
Data Availability Statement
Acknowledgments
Conflicts of Interest
References
- Ferlay, J.; Soerjomataram, I.; Dikshit, R.; Eser, S.; Mathers, C.; Rebelo, M.; Parkin, D.M.; Forman, D.; Bray, F. Cancer incidence and mortality worldwide: Sources, methods and major patterns in GLOBOCAN 2012. Int. J. Cancer 2015, 136, E359–E386. [Google Scholar] [CrossRef]
- Brand, T.M.; Iida, M.; Wheeler, D.L. Molecular mechanisms of resistance to the EGFR monoclonal antibody cetuximab. Cancer Biol. Ther. 2011, 11, 777–792. [Google Scholar] [CrossRef]
- Ciardiello, F.; Tortora, G. EGFR antagonists in cancer treatment. N. Engl. J. Med. 2008, 358, 1160–1174. [Google Scholar] [CrossRef]
- Bonner, J.A.; Harari, P.M.; Giralt, J.; Azarnia, N.; Shin, D.M.; Cohen, R.B.; Jones, C.U.; Sur, R.; Raben, D.; Jassem, J.; et al. Radiotherapy plus cetuximab for squamous-cell carcinoma of the head and neck. N. Engl. J. Med. 2006, 354, 567–578. [Google Scholar] [CrossRef] [PubMed]
- Bonner, J.A.; Harari, P.M.; Giralt, J.; Cohen, R.B.; Jones, C.U.; Sur, R.K.; Raben, D.; Baselga, J.; Spencer, S.A.; Zhu, J.; et al. Radiotherapy plus cetuximab for locoregionally advanced head and neck cancer: 5-year survival data from a phase 3 randomised trial, and relation between cetuximab-induced rash and survival. Lancet. Oncol. 2010, 11, 21–28. [Google Scholar] [CrossRef]
- Rabney, A.; Baum, K.; Pitts, D. Cetuximab approved by FDA for treatment of head and neck squamous cell cancer. Cancer Biol. Ther. 2006, 5, 340–342. [Google Scholar]
- Colevas, A.D.; Yom, S.S.; Pfister, D.G.; Spencer, S.; Adelstein, D.; Adkins, D.; Brizel, D.M.; Burtness, B.; Busse, P.M.; Caudell, J.J.; et al. NCCN guidelines insights: Head and neck cancers, version 1.2018. J. Natl. Compr. Cancer Netw. 2018, 16, 479–490. [Google Scholar] [CrossRef]
- Tao, Y.; Auperin, A.; Sire, C.; Martin, L.; Khoury, C.; Maingon, P.; Bardet, E.; Kaminsky, M.C.; Lapeyre, M.; Chatellier, T.; et al. Improved outcome by adding concurrent chemotherapy to cetuximab and radiotherapy for locally advanced head and neck carcinomas: Results of the GORTEC 2007-01 phase III randomized trial. J. Clin. Oncol. 2018, 36, 3084–3090. [Google Scholar] [CrossRef]
- Vermorken, J.B.; Mesia, R.; Rivera, F.; Remenar, E.; Kawecki, A.; Rottey, S.; Erfan, J.; Zabolotnyy, D.; Kienzer, H.R.; Cupissol, D.; et al. Platinum-based chemotherapy plus cetuximab in head and neck cancer. N. Engl. J. Med. 2008, 359, 1116–1127. [Google Scholar] [CrossRef] [PubMed]
- Burtness, B.; Harrington, K.J.; Greil, R.; Soulieres, D.; Tahara, M.; Castro, G.D., Jr.; Psyrri, A.; Baste, N.; Neupane, P.; Bratland, A.; et al. Pembrolizumab alone or with chemotherapy versus cetuximab with chemotherapy for recurrent or metastatic squamous cell carcinoma of the head and neck (KEYNOTE-048): A randomised, open-label, phase 3 study. Lancet 2019, 394, 1915–1928. [Google Scholar] [CrossRef]
- Simon, L.; Campos, A.; Leyton, L.; Quest, A.F.G. Caveolin-1 function at the plasma membrane and in intracellular compartments in cancer. Cancer Metastasis Rev. 2020, 39, 435–453. [Google Scholar] [CrossRef]
- Singh, V.; Lamaze, C. Membrane tension buffering by caveolae: A role in cancer? Cancer Metastasis Rev. 2020, 39, 505–517. [Google Scholar] [CrossRef]
- Jung, A.C.; Ray, A.M.; Ramolu, L.; Macabre, C.; Simon, F.; Noulet, F.; Blandin, A.F.; Renner, G.; Lehmann, M.; Choulier, L.; et al. Caveolin-1-negative head and neck squamous cell carcinoma primary tumors display increased epithelial to mesenchymal transition and prometastatic properties. Oncotarget 2015, 6, 41884–41901. [Google Scholar] [CrossRef] [PubMed]
- Sun, J.; Lu, Y.; Yu, C.; Xu, T.; Nie, G.; Miao, B.; Zhang, X. Involvement of the TGF-beta1 pathway in caveolin-1-associated regulation of head and neck tumor cell metastasis. Oncol. Lett. 2020, 19, 1298–1304. [Google Scholar] [CrossRef]
- Zhang, H.; Su, L.; Muller, S.; Tighiouart, M.; Xu, Z.; Zhang, X.; Shin, H.J.; Hunt, J.; Sun, S.Y.; Shin, D.M.; et al. Restoration of caveolin-1 expression suppresses growth and metastasis of head and neck squamous cell carcinoma. Br. J. Cancer 2008, 99, 1684–1694. [Google Scholar] [CrossRef]
- Couet, J.; Sargiacomo, M.; Lisanti, M.P. Interaction of a receptor tyrosine kinase, EGF-R, with caveolins. Caveolin binding negatively regulates tyrosine and serine/threonine kinase activities. J. Biol. Chem. 1997, 272, 30429–30438. [Google Scholar] [CrossRef]
- Wang, K.; Zhu, X.; Mei, D.; Ding, Z. Caveolin-1 contributes to anoikis resistance in human gastric cancer SGC-7901 cells via regulating Src-dependent EGFR-ITGB1 signaling. J. Biochem. Mol. Toxicol. 2018, 32, e22202. [Google Scholar] [CrossRef] [PubMed]
- Bazzani, L.; Donnini, S.; Giachetti, A.; Christofori, G.; Ziche, M. PGE2 mediates EGFR internalization and nuclear translocation via caveolin endocytosis promoting its transcriptional activity and proliferation in human NSCLC cells. Oncotarget 2018, 9, 14939–14958. [Google Scholar] [CrossRef] [PubMed]
- Overmiller, A.M.; McGuinn, K.P.; Roberts, B.J.; Cooper, F.; Brennan-Crispi, D.M.; Deguchi, T.; Peltonen, S.; Wahl, J.K., III; Mahoney, M.G. c-Src/Cav1-dependent activation of the EGFR by Dsg2. Oncotarget 2016, 7, 37536–37555. [Google Scholar] [CrossRef]
- Luan, T.Y.; Zhu, T.N.; Cui, Y.J.; Zhang, G.; Song, X.J.; Gao, D.M.; Zhang, Y.M.; Zhao, Q.L.; Liu, S.; Su, T.Y.; et al. Expression of caveolin-1 is correlated with lung adenocarcinoma proliferation, migration, and invasion. Med. Oncol. 2015, 32, 207. [Google Scholar] [CrossRef]
- Sekhar, S.C.; Kasai, T.; Satoh, A.; Shigehiro, T.; Mizutani, A.; Murakami, H.; El-Aarag, B.Y.; Salomon, D.S.; Massaguer, A.; Llorens, R.D.; et al. Identification of caveolin-1 as a potential causative factor in the generation of trastuzumab resistance in breast cancer cells. J. Cancer 2013, 4, 391–401. [Google Scholar] [CrossRef]
- Dittmann, K.; Mayer, C.; Kehlbach, R.; Rodemann, H.P. Radiation-induced caveolin-1 associated EGFR internalization is linked with nuclear EGFR transport and activation of DNA-PK. Mol. Cancer 2008, 7, 69. [Google Scholar] [CrossRef]
- Dittmann, K.; Mayer, C.; Kehlbach, R.; Rothmund, M.C.; Rodemann, H.P. Radiation-induced lipid peroxidation activates src kinase and triggers nuclear EGFR transport. Radiother. Oncol. 2009, 92, 379–382. [Google Scholar] [CrossRef]
- Masuelli, L.; Budillon, A.; Marzocchella, L.; Mrozek, M.A.; Vitolo, D.; Gennaro, E.D.; Losito, S.; Sale, P.; Longo, F.; Ionna, F.; et al. Caveolin-1 overexpression is associated with simultaneous abnormal expression of the E-cadherin/alpha-beta catenins complex and multiple ErbB receptors and with lymph nodes metastasis in head and neck squamous cell carcinomas. J. Cell. Physiol. 2012, 227, 3344–3353. [Google Scholar] [CrossRef]
- Chung, Y.C.; Chang, C.M.; Wei, W.C.; Chang, T.W.; Chang, K.J.; Chao, W.T. Metformin-induced caveolin-1 expression promotes T-DM1 drug efficacy in breast cancer cells. Sci. Rep. 2018, 8, 3930. [Google Scholar] [CrossRef]
- Cui, Y.; Zhu, T.; Song, X.; Liu, J.; Liu, S.; Zhao, R. Downregulation of caveolin-1 increased EGFR-TKIs sensitivity in lung adenocarcinoma cell line with EGFR mutation. Biochem. Biophys. Res. Commun. 2018, 495, 733–739. [Google Scholar] [CrossRef]
- Chung, Y.C.; Kuo, J.F.; Wei, W.C.; Chang, K.J.; Chao, W.T. Caveolin-1 dependent endocytosis enhances the chemosensitivity of HER-2 positive breast cancer cells to trastuzumab emtansine (T-DM1). PLoS ONE 2015, 10, e0133072. [Google Scholar] [CrossRef]
- Yamaguchi, T.; Lu, C.; Ida, L.; Yanagisawa, K.; Usukura, J.; Cheng, J.; Hotta, N.; Shimada, Y.; Isomura, H.; Suzuki, M.; et al. ROR1 sustains caveolae and survival signalling as a scaffold of cavin-1 and caveolin-1. Nat. Commun. 2016, 7, 10060. [Google Scholar] [CrossRef]
- Kriegs, M.; Kasten-Pisula, U.; Riepen, B.; Hoffer, K.; Struve, N.; Myllynen, L.; Braig, F.; Binder, M.; Rieckmann, T.; Grenman, R.; et al. Radiosensitization of HNSCC cells by EGFR inhibition depends on the induction of cell cycle arrests. Oncotarget 2016, 7, 45122–45133. [Google Scholar] [CrossRef][Green Version]
- Bossi, P.; Bergamini, C.; Siano, M.; Rocca, M.C.; Sponghini, A.P.; Favales, F.; Giannoccaro, M.; Marchesi, E.; Cortelazzi, B.; Perrone, F.; et al. Functional genomics uncover the biology behind the responsiveness of head and neck squamous cell cancer patients to cetuximab. Clin. Cancer Res. 2016, 22, 3961–3970. [Google Scholar] [CrossRef]
- Cecco, L.D.; Nicolau, M.; Giannoccaro, M.; Daidone, M.G.; Bossi, P.; Locati, L.; Licitra, L.; Canevari, S. Head and neck cancer subtypes with biological and clinical relevance: Meta-analysis of gene-expression data. Oncotarget 2015, 6, 9627–9642. [Google Scholar] [CrossRef]
- Job, S.; Reynies, A.; Heller, B.; Weiss, A.; Guerin, E.; Macabre, C.; Ledrappier, S.; Bour, C.; Wasylyk, C.; Etienne-Selloum, N.; et al. Preferential response of basal-like head and neck squamous cell carcinoma cell lines to EGFR-targeted therapy depending on EREG-driven oncogenic addiction. Cancers 2019, 11, 795. [Google Scholar] [CrossRef] [PubMed]
- Cancer Genome Atlas Network. Comprehensive genomic characterization of head and neck squamous cell carcinomas. Nature 2015, 517, 576–582. [Google Scholar] [CrossRef] [PubMed]
- Chung, C.H.; Parker, J.S.; Karaca, G.; Wu, J.; Funkhouser, W.K.; Moore, D.; Butterfoss, D.; Xiang, D.; Zanation, A.; Yin, X.; et al. Molecular classification of head and neck squamous cell carcinomas using patterns of gene expression. Cancer Cell 2004, 5, 489–500. [Google Scholar] [CrossRef]
- Keck, M.K.; Zuo, Z.; Khattri, A.; Stricker, T.P.; Brown, C.D.; Imanguli, M.; Rieke, D.; Endhardt, K.; Fang, P.; Bragelmann, J.; et al. Integrative analysis of head and neck cancer identifies two biologically distinct HPV and three non-HPV subtypes. Clin. Cancer Res. 2015, 21, 870–881. [Google Scholar] [CrossRef] [PubMed]
- Walter, V.; Yin, X.; Wilkerson, M.D.; Cabanski, C.R.; Zhao, N.; Du, Y.; Ang, M.K.; Hayward, M.C.; Salazar, A.H.; Hoadley, K.A.; et al. Molecular subtypes in head and neck cancer exhibit distinct patterns of chromosomal gain and loss of canonical cancer genes. PLoS ONE 2013, 8, e56823. [Google Scholar] [CrossRef]
- Liu, B.S.; Xia, H.W.; Zhou, S.; Liu, Q.; Tang, Q.L.; Bi, N.X.; Zhou, J.T.; Gong, Q.Y.; Nie, Y.Z.; Bi, F. Inhibition of YAP reverses primary resistance to EGFR inhibitors in colorectal cancer cells. Oncol. Rep. 2018, 40, 2171–2182. [Google Scholar] [CrossRef]
- Hung, K.F.; Lin, S.C.; Liu, C.J.; Chang, C.S.; Chang, K.W.; Kao, S.Y. The biphasic differential expression of the cellular membrane protein, caveolin-1, in oral carcinogenesis. J. Oral Pathol. Med. 2003, 32, 461–467. [Google Scholar] [CrossRef] [PubMed]
- Ketteler, J.; Klein, D. Caveolin-1, cancer and therapy resistance. Int. J. Cancer 2018, 143, 2092–2104. [Google Scholar] [CrossRef] [PubMed]
- Rosenthal, D.I.; Harari, P.M.; Giralt, J.; Bell, D.; Raben, D.; Liu, J.; Schulten, J.; Ang, K.K.; Bonner, J.A. Association of human papillomavirus and p16 status with outcomes in the IMCL-9815 phase III registration trial for patients with locoregionally advanced oropharyngeal squamous cell carcinoma of the head and neck treated with radiotherapy with or without cetuximab. J. Clin. Oncol. 2016, 34, 1300–1308. [Google Scholar] [CrossRef]
- Szturz, P.; Cristina, V.; Herrera Gomez, R.G.; Bourhis, J.; Simon, C.; Vermorken, J.B. Cisplatin eligibility issues and alternative regimens in locoregionally advanced head and neck cancer: Recommendations for clinical practice. Front. Oncol. 2019, 9, 464. [Google Scholar] [CrossRef] [PubMed]
- Dassonville, O.; Formento, J.L.; Francoual, M.; Ramaioli, A.; Santini, J.; Schneider, M.; Demard, F.; Milano, G. Expression of epidermal growth factor receptor and survival in upper aerodigestive tract cancer. J. Clin. Oncol. 1993, 11, 1873–1878. [Google Scholar] [CrossRef] [PubMed]
- Grandis, J.R.; Melhem, M.F.; Barnes, E.L.; Tweardy, D.J. Quantitative immunohistochemical analysis of transforming growth factor-alpha and epidermal growth factor receptor in patients with squamous cell carcinoma of the head and neck. Cancer 1996, 78, 1284–1292. [Google Scholar] [CrossRef]
- Sok, J.C.; Coppelli, F.M.; Thomas, S.M.; Lango, M.N.; Xi, S.; Hunt, J.L.; Freilino, M.L.; Graner, M.W.; Wikstrand, C.J.; Bigner, D.D.; et al. Mutant epidermal growth factor receptor (EGFRvIII) contributes to head and neck cancer growth and resistance to EGFR targeting. Clin. Cancer Res. 2006, 12, 5064–5073. [Google Scholar] [CrossRef]
- Wheeler, S.E.; Suzuki, S.; Thomas, S.M.; Sen, M.; Leeman-Neill, R.J.; Chiosea, S.I.; Kuan, C.T.; Bigner, D.D.; Gooding, W.E.; Lai, S.Y.; et al. Epidermal growth factor receptor variant III mediates head and neck cancer cell invasion via STAT3 activation. Oncogene 2010, 29, 5135–5145. [Google Scholar] [CrossRef] [PubMed]
- Sun, S.; Wu, Y.; Guo, W.; Yu, F.; Kong, L.; Ren, Y.; Wang, Y.; Yao, X.; Jing, C.; Zhang, C.; et al. STAT3/HOTAIR signaling axis regulates HNSCC growth in an EZH2-dependent manner. Clin. Cancer Res. 2018, 24, 2665–2677. [Google Scholar] [CrossRef]
- Sen, M.; Joyce, S.; Panahandeh, M.; Li, C.; Thomas, S.M.; Maxwell, J.; Wang, L.; Gooding, W.E.; Johnson, D.E.; Grandis, J.R. Targeting Stat3 abrogates EGFR inhibitor resistance in cancer. Clin. Cancer Res. 2012, 18, 4986–4996. [Google Scholar] [CrossRef]
- D’Amato, V.; Rosa, R.; D’Amato, C.; Formisano, L.; Marciano, R.; Nappi, L.; Raimondo, L.; Di Mauro, C.; Servetto, A.; Fusciello, C.; et al. The dual PI3K/mTOR inhibitor PKI-587 enhances sensitivity to cetuximab in EGFR-resistant human head and neck cancer models. Br. J. Cancer 2014, 110, 2887–2895. [Google Scholar] [CrossRef]
- Baro, M.; Lopez Sambrooks, C.; Burtness, B.A.; Lemmon, M.A.; Contessa, J.N. Neuregulin signaling is a mechanism of therapeutic resistance in head and neck squamous cell carcinoma. Mol. Cancer Ther. 2019, 18, 2124–2134. [Google Scholar] [CrossRef] [PubMed]
- Iida, M.; Bahrar, H.; Brand, T.M.; Pearson, H.E.; Coan, J.P.; Orbuch, R.A.; Flanigan, B.G.; Swick, A.D.; Prabakaran, P.J.; Lantto, J.; et al. Targeting the HER family with pan-HER effectively overcomes resistance to cetuximab. Mol. Cancer Ther. 2016, 15, 2175–2186. [Google Scholar] [CrossRef]
- Cavalot, A.; Martone, T.; Roggero, N.; Brondino, G.; Pagano, M.; Cortesina, G. Prognostic impact of HER-2/neu expression on squamous head and neck carcinomas. Head Neck 2007, 29, 655–664. [Google Scholar] [CrossRef]
- Yonesaka, K.; Zejnullahu, K.; Okamoto, I.; Satoh, T.; Cappuzzo, F.; Souglakos, J.; Ercan, D.; Rogers, A.; Roncalli, M.; Takeda, M.; et al. Activation of ERBB2 signaling causes resistance to the EGFR-directed therapeutic antibody cetuximab. Sci. Transl. Med. 2011, 3, 99ra86. [Google Scholar] [CrossRef] [PubMed]
- Ouyang, X.; Barling, A.; Lesch, A.; Tyner, J.W.; Choonoo, G.; Zheng, C.; Jeng, S.; West, T.M.; Clayburgh, D.; Courtneidge, S.A.; et al. Induction of anaplastic lymphoma kinase (ALK) as a novel mechanism of EGFR inhibitor resistance in head and neck squamous cell carcinoma patient-derived models. Cancer Biol. Ther. 2018, 19, 921–933. [Google Scholar] [CrossRef] [PubMed]
- Kochanny, S.E.; Worden, F.P.; Adkins, D.R.; Lim, D.W.; Bauman, J.E.; Wagner, S.A.; Brisson, R.J.; Karrison, T.G.; Stadler, W.M.; Vokes, E.E.; et al. A randomized phase 2 network trial of tivantinib plus cetuximab versus cetuximab in patients with recurrent/metastatic head and neck squamous cell carcinoma. Cancer 2020. [Google Scholar] [CrossRef] [PubMed]
- Novoplansky, O.; Fury, M.; Prasad, M.; Yegodayev, K.; Zorea, J.; Cohen, L.; Pelossof, R.; Cohen, L.; Katabi, N.; Cecchi, F.; et al. MET activation confers resistance to cetuximab, and prevents HER2 and HER3 upregulation in head and neck cancer. Int. J. Cancer 2019, 145, 748–762. [Google Scholar] [CrossRef]
- Leonard, B.; Brand, T.M.; O’Keefe, R.A.; Lee, E.D.; Zeng, Y.; Kemmer, J.D.; Li, H.; Grandis, J.R.; Bhola, N.E. BET inhibition overcomes receptor tyrosine kinase-mediated cetuximab resistance in HNSCC. Cancer Res. 2018, 78, 4331–4343. [Google Scholar] [CrossRef]
- Brand, T.M.; Iida, M.; Stein, A.P.; Corrigan, K.L.; Braverman, C.M.; Luthar, N.; Toulany, M.; Gill, P.S.; Salgia, R.; Kimple, R.J.; et al. AXL mediates resistance to cetuximab therapy. Cancer Res. 2014, 74, 5152–5164. [Google Scholar] [CrossRef] [PubMed]
- Braig, F.; Voigtlaender, M.; Schieferdecker, A.; Busch, C.J.; Laban, S.; Grob, T.; Kriegs, M.; Knecht, R.; Bokemeyer, C.; Binder, M. Liquid biopsy monitoring uncovers acquired RAS-mediated resistance to cetuximab in a substantial proportion of patients with head and neck squamous cell carcinoma. Oncotarget 2016, 7, 42988–42995. [Google Scholar] [CrossRef]
- Nair, S.; Trummell, H.Q.; Rajbhandari, R.; Thudi, N.K.; Nozell, S.E.; Warram, J.M.; Willey, C.D.; Yang, E.S.; Placzek, W.J.; Bonner, J.A.; et al. Novel EGFR ectodomain mutations associated with ligand-independent activation and cetuximab resistance in head and neck cancer. PLoS ONE 2020, 15, e0229077. [Google Scholar] [CrossRef]
- Yang, J.; Zhu, T.; Zhao, R.; Gao, D.; Cui, Y.; Wang, K.; Guo, Y. Caveolin-1 inhibits proliferation, migration, and invasion of human colorectal cancer cells by suppressing phosphorylation of epidermal growth factor receptor. Med. Sci. Monit. 2018, 24, 332–341. [Google Scholar] [CrossRef]
- Han, F.; Zhang, J.; Shao, J.; Yi, X. Caveolin-1 promotes an invasive phenotype and predicts poor prognosis in large cell lung carcinoma. Pathol. Res. Pract. 2014, 210, 514–520. [Google Scholar] [CrossRef]
- Han, F.; Gu, D.; Chen, Q.; Zhu, H. Caveolin-1 acts as a tumor suppressor by down-regulating epidermal growth factor receptor-mitogen-activated protein kinase signaling pathway in pancreatic carcinoma cell lines. Pancreas 2009, 38, 766–774. [Google Scholar] [CrossRef]
- Gu, D.; Li, H.; Wang, Z.; Chen, Q.; Jiang, J.; Zhu, H. Caveolin-1 inhibits the growth of human laryngeal squamous cell carcinoma and down regulates EGFR-MAPKs signaling pathway. Laryngoscope 2007, 117, 1782–1789. [Google Scholar] [CrossRef]
- Xu, L.; Qu, X.; Li, H.; Li, C.; Liu, J.; Zheng, H.; Liu, Y. Src/caveolin-1-regulated EGFR activation antagonizes TRAIL-induced apoptosis in gastric cancer cells. Oncol. Rep. 2014, 32, 318–324. [Google Scholar] [CrossRef] [PubMed]
- Yamaguchi, T.; Hayashi, M.; Ida, L.; Yamamoto, M.; Lu, C.; Kajino, T.; Cheng, J.; Nakatochi, M.; Isomura, H.; Yamazaki, M.; et al. ROR1-CAVIN3 interaction required for caveolae-dependent endocytosis and pro-survival signaling in lung adenocarcinoma. Oncogene 2019, 38, 5142–5157. [Google Scholar] [CrossRef] [PubMed]
- Pereira, P.M.R.; Sharma, S.K.; Carter, L.M.; Edwards, K.J.; Pourat, J.; Ragupathi, A.; Janjigian, Y.Y.; Durack, J.C.; Lewis, J.S. Caveolin-1 mediates cellular distribution of HER2 and affects trastuzumab binding and therapeutic efficacy. Nat. Commun. 2018, 9, 5137. [Google Scholar] [CrossRef]
- Li, H.Y.; Qu, C.; Zhang, Y.J.; Sun, J.; Han, C.; Liu, J.; Zou, W. Caveolin-1 is involved in DNA damage and repair signaling in X-irradiated Chang liver cells. Sheng Li Xue Bao 2017, 69, 759–766. [Google Scholar]
- Singh, B.; Carpenter, G.; Coffey, R.J. EGF receptor ligands: Recent advances. F1000Research 2016, 5. [Google Scholar] [CrossRef]
- Moreno-Vicente, R.; Pavon, D.M.; Martin-Padura, I.; Catala-Montoro, M.; Diez-Sanchez, A.; Quilez-Alvarez, A.; Lopez, J.A.; Sanchez-Alvarez, M.; Vazquez, J.; Strippoli, R.; et al. Caveolin-1 modulates mechanotransduction responses to substrate stiffness through actin-dependent control of YAP. Cell Rep. 2019, 26, 1679–1680. [Google Scholar] [CrossRef] [PubMed]
- Sanchez-Vega, F.; Mina, M.; Armenia, J.; Chatila, W.K.; Luna, A.; La, K.C.; Dimitriadoy, S.; Liu, D.L.; Kantheti, H.S.; Saghafinia, S.; et al. Oncogenic signaling pathways in the cancer genome atlas. Cell 2018, 173, 321–337.e10. [Google Scholar] [CrossRef]
- Urtasun, R.; Latasa, M.U.; Demartis, M.I.; Balzani, S.; Goni, S.; Garcia-Irigoyen, O.; Elizalde, M.; Azcona, M.; Pascale, R.M.; Feo, F.; et al. Connective tissue growth factor autocriny in human hepatocellular carcinoma: Oncogenic role and regulation by epidermal growth factor receptor/yes-associated protein-mediated activation. Hepatology 2011, 54, 2149–2158. [Google Scholar] [CrossRef]
- He, C.; Mao, D.; Hua, G.; Lv, X.; Chen, X.; Angeletti, P.C.; Dong, J.; Remmenga, S.W.; Rodabaugh, K.J.; Zhou, J.; et al. The Hippo/YAP pathway interacts with EGFR signaling and HPV oncoproteins to regulate cervical cancer progression. EMBO Mol. Med. 2015, 7, 1426–1449. [Google Scholar] [CrossRef]
- Yoshikawa, K.; Noguchi, K.; Nakano, Y.; Yamamura, M.; Takaoka, K.; Hashimoto-Tamaoki, T.; Kishimoto, H. The Hippo pathway transcriptional co-activator, YAP, confers resistance to cisplatin in human oral squamous cell carcinoma. Int. J. Oncol. 2015, 46, 2364–2370. [Google Scholar] [CrossRef]
- Akervall, J.; Nandalur, S.; Zhang, J.; Qian, C.N.; Goldstein, N.; Gyllerup, P.; Gardinger, Y.; Alm, J.; Lorenc, K.; Nilsson, K.; et al. A novel panel of biomarkers predicts radioresistance in patients with squamous cell carcinoma of the head and neck. Eur. J. Cancer 2014, 50, 570–581. [Google Scholar] [CrossRef]


Publisher’s Note: MDPI stays neutral with regard to jurisdictional claims in published maps and institutional affiliations. |
© 2021 by the authors. Licensee MDPI, Basel, Switzerland. This article is an open access article distributed under the terms and conditions of the Creative Commons Attribution (CC BY) license (https://creativecommons.org/licenses/by/4.0/).
Share and Cite
Burgy, M.; Jehl, A.; Conrad, O.; Foppolo, S.; Bruban, V.; Etienne-Selloum, N.; Jung, A.C.; Masson, M.; Macabre, C.; Ledrappier, S.; et al. Cav1/EREG/YAP Axis in the Treatment Resistance of Cav1-Expressing Head and Neck Squamous Cell Carcinoma. Cancers 2021, 13, 3038. https://doi.org/10.3390/cancers13123038
Burgy M, Jehl A, Conrad O, Foppolo S, Bruban V, Etienne-Selloum N, Jung AC, Masson M, Macabre C, Ledrappier S, et al. Cav1/EREG/YAP Axis in the Treatment Resistance of Cav1-Expressing Head and Neck Squamous Cell Carcinoma. Cancers. 2021; 13(12):3038. https://doi.org/10.3390/cancers13123038
Chicago/Turabian StyleBurgy, Mickaël, Aude Jehl, Ombline Conrad, Sophie Foppolo, Véronique Bruban, Nelly Etienne-Selloum, Alain C. Jung, Murielle Masson, Christine Macabre, Sonia Ledrappier, and et al. 2021. "Cav1/EREG/YAP Axis in the Treatment Resistance of Cav1-Expressing Head and Neck Squamous Cell Carcinoma" Cancers 13, no. 12: 3038. https://doi.org/10.3390/cancers13123038
APA StyleBurgy, M., Jehl, A., Conrad, O., Foppolo, S., Bruban, V., Etienne-Selloum, N., Jung, A. C., Masson, M., Macabre, C., Ledrappier, S., Burckel, H., Mura, C., Noël, G., Borel, C., Fasquelle, F., Onea, M.-A., Chenard, M.-P., Thiéry, A., Dontenwill, M., & Martin, S. (2021). Cav1/EREG/YAP Axis in the Treatment Resistance of Cav1-Expressing Head and Neck Squamous Cell Carcinoma. Cancers, 13(12), 3038. https://doi.org/10.3390/cancers13123038