1. Background
Pancreatic cancer is one of the deadliest diseases and the eighth most common cancer in Europe [
1]. It accounts for 7–8% of cancer-related deaths in Europe, and the 5-year survival is less than 10% [
2]. Two reasons for such poor prognosis are late diagnosis and misdiagnosis [
3,
4,
5], as it shares many symptoms with chronic pancreatitis [
6,
7]. Late diagnosis can be ameliorated through non-invasive testing, which may lower the barrier for early monitoring. Diagnosis can be improved by an accurate differentiation between pancreatic cancer and chronic pancreatitis. Thus, it is vital to accurately stratify patients using noninvasive blood-based testing.
Currently, the most extensively evaluated biomarker for pancreatic cancer is a serum marker, Carbohydrate Antigen 19-9 (CA19-9) [
8,
9], an epitope of the sialylated Lewis blood group antigens [
10]. In pancreatic cancer diagnosis, CA19-9 achieves a median sensitivity and specificity of around 80% [
11]. There are two confounding factors for the limited validity of CA19-9 in early diagnosis: First, CA19-9 may be elevated in chronic pancreatitis and benign pancreatic tumours [
12] and second, 5% of patients are Lewis a−/b− and cannot produce CA19-9 [
13].
Recently, a number of blood-based approaches have been pursued to complement or go beyond CA19-9. Melo et al. described Glypican-1 as a cell surface marker for cancer exosomes [
14]. Mayerle et al. took a different approach and analysed metabolic profiles to segregate pancreatic ductal adenocarcinoma (PDAC) and pancreatitis with an unsupervised machine learning model using principal component analysis (PCA) [
7]. Mellby et al. established a signature of 29 biomarkers obtained from an antibody microarray for the same task [
15]. Their results were promising, but the variability of metabolic concentrations and expression levels pose a challenge.
A complementary line of thought investigates genetic predisposition. Various authors have proposed mutations associated with pancreatic cancer. Childs et al. introduced four [
16] and Grant et al. eleven mutations [
17] associated with pancreatic cancer. However, Grant et al. concluded that the proportion of affected patients was small (3.8%), limiting the approach’s applicability.
Milne et al. and Klein et al. agreed in the argument that due to the complexity of the genetic component of pancreatic cancer, single variants of high penetrance genes like
BRCA1/2, INK4A, STK11, Tp53, APC, and
ATM could not fully explain the pathogenesis [
18,
19]. Variants of low penetrance genes might contribute to the susceptibility of the patient cohort because of a lack of immunosurveillance [
20]. Growing evidence suggests that changes in immune cell composition and tumour microenvironment are associated with tumour progression [
21,
22].
By and large, many biomarkers achieve good classification results but with high variability, while known genetic variants are invariable predispositions but with limited applicability. Here, we seek to overcome these two limitations by combining them. We build on CA19-9 as an established biomarker and add high-quality and significant variants in expressed genes obtained from blood samples.
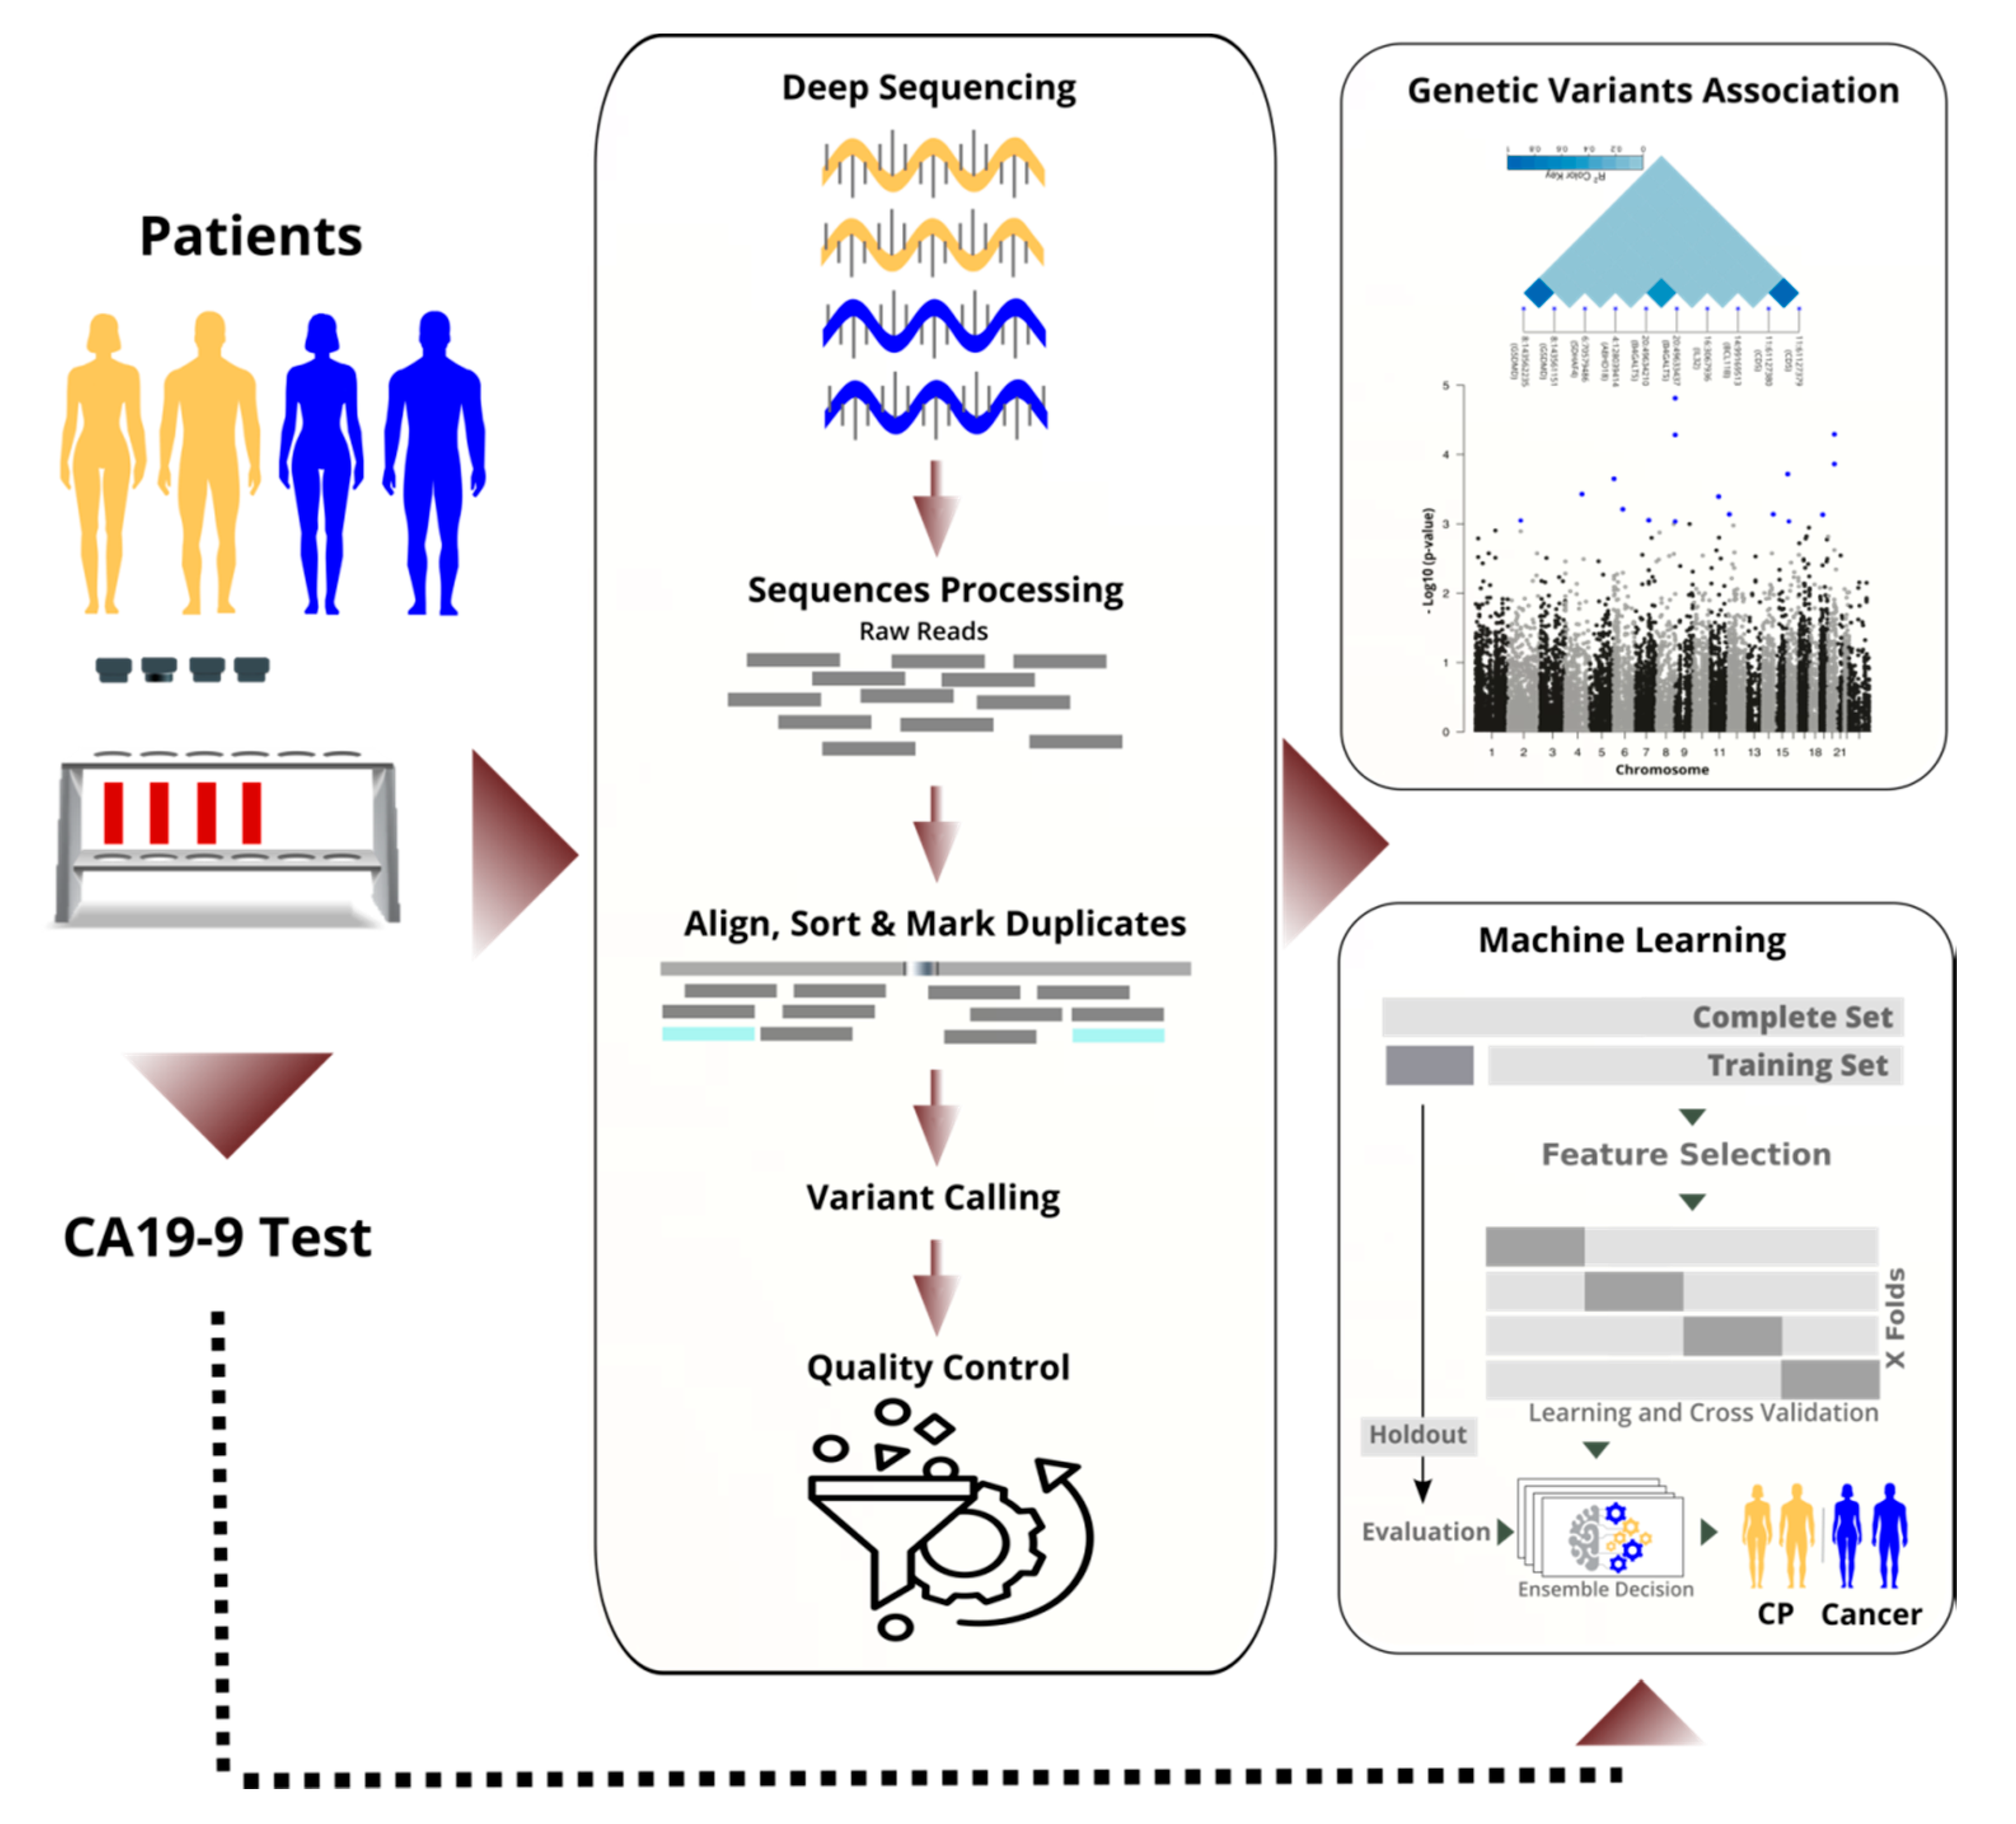
We sequenced the RNA of nucleated cells found in peripheral blood and achieved high quality through high coverage in sequencing and rigorous filtering of variants. Next, we performed a transcriptome-wide association study to identify statistically significant and predictive RNA-based variants (see
Figure 1). By performing the analysis on the RNA instead of the DNA, we focused on important variants that are in the regulatory or coding region, and we saved costs. We discuss selected variants and their known links to cancer biology.
In parallel to the TWAS, we applied machine learning to differentiate cancer from chronic pancreatitis (CP), and in particular, resectable PDAC (rPDAC) from CP. Finally, we demonstrate that our approach is even capable of defining a signature to estimate survival for resectable PDAC.
2. Material and Methods
2.1. Local Ethics Committee
Patients with histopathologically confirmed resectable pancreatic ductal adenocarcinoma (n = 87, rPDAC), non-resectable pancreatic cancer (n = 96, nrPC), and confirmed chronic pancreatitis (n = 85, CP) were included in the study. Cancer patients were classified by clinicians as non-resectable either because they were distant metastatic or locally advanced. The study was reviewed by the internal review board of the University Hospital Dresden, Germany. After approval from the local ethics committee at the University Hospital Dresden (reference number: EK349122008), all patients gave their written informed consent to take part in the study.
2.2. Sample Preparation and Deep Sequencing
Venous blood samples were extracted from the patients using the PAXgene Blood RNA Tube System (PreAnalytiX, Hilden, Germany) before surgery or any other planned medical intervention. Until further analysis, the samples were stored at −20 °C. CA19-9 was determined in serum using CLIA (DiaSorin). RNA was isolated from the blood using the PAXgene Blood RNA Kit (PreAnalytiX, Hilden, Germany) according to the manufacturers’ instruction. Contaminating genomic DNA in the RNA samples was removed by the treatment of the RNAs with Baseline Zero- DNase (Epicentre, Madison, WI, USA). After the clean-up of the digestion with RNeasy Mini Kit (Qiagen, Hilden, Germany), the RNA samples were subjected to quality control using the Agilent RNA 6000 Nano Kit (Agilent, Waldbronn, Germany). Only samples displaying a RIN > 8.0 were subjected to RNA sequencing. Messenger RNA was isolated from 1.5 µg total RNA by combining the depletion of haemoglobin using the Globin-Zero Gold Kit (Epicentre, Madison, WI, USA) with successive poly-dT enrichment using the NEBNext Poly-A mRNA Magnetic Isolation Module according to the manufacturers’ instruction. Final elution was done in 15 µL 2× NEBnext first-strand cDNA synthesis buffer (NEB, Frankfurt, Germany).
After chemical fragmentation, by incubating at 94 °C for 15 min, the samples were directly subjected to the workflow for strand-specific RNA-Seq library preparation (Ultra Directional RNA Library Prep, NEB, Frankfurt, Germany). For ligation, custom adaptors were used: Adaptor-Oligo-1: 5′-ACACTCTTTCCCTACACGACGCTCTTCCGATCT-3′, 2: 5′-PGATCGGAAGAGCACACGTCTGAACTCCAGTCAC3′.
Indexing was performed during the following PCR enrichment (15 cycles) using custom amplification primers carrying the index sequence indicated with “NNNNNN” (Primer1: Oligo_Seq5′ AATGATACGGCGACCACCGAGATCTACACTCTTTCCCTACACGACGCTCTTCCGATCT-3′, Primer2: 5′ CAAGCAGAAGACGGCATACGAGAT-NNNNNN-GTGACTGGAGTTCAGACGTGTGCTCTTCCGATCT-3′).
For Illumina sequencing, samples were equimolarly pooled and distributed on the respective number of flow-cells for 75bp single-end sequencing on Illumina HiSeq 2500, resulting in an average of 60 Mio fragments sequences per sample.
2.3. Sequence Assembly and Quality Control
FASTQC 0.10.1, Cutadapt 1.9.1, and STAR 2.7 were used sequentially for quality checking, adapters removal, and mapping. Sequences were aligned and annotated based on Genome Reference Consortium Human Build 38 (GRCh38). To estimate the complexity and predict the redundancy of a genomic sequencing library at a given sequencing depth, we used two software packages: Preseq and Genomecov (bedtools 2.30). We analysed sequences depth and coverage based on the aligned bam files. Picard 2.9 was used to mark PCR duplicates and sort reads. Reads were split by N operators of the CIGAR strings into component reads and trimmed into splice junctions to remove RNA overhangs by using the Genome Analysis Toolkit (GATK 4.1 and GATK 3.8). GATK’s base quality score recalibration (BQSR) estimated possible systematic sequencing errors [
23]. The HaplotypeCaller of GATK single-nucleotide polymorphisms (SNVs) and insertion-deletions (INDELs) simultaneously via the local de novo assembly of haplotypes in an active region [
23]. Then these variants were hierarchically merged over the samples into one file in GVCF format and then subjected to hard filters. Hard-filtering throws out variants below specific thresholds for properties, such as variant confidence, root mean square of the mapping quality and strand bias. Other standard quality control protocols were applied [
24,
25] by using PLINK 2. We adopted very stringent criteria to ensure the quality of the study and validity of the results of statistical analysis results. Missingness filter, for example, excludes a massive number of variants that were present in less than 97% of our samples. The second important filtering measure was the minor allele frequency (MAF). MAF is the rate of occurrence for the second most common allele in the given population.
For samples, the following quality control steps were applied: missingness, which excludes the samples with high missing variants; heterozygosity, which filters samples with too high or low heterozygosity rate, relatedness, which find pairs of samples looking too similar to each other, and finally stratification, which checks whether the samples belong to the same population.
Table S1_1 gives an overview of the tools and configurations described in this section.
2.4. Statistical Analysis
The transcriptome-wide association study (TWAS) was implemented as a logistic regression model on the 16,934 high-quality variants using PLINK 2. Three cohorts of patients were used for different analysis, namely rPDACr, nrPC, and CP. The significant variants that have a p-value with minus four orders of magnitude or better were studied. We also evaluated rare variants that passed the minor allele frequency (MAF) filter and showed a distinct level of association (e.g., with an odds ratio of around ten). We still call them rare, although they pass the MAF filter because of their relatively low MAF (around 10%). In all of our statistical analysis, gender was added as a covariate in the logistic regression models to prevent bias. However, this has an ignorable influence on the variants ranking.
2.5. Feature Selection for Machine Learning
Firstly, the dataset was divided into a training set (80%) and a test set (20%). The feature selection process was performed with a logistic regression model on the 16,934 high-quality variants using only the training set. Variants were ranked and evaluated independently for each task (cancer vs. CP, rPDAC vs. CP, nrPC vs. CP). By using the training set, the features (variants) were ranked according to their significance (p-value and odds ratio). We applied principal component analysis on an incremental number of variants to identify a minimum number of features that present a higher possible segregation level. For each task, variants with a p-value below 0.005 or an odds ratio higher than ten (or below 0.1) were nominated and kept as features. They were normalised to a binary format (zero for the reference allele and one for an alternative allele). CA19-9 was used as a feature and fed to the models in a binary format (below or higher than the clinical threshold of 37 U/mL).
2.6. Machine Learning
A deep feed-forward neural network approach was implemented and optimised with Adam optimiser in a fivefold cross-validation process on the training set. Networks were built for the tasks and optimised with Keras 2.2.4. It consisted of a visible layer, five dense fully connected hidden layers with ReLu activation functions, and an output layer with Softmax function. A batch normalisation and dropout of 0.4 were applied for some tasks. For stochastic learning, the Adam optimiser [
26] was used with learning rate decay. The fivefold cross-validation process resulted in five models, which were optimised and evaluated separately (see
Figure 1). At the final evaluation, the test set (a holdout) was used. For each task, the area under the ROC curve (AUC), accuracy, precision, sensitivity, and F1-score were calculated and reported. We calculated the average performance of the five models. Additionally, we ensembled decisions of the five models per task by averaging their probabilities in identifying the positive class. Overall, the two averaging methods gave very close measures in all classification tasks.
2.7. Survival Analysis
A linear regression, using
PLINK 2, was applied to the training set to evaluate the predictivity of each variant on its own. Box-Cox power transformation was applied to approximate the normal distribution of the survival time [
27] of rPDAC samples. Then, Kaplan–Meier plots and log-rank test were performed to evaluate the best variant.
The multivariate analysis, using a proportional-hazards model (Cox regression), was implemented to define a signature of multiple variants by using the R packages:
survminer and
survival. The backward elimination selection procedure [
28] on the training set kept the effective predictors as features and excluded detrimental or time-dependent ones. The likelihood ratio test, Wald test, and the log-rank test were applied.
To check if the requirements for the proportional hazards model are met, the proportional hazards assumption of the Cox regression was tested by using the Schoenfeld residuals against the transformed time. Having high
p-values (e.g., above 0.05) in this test indicates that there are not time-dependent coefficients in the final model; therefore, the assumptions are valid. By using the test set, the time-dependent area under the ROC curve [
29] and the covariate specific ROC curve [
30] were determined.
3. Results
In this study, we aimed to explore combining an established biomarker with RNA- based variants to accurately distinguish pancreatic cancer in its two profiles (resectable and non-resectable) from chronic pancreatitis, as well as to estimate survival in the resectable type. Of the sequenced patients, 68% suffered from pancreatic cancer and 32% from chronic pancreatitis. Most of the cancer patients were above 60 years old, while most pancreatitis patients were between 50 and 60 years old. The cancer group was gender-balanced, while the pancreatitis group was predominantly male. Gender was included as a covariate to accommodate the imbalanced regression models. CA19-9 values were obtained for nearly all cancer and pancreatitis patients. Survival for rPDAC was nearly twice as long as for non-resectable cancer (see
Table 1).
In clinical practice, a CA19-9 value higher than 37 U/mL is an indication of pancreatic cancer [
9]. With around 84% AUC and 76% accuracy, CA19-9 distinguishes cancer from pancreatitis and serves as a baseline. Adjusting the clinical threshold for CA19-9 does not improve classification results because false positives and false negatives do not cluster around the threshold of 37 U/mL, but they spread out widely (see
Figure S1_1).
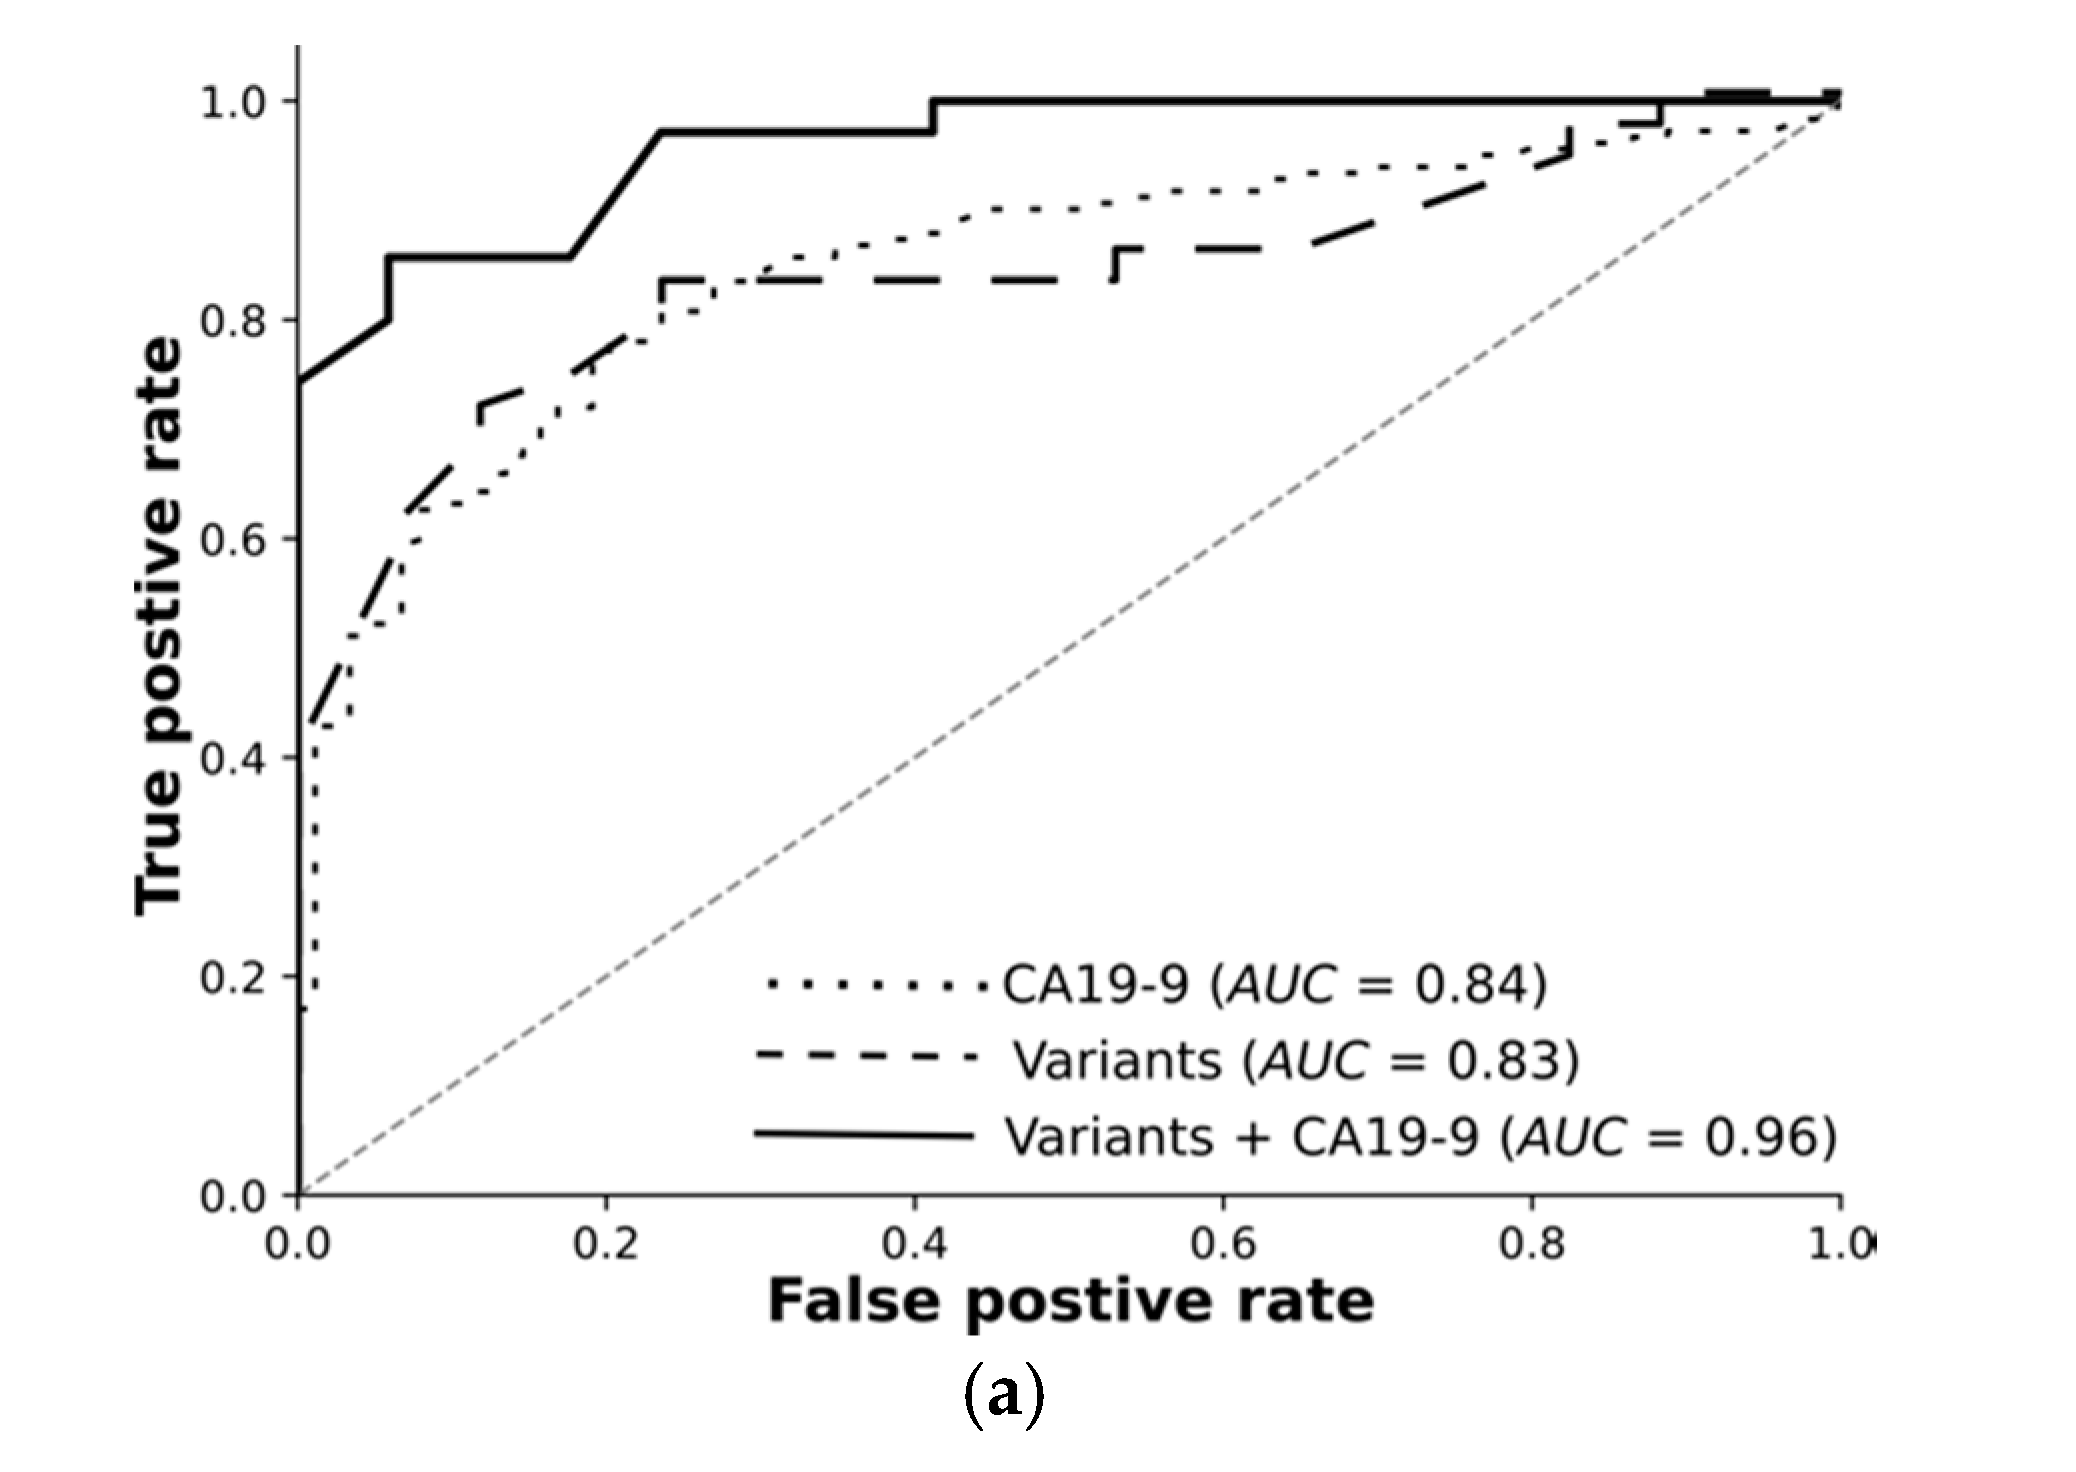
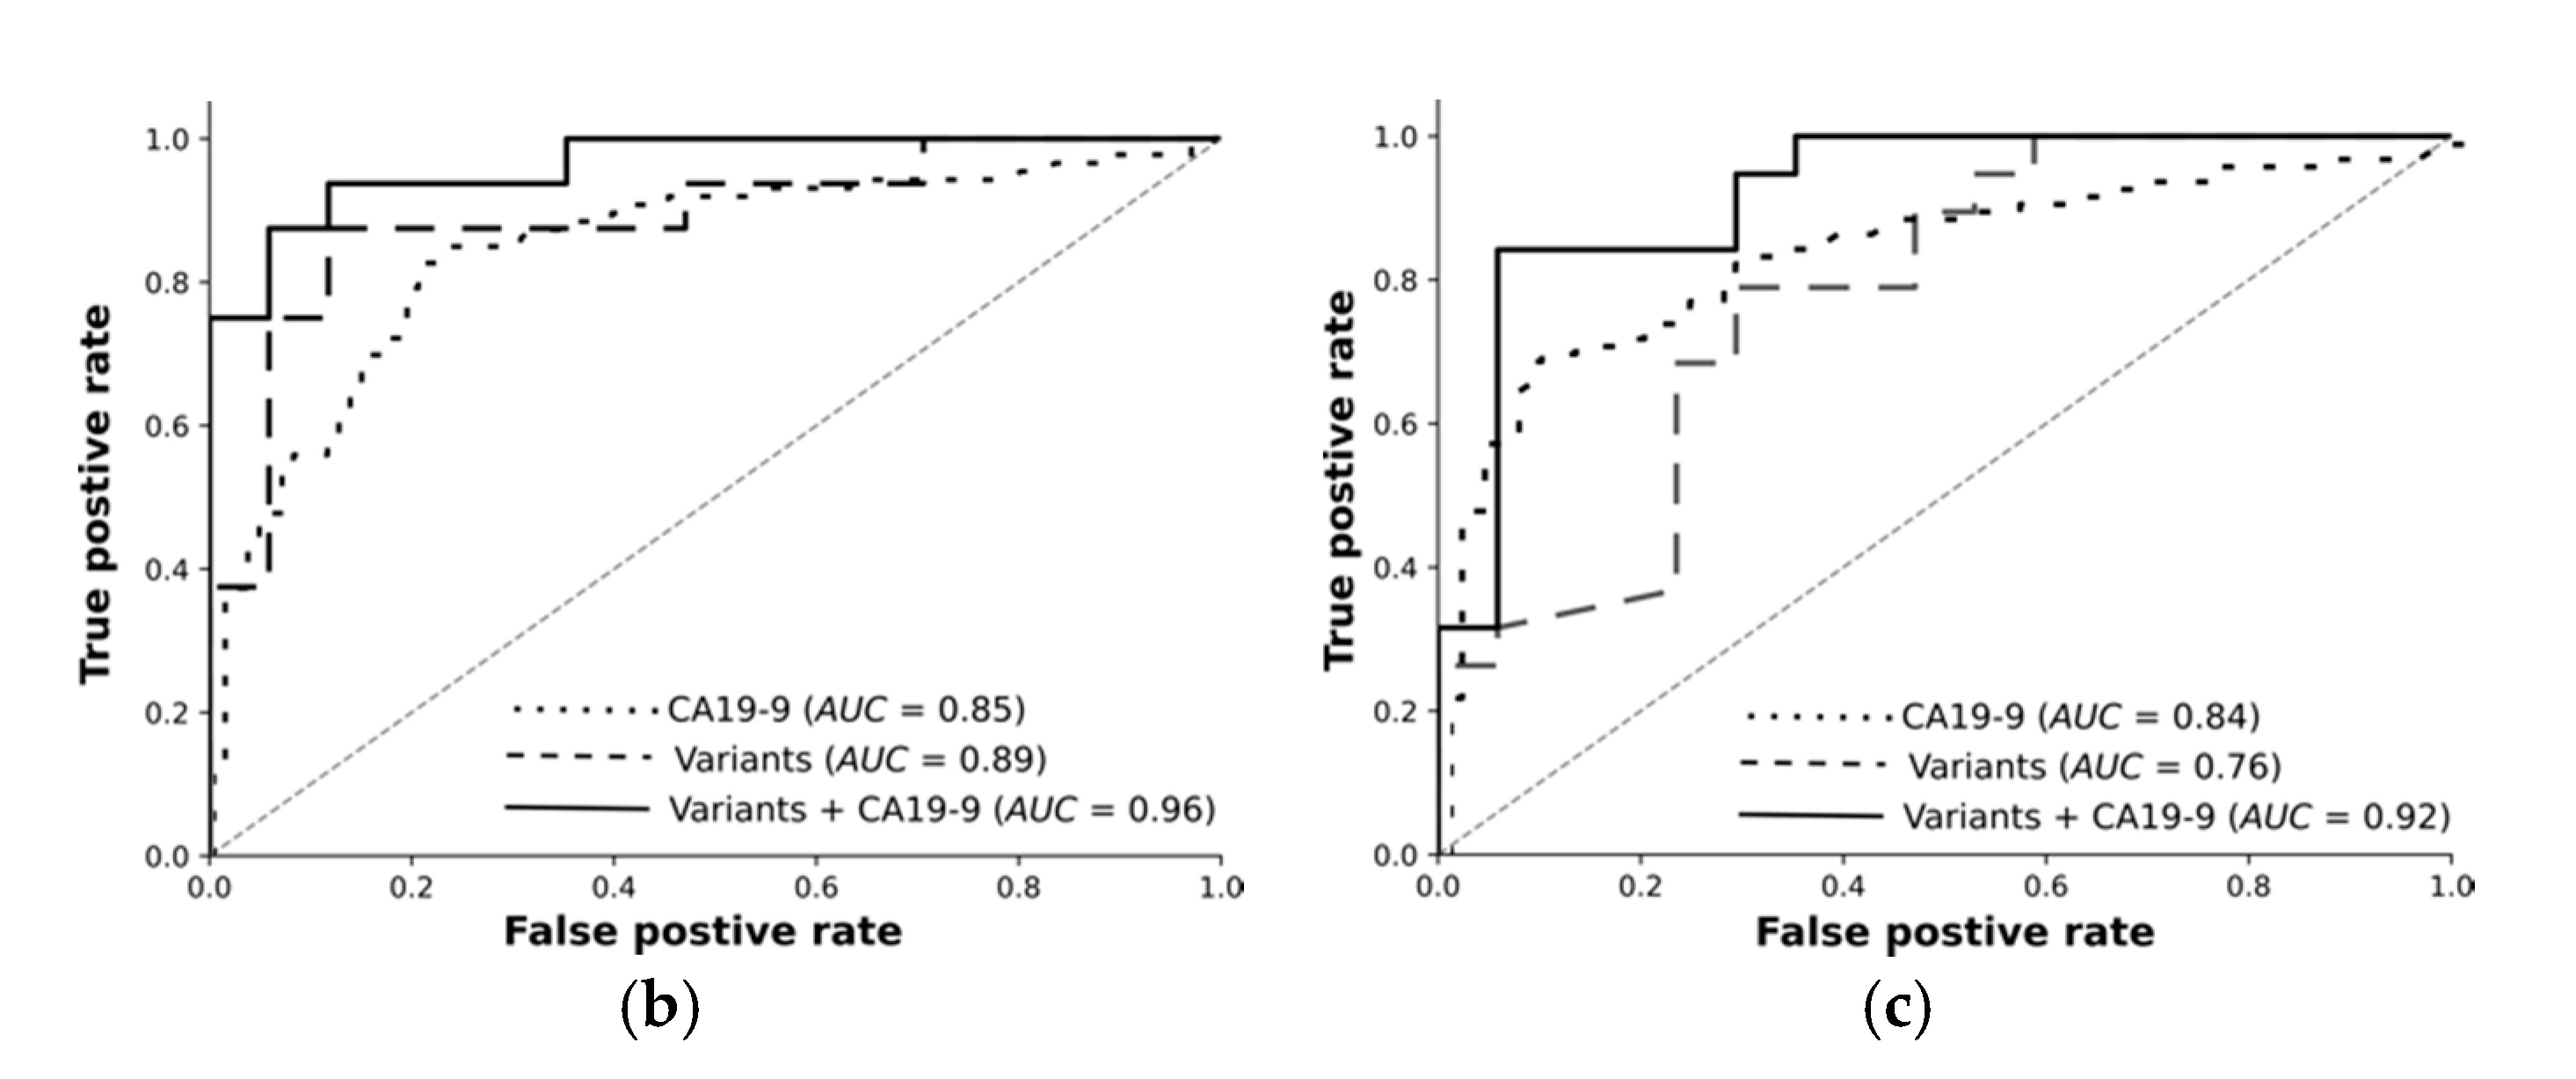
Overall, we rigorously reduced millions of raw variants to hundreds of high-quality, highly significant variants. Our transcriptomic-wide association study identified variants highly associated with pancreatic cancer or chronic pancreatitis. Encouraged by these results, we trained machine learning models and tested them using an independent test set. The receiver operating curves demonstrate: Variants on their own differentiate the resectable pancreatic cancer from chronic pancreatitis with 89% AUC. Combined with CA19-9, they reach 96%. Deep learning on high-quality, highly significant variants together with CA19-9 nearly perfectly distinguishes resectable PDAC from pancreatitis using 76 RNA-based variants.
3.1. Sequencing at 60 Mio Read Depth
We sequenced the RNA of blood samples at 60 Mio read depth. We examined the utility of further sequencing and optimisation of the sequencing depth.
Figure S1_2 shows the average of all reads in each base position over our samples. Some of the base positions were covered with less than ten reads, which are likely to be lost if we sequence with less coverage. Importantly, the significant variants that were selected as features for machine learning (i.e., with a
p-value below 0.005) are in the middle region of the graph, where base positions were covered with at least 50 reads. This means that it is possible to reduce the cost and to sequence at a lower depth without losing significant information. For example, sequencing with 30 Mio instead of 60 Mio fragments will result in keeping the hypergeometric probability of having more than 20 reads in each of these positions around 95% (by assuming that calling variants requires around 20 reads).
Furthermore, we computed the expected yield of distinct fragments of reads for experiments smaller than the input experiment (c_curve) by resampling our bam files for all samples. We found that sequencing with an average of 30 Mio fragments per sample instead of 60 Mio will not lead to losing more than 0.6 Mio distinct fragments out of 7 Mio, which corresponds to around 9% (see
Figure S1_3).
3.2. Consistency of Cell Types between Groups
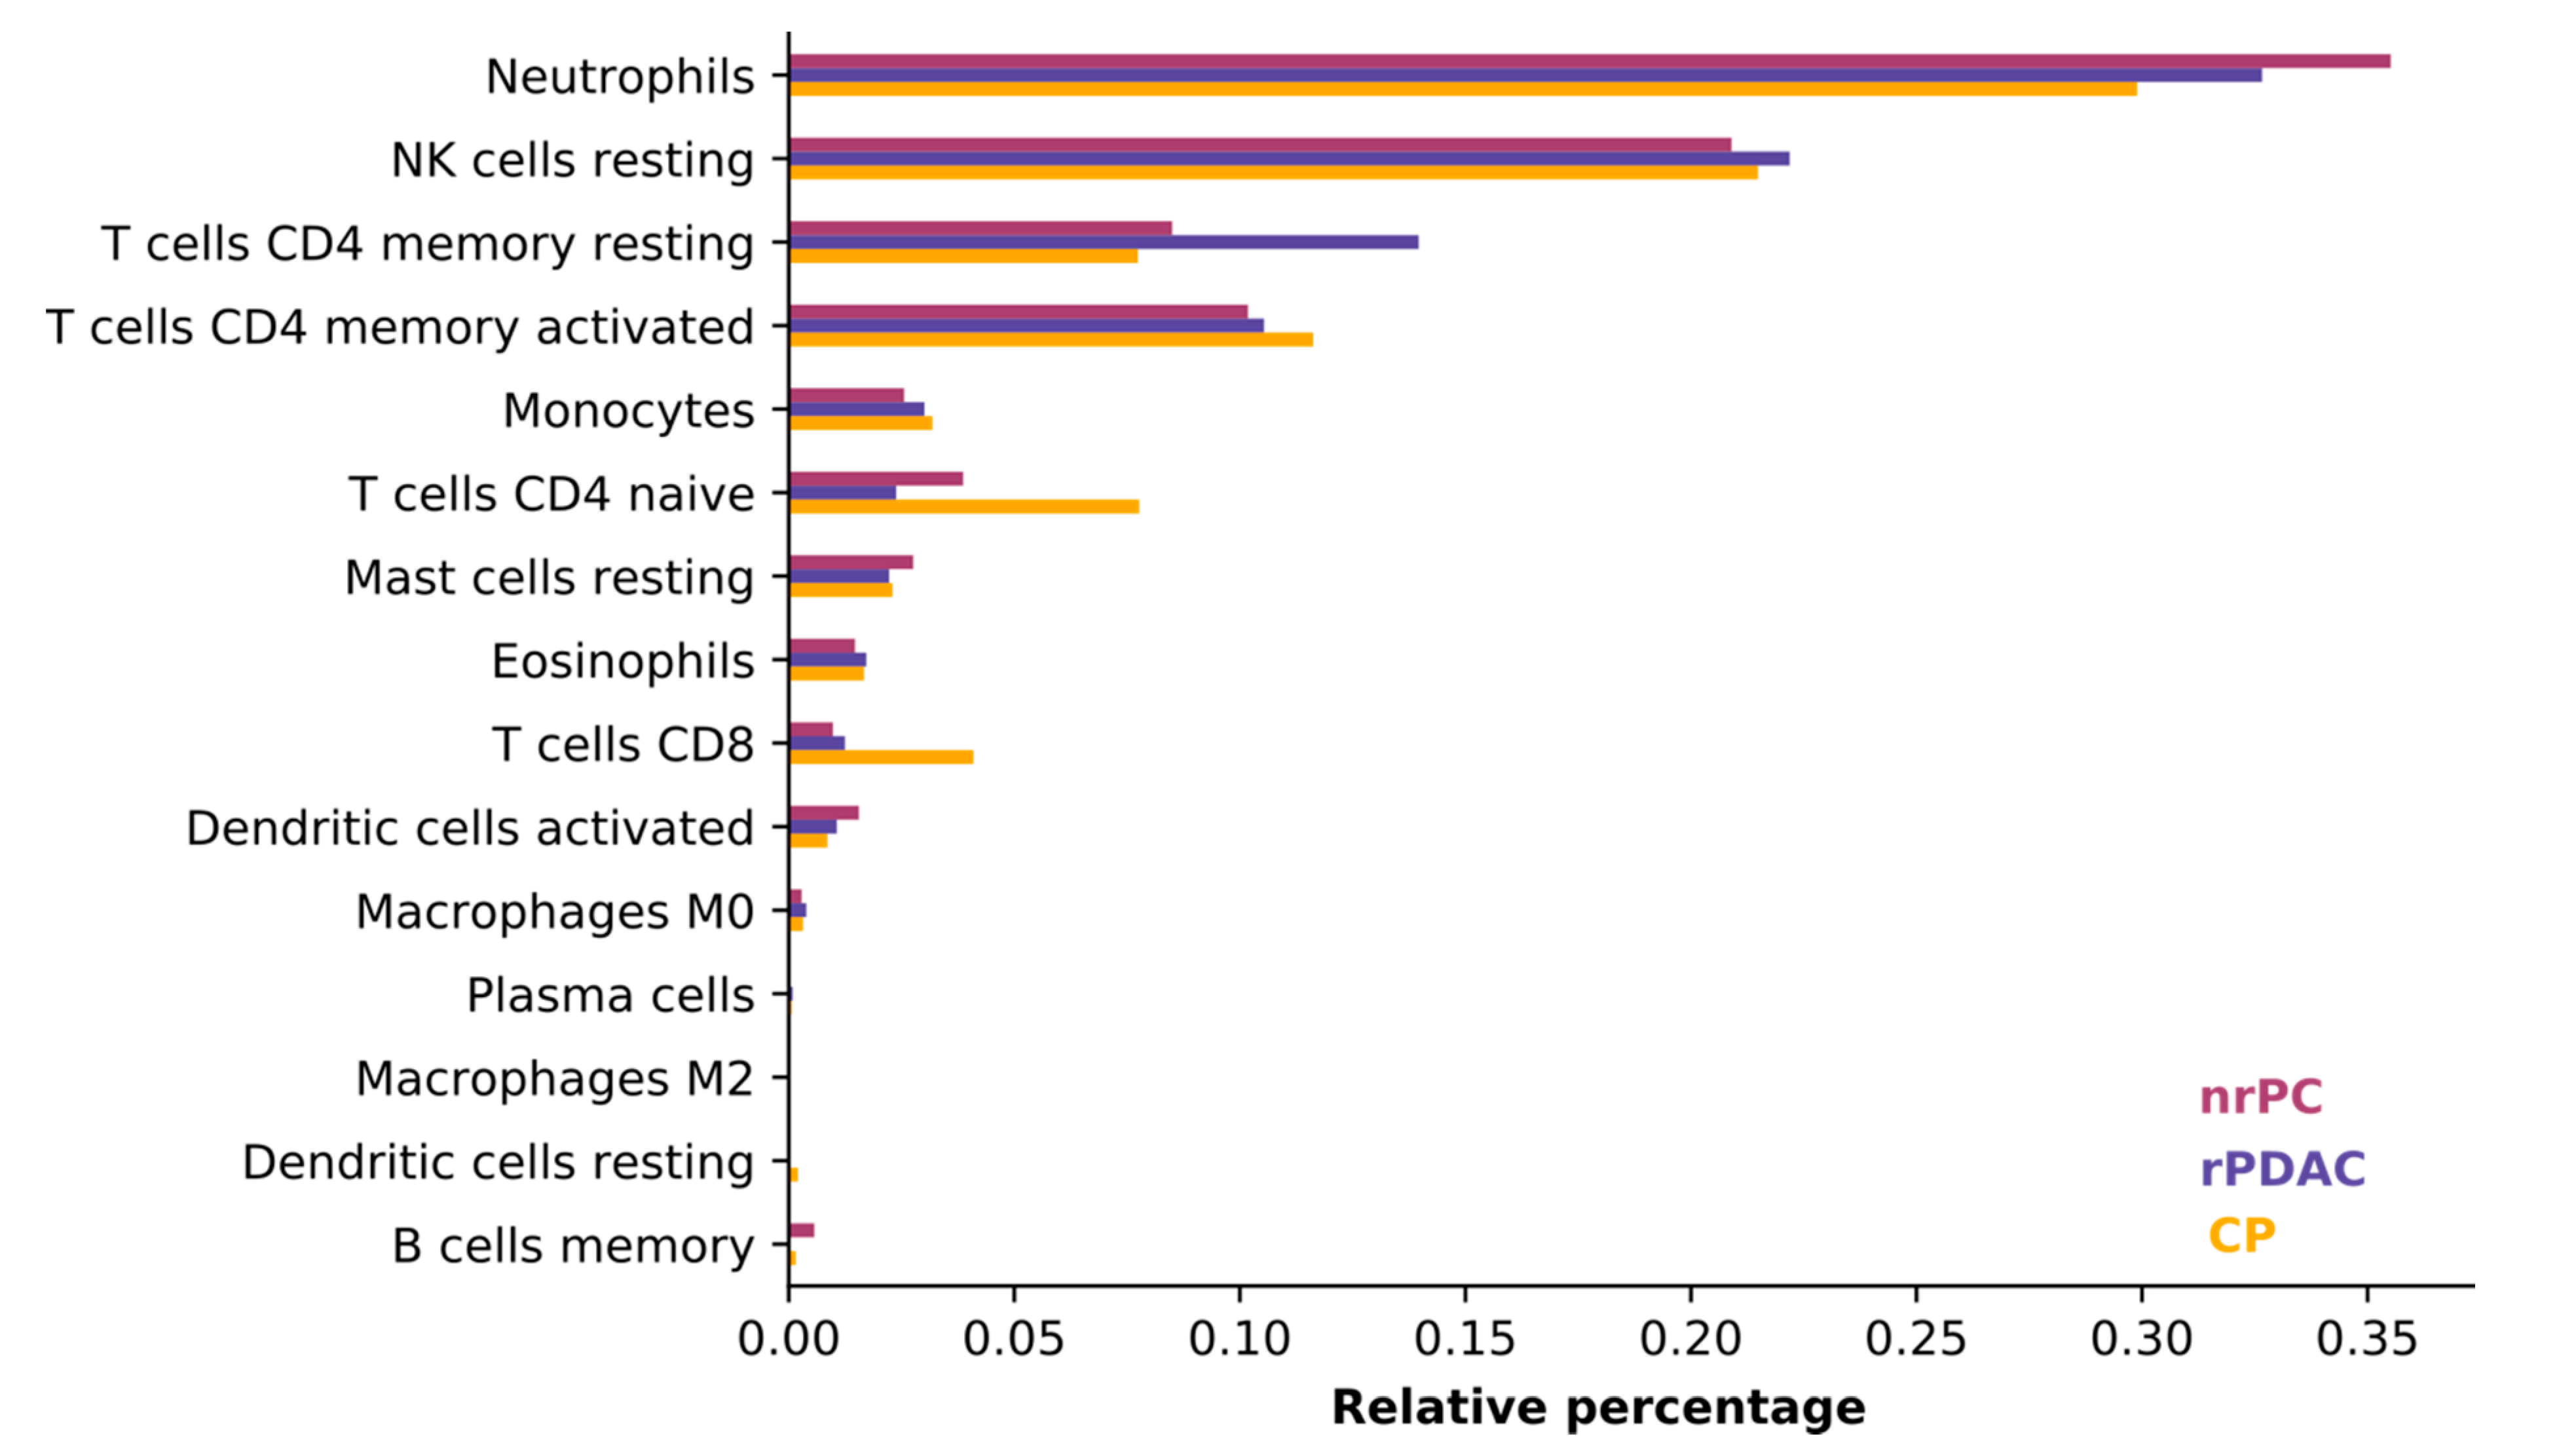
We judged the average consistency of cell types between groups using CIBERSORT, which estimates the abundances of member cell types in a mixed cell population, using gene expression data [
31]. All blood samples were comprised mostly of neutrophils, natural killer cells (NK cells), and T cells. The composition of cells was consistent and did only differ in the least abundant cell types (see
Figure 2) so that the difference in cell type composition between patient groups does not influence variant calling.
3.3. Variants and Samples Quality Control
Our sequences have a high base call accuracy with Phred quality scores per base pair position above 25 (see
Figure S1_4). To obtain high-quality variants, we followed standard quality control procedures [
24,
25]. In the quality control workflow, 2,039,151 raw variants were reduced to 16,934 high-quality variants in around 9000 genes. Mostly, variants were filtered out because of their high missingness among samples or their low minor allele frequency. Missingness initially excluded 93% of variants. After exclusion of variants with low genotype quality, another 28% of the variants were removed. Minor allele frequency filtering removed 80% of variants. All other steps had a comparatively minor impact. The sample’s quality control removed around 5% (see
Table 2).
3.4. Statistical Analysis (TWAS)
From the high-quality variants, we identified highly significant variants through carrying out a transcriptome-wide association study. First, we sought variants differentiating pancreatic cancer in its two profiles (rPDAC or nrPC) from chronic pancreatitis (CP). Then we compared each profile with CP (see
Figure S1_5 for Manhattan plots).
Table 3 shows the identified significant variants for each analysis. Overall, four variants in the genes
GSDMD, B4GALT5, and
VPS36 were significantly associated with pancreatic cancer, with
p-values of minus four orders of magnitude or better. Other variants were associated with CP with high affinity. Moreover, six variants present in 10% or below of our samples were highly significant. More than 90% of these variants appeared in cancer, and only less than 10% were in CP. One of them (rs3093553) was already defined as a risk factor for breast cancer in two GWAS studies (see
Table 4).
An analysis for linkage disequilibrium showed that alleles occur together less often than expected on the same haplotype (negative linkage disequilibrium) in the two variants of
GSDMD. For the two variants of
CD5, two alleles occur together more often than expected on the same haplotype (positive linkage disequilibrium). The two variants in
B4GALT5 were in moderate positive linkage disequilibrium. Variants in different genes were independent (see
Figure S1_5 for linkage disequilibrium plots).
3.5. Deep Learning Accurately Differentiates Cancer
By using logistic regression on the training set, we carried out a feature ranking and selection process. We selected variants with a
p-value below 0.005 or an odds ratio higher than 10 (or below 0.1) as features for our machine learning model. The numbers of the obtained features were 70, 76, and 67 for cancer vs. CP, rPDAC vs. CP, and nrPC vs. CP, respectively (see
Sheet S2_1, Sheet S2_2 and Sheet S2_3 for the full lists). Overall, we rigorously reduced millions of variants to hundreds of high-quality, highly significant features. We do not only exploit affinity towards cancer but also against cancer (associated with CP). Every single variant achieved an AUC lower than 67% on its own, which is below the predictivity of CA19-9.
For each classification task, we trained feed-forward deep neural networks by using the selected features and another by using the selected features and CA19-9 together. The models were optimised using the training set with fivefold cross-validation and evaluated using an independent test set. The receiver operating curves in
Figure 3 demonstrate: Deep learning on high-quality, highly significant features (variants) together with CA19-9 nearly perfectly distinguishes resectable PDAC from pancreatitis and improves the performance of CA19-9 on its own from 84% to 96%. Our models significantly improve the diagnosis across all classification tasks. The selected features without CA19-9 achieved an AUC of 89% in differentiating rPDAC from CP.
Table 5 and
Figure 3 summarise AUC as well as accuracy, precision, and recall for all tasks and show the predictivity of variants and CA19-9 separately and together. Performance of each fold in the cross validation on training and test sets are reported in
Table S1_2 and Table S1_3, respectively.
3.6. Estimating Survival
Next, we estimated survival from variants. In our patient cohort, resectable PDAC patients survive nearly twice as long as non-resectable ones (see
Table 1). In the group of resectable PDAC, we applied a linear regression model for evaluating the association between each variant on its own with survival time in a univariate model. Among the 16,934 high-quality variants,
rs6728689 in
SP100 was highly associated with poor prognosis in rPDAC.
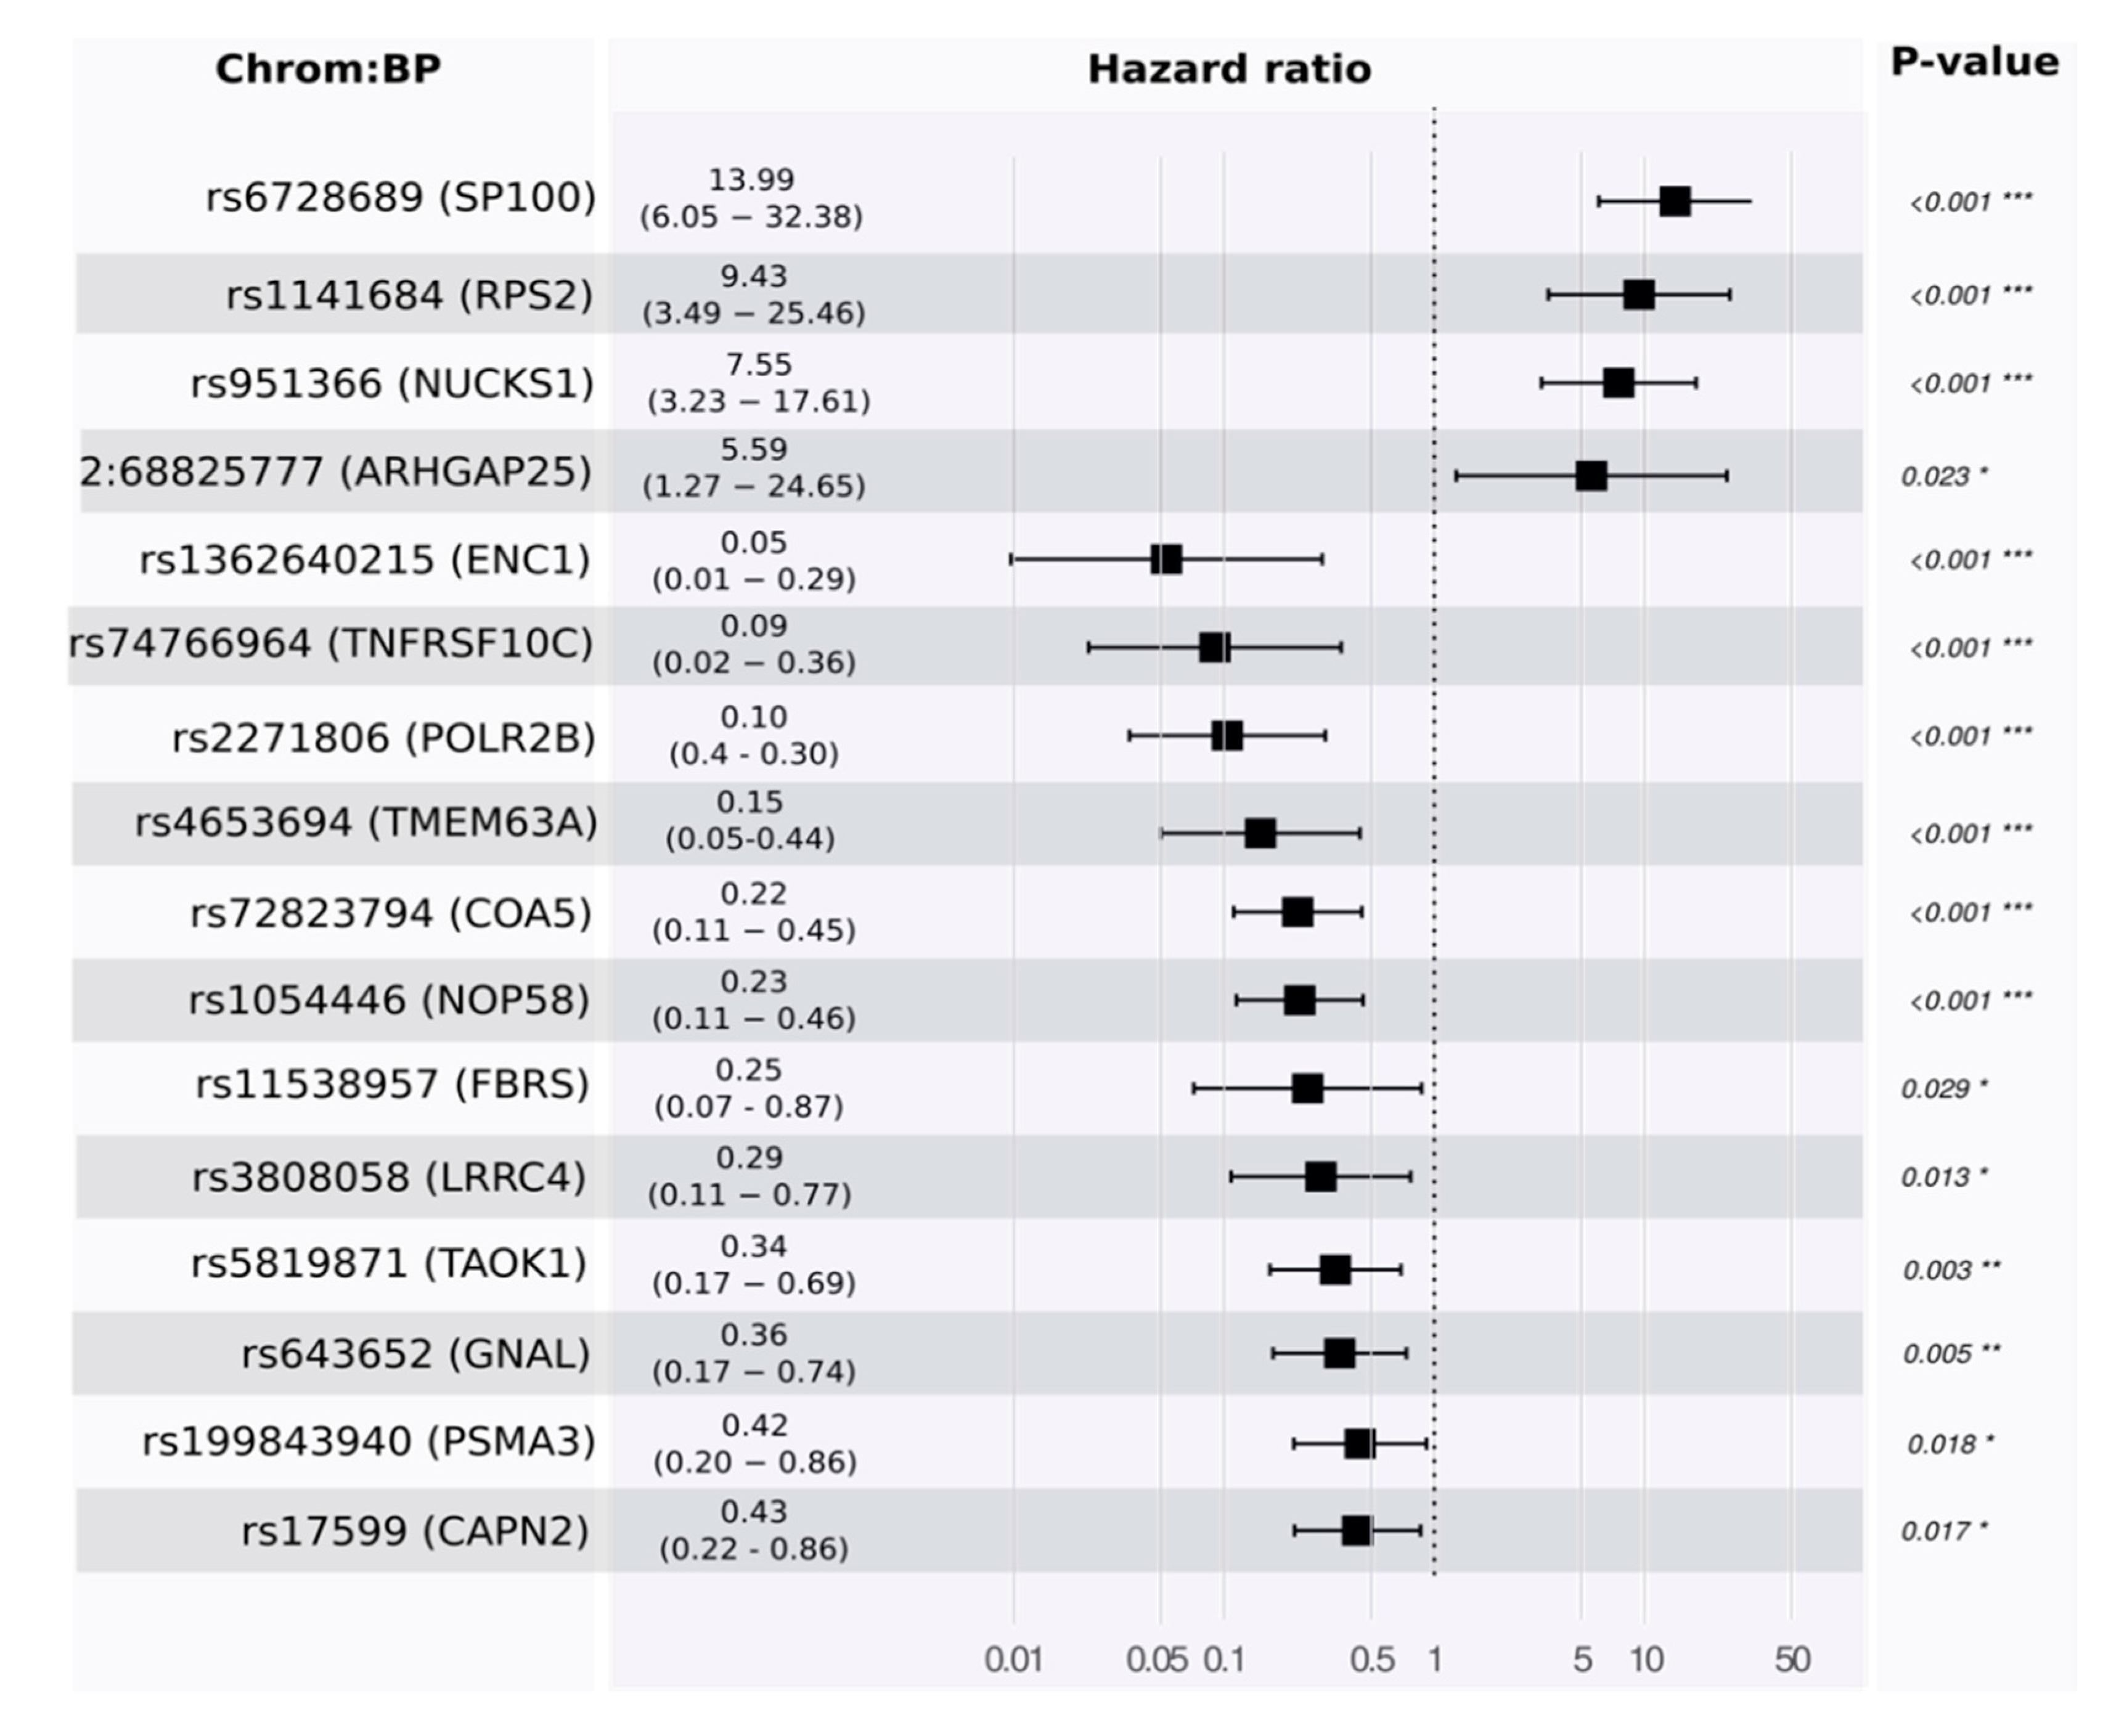
Toward a multivariate model, we developed a proportional hazards model to estimate survival. Using the training set, our model identified 16 features. Some of these were associated with good prognosis and others with poor prognosis (see
Figure 4 and
Table S1_4).
p-values for the likelihood ratio test, Wald test, and the log-rank test were below
, and the concordance was 0.89 (standard error = 0.19). The main driver in the model was rs6728689 (in SP100), which shows a distinctive level of significance with a
p-value of
and a hazard ratio of around 14. Evaluating its predictivity using the independent test set reveals a high level of association (see
Figure 5 for Kaplan–Meier plots in the training and testing sets).
Checking for proportionality assumption by using the Schoenfeld residuals against the transformed time showed that the global model and each of the selected predictors were having
p-values above 0.05. In this test, having very small
p-values is an indication of time-dependent coefficients, which is not desirable; however, that was not the case in our analysis (see
Table S1_5). Therefore, the requirements for the proportional hazards model are met, and the hazard rate of an individual is relatively constant in time. Using the test set, we computed time-dependent AUC and the covariate specific AUC, and they were 92% and 89%, respectively.
3.7. Variants’ Biological Connection to the Disease
The variants were obtained from peripheral blood, but interestingly, the genes harbouring the variants appear to play a role in cancer tissue.
Table 3 summarises the significant variants. In the analysis of cancer (rPDAC + nrPC) vs. CP, three variants in the genes
GSDMD and
B4GALT5 showed a high association with pancreatic cancer in its two profiles (rPDAC and nrPC). In the gene
GSDMD, one variant was significantly associated with cancer and another with CP. Wang et al. discuss
GSDMD’s potential as a cancer target due to its role in pyroptosis gasdermin mediated programmed cell death [
32]. It is highly connected with the CASP gene family (see
Figure S1_6a), which is strongly related to the poor prognosis of pancreatic cancer [
33].
Interestingly, studying other possible associations in the data showed that the variant of
B4GALT5 was associated with patients that were false negatives of CA19-9. This observation is in agreement with Indellicato et al. in pointing out an association between
B4GALT5 and glycosylation profiles and its connection to the elevation of CA19-9 values [
34]. Generally,
B4GALT5 is a membrane-bound glycoprotein, which is associated with
MUC4 (see
Figure S1_6b, STRINGDB [
35]).
MUC4 is associated with pancreatic cancer and was proposed as a marker to differentiate pancreatic cancer from pancreatitis [
36].
Other variants were identified because of their significant association with CP. Some of them were already studied and defined in other genomic association studies as markers for other diseases such as type 2 diabetes (see
Table 3).
In the survival analysis,
rs6728689 in
SP100 was highly associated with poor prognosis in rPDAC.
SP100 can activate p53-dependent transcription, which is important for regulating apoptosis by supporting the stimulatory effect of homeodomain interacting protein kinase-2 (
HIPK2) [
37]. Accordingly, we suggest that variations in
SP100 may reduce the activity of
HIPK2 and attenuate p53-dependent apoptosis.
4. Discussion
In 1981, Koprowski et al. introduced CA19-9 based on a small case study with two pancreatic cancer patients [
38]. Today, it serves as a monitoring tool after pancreatic cancer resection. Its use in diagnosis is still limited because of its low accuracy of around 80% [
11]. To date, there is no single biomarker or genetic variant that outperforms CA19-9 in detecting pancreatic cancer. However, combinations of biomarkers or variants [
7,
15,
18,
19] promise improvements.
In our approach, we wanted to exploit the synergy between CA19-9 as an established clinical biomarker with RNA-based variants, which capture a form of dynamic predisposition obtained from the transcriptome. Combining the tumour marker CA19-9 with signatures of selected variants in a deep learning approach results in highly accurate classification. They span a variety of tasks, such as distinguishing cancer from CP and estimating survival in the resectable type. Interestingly, deep learning with variants as input but without CA19-9 achieves a performance comparable to the established CA19-9 on its own. This means that our approach can replace CA19-9 for Lewis-antigen negative patients, where CA19-9 on its own is not applicable.
In differentiating rPDAC from pancreatitis, we obtained an AUC of 96%, which is above the 94% AUC reported in [
7] and significantly above the 84% AUC in [
15]. But importantly, their approaches were built on biomarkers, which are continuous, namely metabolic and gene expressions, respectively. They could carry noise inherent to the method and read-out. In contrast, we observe discrete features whose read-out is binary (present or absent) and whose noise can be controlled by the sequencing depth. Thus, we believe that our selected features provide a very robust and stable signature, which can be analysed in laboratories specialised in genetic analysis without the need for special equipment. Moreover, the accuracy (or F1 score) of our models indicates that we were able to improve the diagnosis by 14% over CA19-9, whose accuracy is 77%.
In fact, we believe that many of the selected variants can contribute to a causal disease model. In agreement with Milne et al. and Klein et al., we do not solely focus on well-known high penetrance genes but include low penetrance genes [
18,
19]. We found that many of the identified variants do not directly affect protein function and structure, as they are located in the three prime untranslated regions (
3′-UTR). These variants can influence tumour susceptibility by polyadenylation, translation efficiency, localisation, and stability of the mRNA [
39].
Although some of the genes harbouring variants appear to play a role in cancer tissue, it was not our primary intention to find genes expressed in the tumour tissue or, for that matter, to find mutations. For example, speaking about tumour tissue, one would expect to capture signals from KRAS mutations, especially in non-resectable cancer (nrPC), which includes metastasis patients. Nevertheless, there is no single variant in KRAS that shows any level of significance for all the comparison groups. Therefore, the assay was developed mainly to perform diagnosis without tumour tissue to support the performance of the biomarker CA19-9 and introduce a reliable diagnosis model. The basic idea started from attempts to evaluate gene expression changes in the nucleotide cells of peripheral blood, but it successfully resulted in developing a marker panel in single-nucleotide variants (germline variants) because of its superior accuracy and higher stability.
The germline variants do not change over time and the only dynamic component in the developed model is CA19-9, but it is not fully precise to argue that we introduced a patient sub-stratification system based on static predispositions. Rather, we successfully exploit the synergy between the dynamic biomarker CA19-9 and those static predisposition variants. Moreover, there is another dynamic component in the model, which is the expression of the genes carrying the variants. While the variant itself is static, its gene is behaving dynamically and may or may not be expressed. We consider only variants on expressed genes, and hence it is a combination of static and dynamic aspects.
Some variants may be pinpointed due to indirect correlation with other phenomena associated with the false diagnosis of CA19-9. For example, variants in the gene
B4GALT5 were associated with rPDAC in our data. Evaluating all possible associations indicates that these two variants were also associated with false negatives of CA19-9 diagnosis, and this was exploited by our model to improve CA19-9 prediction. This was not a surprise due to several studies linking
B4GALT5 to glycosylation and then to the elevation of CA19-9 values [
33]. Generally,
B4GALT5 is a membrane-bound glycoprotein, and it was linked with pancreatic cancer through
MUC4 [
36,
40]. Cataloguing germline predispositions is invaluable for cancer screening, prevention, and early detection. However, this does not necessarily mean that PDAC or CP is encoded in the patients’ DNA. The patient’s dynamic response to the disease may have a static variant signature that we utilised in our prediction.
Furthermore, we exploit affinity towards cancer and also against cancer (associated with CP). We believe that the former can also be used to indicate pancreatic cancer compared with normal patients without pancreatitis. Some of the cancer variants were particularly associated with rPDAC or nrPC, and others with pancreatic cancer in general (see
Table 3).
Finally, a key to these results is high-quality data. We sequenced at 60 Mio coverage of high-quality mRNA. While whole-exome sequencing (WES) is primarily for DNA variant discovery and RNA-Seq is mainly for measuring gene expression, both can be used to detect single nucleotide variants (SNVs) [
41]. WES is the sequencing of genomic DNA that has been enriched for exonic regions. This is cheaper than sequencing an entire genome. RNA-seq is even cheaper and less complicated than WES. By performing the analysis on the RNA level instead of the WES, we focused on important variants that are in the regulatory or coding region, and we saved costs. Furthermore, as shown in
Figure S1_3, half the coverage leads to a 9% decrease, while double the coverage to a 10% increase. In comparison to the reduction of variants due to missingness, these changes are small, and a further increase in coverage is unlikely to have a positive effect. However, the large reduction due to missingness in some samples means that future improvements in sequence quality are likely to increase the number of significant variants, which is unlikely to improve the nearly perfect classification results but likely to improve a causal understanding of the disease processes.
5. Conclusions
We have shown that deep sequencing and machine learning can significantly improve pancreatic cancer diagnosis from blood samples. The combination of the established biomarker CA19-9 with new high quality and significant RNA-based variants resulted in the ability to differentiate pancreatic cancer from pancreatitis with an AUC of 96%. We also defined a signature of 16 variants significant for estimating survival in resectable PDAC.
Conceptually, our approach combines dynamic and static read-outs. CA19-9 captures a dynamic reaction to cancer, while the variants in the expressed genes are static predisposition. The former may reflect dynamic disease progression, while the latter captures dynamic predispositions obtained from the transcriptome. As a first step towards a deeper understanding of the causal relationships, we discussed the variants that were significant for cancer. In particular, the genes B4GALT5 and GSDMD, which harbour three of the most significant variants, are closely related to cancer progression and the elevation of CA19-9 levels. In an additional analysis, we identified six statistically significant variants, one of which was already defined as a breast cancer risk factor in several publications. However, these six variants are having limited impact due to their lower minor allele frequency (around ten).
Overall, our results show that deep sequencing and machine learning can pave the way to early and accurate diagnosis as well as personalised treatment options.


 ,
, 


