
fMRI Retinotopic Mapping in Patients with Brain Tumors and Space-Occupying Brain Lesions in the Area of the Occipital Lobe

 , ,
, ,  ,
,  ,
,
Abstract
Simple Summary
Abstract
1. Introduction
2. Materials and Methods
2.1. Study Sample
2.2. Image Acquisition
2.3. fMRI Data Analysis
3. Results
3.1. Functional Data: Extent of Activation
3.2. Percent Signal Change
3.3. Cluster Size of Activated Voxels in the Calcarine Fissure
3.4. Lateralization Indices
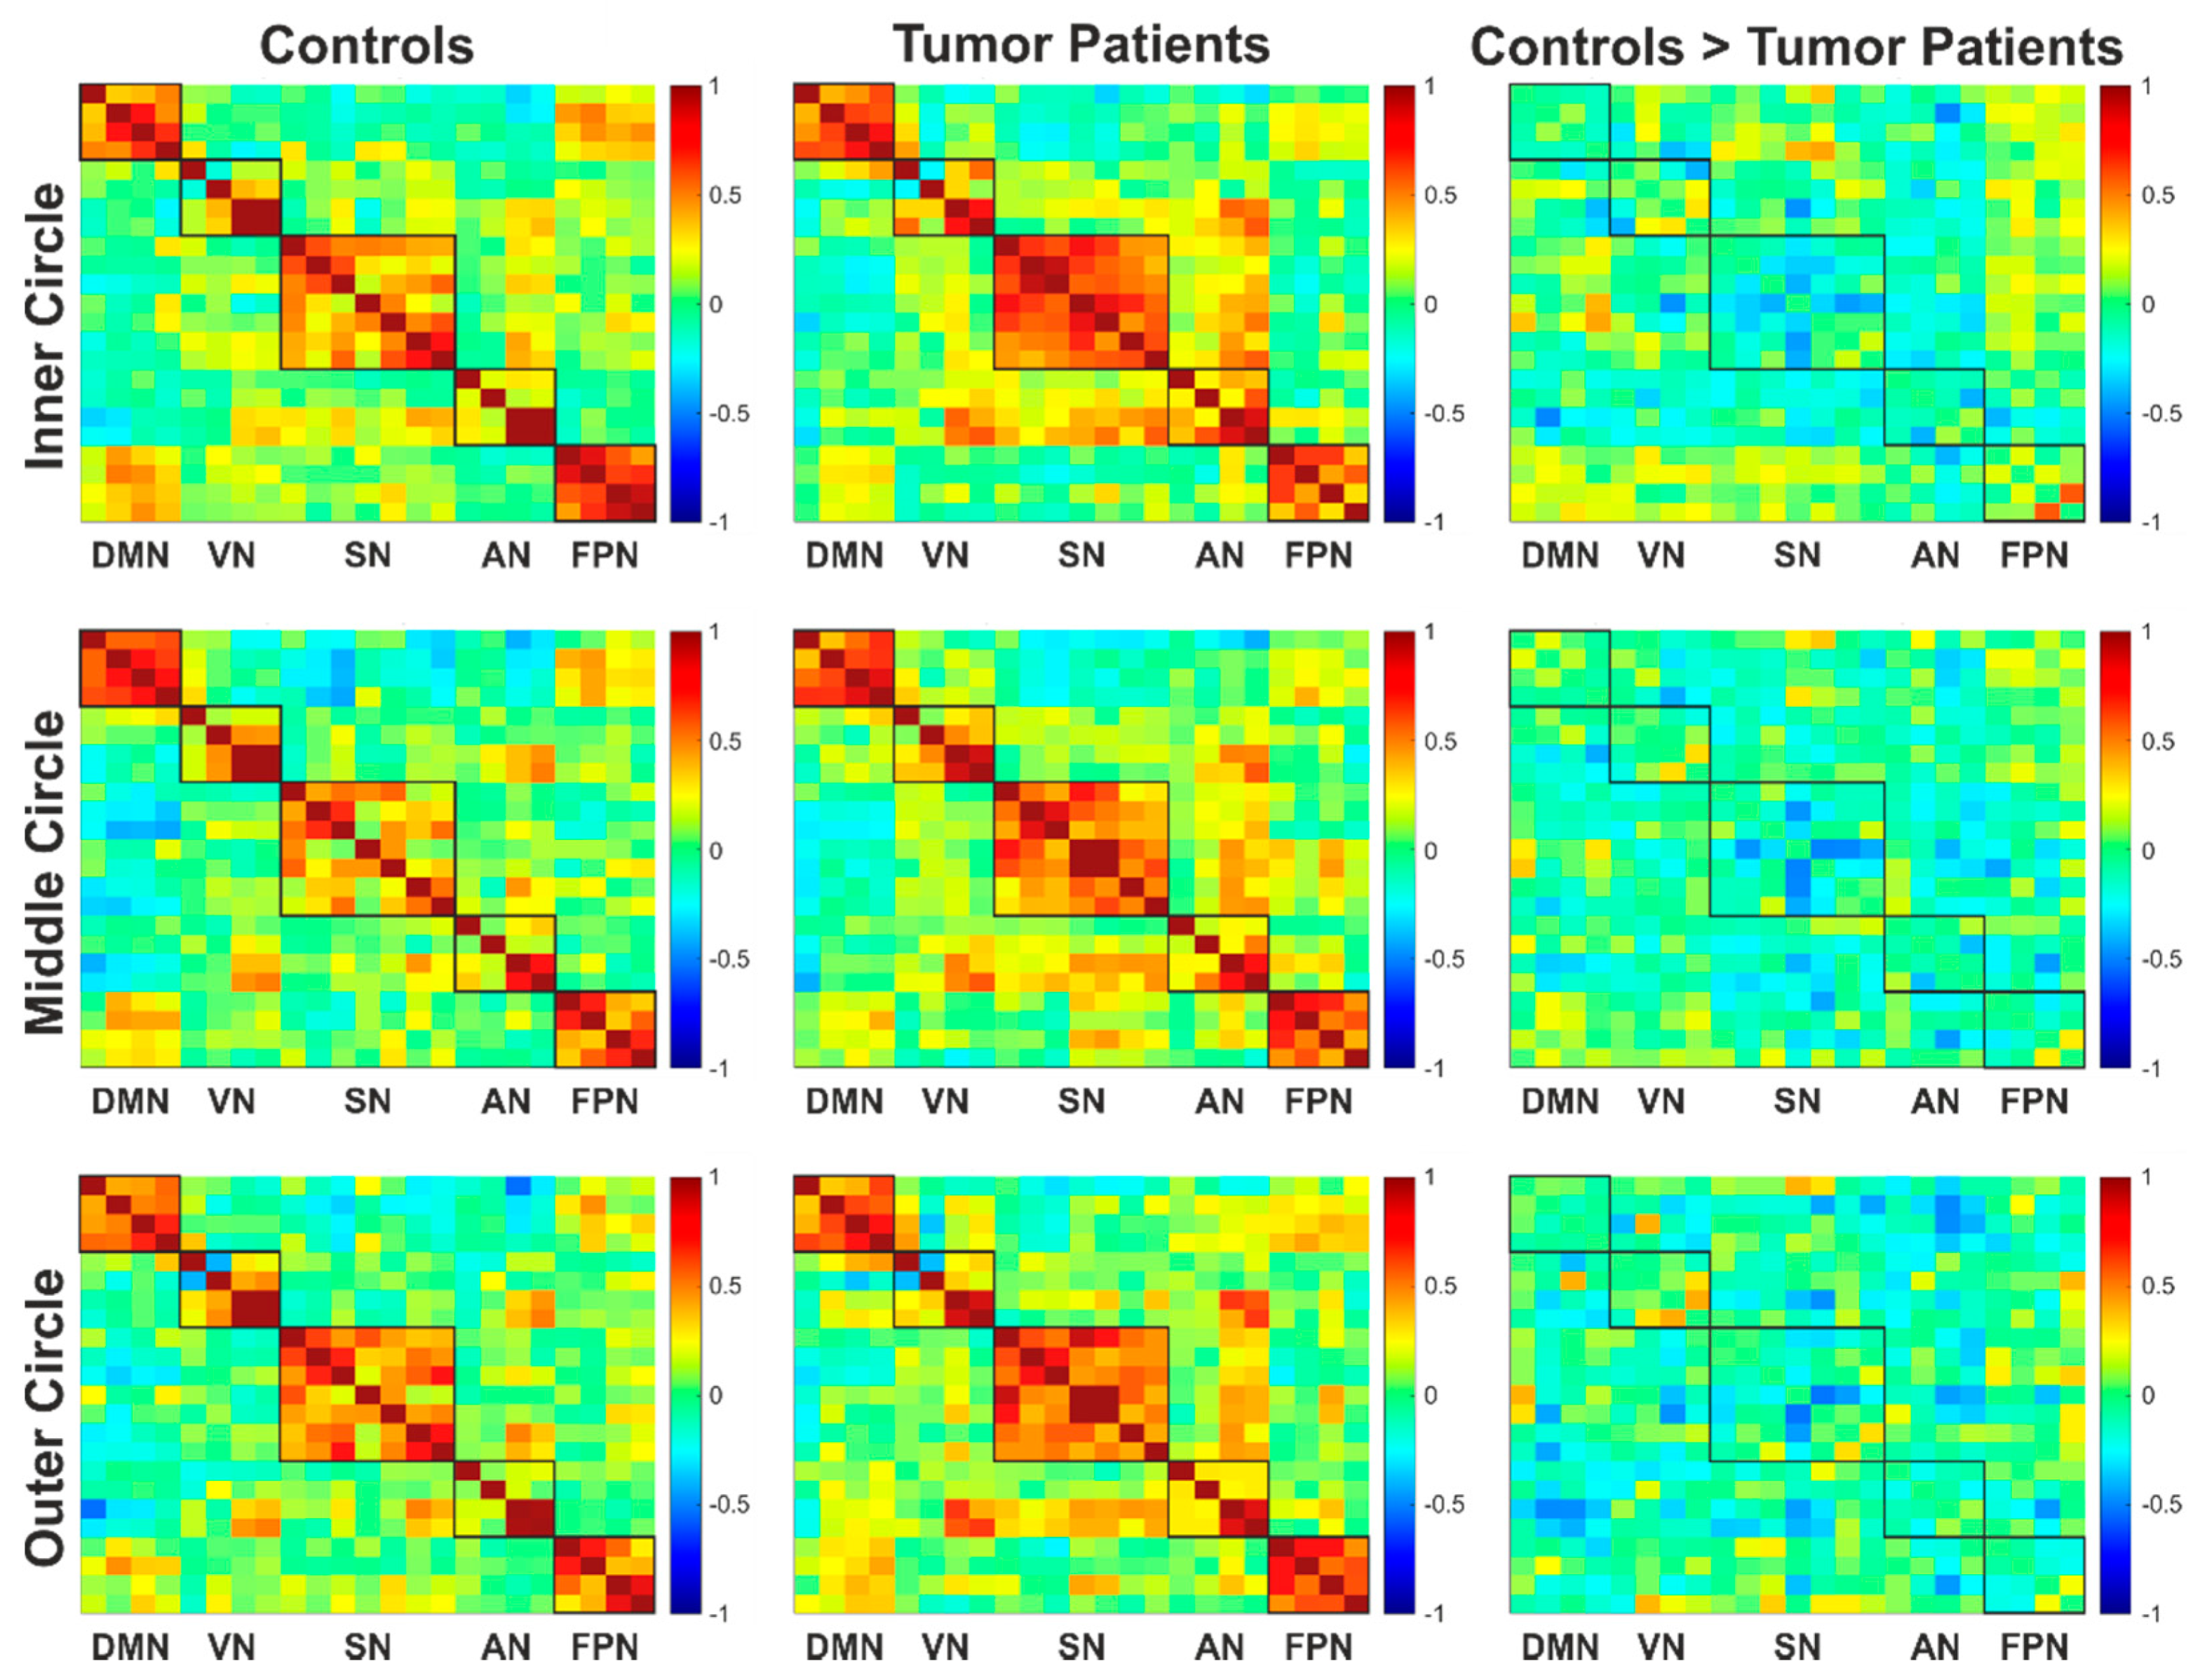
3.5. Functional Connectivity
4. Discussion
5. Conclusions
Author Contributions
Funding
Institutional Review Board Statement
Informed Consent Statement
Data Availability Statement
Conflicts of Interest
References
- Bergo, E.; Lombardi, G.; Guglieri, I.; Capovilla, E.; Pambuku, A.; Zagone, V. Neurocognitive functions and health-related quality of life in glioblastoma patients: A concise review of the literature. Eur. J. Cancer Care 2015, 28, e12410. [Google Scholar] [CrossRef]
- Bogomolny, D.L.; Petrovich, N.M.; Hou, B.L.; Peck, K.K.; Kim, M.J.J.; Holodny, A.I. Functional MRI in the Brain Tumor Patient. Top. Magn. Reson. Imaging 2004, 15, 325–335. [Google Scholar] [CrossRef]
- Håberg, A.; Kvistad, K.A.; Unsgård, G.; Haraldseth, O. Preoperative Blood Oxygen Level-dependent Functional Magnetic Resonance Imaging in Patients with Primary Brain Tumors: Clinical Application and Outcome. Neurosurgery 2004, 54, 902–915. [Google Scholar] [CrossRef]
- Vysotski, S.; Madura, C.; Swan, B.; Holdsworth, R.; Lin, Y.; Munoz Del Rio, A.; Wood, J.; Kundu, B.; Penwarden, A.; Voss, J.; et al. Preoperative FMRI associated with decreased mortality and morbidity in brain tumor patients. Interdiscip. Neurosurg. 2018, 13, 40–45. [Google Scholar] [CrossRef] [PubMed]
- Hirsch, J.; Ruge, M.I.; Kim, K.H.S.; Correa, D.D.; Victor, J.D.; Relkin, N.R.; Labar, D.R.; Krol, G.; Bilsky, M.H.; Souweidane, M.M.; et al. An Integrated Functional Magnetic Resonance Imaging Procedure for Preoperative Mapping of Cortical Areas Associated with Tactile, Motor, Language, and Visual Functions. Neurosurgery 2000, 47, 711–722. [Google Scholar] [CrossRef] [PubMed]
- Holodny, A.I.; Schulder, M.; Liu, W.C.; Wolko, J.; Maldjian, J.A.; Kalnin, A.J. The Effect of Brain Tumors on BOLD Functional MR Imaging Activation in the Adjacent Motor Cortex: Implications for Image-guided Neurosurgery. Am. J. Neuroradiol. 2000, 21, 1415–1422. [Google Scholar]
- Martins Rosa, A.; Silva, M.F.; Ferreira, S.; Murta, J.; Castelo-Branco, M. Plasticity in the human visual cortex: An ophthalmology-based perspective. Biomed Res. Int. 2013, 2013, 568354. [Google Scholar] [CrossRef] [PubMed]
- Ramachandran, V.; Rogers-Ramachandran, D.; Stewart, M. Perceptual correlates of massive cortical reorganization. Science 1992, 258, 1159–1160. [Google Scholar] [CrossRef]
- Righini, A.; de Divitiis, O.; Prinster, A.; Spagnoli, D.; Appollonio, I.; Bello, L.; Scifo, P.; Tomei, G.; Villani, R.; Fazio, F.; et al. Functional MRI: Primary Motor Cortex Localization in Patients with Brain Tumors. J. Comput. Assist. Tomogr. 1996, 20, 702–708. [Google Scholar] [CrossRef]
- Wandell, B.A.; Smirnakis, S.M. Plasticity and stability of visual field maps in adult primary visual cortex. Nat. Rev. Neurosci. 2009, 10, 873. [Google Scholar] [CrossRef]
- Barton, J.J.; Sharpe, J.A.; Raymond, J.E. Retinotopic and directional defects in motion discrimination in humans with cerebral lesions. Ann. Neurol. 1995, 37, 665–675. [Google Scholar] [CrossRef]
- Schlosser, M.J.; McCarthy, G.; Fulbright, R.K.; Gore, J.C.; Awad, I.A. Cerebral vascular malformations adjacent to sensorimotor and visual cortex. Functional magnetic resonance imaging studies before and after therapeutic intervention. Stroke 1997, 28, 1130–1137. [Google Scholar] [CrossRef]
- Roux, F.-E. Perimetric visual field and functional MRI correlation: Implications for image-guided surgery in occipital brain tumours. J. Neurol. Neurosurg. Psychiatry 2001, 71, 505–514. [Google Scholar] [CrossRef][Green Version]
- Tharin, S.; Golby, A. Functional brain mapping and its applications to neurosurgery. Neurosurgery 2007, 60, 185–201; discussion 201–202. [Google Scholar] [CrossRef] [PubMed][Green Version]
- Weng, H.-H.; Noll, K.R.; Johnson, J.M.; Prabhu, S.S.; Tsai, Y.-H.; Chang, S.-W.; Huang, Y.-C.; Lee, J.-D.; Yang, J.-T.; Yang, C.-T.; et al. Accuracy of Presurgical Functional MR Imaging for Language Mapping of Brain Tumors: A Systematic Review and Meta-Analysis. Radiology 2018, 286, 512–523. [Google Scholar] [CrossRef]
- Kapsalakis, I.Z.; Kapsalaki, E.Z.; Gotsis, E.D.; Verganelakis, D.; Toulas, P.; Hadjigeorgiou, G.; Chung, I.; Fezoulidis, I.; Papadimitriou, A.; Robinson, J.S.; et al. Preoperative evaluation with FMRI of patients with intracranial gliomas. Radiol. Res. Pract. 2012, 2012, 727810. [Google Scholar] [CrossRef] [PubMed]
- Ostrom, Q.T.; Cioffi, G.; Gittleman, H.; Patil, N.; Waite, K.; Kruchko, C.; Barnholtz-Sloan, J.S. CBTRUS Statistical Report: Primary Brain and Other Central Nervous System Tumors Diagnosed in the United States in 2012–2016. Neuro-Oncology 2019, 21. [Google Scholar] [CrossRef] [PubMed]
- DeYoe, E.A.; Carman, G.J.; Bandettini, P.; Glickman, S.; Wieser, J.; Cox, R.; Miller, D.; Neitz, J. Mapping striate and extrastriate visual areas in human cerebral cortex. Proc. Natl. Acad. Sci. USA 1996, 93, 2382–2386. [Google Scholar] [CrossRef]
- Dougherty, R.F.; Koch, V.M.; Brewer, A.A.; Fischer, B.; Modersitzki, J.; Wandell, B.A. Visual field representations and locations of visual areas V1/2/3 in human visual cortex. J. Vis. 2003, 3, 586–598. [Google Scholar] [CrossRef]
- Dumoulin, S.O.; Hoge, R.D.; Baker, C.L.; Hess, R.F.; Achtman, R.L.; Evans, A.C. Automatic volumetric segmentation of human visual retinotopic cortex. Neuroimage 2003, 18, 576–587. [Google Scholar] [CrossRef][Green Version]
- Engel, S. Retinotopic organization in human visual cortex and the spatial precision of functional MRI. Cerebral Cortex 1997, 7, 181–192. [Google Scholar] [CrossRef] [PubMed]
- Sereno, M.; Dale, A.; Reppas, J.; Kwong, K.; Belliveau, J.; Brady, T.; Rosen, B.; Tootell, R. Borders of multiple visual areas in humans revealed by functional magnetic resonance imaging. Science 1995, 268, 889–893. [Google Scholar] [CrossRef] [PubMed]
- Wandell, B.A.; Dumoulin, S.O.; Brewer, A.A. Visual field maps in human cortex. Neuron 2007, 56, 366–383. [Google Scholar] [CrossRef] [PubMed]
- Evans, K.; Law, S.K.; Walt, J.; Buchholz, P.; Hansen, J. The quality of life impact of peripheral versus central vision loss with a focus on glaucoma versus age-related macular degeneration. Clin. Ophthalmol. 2009, 3, 433–445. [Google Scholar] [CrossRef]
- Chen, C.M.; Hou, B.L.; Holodny, A.I. Effect of age and tumor grade on BOLD functional MR imaging in preoperative assessment of patients with glioma. Radiology 2008, 248, 971–978. [Google Scholar] [CrossRef]
- Holodny, A.I.; Schulder, M.; Liu, W.C.; Maldjian, J.A.; Kalnin, A.J. Decreased BOLD functional MR activation of the motor and sensory cortices adjacent to a glioblastoma multiforme: Implications for image-guided neurosurgery. AJNR Am. J. Neuroradiol. 1999, 20, 609–612. [Google Scholar] [PubMed]
- Hou, B.L.; Bradbury, M.; Peck, K.K.; Petrovich, N.M.; Gutin, P.H.; Holodny, A.I. Effect of brain tumor neovasculature defined by rCBV on BOLD fMRI activation volume in the primary motor cortex. Neuroimage 2006, 32, 489–497. [Google Scholar] [CrossRef]
- Liu, W.-C.; Feldman, S.C.; Schulder, M.; Kalnin, A.J.; Holodny, A.I.; Zimmerman, A.; Sinensky, R.; Rao, S. The effect of tumour type and distance on activation in the motor cortex. Neuroradiology 2005, 47, 813–819. [Google Scholar] [CrossRef]
- Zacà, D.; Jovicich, J.; Nadar, S.R.; Voyvodic, J.T.; Pillai, J.J. Cerebrovascular reactivity mapping in patients with low grade gliomas undergoing presurgical sensorimotor mapping with BOLD fMRI. J. Magn. Reson. Imaging 2014, 40, 383–390. [Google Scholar] [CrossRef]
- Bressler, S.L. Understanding Cognition through Large-Scale Cortical Networks. Curr. Dir. Psychol. Sci. 2002, 11, 58–61. [Google Scholar] [CrossRef]
- Friston, K.J. Functional and effective connectivity in neuroimaging: A synthesis. Hum. Brain Mapp. 1994, 2, 56–78. [Google Scholar] [CrossRef]
- Sporns, O.; Tononi, G.; Kötter, R. The human connectome: A structural description of the human brain. PLoS Comput. Biol. 2005, 1, e42. [Google Scholar] [CrossRef] [PubMed]
- Martino, J.; Honma, S.M.; Findlay, A.M.; Guggisberg, A.G.; Owen, J.P.; Kirsch, H.E.; Berger, M.S.; Nagarajan, S.S. Resting functional connectivity in patients with brain tumors in eloquent areas. Ann. Neurol. 2011, 69, 521–532. [Google Scholar] [CrossRef] [PubMed]
- Bartolomei, F.; Bosma, I.; Klein, M.; Baayen, J.C.; Reijneveld, J.C.; Postma, T.J.; Heimans, J.J.; van Dijk, B.W.; de Munck, J.C.; de Jongh, A.; et al. Disturbed functional connectivity in brain tumour patients: Evaluation by graph analysis of synchronization matrices. Clin. Neurophysiol. 2006, 117, 2039–2049. [Google Scholar] [CrossRef] [PubMed]
- Bartolomei, F.; Bosma, I.; Klein, M.; Baayen, J.C.; Reijneveld, J.C.; Postma, T.J.; Heimans, J.J.; van Dijk, B.W.; de Munck, J.C.; de Jongh, A.; et al. How do brain tumors alter functional connectivity? A magnetoencephalography study. Ann. Neurol. 2006, 59, 128–138. [Google Scholar] [CrossRef]
- Catalino, M.P.; Yao, S.; Green, D.L.; Laws, E.R.; Golby, A.J.; Tie, Y. Mapping cognitive and emotional networks in neurosurgical patients using resting-state functional magnetic resonance imaging. Neurosurg. Focus 2020, 48, E9. [Google Scholar] [CrossRef]
- Hart, M.G.; Price, S.J.; Suckling, J. Functional connectivity networks for preoperative brain mapping in neurosurgery. J. Neurosurg. 2017, 126, 1941–1950. [Google Scholar] [CrossRef]
- Metwali, H.; Samii, A. Seed-Based Connectivity Analysis of Resting-State fMRI in Patients with Brain Tumors: A Feasibility Study. World Neurosurg. 2019, 128, e165–e176. [Google Scholar] [CrossRef]
- Harris, R.J.; Bookheimer, S.Y.; Cloughesy, T.F.; Kim, H.J.; Pope, W.B.; Lai, A.; Nghiemphu, P.L.; Liau, L.M.; Ellingson, B.M. Altered functional connectivity of the default mode network in diffuse gliomas measured with pseudo-resting state fMRI. J. Neurooncol. 2014, 116, 373–379. [Google Scholar] [CrossRef]
- Stoecklein, V.M.; Stoecklein, S.; Galiè, F.; Ren, J.; Schmutzer, M.; Unterrainer, M.; Albert, N.L.; Kreth, F.-W.; Thon, N.; Liebig, T.; et al. Resting-state fMRI Detects Alterations in Whole Brain Connectivity Related to Tumor Biology in Glioma Patients. Neuro Oncol. 2020. [Google Scholar] [CrossRef]
- Yu, C.; Liu, Y.; Li, J.; Zhou, Y.; Wang, K.; Tian, L.; Qin, W.; Jiang, T.; Li, K. Altered functional connectivity of primary visual cortex in early blindness. Hum. Brain Mapp. 2008, 29, 533–543. [Google Scholar] [CrossRef]
- Dai, H.; Morelli, J.N.; Ai, F.; Yin, D.; Hu, C.; Xu, D.; Li, Y. Resting-state functional MRI: Functional connectivity analysis of the visual cortex in primary open-angle glaucoma patients. Hum. Brain Mapp. 2013, 34, 2455–2463. [Google Scholar] [CrossRef] [PubMed]
- Ying, J.; Li, C.; Yuan, T.; Jin, L.; Wang, R.; Zuo, Z.; Zhang, Y. Increased resting-state functional connectivity in suprasellar tumor patients with postoperative visual improvement. Int. J. Med. Sci. 2019, 16, 1245–1253. [Google Scholar] [CrossRef]
- Speckter, H.; Bido, J.; Hernandez, G.; Rivera, D.; Suazo, L.; Valenzuela, S.; Escoto, R.; Oviedo, J.; Gonzalez, C.F.; Foerster, B.; et al. Adaptation of visual cortex to damage of visual pathways in suprasellar tumors before and after gamma knife radiosurgery. J. Neurooncol. 2019, 142, 275–282. [Google Scholar] [CrossRef] [PubMed]
- Ying, J.; Yuan, T.; Jin, L.; Li, C.; Gui, S.; Wang, R.; Zuo, Z.; Zhang, Y. Brain Morphometric and Functional Magnetic Resonance Imaging Study on Patients with Visual Field Defects Resulting from Suprasellar Tumors: Preoperative and Postoperative Assessment. World Neurosurg. 2020, 134, e353–e359. [Google Scholar] [CrossRef]
- Plank, T.; Frolo, J.; Farzana, F.; Brandl-Rühle, S.; Renner, A.B.; Greenlee, M.W. Neural correlates of visual search in patients with hereditary retinal dystrophies. Hum. Brain Mapp. 2013, 34, 2607–2623. [Google Scholar] [CrossRef] [PubMed]
- Plank, T.; Frolo, J.; Brandl-Rühle, S.; Renner, A.B.; Jägle, H.; Greenlee, M.W. fMRI with Central Vision Loss: Effects of Fixation Locus and Stimulus Type. Optom. Vis. Sci. 2017, 94, 297–310. [Google Scholar] [CrossRef] [PubMed]
- Plank, T.; Frolo, J.; Brandl-Rühle, S.; Renner, A.B.; Hufendiek, K.; Helbig, H.; Greenlee, M.W. Gray matter alterations in visual cortex of patients with loss of central vision due to hereditary retinal dystrophies. Neuroimage 2011, 56, 1556–1565. [Google Scholar] [CrossRef]
- Tzourio-Mazoyer, N.; Landeau, B.; Papathanassiou, D.; Crivello, F.; Etard, O.; Delcroix, N.; Mazoyer, B.; Joliot, M. Automated anatomical labeling of activations in SPM using a macroscopic anatomical parcellation of the MNI MRI single-subject brain. Neuroimage 2002, 15, 273–289. [Google Scholar] [CrossRef]
- Brett, M.; Anton, J.L.; Valabregue, R.; Poline, J.B. Region of interest analysis using an SPM toolbox. Neuroimage 2002, 16, 497. [Google Scholar]
- Maldjian, J.A.; Laurienti, P.J.; Burdette, J.H. Precentral gyrus discrepancy in electronic versions of the Talairach atlas. Neuroimage 2004, 21, 450–455. [Google Scholar] [CrossRef]
- Maldjian, J.A.; Laurienti, P.J.; Kraft, R.A.; Burdette, J.H. An automated method for neuroanatomic and cytoarchitectonic atlas-based interrogation of fMRI data sets. Neuroimage 2003, 19, 1233–1239. [Google Scholar] [CrossRef]
- Eickhoff, S.B.; Heim, S.; Zilles, K.; Amunts, K. Testing anatomically specified hypotheses in functional imaging using cytoarchitectonic maps. NeuroImage 2006, 32, 570–582. [Google Scholar] [CrossRef] [PubMed]
- Eickhoff, S.B.; Paus, T.; Caspers, S.; Grosbras, M.-H.; Evans, A.C.; Zilles, K.; Amunts, K. Assignment of functional activations to probabilistic cytoarchitectonic areas revisited. Neuroimage 2007, 36, 511–521. [Google Scholar] [CrossRef] [PubMed]
- Eickhoff, S.B.; Stephan, K.E.; Mohlberg, H.; Grefkes, C.; Fink, G.R.; Amunts, K.; Zilles, K. A new SPM toolbox for combining probabilistic cytoarchitectonic maps and functional imaging data. Neuroimage 2005, 25, 1325–1335. [Google Scholar] [CrossRef] [PubMed]
- Wilke, M.; Lidzba, K. LI-tool: A new toolbox to assess lateralization in functional MR-data. J. Neurosci. Methods 2007, 163, 128–136. [Google Scholar] [CrossRef]
- Wilke, M.; Schmithorst, V.J. A combined bootstrap/histogram analysis approach for computing a lateralization index from neuroimaging data. Neuroimage 2006, 33, 522–530. [Google Scholar] [CrossRef]
- Whitfield-Gabrieli, S.; Nieto-Castanon, A. Conn: A functional connectivity toolbox for correlated and anticorrelated brain networks. Brain Connect. 2012, 2, 125–141. [Google Scholar] [CrossRef]
- Weissenbacher, A.; Kasess, C.; Gerstl, F.; Lanzenberger, R.; Moser, E.; Windischberger, C. Correlations and anticorrelations in resting-state functional connectivity MRI: A quantitative comparison of preprocessing strategies. Neuroimage 2009, 47, 1408–1416. [Google Scholar] [CrossRef]
- Schreiber, A.; Hubbe, U.; Ziyeh, S.; Hennig, J. The influence of gliomas and nonglial space-occupying lesions on blood-oxygen-level-dependent contrast enhancement. AJNR Am. J. Neuroradiol. 2000, 21, 1055–1063. [Google Scholar]
- Esposito, R.; Mattei, P.A.; Briganti, C.; Romani, G.L.; Tartaro, A.; Caulo, M. Modifications of default-mode network connectivity in patients with cerebral glioma. PLoS ONE 2012, 7, e40231. [Google Scholar] [CrossRef]
- Pillai, J.J.; Mikulis, D.J. Cerebrovascular reactivity mapping: An evolving standard for clinical functional imaging. AJNR Am. J. Neuroradiol. 2015, 36, 7–13. [Google Scholar] [CrossRef]
- DeYoe, E.A.; Raut, R.V. Visual mapping using blood oxygen level dependent functional magnetic resonance imaging. Neuroimaging Clin. 2014, 24, 573–584. [Google Scholar] [CrossRef] [PubMed]
- Black, D.F.; Little, J.T.; Johnson, D.R. Neuroanatomical Considerations in Preoperative Functional Brain Mapping. Top. Magn. Reson. Imaging 2019, 28, 213–224. [Google Scholar] [CrossRef] [PubMed]


| Subject | Sex | Age | Diagnosis | Hemisphere | Location | Volume (mm3) | Visual Field Defects |
|---|---|---|---|---|---|---|---|
| P1 | f | 52 | GBM | left | parieto- occipital | 50,597.7 | HH on the right side |
| P2 | m | 73 | GBM | right | temporo- occipital | 64,816.4 | HH on the left side Improvement after the surgery |
| P3 | f | 8 | Pilocytic astrocytoma | right | occipital | 2233.3 | incomplete HVL in the lower left quadrant |
| P4 | m | 48 | Cavernoma | right | occipital | 1506.8 | HVL in the upper left quadrant |
| P5 | f | 40 | Ependymoma | right | parieto- occipital | 9688.0 | no loss of visual field |
| P6 | m | 60 | Metastasis | left | occipital | 6146.5 | Restrictions in the visual field coming from the temporal side |
| P7 | f | 48 | Metastasis | right | occipital | 4684.1 | incomplete HVL in the lower right quadrant |
| P8 | f | 74 | GBM | right | occipital | 3589.6 | HH on the left side |
| P9 | f | 29 | Cavernoma | left | occipital | 432.5 | n.a. |
| P10 | m | 43 | GBM | left | occipital | 3452.0 | HVL in the lower right quadrant |
| P11 | f | 71 | GBM | left | temporo- occipital | 12,436.3 | HH on the right side |
| P12 | f | 31 | CNS inflammatory tissue | right | occipital | 1236.3 | n.a. |
| P13 | f | 70 | Cavernoma | left | occipital | 818.8 | n.a. |
| P14 | m | 24 | AVM | left | occipital | 29,976.6 | n.a. |
| P15 | f | 46 | AVM | left | occipital | 345.7 | no loss of visual field |
| P16 | m | 47 | GBM | right | temporo- occipital | 8361.6 | incomplete HVL in the lower left quadrant |
| P17 | f | 60 | GBM | right | parieto- occipital | 5811.4 | n.a. |
| P18 | m | 12 | Ganglioglioma | left | occipital | 1761.4 | unspecific visual field losses in the inferior area |
| P19 | f | 34 | AVM | left | parieto- occipital | n.a. | |
| C1 | f | 52 | - | - | - | - | |
| C2 | f | 71 | - | - | - | - | |
| C3 | f | 23 | - | - | - | - | |
| C4 | m | 45 | - | - | - | - | |
| C5 | f | 38 | - | - | - | - | |
| C6 | m | 60 | - | - | - | - | |
| C7 | f | 51 | - | - | - | - | |
| C8 | m | 83 | - | - | - | - | |
| C9 | m | 28 | - | - | - | - | |
| C10 | m | 40 | - | - | - | - | |
| C11 | m | 71 | - | - | - | - | |
| C12 | f | 34 | - | - | - | - | |
| C13 | f | 68 | - | - | - | - | |
| C14 | f | 23 | - | - | - | - | |
| C15 | m | 40 | - | - | - | - | |
| C16 | f | 51 | - | - | - | - | |
| C17 | f | 61 | - | - | - | - | |
| C18 | m | 13 | - | - | - | - | |
| C19 | f | 34 | - | - | - | - |
| Group | Eccentricity | Cluster | T | MNI Coordinates | Brain Regions | |||
|---|---|---|---|---|---|---|---|---|
| Size | PFDR | x | y | z | ||||
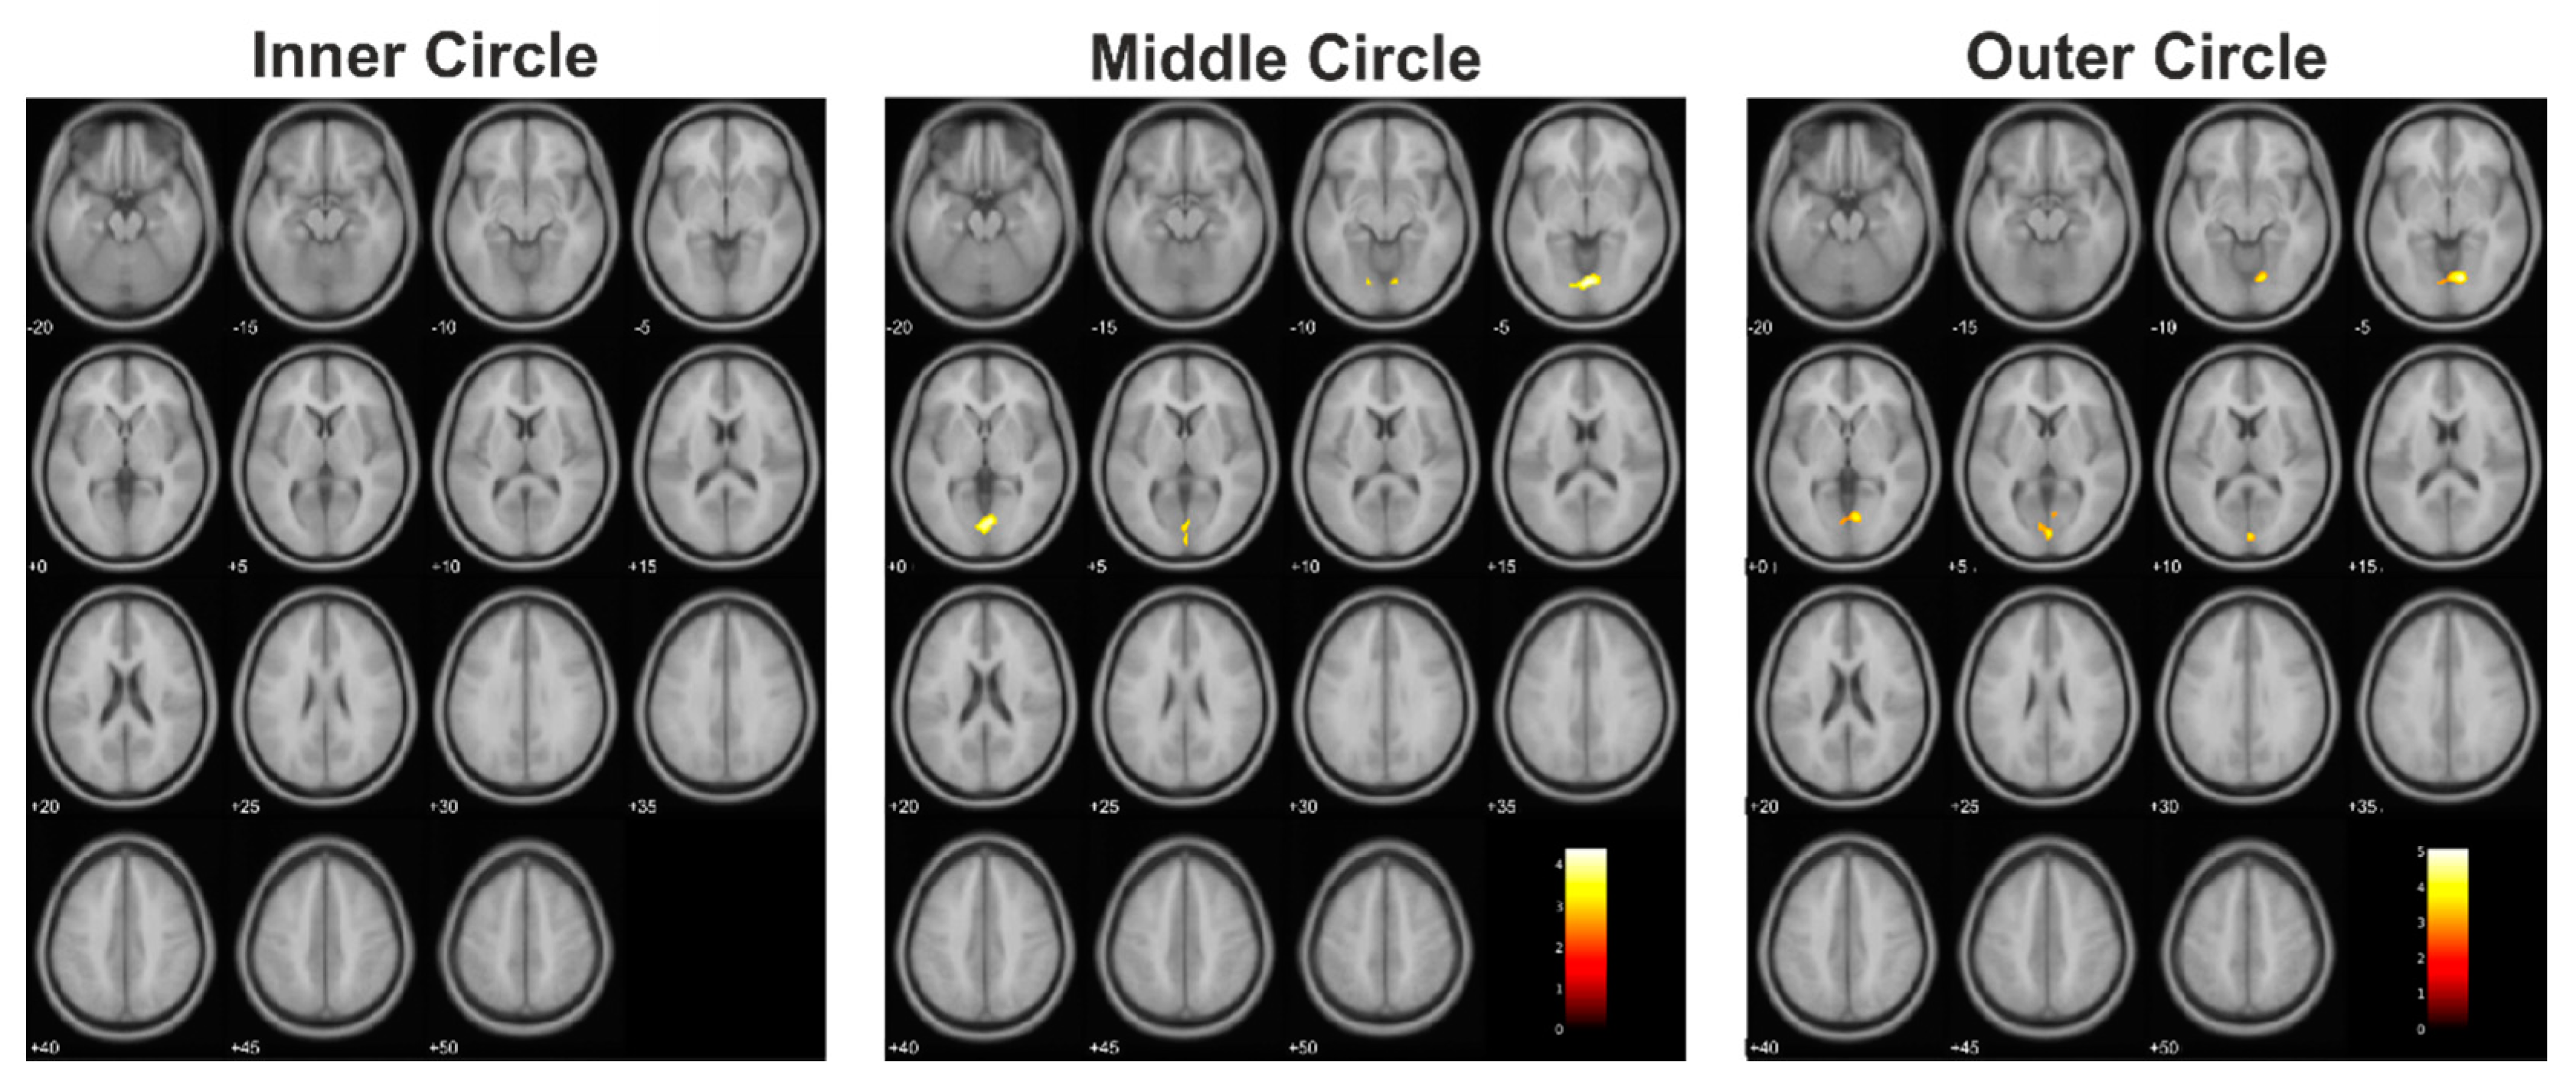
| Controls > Tumor | Inner circle | 0 | ||||||
| Middle circle | 344 | 0.006 | 4.39 | 2 | −76 | −4 | CF (B), LG (B), Vermis | |
| Outer circle | 323 | 0.047 | 5.08 | 14 | −72 | −6 | CF (B), LG (B), Vermis, Cuneus (L) | |
| Controls > Lesion | Inner circle | 912 | 0.004 | 8.23 | −16 | −82 | 26 | SOG (L), Cuneus (L), MOG (L), CF (L), SPG (L) |
| Middle circle | 614 | 0.002 | 8.47 | −18 | −38 | −16 | FG (L), PHG (L), LG (L), CER (L) | |
| 1293 | <0.001 | 6.98 | 22 | −60 | 18 | CF (B), LG (B), Precuneus (R), Cuneus (R), SOG (R) | ||
| 991 | <0.001 | 6.67 | −14 | −94 | 20 | SOG (L), Cuneus (L), MOG (L), Precuneus (L), SPG (L), CF (L), IPG (L) | ||
| 806 | 0.001 | 5.67 | −42 | 4 | −12 | Insula (L), STG (L), PrG (L), PoG (L), RO (L), IFG (L), TP (L), HG (L), Putamen (L) | ||
| Outer circle | 642 | 0.024 | 8.61 | 12 | −78 | 4 | CF (B), LG (B), Cuneus (R), Precuneus (R) | |
| 570 | 0.024 | 6.49 | −16 | −84 | 26 | SOG (L), Cuneus (L), CF (L), Precuneus (L), SPG (L) | ||
Publisher’s Note: MDPI stays neutral with regard to jurisdictional claims in published maps and institutional affiliations. |
© 2021 by the authors. Licensee MDPI, Basel, Switzerland. This article is an open access article distributed under the terms and conditions of the Creative Commons Attribution (CC BY) license (https://creativecommons.org/licenses/by/4.0/).
Share and Cite
Hense, K.; Plank, T.; Wendl, C.; Dodoo-Schittko, F.; Bumes, E.; Greenlee, M.W.; Schmidt, N.O.; Proescholdt, M.; Rosengarth, K. fMRI Retinotopic Mapping in Patients with Brain Tumors and Space-Occupying Brain Lesions in the Area of the Occipital Lobe. Cancers 2021, 13, 2439. https://doi.org/10.3390/cancers13102439
Hense K, Plank T, Wendl C, Dodoo-Schittko F, Bumes E, Greenlee MW, Schmidt NO, Proescholdt M, Rosengarth K. fMRI Retinotopic Mapping in Patients with Brain Tumors and Space-Occupying Brain Lesions in the Area of the Occipital Lobe. Cancers. 2021; 13(10):2439. https://doi.org/10.3390/cancers13102439
Chicago/Turabian StyleHense, Katharina, Tina Plank, Christina Wendl, Frank Dodoo-Schittko, Elisabeth Bumes, Mark W. Greenlee, Nils Ole Schmidt, Martin Proescholdt, and Katharina Rosengarth. 2021. "fMRI Retinotopic Mapping in Patients with Brain Tumors and Space-Occupying Brain Lesions in the Area of the Occipital Lobe" Cancers 13, no. 10: 2439. https://doi.org/10.3390/cancers13102439
APA StyleHense, K., Plank, T., Wendl, C., Dodoo-Schittko, F., Bumes, E., Greenlee, M. W., Schmidt, N. O., Proescholdt, M., & Rosengarth, K. (2021). fMRI Retinotopic Mapping in Patients with Brain Tumors and Space-Occupying Brain Lesions in the Area of the Occipital Lobe. Cancers, 13(10), 2439. https://doi.org/10.3390/cancers13102439