Hypermethylation of SCAND3 and Myo1g Gene Are Potential Diagnostic Biomarkers for Hepatocellular Carcinoma

 , ,
, ,
Abstract
1. Introduction
2. Results
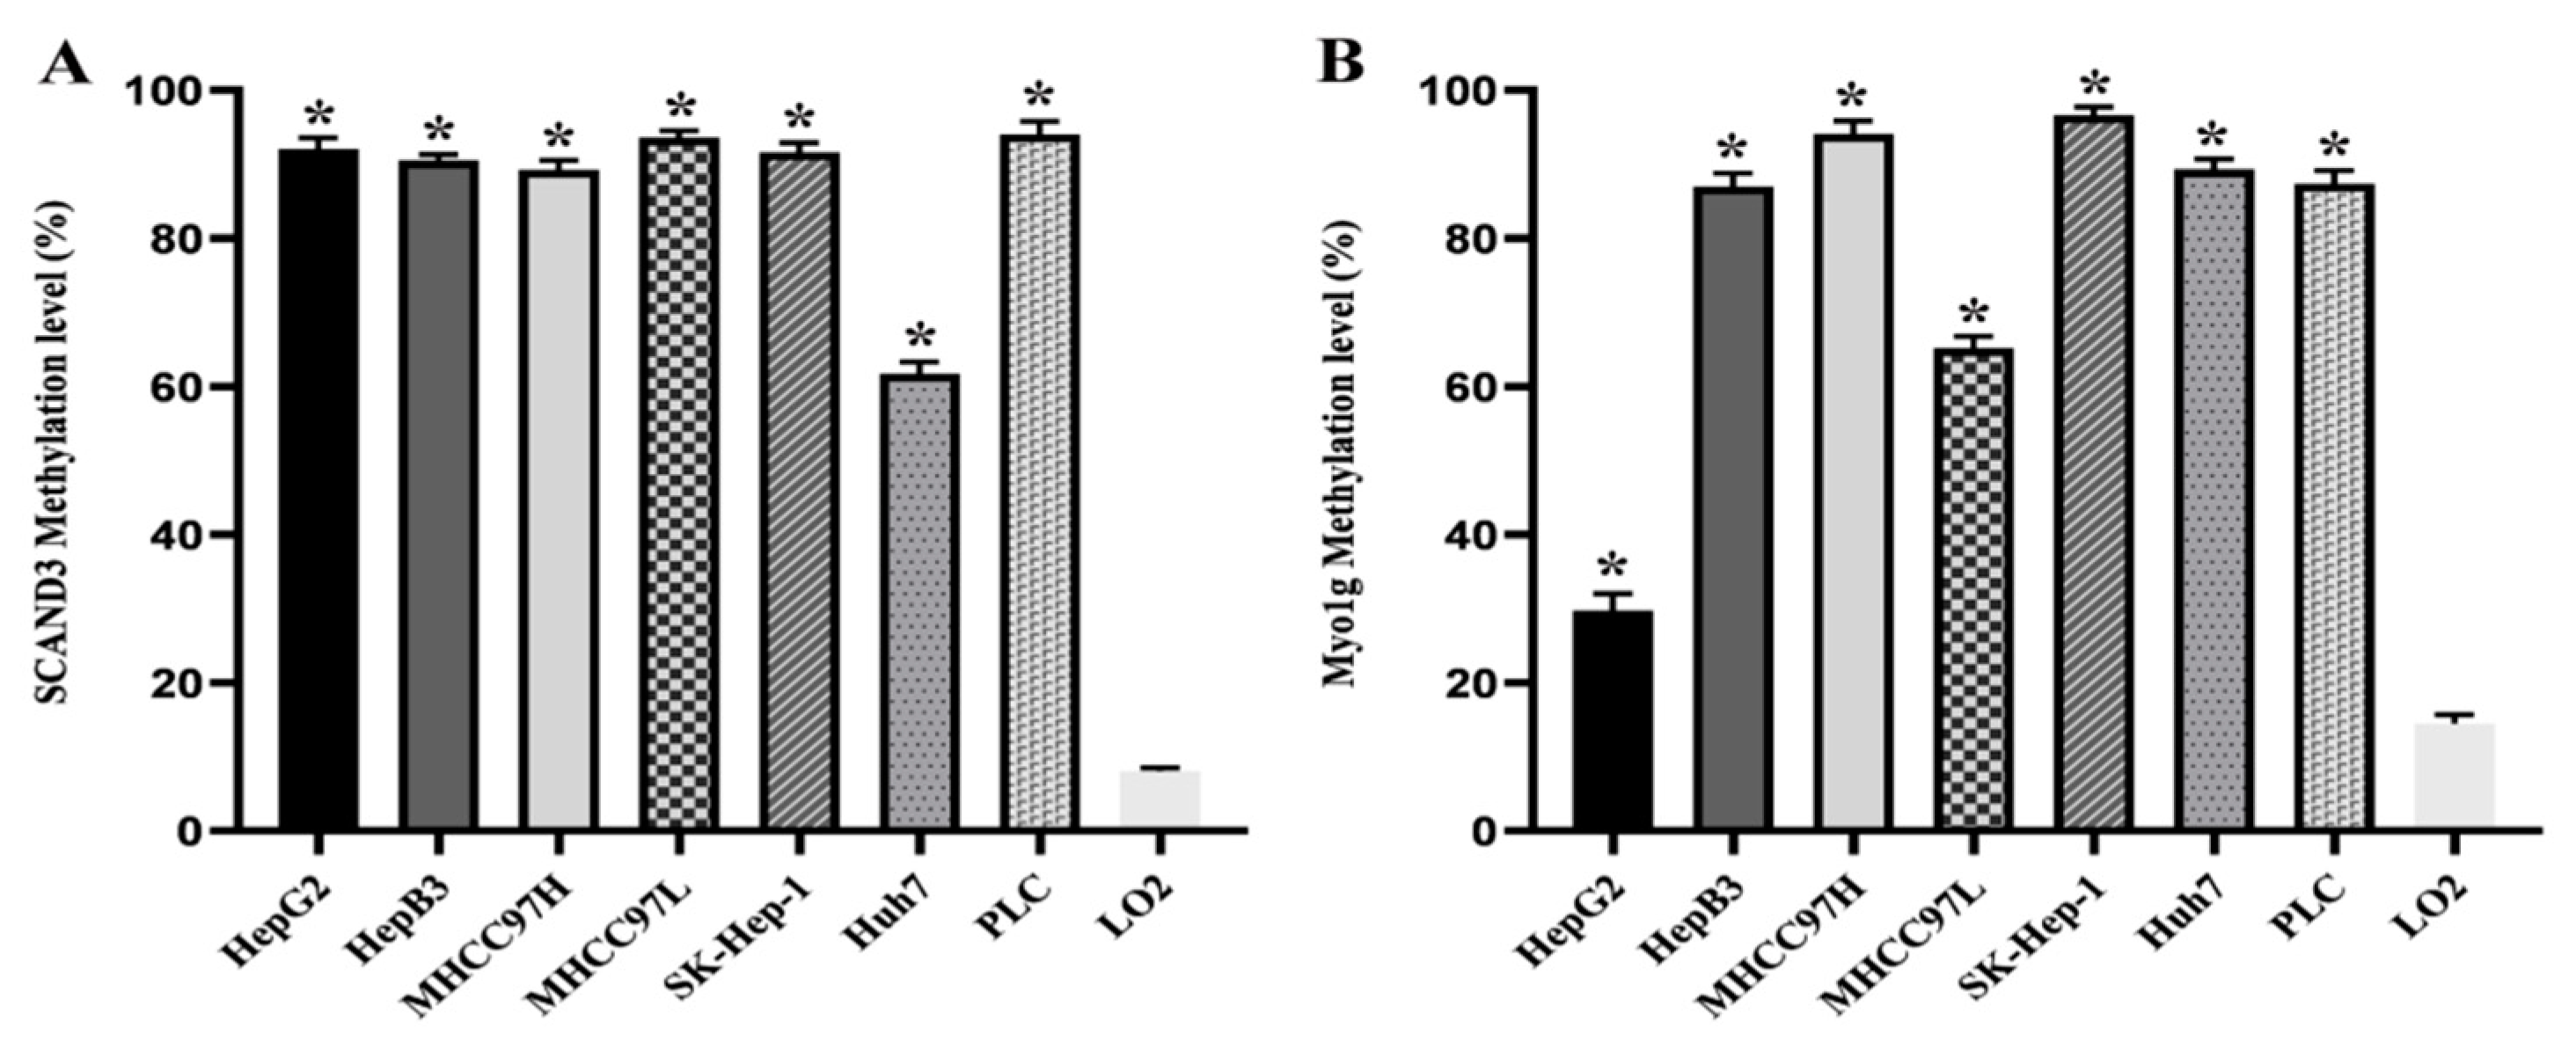
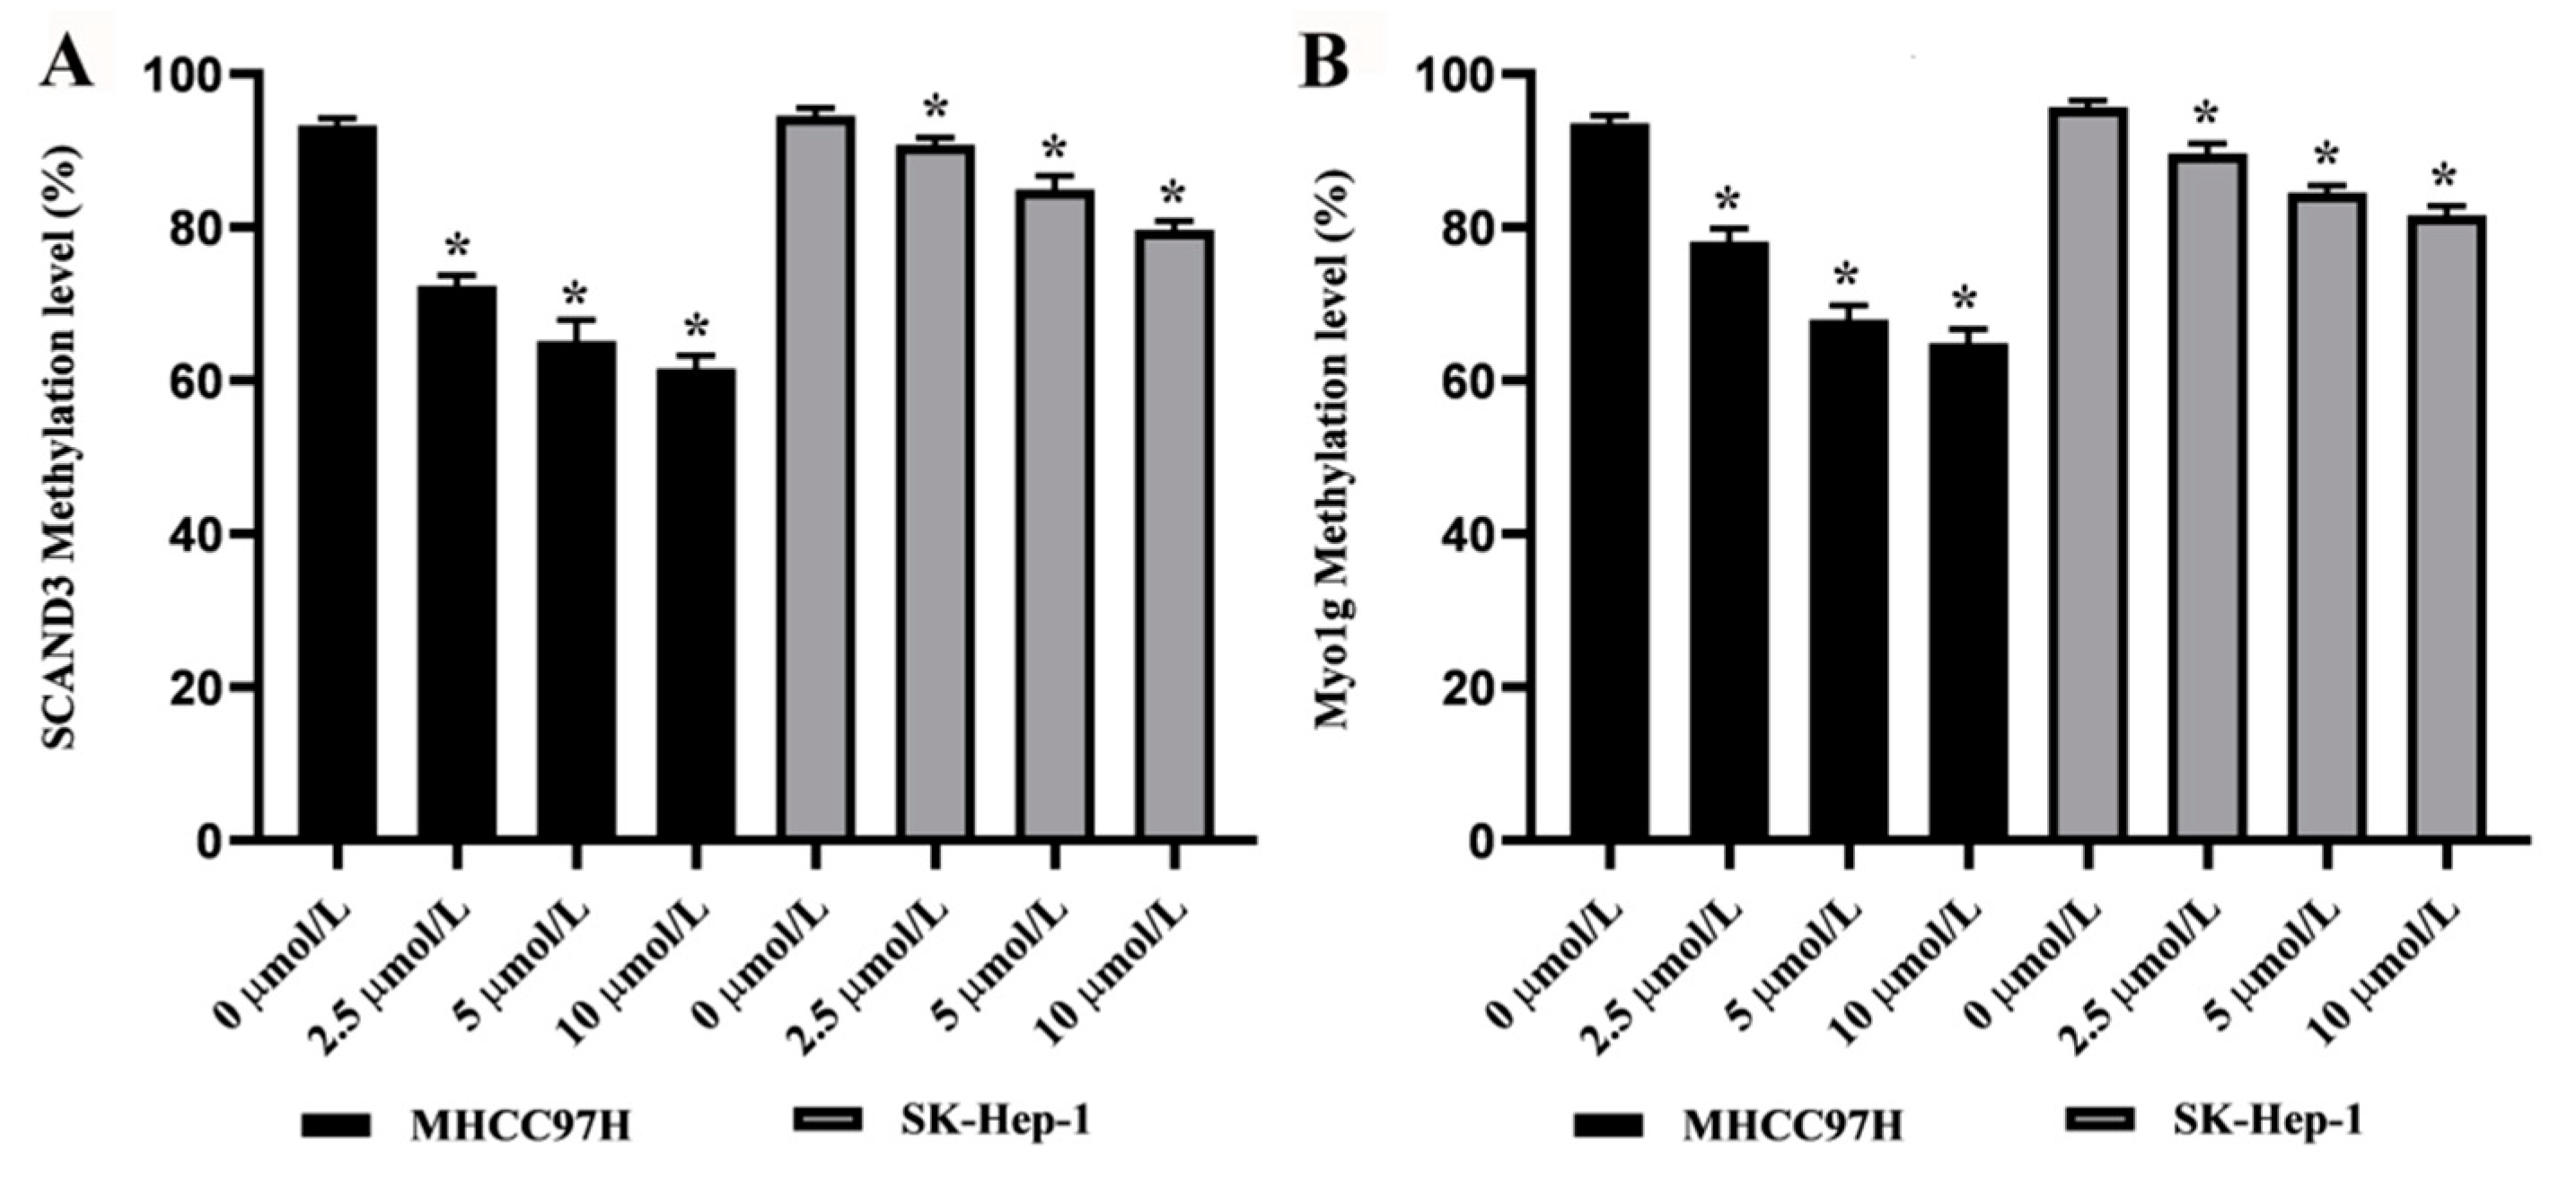
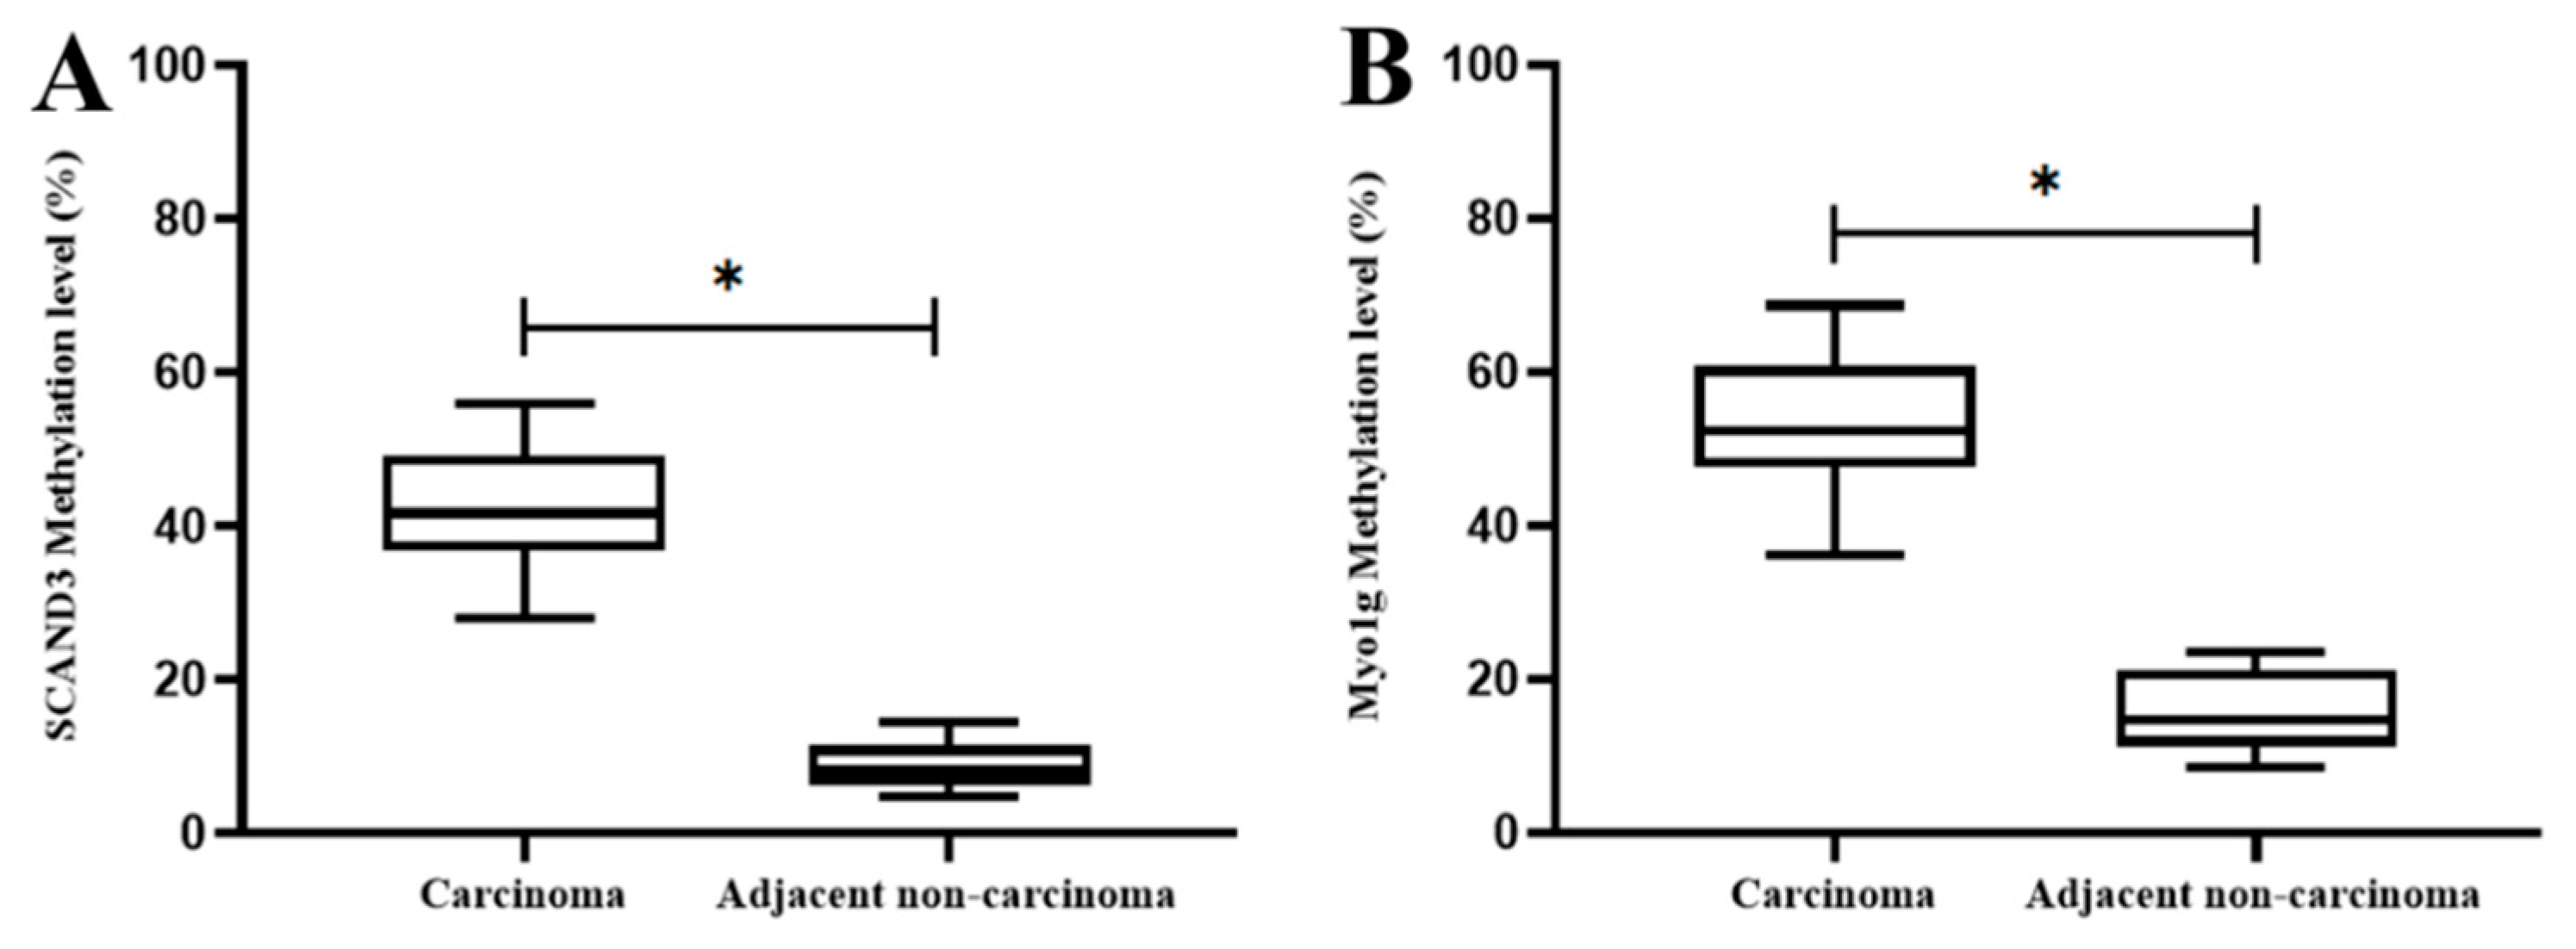
2.1. DNA Methylation Levels of SCAND3 and Myo1g in HCC Cell Lines and HCC Tissue Samples
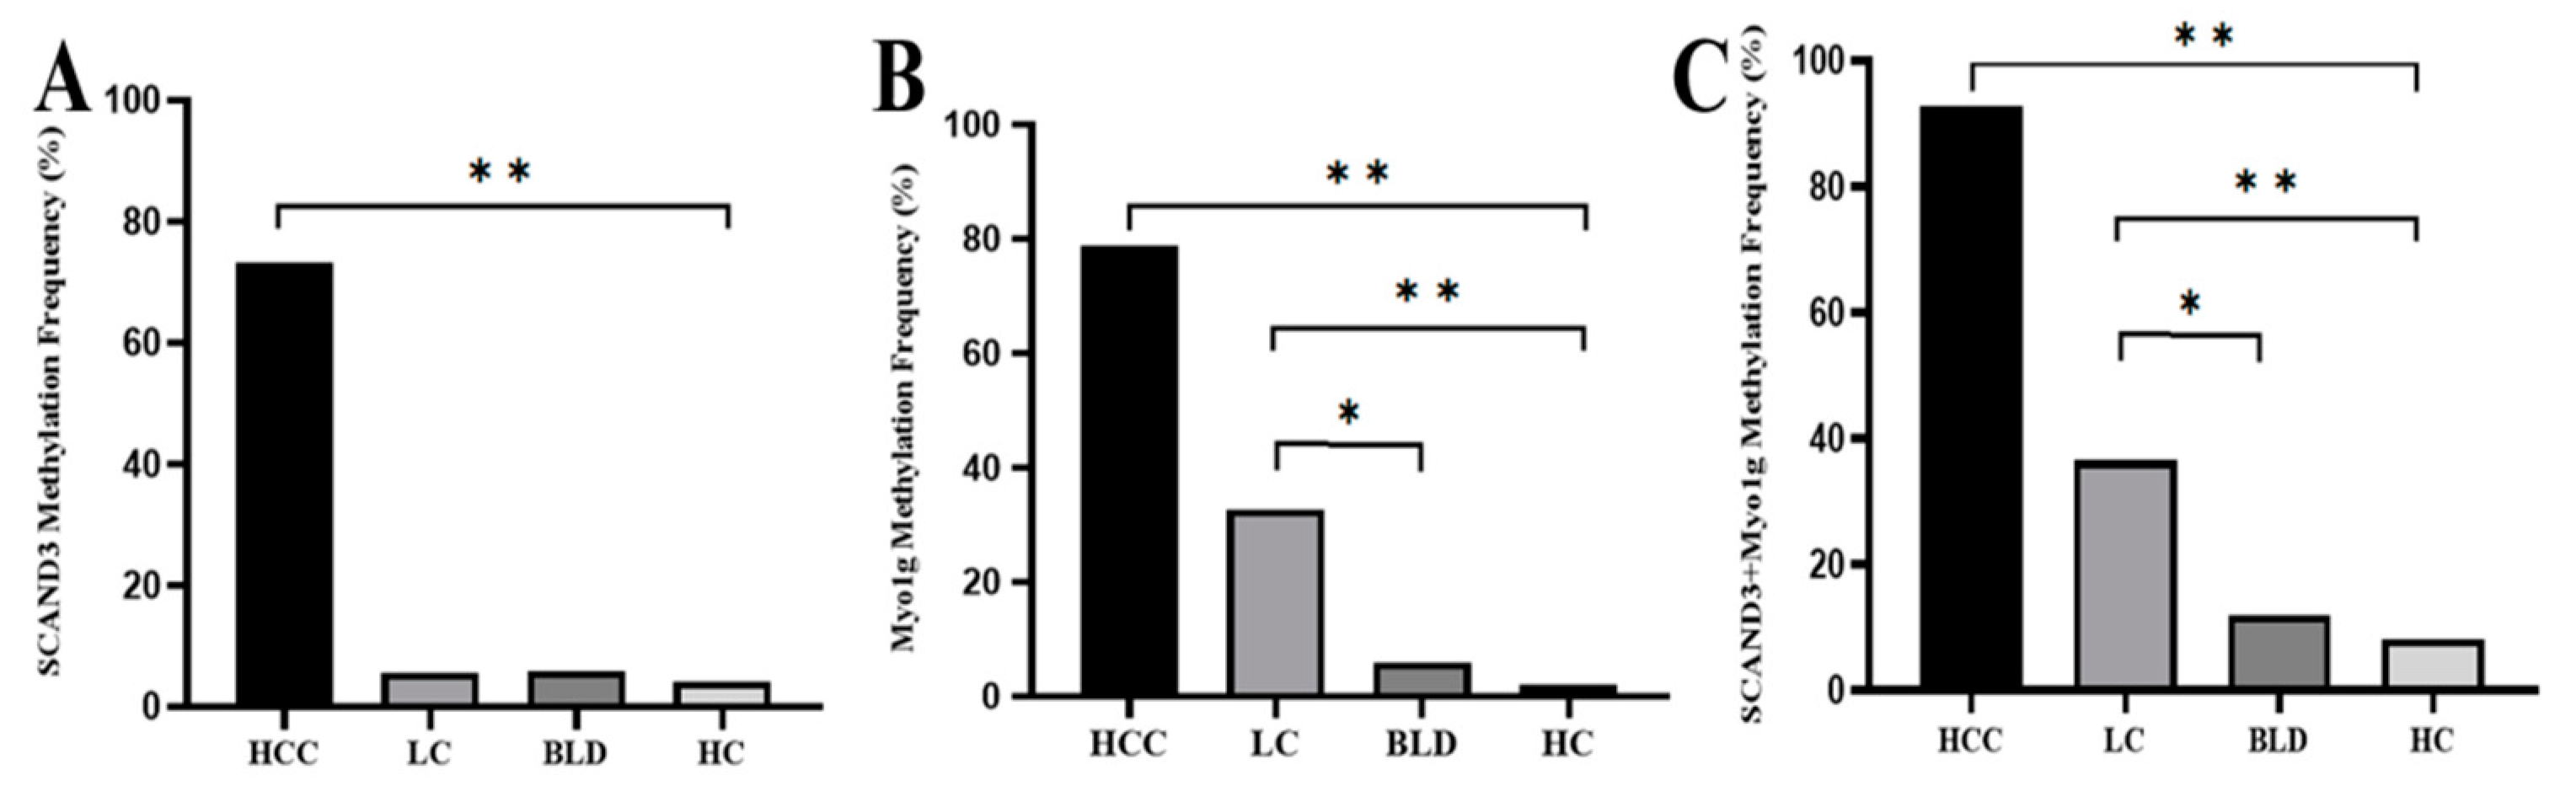
2.2. Serum DNA Methylation Levels of SCAND3 and Myo1g in Different Groups
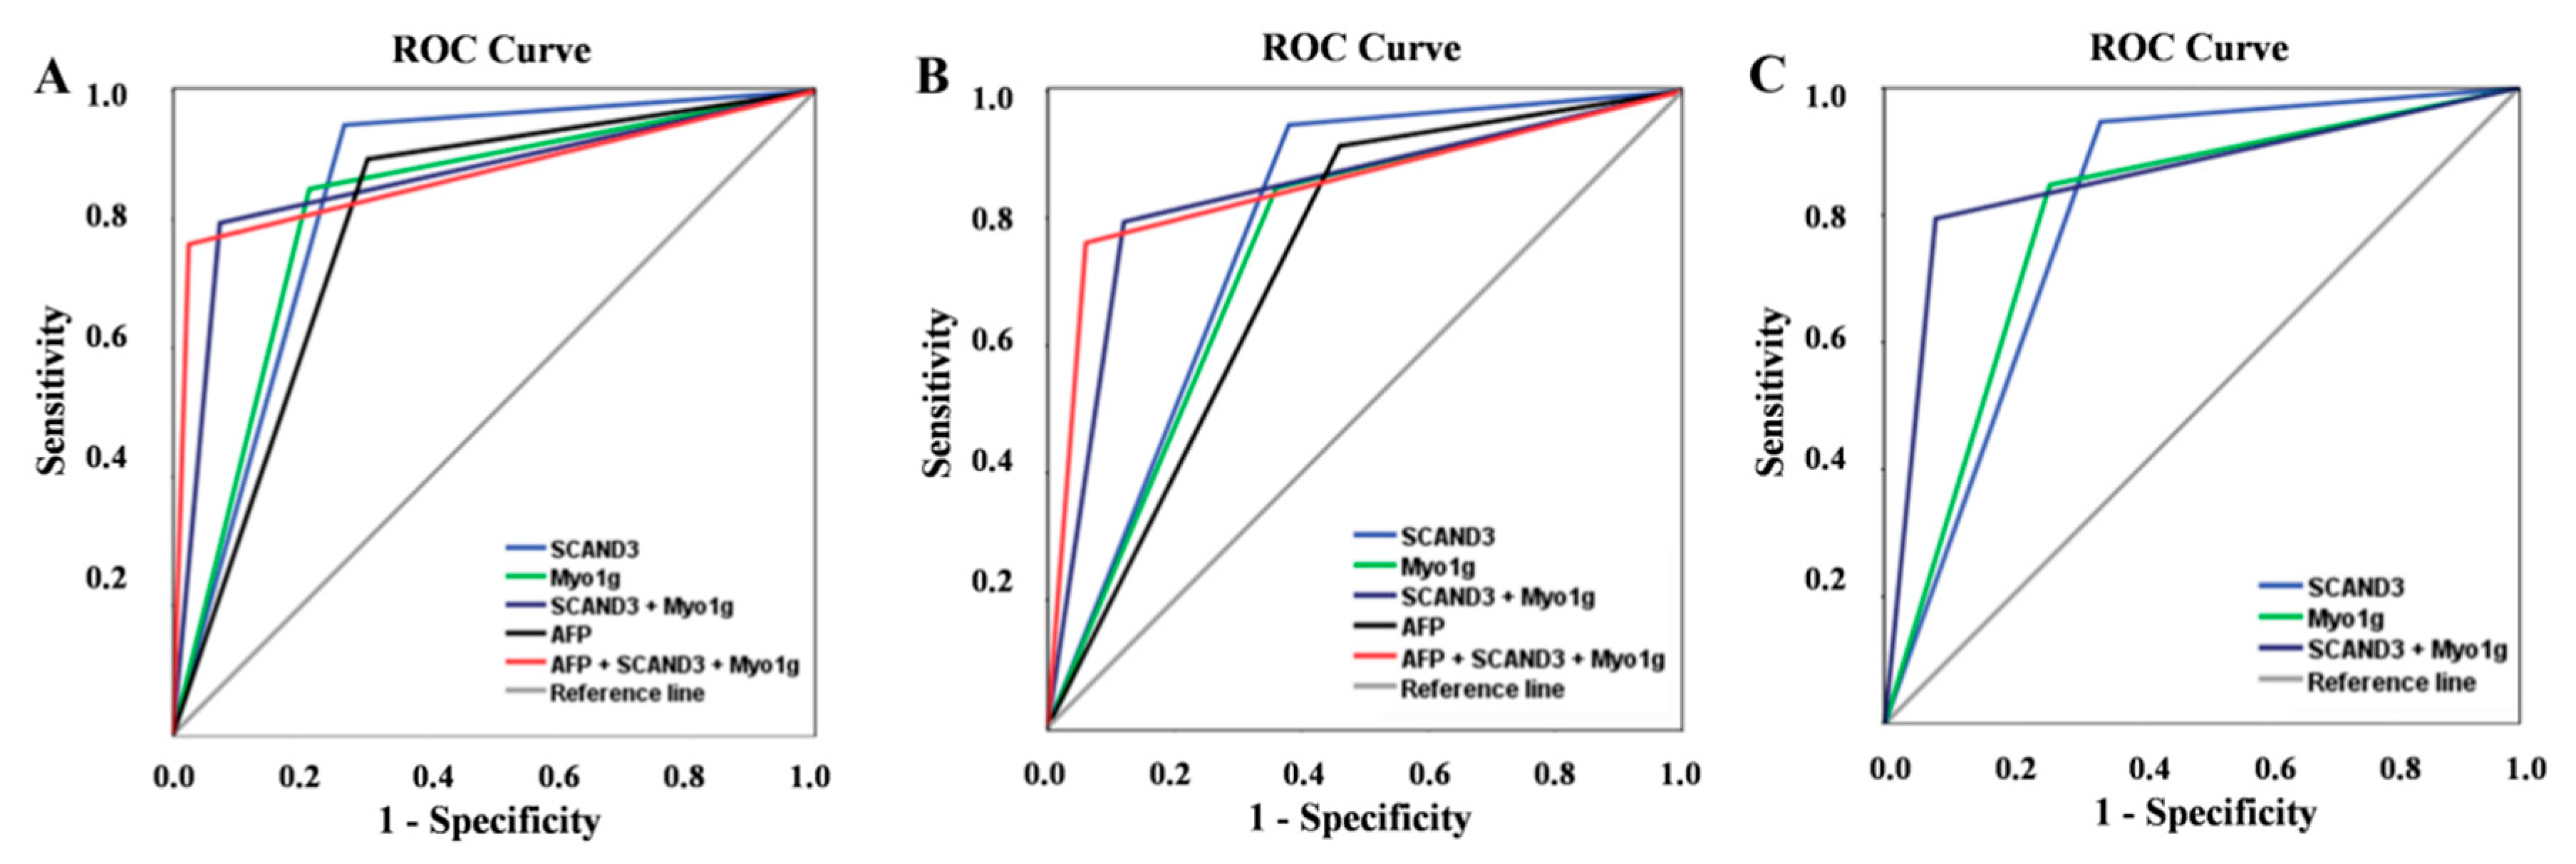
2.3. Diagnostic Values of AFP and Methylation Markers in HCC
2.4. Diagnostic Values of AFP and Methylation Markers in Early HCC
2.5. Diagnostic Values of Methylation Markers in AFP-Negative HCC Patients
2.6. Association between Methylation Markers and HCC Clinicopathological Features
3. Discussion
4. Materials and Methods
4.1. Cell Lines and Tissue Specimens
4.2. Study Population and Blood Sample Collection
4.3. DNA Isolation and Bisulfite Conversion
4.4. Digital Droplet PCR and Methylation-Specific Polymerase Chain Reaction
4.5. Statistical Methods
5. Conclusions
Supplementary Materials
Author Contributions
Funding
Conflicts of Interest
References
- Bruix, J.; Sherman, M. Management of hepatocellular carcinoma: An update. Hepatology 2011, 53, 1020–1022. [Google Scholar] [CrossRef] [PubMed]
- Bray, F.; Ferlay, J.; Soerjomataram, I.; Siegel, R.L.; Torre, L.A.; Jemal, A. Global cancer statistics 2018: GLOBOCAN estimates of incidence and mortality worldwide for 36 cancers in 185 countries. CA 2018, 68, 394–424. [Google Scholar] [CrossRef] [PubMed]
- Colli, A.; Fraquelli, M.; Casazza, G.; Massironi, S.; Colucci, A.; Conte, D.; Duca, P. Accuracy of Ultrasonography, Spiral CT, Magnetic Resonance, and Alpha-Fetoprotein in Diagnosing Hepatocellular Carcinoma: A Systematic Review. Am. J. Gastroenterol. 2006, 101, 513. [Google Scholar] [CrossRef] [PubMed]
- Giannini, E.G.; Simona, M.; Giacomo, B.; Vincenzo, S.; Fabio, F.; Paolo, D.P.; Gian Ludovico, R.; Maria, A.D.N.; Luisa, B.; Marco, Z. Alpha-fetoprotein has no prognostic role in small hepatocellular carcinoma identified during surveillance in compensated cirrhosis. Hepatology 2012, 56, 1371–1379. [Google Scholar] [CrossRef]
- Caviglia, G.P.; Ribaldone, D.G.; Abate, M.L.; Ciancio, A.; Pellicano, R.; Smedile, A.; Saracco, G.M. Performance of protein induced by vitamin K absence or antagonist-II assessed by chemiluminescence enzyme immunoassay for hepatocellular carcinoma detection: A meta-analysis. Scand. J. Gastroenterol. 2018, 53, 1–7. [Google Scholar] [CrossRef]
- European Association for The Study of The Liver; European Organisation for Research and Treatment of Cancer. EASL–EORTC Clinical Practice Guidelines: Management of hepatocellular carcinoma. J. Hepatol. 2012, 56, 908–943. [Google Scholar] [CrossRef]
- Baylin, S.B.; Jones, P.A. Epigenetic Determinants of Cancer. Cold Spring Harb. Perspect. Biol. 2016, 8, a019505. [Google Scholar] [CrossRef]
- Gerda, E.; Gangning, L.; Ana, A.; Jones, P.A. Epigenetics in human disease and prospects for epigenetic therapy. Nature 2004, 429, 457–463. [Google Scholar]
- Hao, X.; Luo, H.; Krawczyk, M.; Wei, W.; Wang, W.; Wang, J.; Flagg, K.; Hou, J.; Zhang, H.; Yi, S. DNA methylation markers for diagnosis and prognosis of common cancers. Proc. Natl. Acad. Sci. USA 2017, 114, 7414–7419. [Google Scholar] [CrossRef]
- Hulbert, A.; Torres, I.J.; Stark, A.; Chen, C.; Rodgers, K.; Lee, B.; Griffin, C.; Yang, A.; Huang, P.; Wrangle, J. Early Detection of Lung Cancer using DNA Promoter Hypermethylation in Plasma and Sputum. Clin. Cancer Res. 2016, 23, 1998–2005. [Google Scholar] [CrossRef]
- Kallioniemi, O. Emerging molecular biomarkers--blood-based strategies to detect and monitor cancer. Nat. Rev. Clin. Oncol. 2011, 8, 142–150. [Google Scholar]
- Liu, Z.J.; Huang, Y.; Wei, L.; He, J.Y.; Liu, Q.Y.; Yu, X.Q.; Li, Z.L.; Zhang, J.; Li, B.; Sun, C.J.; et al. Combination of LINE-1 hypomethylation and RASSF1A promoter hypermethylation in serum DNA is a non-invasion prognostic biomarker for early recurrence of hepatocellular carcinoma after curative resection. Neoplasma 2017, 64, 795–802. [Google Scholar] [CrossRef] [PubMed]
- Pasha, H.F.; Mohamed, R.H.; Radwan, M.I. RASSF1A and SOCS1 genes methylation status as a noninvasive marker for hepatocellular carcinoma. Cancer Biomark. Sect. A Dis. Mark. 2019, 24, 241–247. [Google Scholar] [CrossRef]
- Huan, L.I.; Yao, Q.; Zeng, Z.F. Study on aberrant methylation detection and clinical significance of suppressor gene GSTP1, p16,RIZ1 and RASSF1A in hepatocellular carcinoma. J. Hepatopancreat. Surg. 2014, 10, 2553–2558. [Google Scholar]
- Dong, X.; He, H.; Zhang, W.; Yu, D.; Wang, X.; Chen, Y. Combination of serum RASSF1A methylation and AFP is a promising non-invasive biomarker for HCC patient with chronic HBV infection. Diagn. Pathol. 2015, 10, 133. [Google Scholar] [CrossRef][Green Version]
- Gong, H.Y.; Liu, Z.G.; Zhang, H.Y. Detection of Promoter Hypermethylation of RASSF1A and CDH13 Gene by Nested Methylation Specific Polymerase Chain Reaction in Hepatocellular Carcinoma Patients. Life Sci. Res. 2011, 15, 56–60. [Google Scholar]
- Mansour, L.A.; El Raziky, M.; Mohamed, A.A.; Mahmoud, E.H.; Hamdy, S.; El Sayed, E.H. Circulating Hypermethylated RASSF1A as a Molecular Biomarker for Diagnosis of Hepatocellular Carcinoma. Asian Pac. J. Cancer Prev. 2017, 18, 1637–1643. [Google Scholar]
- Anwar, S.L.; Hasemeier, B.; Schipper, E.; Vogel, A.; Kreipe, H.; Lehmann, U. LINE-1 hypomethylation in human hepatocellular carcinomas correlates with shorter overall survival and CIMP phenotype. PLoS ONE 2019, 14, e0216374. [Google Scholar] [CrossRef]
- Tian, M.M.; Fan, Y.-C.; Zhao, J.; Gao, S.; Zhao, Z.-H.; Chen, L.-Y.; Wang, K. Hepatocellular carcinoma suppressor 1 promoter hypermethylation in serum. A diagnostic and prognostic study in hepatitis B. Clin. Res. Hepatol. Gastroenterol. 2017, 41, 171–180. [Google Scholar] [CrossRef]
- Xu, R.H.; Wei, W.; Krawczyk, M.; Wang, W.; Luo, H.; Flagg, K.; Yi, S.; Shi, W.; Quan, Q.; Li, K. Circulating tumour DNA methylation markers for diagnosis and prognosis of hepatocellular carcinoma. Nat. Mater. 2017, 16, 1155–1158. [Google Scholar] [CrossRef]
- Zhang, C.; Ge, S.; Wang, J.; Jing, X.; Li, H. Epigenomic Profiling of DNA Methylation Reveals New Potential Biomarkers for Hepatocellular Carcinoma Diagnosis and Prognosis Prediction. J. Gastroenterol. Hepatol. 2019, 34, 1869–1877. [Google Scholar] [CrossRef] [PubMed]
- Edelstein, L.C.; Collins, T. The SCAN domain family of zinc finger transcription factors. Gene 2005, 359, 1–17. [Google Scholar] [CrossRef] [PubMed]
- Llorens, C.; Bernet, G.P.; Ramasamy, S.; Feschotte, C.; Moya, A. On the transposon origins of mammalian SCAND3 and KRBA2, two zinc-finger genes carrying an integrase/transposase domain. Mob. Gene. Elem. 2012, 2, 205–210. [Google Scholar] [CrossRef] [PubMed][Green Version]
- Qiu, J.; Peng, B.; Tang, Y.; Qian, Y.; Guo, P.; Li, M.; Luo, J.; Chen, B.; Tang, H.; Lu, C. CpG Methylation Signature Predicts Recurrence in Early-Stage Hepatocellular Carcinoma: Results From a Multicenter Study. J. Clin. Oncol. 2017, 35, 734–742. [Google Scholar] [CrossRef] [PubMed]
- Dart, A.E.; Tollis, S.; Bright, M.D.; Frankel, G.; Endres, R.G. The motor protein myosin 1G functions in Fc?R-mediated phagocytosis. J. Cell Sci. 2012, 125, 6020–6029. [Google Scholar] [CrossRef]
- Li, Y.-R.; Yang, W.-X. Myosins as fundamental components during tumorigenesis: Diverse and indispensable. Oncotarget 2016, 7, 29. [Google Scholar] [CrossRef]
- Ouderkirk-Pecone, J.L.; Goreczny, G.J.; Chase, S.E.; Tatum, A.H.; Krendel, M. Myosin 1e promotes breast cancer malignancy by enhancing tumor cell proliferation and stimulating tumor cell de-differentiation. Oncotarget 2016, 7, 29. [Google Scholar] [CrossRef]
- Letellier, E.; Schmitz, M.; Ginolhac, A.; Rodriguez, F.; Ullmann, P.; Qureshi-Baig, K.; Frasquilho, S.; Antunes, L.; Haan, S. Loss of Myosin Vb in colorectal cancer is a strong prognostic factor for disease recurrence. Br. J. Cancer 2017, 117, 1689–1701. [Google Scholar] [CrossRef]
- Olety, B.; Wälte, M.; Honnert, U.; Schillers, H.; Bähler, M. Myosin 1G (Myo1G) is a haematopoietic specific myosin that localises to the plasma membrane and regulates cell elasticity. FEBS Lett. 2010, 584, 493–499. [Google Scholar] [CrossRef]
- López-Ortega, O.; Ovalle-García, E.; Ortega-Blake, I.; Antillón, A.; Chávez-Munguía, B.; Pati?o-López, G.; Fragoso-Soriano, R.; Santos-Argumedo, L. Myo1g is an active player in maintaining cell stiffness in B-lymphocytes. Cytoskeleton 2016, 73, 258–268. [Google Scholar] [CrossRef]
- Ji, X.F.; Fan, Y.C.; Gao, S.; Yang, Y.; Zhang, J.J.; Wang, K. MT1M and MT1G promoter methylation as biomarkers for hepatocellular carcinoma. World J. Gastroenterol. 2014, 20, 4723–4729. [Google Scholar] [CrossRef]
- Li, F.; Fan, Y.C.; Gao, S.; Sun, F.K.; Yang, Y.; Wang, K. Methylation of serum insulin-like growth factor-binding protein 7 promoter in hepatitis B virus-associated hepatocellular carcinoma. Genes Chromosomes Cancer 2014, 53, 90–97. [Google Scholar] [CrossRef] [PubMed]
- Teng, Y.; Fan, Y.C.; Mu, N.N.; Zhao, J.; Sun, F.K.; Wang, K. Serum SOX11 promoter methylation is a novel biomarker for the diagnosis of Hepatitis B virus-related hepatocellular carcinoma. Neoplasma 2016, 63, 419–426. [Google Scholar] [CrossRef] [PubMed]
- Wang, J.; Qin, Y.; Li, B.; Sun, Z.; Yang, B. Detection of aberrant promoter methylation of GSTP1 in the tumor and serum of Chinese human primary hepatocellular carcinoma patients. Clin. Biochem. 2006, 39, 344–348. [Google Scholar] [CrossRef] [PubMed]
- Yang, Y.; Fan, Y.-C.; Gao, S.; Dou, C.-Y.; Zhang, J.-J.; Sun, F.-K.; Wang, K. Methylated Cysteine Dioxygenase-1 Gene Promoter in the Serum Is a Potential Biomarker for Hepatitis B Virus-Related Hepatocellular Carcinoma. Tohoku J. Exp. Med. 2014, 232, 187–194. [Google Scholar] [CrossRef] [PubMed][Green Version]
- Hu, N.; Fan, X.-P.; Fan, Y.-C.; Chen, L.-Y.; Qiao, C.-Y.; Han, L.-Y.; Wang, K. Hypomethylated Ubiquitin-Conjugating Enzyme2 Q1 (UBE2Q1) Gene Promoter in the Serum Is a Promising Biomarker for Hepatitis B Virus-Associated Hepatocellular Carcinoma. Tohoku J. Exp. Med. 2017, 242, 93–100. [Google Scholar] [CrossRef][Green Version]
- Park, I.Y.; Sohn, B.H.; Yu, E.; Suh, D.J.; Chung, Y.H.; Lee, J.H.; Surzycki, S.J.; Lee, Y.I. Aberrant epigenetic modifications in hepatocarcinogenesis induced by hepatitis B virus X protein. Gastroenterology 2007, 132, 1476–1494. [Google Scholar] [CrossRef]
- Lim, J.S.; Park, S.H.; Jang, K.L. Hepatitis C virus Core protein overcomes stress-induced premature senescence by down-regulating p16 expression via DNA methylation. Cancer Lett. 2012, 321, 154–161. [Google Scholar] [CrossRef]


| Markers | Se (%) | Sp (%) | PPV (%) | NPV (%) | Accuracy (%) | AUC (95% CI) | Kappa |
|---|---|---|---|---|---|---|---|
| AFP | 69.7 | 89.4 | 87.8 | 73.0 | 79.1 | 0.796 (0.744–0.847) | 0.585 |
| SCAND3 | 73.3 | 94.7 | 93.8 | 76.5 | 83.6 | 0.840 (0.794–0.886) | 0.674 |
| Myo1g | 78.8 | 84.8 | 85.0 | 78.5 | 81.6 | 0.818 (0.769–0.867) | 0.633 |
| SCAND3 + Myo1g | 92.2 | 79.5 | 83.2 | 90.2 | 86.2 | 0.861 (0.816–0.906) | 0.720 |
| AFP + SCAND3 + Myo1g | 97.6 | 76.2 | 81.7 | 96.6 | 87.3 | 0.869 (0.825–0.912) | 0.744 |
| Markers | Se (%) | Sp (%) | PPV (%) | NPV (%) | Accuracy (%) | AUC (95% CI) | Kappa |
|---|---|---|---|---|---|---|---|
| AFP | 54 | 89.4 | 62.8 | 85.4 | 80.6 | 0.727 (0.636–0.818) | 0.455 |
| SCAND3 | 62 | 94.7 | 79.5 | 88.3 | 87.1 | 0.784 (0.697–0.870) | 0.612 |
| Myo1g | 64 | 84.8 | 58.2 | 87.7 | 79.6 | 0.744 (0.658–0.830) | 0.472 |
| SCAND3 + Myo1g | 88 | 79.5 | 58.7 | 95.2 | 81.6 | 0.837 (0.773–0.902) | 0.578 |
| AFP + SCAND3 + Myo1g | 94 | 76.2 | 56.6 | 97.5 | 80.6 | 0.851 (0.794–0.908) | 0.575 |
| Markers | Se (%) | Sp (%) | PPV (%) | NPV (%) | Accuracy (%) | AUC (95% CI) | Kappa |
|---|---|---|---|---|---|---|---|
| SCAND3 | 66 | 94.7 | 80.5 | 89.4 | 87.5 | 0.804 (0.720–0.887) | 0.646 |
| Myo1g | 74 | 84.8 | 61.7 | 90.8 | 82.1 | 0.794 (0.715–0.872) | 0.551 |
| SCAND3 + Myo1g | 92 | 79.5 | 59.7 | 96.8 | 82.6 | 0.857 (0.799–0.916) | 0.605 |
| Characteristic | N | SCAND3 | X2 | P | Myo1g | X2 | P | SCAND3 + Myo1g | X2 | P | |||
|---|---|---|---|---|---|---|---|---|---|---|---|---|---|
| UM | M | UM | M | UM | M | ||||||||
| Age (years) | |||||||||||||
| ≤50 | 73 | 20 | 53 | 0.036 | 0.850 | 16 | 57 | 0.039 | 0.843 | 4 | 69 | 0.624 | 0.429 |
| >50 | 92 | 24 | 68 | 19 | 73 | 8 | 84 | ||||||
| Sex | 0.498 | 0.183 | |||||||||||
| Male | 147 | 38 | 109 | 0.459 | 29 | 118 | 1.776 | 11 | 136 | 0.088 | 0.766 | ||
| Female | 18 | 6 | 12 | 6 | 12 | 1 | 17 | ||||||
| Tumor size (cm) | 0.032 * | 0.001 * | |||||||||||
| ≤5 | 64 | 23 | 41 | 4.595 | 22 | 42 | 10.839 | 7 | 57 | 2.082 | 0.149 | ||
| >5 | 101 | 21 | 80 | 13 | 88 | 5 | 96 | ||||||
| Tumor number | |||||||||||||
| Single | 93 | 28 | 65 | 1.29 | 0.256 | 22 | 71 | 0.762 | 0.383 | 9 | 84 | 1.827 | 0.176 |
| multiple | 72 | 16 | 56 | 13 | 59 | 3 | 69 | ||||||
| Lymphatic metastasis | |||||||||||||
| no | 146 | 42 | 107 | 2.860 | 0.091 | 34 | 112 | 3.268 | 0.071 | 11 | 135 | 0.129 | 0.720 |
| yes | 19 | 2 | 17 | 1 | 18 | 1 | 18 | ||||||
| Distant metastasis | |||||||||||||
| no | 149 | 41 | 108 | 0.568 | 0.451 | 32 | 117 | 0.064 | 0.800 | 11 | 138 | 0.027 | 0.868 |
| yes | 16 | 3 | 13 | 3 | 13 | 1 | 15 | ||||||
| BCLC stage | |||||||||||||
| 0 + A | 50 | 19 | 31 | 6.760 | 0.080 | 18 | 32 | 10.277 | 0.016 * | 6 | 44 | 3.177 | 0.365 |
| B + C | 115 | 25 | 90 | 17 | 98 | 6 | 109 | ||||||
| Tumor differentiation | |||||||||||||
| Well-differentiated | 14 | 4 | 10 | 0.072 | 0.789 | 6 | 8 | 0.570 | 1 | 13 | 0.209 | 0.648 | |
| Moderately/poorly differentiated | 62 | 20 | 42 | 20 | 42 | 0.450 | 7 | 55 | |||||
| Vascular invasion | |||||||||||||
| Microvascular invasion | |||||||||||||
| no | 51 | 14 | 37 | 1.233 | 0.269 | 19 | 32 | 0.638 | 4 | 47 | 1.185 | 0.276 | |
| yes | 25 | 10 | 15 | 7 | 18 | 0.424 | 4 | 21 | |||||
| PVTT | |||||||||||||
| no | 122 | 40 | 82 | 8.967 | 0.003 * | 29 | 93 | 1.833 | 11 | 111 | 2.111 | 0.146 | |
| yes | 43 | 4 | 39 | 6 | 37 | 0.176 | 1 | 42 | |||||
| Parameters | SCAND3 | Myo1g | SCAND3+Myo1g | |||||||||
|---|---|---|---|---|---|---|---|---|---|---|---|---|
| Univariate Analysis | Multivariate Analysis | Univariate Analysis | Multivariate Analysis | Univariate Analysis | Multivariate Analysis | |||||||
| OR (95% CI) | P | OR (95% CI) | P | OR (95% CI) | P | OR (95% CI) | P | OR (95% CI) | P | |||
| Age | 1.069 (0.534–2.139) | 0.850 | 1.003 (0.971–1.035) | 0.874 | 0.609 (0.176–2.107) | 0.433 | ||||||
| Sex (Male vs. Female) | 0.697 (0.245–1.987) | 0.500 | 0.492 (0.170–1.420) | 0.189 | 1.375 (0.167–11.322) | 0.767 | ||||||
| AST | 1.007 (0.999–1.014) | 0.086 | 1.004 (0.997–1.011) | 0.277 | 1.014 (0.994–1.035) | 0.169 | ||||||
| ALT | 1.006 (0.998–1.015) | 0.158 | 1.001 (0.997–1.005) | 0.674 | 1.006 (0.990–1.022) | 0.465 | ||||||
| ALB | 0.979 (0.904–1.060) | 0.598 | 0.924 (0.843–1.013) | 0.093 | 0.984 (0.859–1.127) | 0.813 | ||||||
| TBIL | 1.050 (0.997–1.107) | 0.067 | 1.070 (1.004–1.139) | 0.036 | 1.061 (0.996–1.131) | 0.066 | 1.063 (0.961–1.175) | 0.233 | ||||
| PT-INR | 0.460 (0.016–13.646) | 0.653 | 0.443 (0.011–17.114) | 0.663 | 0.406 (0.001–118.815) | 0.756 | ||||||
| Tumor size | 2.137 (1.060–4.309) | 0.034 | 2.066 (0.750–5.687) | 0.160 | 3.546 (1.629–7.719) | 0.001 | 2.851 (0.958–8.481) | 0.050 | 2.358 (0.175–7.778) | 0.159 | ||
| Tumor differentiation | 1.762 (0.642–4.834) | 0.271 | 0.635 (0.194–2.076) | 0.452 | 1.655 (0.187–14.647) | 0.651 | ||||||
| Tumor multiplicity | 1.508 (0.741–3.069) | 0.357 | 1.406 (0.653–3.030) | 0.384 | 2.464 (0.642–9.457) | 0.189 | ||||||
| BCLC staging | 1.540 (1.024–2.318) | 0.038 | 0.838 (0.435–1.615) | 0.597 | 1.948 (1.241–3.058) | 0.004 | 1.182 (0.626–2.230) | 0.607 | 1.687 (0.863–3.296) | 0.126 | ||
| Microvascular invasion | 1.190 (0.332–4.264) | 0.789 | 0.655 (0.231–1.856) | 0.426 | 2.238 (0.510–9.815) | 0.285 | ||||||
| PVTT | 4.756 (1.589–14.235) | 0.005 | 4.74 (1.387–16.240) | 0.013 * | 1.923 (0.738–5.012) | 0.181 | 4.162 (0.521–33.239) | 0.126 | ||||
| AFP | 1.000 (1.000–1.000) | 0.166 | 1.000 (1.000–1.000) | 0.184 | 1.000 (1.000–1.000) | 0.471 | ||||||
| HBV DNA (copies/mL) | 1.000 (1.000–1.000) | 0.732 | 1.000 (1.000–1.000) | 0.218 | 1.000 (1.000–1.000) | 0.594 | ||||||
| Variable | HCC (n = 165) | LC (n = 52) | BLD (n = 50) | HC (n = 49) |
|---|---|---|---|---|
| Age (years) | 52.08 ± 11.74 | 51.58 ± 12.68 | 47.46 ± 14.67 | 39.57 ± 13.40 |
| Gender (male/female) | 147/18 | 42/10 | 32/18 | 21/28 |
| AST (U/L) | 51.80 (14.80–1193.90) | 65.50 (12.00–317.00) | 17.70 (11.50–1.80) | 18.60 (11.60–42.10) |
| ALT (U/L) | 43.40 (9.6–1344.7) | 40.10 (4.00–205.00) | 17.45 (5.00–47.40) | 15.30 (7.00–107.00) |
| TBIL (mg/dl) | 14.90 (4.80–78.30) | 41.85 (7.10–618.00) | NA | NA |
| ALB (g/L) | 42.20 (27.70–52.50) | 37.55 (23.90–50.20) | NA | NA |
| PT-INR | 1.05 (0.65–1.44) | NA | NA | NA |
| HBV DNA (copies/mL) | 2127 (0–1.07E8) | 1259 (0–2.32E8) | NA | NA |
| AFP (ng/mL) | 225.3 (1.38–121.00) | 25.86 (0.5–324.50) | 4.99 (0.60–31.78) | 3.45 (0.56–32.00) |
© 2020 by the authors. Licensee MDPI, Basel, Switzerland. This article is an open access article distributed under the terms and conditions of the Creative Commons Attribution (CC BY) license (http://creativecommons.org/licenses/by/4.0/).
Share and Cite
Xu, F.; Zhang, L.; Xu, Y.; Song, D.; He, W.; Ji, X.; Shao, J. Hypermethylation of SCAND3 and Myo1g Gene Are Potential Diagnostic Biomarkers for Hepatocellular Carcinoma. Cancers 2020, 12, 2332. https://doi.org/10.3390/cancers12082332
Xu F, Zhang L, Xu Y, Song D, He W, Ji X, Shao J. Hypermethylation of SCAND3 and Myo1g Gene Are Potential Diagnostic Biomarkers for Hepatocellular Carcinoma. Cancers. 2020; 12(8):2332. https://doi.org/10.3390/cancers12082332
Chicago/Turabian StyleXu, Fei, Lulu Zhang, Yuxia Xu, Di Song, Wenting He, Xiaomeng Ji, and Jianyong Shao. 2020. "Hypermethylation of SCAND3 and Myo1g Gene Are Potential Diagnostic Biomarkers for Hepatocellular Carcinoma" Cancers 12, no. 8: 2332. https://doi.org/10.3390/cancers12082332
APA StyleXu, F., Zhang, L., Xu, Y., Song, D., He, W., Ji, X., & Shao, J. (2020). Hypermethylation of SCAND3 and Myo1g Gene Are Potential Diagnostic Biomarkers for Hepatocellular Carcinoma. Cancers, 12(8), 2332. https://doi.org/10.3390/cancers12082332