Article

Prognostic Significance of PET/CT in Patients with Chronic Lymphocytic Leukemia (CLL) Treated with Frontline Chemoimmunotherapy

1
Hematology, Department of Translational and Precision Medicine, Sapienza University, Via Benevento 6, 00161 Rome, Italy
2
Institute of Diagnostic and Nuclear Research, IRCCS SDN, 80143 Naples, Italy
3
Department of Molecular Medicine, “Sapienza” University of Rome, 00161 Roma, Italy
4
Division of Hematology, A.O.U. Città della Salute e della Scienza di Torino and Department of Molecular Biotechnology and Health Sciences, University of Turin, 10124 Torino, Italy
5
Division of Hematology, Department of Translational Medicine, University of Eastern Piedmont, 28100 Novara, Italy
6
UOSD Hematology, ASL Roma 1, 00193 Rome, Italy
7
Department of Psychology, Catholic University of the Sacred-Heart, 20123 Milan, Italy
8
Department of Surgical Sciences, Sapienza University, 00161 Rome, Italy
*
Author to whom correspondence should be addressed.
Cancers 2020, 12(7), 1773; https://doi.org/10.3390/cancers12071773
Submission received: 21 May 2020 / Revised: 26 June 2020 / Accepted: 1 July 2020 / Published: 3 July 2020
(This article belongs to the Special Issue Chronic Lymphocytic Leukemia)

Abstract

:
The role of positron emission tomography/computed tomography (PET/CT) in identifying Richter Syndrome (RS) is well established, while its impact on the survival of patients with chronic lymphocytic leukemia (CLL) has been less explored. The clinical characteristics and PET/CT data of 40 patients with a biopsy-proven CLL who required frontline chemoimmunotherapy, FCR (fludarabine, cyclophosphamide, rituximab) in 20 patients, BR (bendamustine, rituximab) in 20, were retrospectively analyzed. Standardized uptake volume (SUVmax) values ≥ 5 were observed more frequently in patients with deletion 11q (p = 0.006) and biopsies characterized by a rate of Ki67 positive cells ≥ 30% (p = 0.02). In the multivariate analysis, the presence of large and confluent PCs emerged as the only factor with a negative impact on progression-free survival (PFS), and overall survival (OS). Deletion 11q also revealed a significant and independent effect on PFS. SUVmax values ≥ 5 showed no statistical impact on PFS while in multivariate analysis, they revealed a significant adverse impact on OS (median survival probability not reached vs. 56 months; p = 0.002). Moreover, patients with higher SUVmax values more frequently developed Richter Syndrome (p = 0.015). Our results show that higher SUVmax values identify CLL patients with a pronounced rate of proliferating cells in the lymph-node compartment, inferior survival, and an increased risk of developing RS.

1. Introduction

Chronic lymphocytic leukemia (CLL) is the most common type of leukemia in adults in the Western World. Patients with CLL show heterogeneous outcomes ranging from an indolent to an aggressive clinical course [1]. Approximately 2–10% of CLL patients develop additional genetic lesions leading to an increased risk of Richter Syndrome (RS), an aggressive lymphoma characterized by a high proliferative pattern [2,3,4]. Several studies have demonstrated the important role of positron emission tomography/computed tomography (PET/CT) in detecting RS [5,6,7,8,9]. This technique can distinguish tissues with a low 18F-fluorodeoxyglucose (18F-FDG) uptake, such as CLL, from those with a higher metabolic pathway, such as aggressive lymphomas and second malignancies [10,11,12,13,14,15]. Higher standardized uptake volume (SUVmax) values ≥5 or ≥10, revealed a high sensitivity and specificity in detecting RS in patients treated with chemoimmunotherapy [5,6,7,8,9]. On this basis, PET/CT has been considered a useful tool to identify both the presence of high metabolic disease and the optimal site for a diagnostic biopsy [5,6,7,8,9,16]. However, PET cannot replace histology in the diagnostic assessment of tissues with a high 18F-FDG uptake.
In different studies, high SUVmax values have also been associated with poorer outcomes [6,7,17,18]. In a retrospective study by Falchi et al. that included 764 CLL patients who underwent PET/CT in the susceptibility of a more aggressive disease or as clinical staging before different treatment lines, 332 (43%) patients underwent the biopsy of the involved lymph node or other tissue [6]. RS was diagnosed in 95 (28.6%) patients while CLL was confirmed histologically in 237 (71.4%). In this study, the SUVmax values ≥ 10 identified patients with RS and were associated with inferior survival. Moreover, the patients with confirmed CLL who showed histologic features of a more aggressive disease, showed higher median SUVmax values, 6.8, than those of the patients with a histologic indolent disease, 3.7. Similarly, in the study by Michallet et al. SUVmax values ≥ 10 identified patients with RS and were associated with significantly lower survival. In this study, patients with aggressive CLL showed higher median SUVmax values, 4.5, compared to those with a stable disease, 2.5 [9]. A prior study of our group included 90 patients in different treatment lines, who underwent PET/CT followed by a biopsy of the involved lymph nodes or other tissues in the suspicion of RS or a secondary malignancy [8]. Median SUVmax values were 14.6 in patients with diffuse large B-cell lymphoma, 7 in those with Hodgkin lymphoma, and 3.5 in patients with the diagnosis of CLL/small lymphocytic lymphoma. In this study, ten patients with previously untreated CLL and SUVmax cutoff ≥5 showed a significant inferior survival probability than those with lower SUVmax values. This finding might suggest an unfavorable outcome of CLL patients with a more marked proliferative behavior measured by PET/CT.
While the role of PET/CT in identifying the presence of RS is well established, its prognostic role in defining the outcome of patients with a biopsy-proven CLL has been less explored. In particular, the clinical significance of PET/CT as a prognosticator has not been sufficiently investigated in patients requiring front-line chemoimmunotherapy.
To define whether PET/CT may have prognostic significance in CLL, we retrospectively analyzed the clinical characteristics and outcome of 40 patients with a biopsy-proven CLL who required front-line chemoimmunotherapy.

2. Results

2.1. Patient Characteristics

The clinical and biological characteristics of patients are described in Table 1. The median time from PET/CT scan to biopsy was 26 days (range 14–42) and the median follow-up of patients from biopsy, 66 months (2–106). The median age at biopsy was 62 years (range 35–92). Unmutated immunoglobulin heavy chain variable region genes IGHVstatus was present in 54% of patients, and deletion 11q in 19%. The presence of a TP53 disruption was observed in 7/37 tested patients (19%). The fluorescent in situ hybridization FISH analysis revealed deletion 17p in 3/31 analyzed patients while TP53 mutation was detected in 6/37 tested patients (two patients with deletion 17p also had TP53 mutation). FCR (fludarabine, cyclophosphamide, rituximab) was given in 20 patients, and BR (bendamustine, rituximab) in 20.

2.2. PET/CT and Biopsy

The median SUVmax value recorded by PET was 3.5 (range, 2.1–9), with values ≥ 5 in 13 (33%) patients and <5 in 27 (67%). The biopsy site fully matched with that of the highest SUVmax value in 32 (80%) patients. In eight (20%) patients with the highest uptake projected on abdominal nodes, the biopsy targeted the largest lymph node easier to access.

2.3. Distribution of Clinical and Biologic Characteristics According to the SUVmax Value

In univariate analysis, SUVmax values ≥ 5 were observed more frequently in patients with biopsies characterized by a rate of Ki67 positive cells ≥ 30% (p = 0.02) and in those with deletion 11q (p = 0.006), while no significant differences in the SUVmax values were detected for other genetic lesions (Table 1).

2.4. Outcomes of Patients According to the SUVmax Values
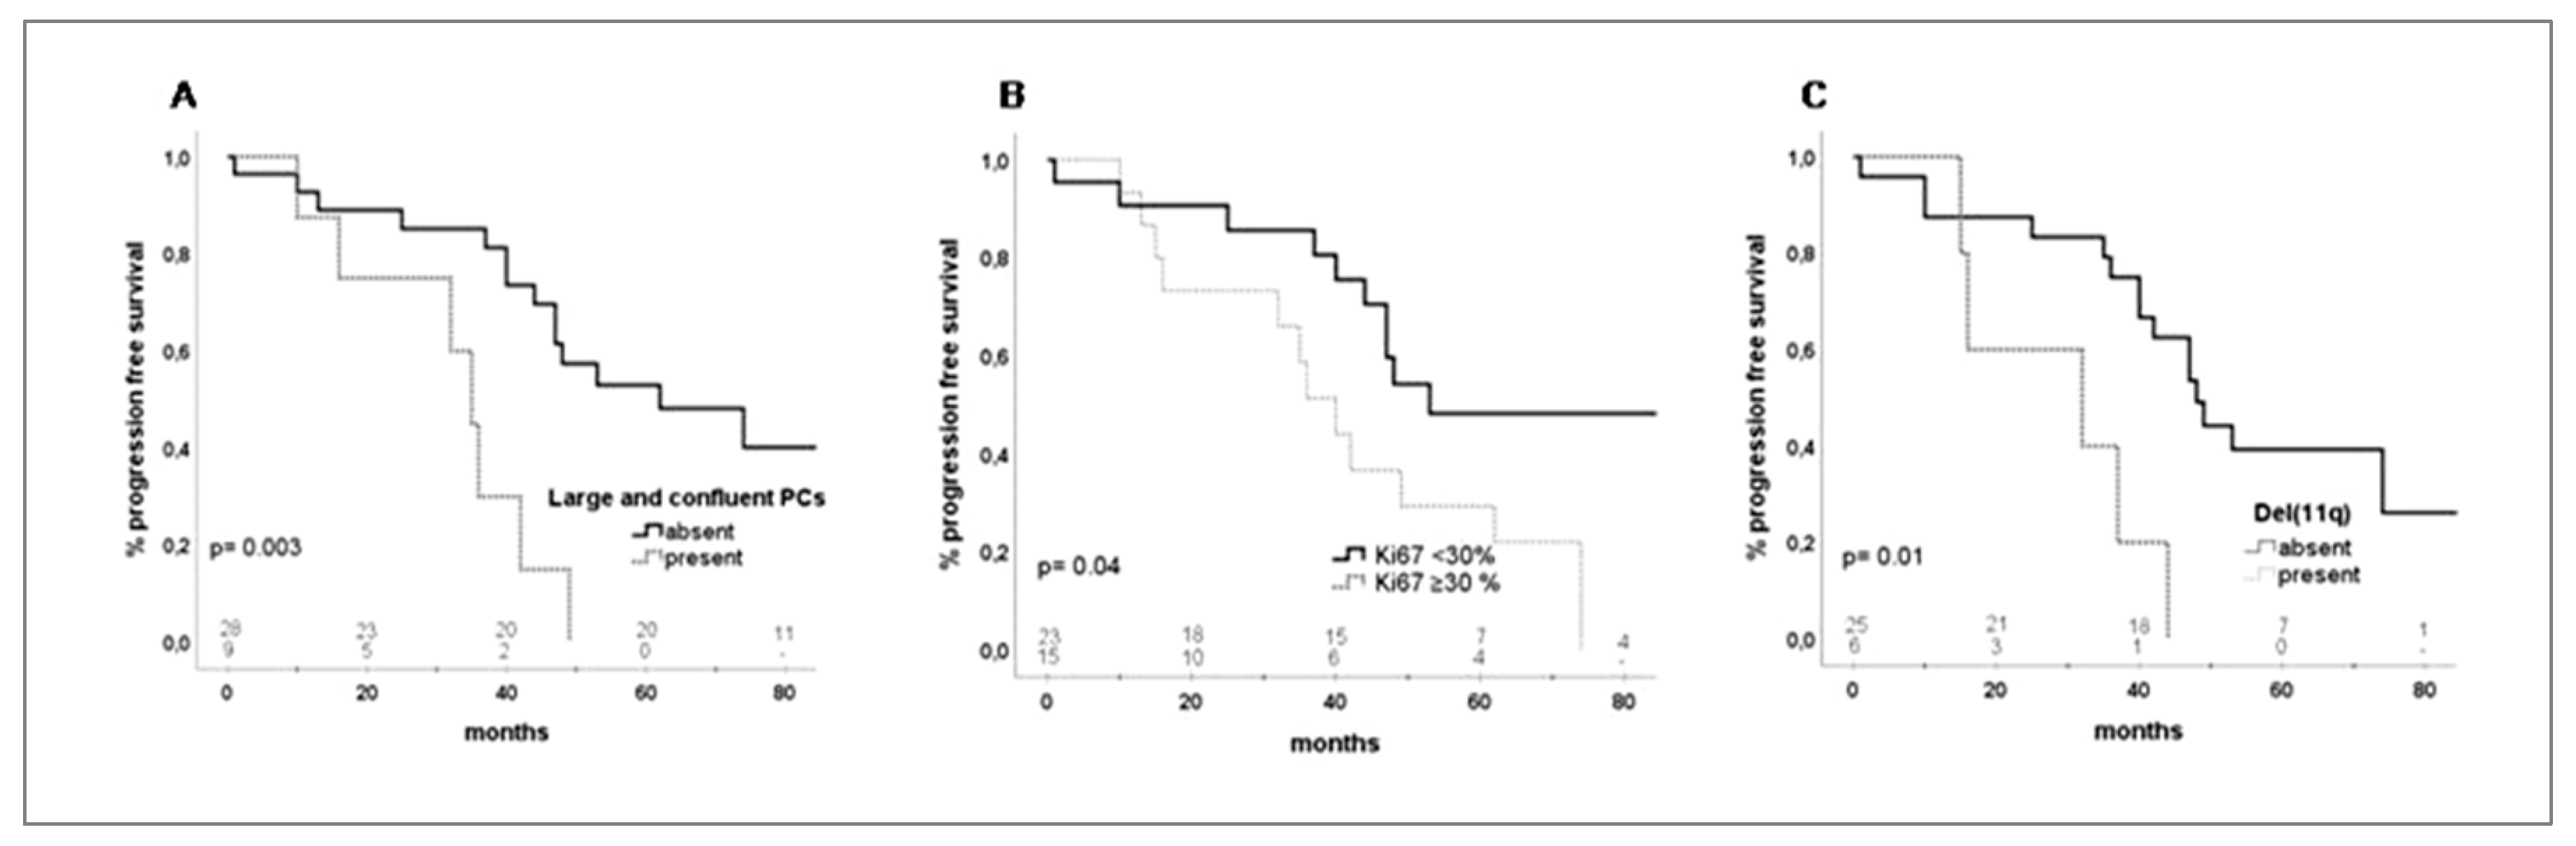
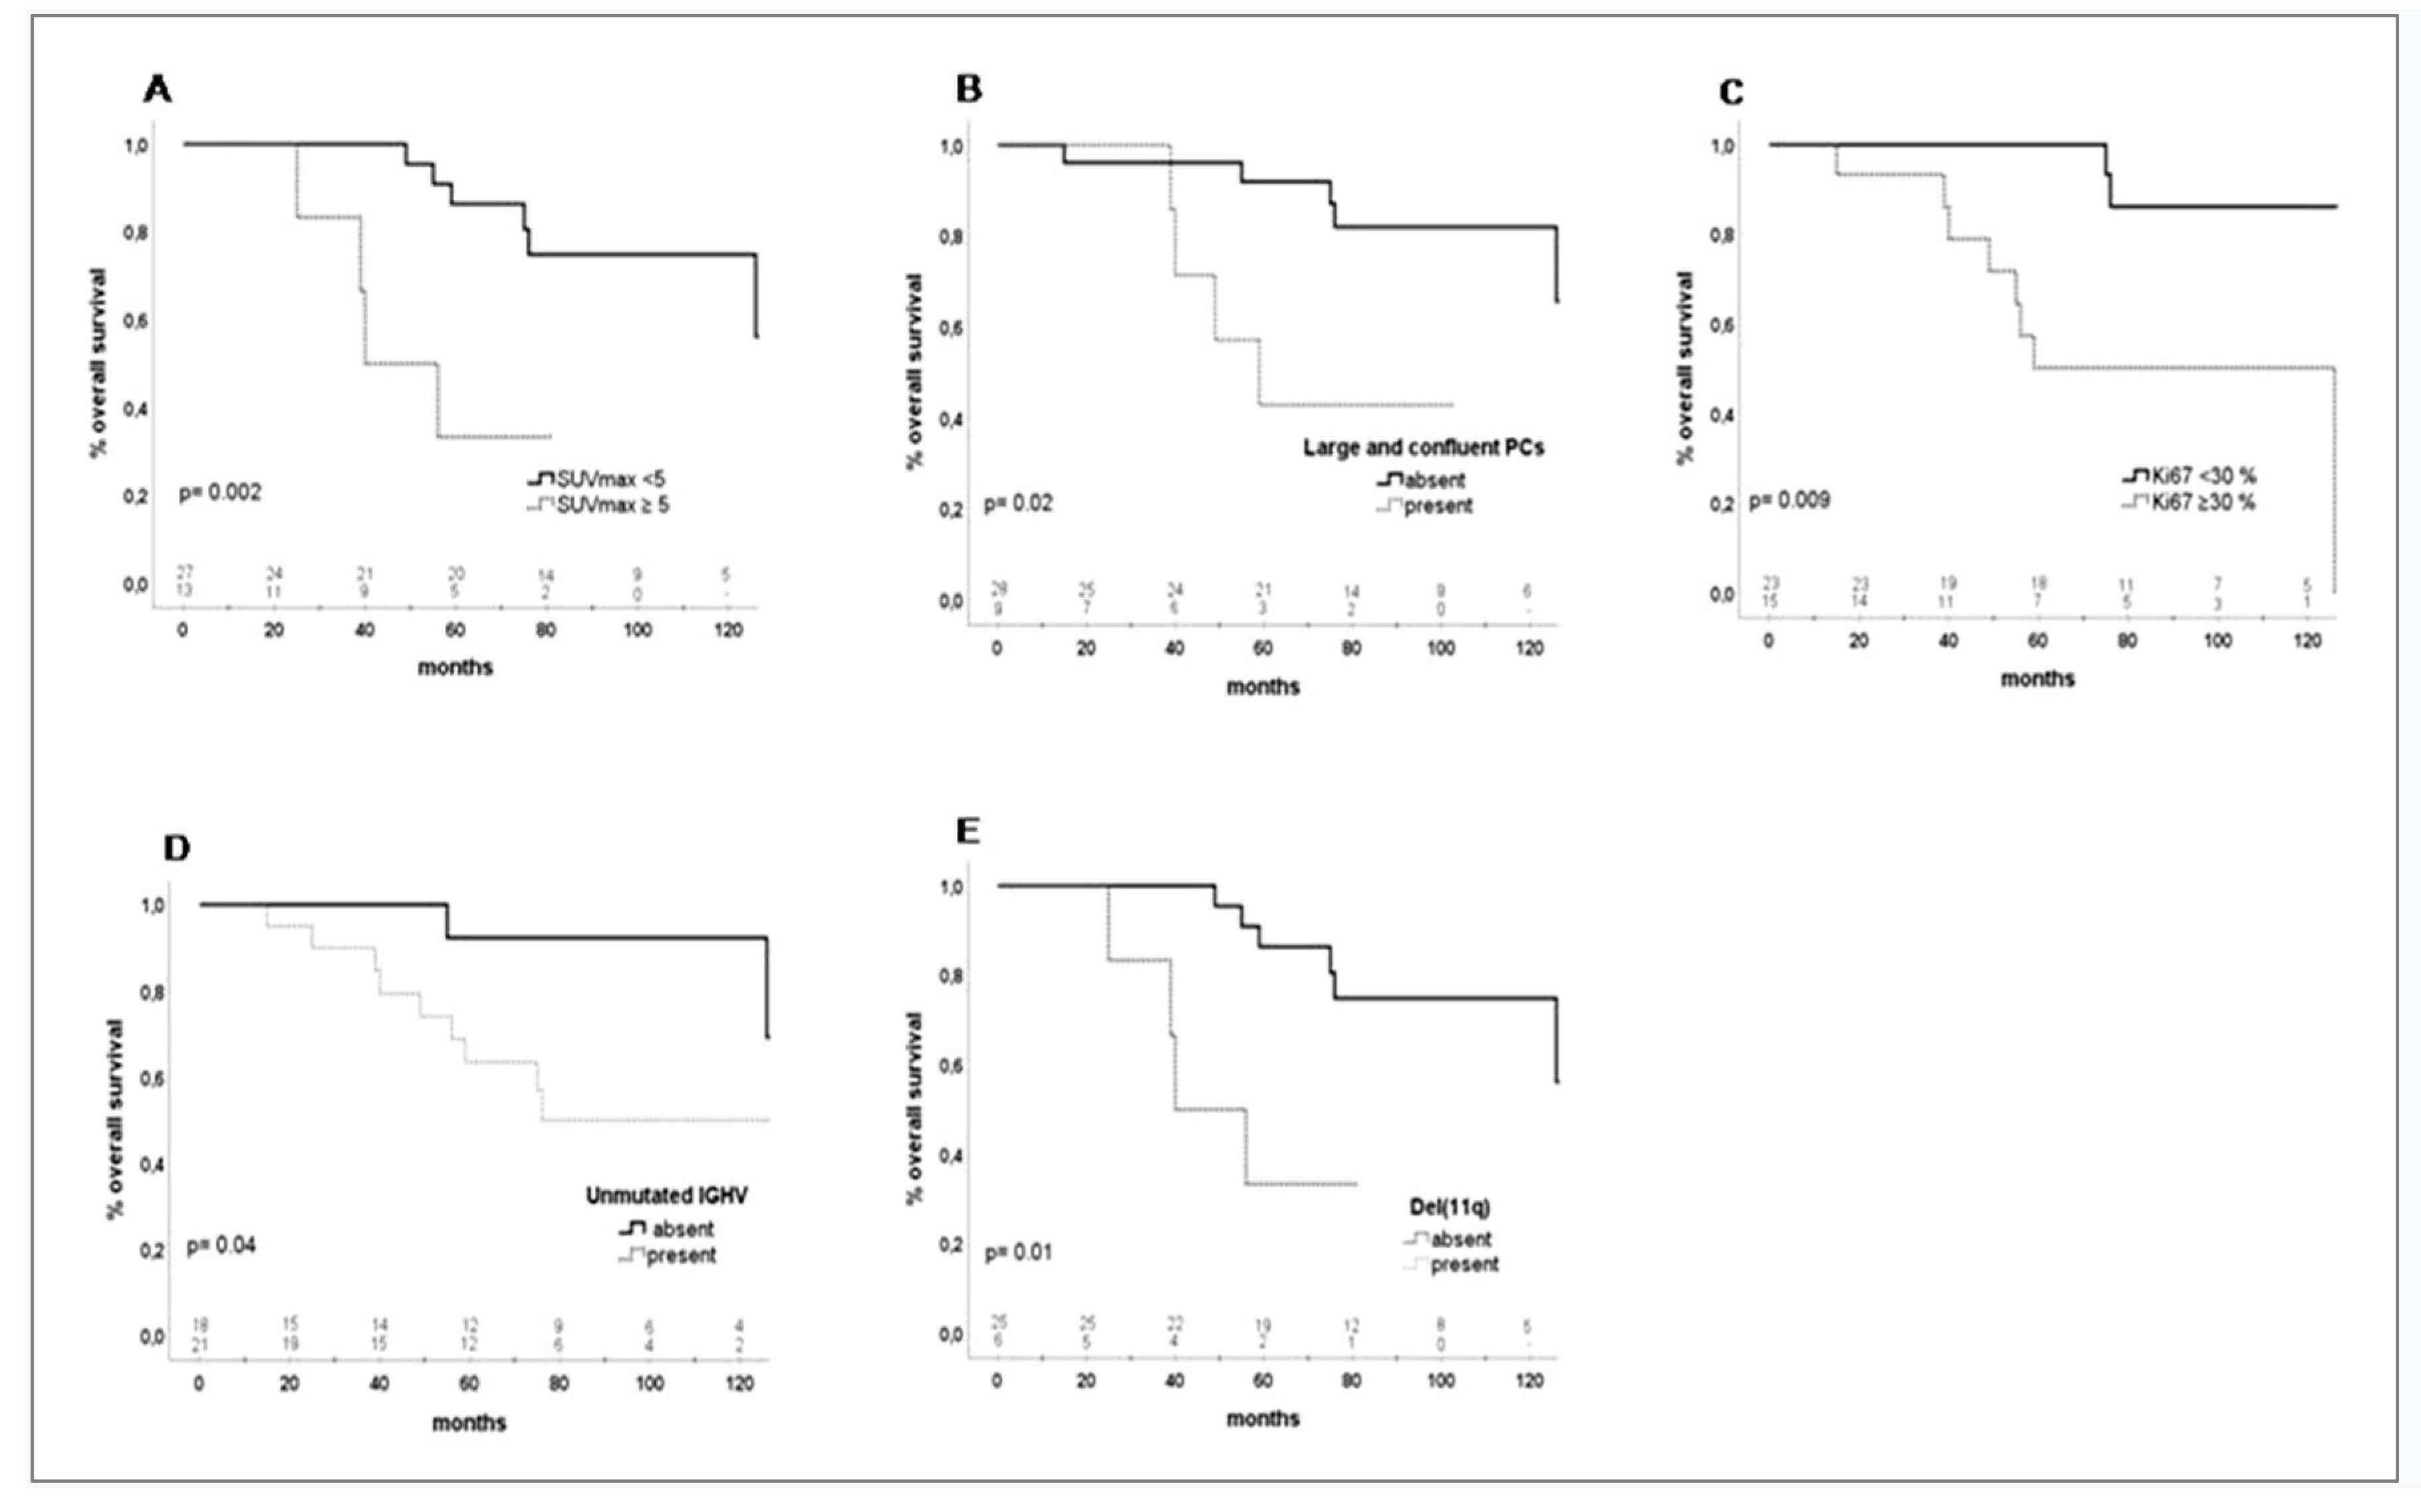
Response to frontline therapy was observed in most patients [overall response rate (ORR), 36/40, 90%]. No significant differences in the overall response (OR) and complete response (CR) rates were associated with the SUVmax values recorded at baseline (SUVmax values < 5 vs. ≥5: ORR, 93% vs. 85%; p = 0.43; CR, 44% vs. 46%; p = 0.93; Table S1). After a median time of 34 months (range, 10–74 months) from the biopsy, 17 (49%) patients developed CLL progression. No statistical differences according to the SUVmax levels were observed in the rate of patients who developed CLL progression (SUVmax value ≥ 5 or <5: CLL progression, 33% vs. 54%; p = 0.28; Table S1) or not.
Five (13%) patients developed RS after a median time of 15 months (range, 12–32 months) from the biopsy. A significantly higher proportion of patients with SUVmax values ≥ 5 than those with SUVmax < 5 developed RS (SUVmax values ≥ 5 vs. <5; Richter Syndrome, 31% vs. 4%; p = 0.015; Table S1). The majority of patients who developed RS showed at baseline histologic features suggesting a high proportion of proliferating cells in lymph nodes (Ki67 ≥ 30%,4/5 patients; large and confluent proliferation centers (PCs), 3/5 patients).

2.5. Survival

The median and 3-year progression-free survival (PFS) were 48 months and 75%, respectively. In the univariate analysis, the SUVmax values showed no impact on PFS (3-year PFS, SUVmax < 5 vs. ≥ 5, 79 vs. 55%, p = 0.48; Table 2). The factors with a significant impact on PFS were deletion 11q (p = 0.01; hazard ratio (HR) 4.21 (95% CI: 1.3–13)), biopsies with the presence of large and confluent PCs (p = 0.003; HR 4.5 (95% CI: 1.6–12.1)) and ≥30% of Ki67 positive cells (p = 0.04; HR 2.41 (95% CI: 1–5.6)). A trend for statistical significance was observed for the IGHV mutational status (p = 0.07), while the presence of TP53 aberrations showed no significant impact on PFS (p = 0.7). However, in multivariate analysis, the presence of deletion 11q (HR 0.28 (95% CI: 0.08–0.99)) and large and confluent PCs in the lymph-node biopsies (HR 0.17 (95% CI: 0.03–0.94)) were the only factors that maintained significance (Figure 1; Table 2; Table S2).
Eleven (27%) patients died, 3/27 (11%) with SUVmax values < 5 and 8/13 (61%) with SUVmax values ≥ 5. The causes of death were disease progression in three cases, RS in four, cancer in two, cardiovascular in one, and a traumatic event in one. Median survival probability was not reached in patients with SUVmax values < 5 while it was significantly lower, 56 months, in those with SUVmax value ≥ 5 (p = 0.002; HR 0.12 (95% CI:0.3–0.5)) (Figure 2, Table 2).
A significantly inferior survival was also observed in the IGHV unmutated patients (p = 0.04; HR 0.20 (95% CI: 0.04–0.9)), in those with deletion 11q (p = 0.01; HR 5.49 (95% CI: 1.4–20.8)), with biopsies showing ≥ 30% of Ki67 positive cells (p = 0.009; HR 8.1 (95% CI: 1.7–38.6)), large and confluent PCs (p = 0.02; HR 5.17 (95% CI: 1.2–21.1)) (Figure 2, Table 2).
However, in the multivariate analysis, two factors maintained a significant adverse impact on OS, SUVmax values ≥ 5 (HR 6.48 (95% CI: 1.42–29.58)) and the presence of large and confluent PCs in the lymph nodes biopsies (HR 0.14 (95% CI: 0.02–0.7)) (Table S2).
The clinical, biologic characteristics of two representative cases with different outcomes and SUVmax values are described in the Figure S1.

3. Discussion

PET/CT is widely used in the clinical management of CLL patients with disease progression and clinical suspicion of RS. This study was aimed at evaluating whether the SUVmax value could also have a prognostic impact on the outcome of patients with biopsy-proven CLL. The strength of this study was based on the homogeneity of the clinical characteristics of patients, which all showed progressive disease and performed PET/CT and the excisional biopsy of the involved lymph node or of another involved tissue before frontline therapy. The weaknesses of this study are the retrospective design, the relatively small sample size of patients, and the lack of a centralized review of biopsies and the PET/CT scans.
Clinical and histopathological signs suggesting a pronounced cell proliferation in lymph-nodes, such as large lymph-nodes, increased levels of lactate dehydrogenase (LDH), a high rate of Ki67 positive cells, and deletion 11q, were significantly more frequent in the presence of SUVmax values ≥ 5. The majority of patients achieved a response to front line therapy and the 18F-FDG uptake did not identify cases with a different response rate. Interestingly, in multivariate analysis, the presence of large and confluent PCs emerged as the only factor with a negative effect on both, PFS and OS. Deletion 11q, a genetic aberration frequently observed in cases with extensive lymphadenopathy [19], also revealed a significant and independent impact on PFS. SUVmax values ≥ 5 were associated with a significantly adverse impact on OS. Median survival was not reached in the patients with SUVmax values < 5, while it was significantly lower, 56 months, in those with SUVmax value ≥ 5. A close relationship between a high 18F-FDG uptake and inferior survival has been previously reported in other studies [6,8,9].
As these studies included treatment naïve as well as previously treated patients, and were mainly focused on the discriminatory power of PET/CT in identifying cases with RS, our data are not easily comparable [5,6,7,8,9,20,21]. In our study, we only considered patients with a biopsy-proven CLL performed before frontline therapy and excluded patients with RS. Given these characteristics, it is not surprising that in our study no patients showed SUVmax values ≥ 10. Nevertheless, our data, focused on patients with a less advanced disease, confirm the adverse impact of higher 18F-FDG uptake on survival. In a study by Mato et al. that included venetoclax-treated patients, increased SUVmax values were also associated with a trend to a significantly inferior survival [20]. As targeted therapy is progressively replacing chemotherapy, this question deserves to be further investigated in patients treated with B-cell receptor (BCR) and BCL2 antagonists. It might be possible that the 18F-FDG uptake loses its prognostic significance on survival when it will be tested in patients treated with BCR inhibitors that have a high efficacy on the lymph node disease.
Overall, our results suggest a close relationship between a high 18F-FDG uptake, histologic features of increased cell proliferation in lymph nodes, and survival probability. In a study by Ginè et al., patients whose biopsy displayed expanded PCs showed a low survival and were defined as having an ‘accelerated’ CLL [18]. Similarly, in a study by Falchi et al., patients with large and confluent PCs and high rates of Ki67 positive cells were classified as having a “histologically aggressive CLL” (HAC) [6]. Patients with a HAC revealed higher median SUVmax values and inferior survival than those without HAC features [6,9]. It is noteworthy that in our study, more than a third of the patients could be considered as patients with HAC at the time of the first treatment. An intriguing finding of the present study was the significantly higher rate of patients displaying SUVmax values ≥ 5 at baseline who developed a diffuse large B-cell lymphoma. Moreover, the majority of patients who developed RS also showed biopsies characterized by large and confluent PCs and high rates of Ki67 positive cells. This observation suggests that a pronounced cell proliferation in the lymph-node compartment could represent a risk factor for the expansion of an aggressive cell clone leading to the emergence of RS. This hypothesis has been supported by the high rate of genetic abnormalities that have been described in PCs [17,22].
Taken together, PET/CT is a useful exam providing an immediate representation of both the extent of the disease burden and the proliferating activity in the lymph node compartment, which is the preferential site of activation, and the proliferation of CLL cells [23]. Based on these properties, PET/CT is useful, not only in identifying patients with RS, but also CLL patients displaying a high rate of proliferating cells in the lymph node compartment and inferior survival.

4. Methods

4.1. Patients Population

Between January 2009 and January 2019, clinical, biologic, and radiologic data of CLL patients who performed PET/CT followed by the biopsy involved lymph nodes or different tissues were collected and retrospectively analyzed.
Inclusion criteria included: (1) the diagnosis of B-cell CLL, according to the international workshop on CLL (iwCLL) criteria [19]; (2) no prior treatment; (3) clinical and laboratory signs suggesting progressive disease requiring frontline therapy (bulky nodes, a rapid increase in the lymph-nodes size, extra-nodal involvement, B symptoms, increased LDH, progressive cytopenia) according to the iwCLL criteria [24]; (4) PET/CT followed by a biopsy of the involved lymph node or other tissue with the highest SUVmax; (5) histologic diagnosis of CLL/small lymphocytic lymphoma; (6) signed informed consent from the patients permitting the collection of clinical data from medical records. Exclusion criteria included: (1) histologic transformation from CLL to an aggressive lymphoma (Richter transformation); (2) histologic diagnosis of second malignancy.
Response to treatment was assessed according to the iwCLL criteria [24]. The highest SUVmax value measured by PET provided the optimal site to perform the biopsy. In patients who showed the highest SUVmax projected on abdominal nodes, the largest and most easily reachable lymph node was biopsied. Forty patients with a biopsy showing a CLL/small lymphocytic lymphoma diagnosis were included in this study, while five patients, three with a RS, two with a second malignancy, were excluded (Figure S2).
The following data were analyzed: demographics (sex, age), disease stage, lymph-nodes size, complete blood count with differential, beta2-microglobulin, LDH, CD38 expression, IGHV mutation status, FISH cytogenetic profile (del 13q, del 11q, del 17p, +12), TP53 mutations. SUVmax values and histologic characteristics of the biopsied tissue were also considered. Other analyzed parameters included the type of treatment, response to treatment, disease progression, death, and causes of death.

4.2. PET/CT Imaging

PET/CT was performed by qualified radionuclide radiologists of nuclear medicine departments. Briefly, after at least eight-hour fasting, the patients were administered 4.0 ± 0.5 MBq/kg 18F-FDG and underwent the PET/CT scan (Discovery 710, General Electric, Milwakee, WI, USA) 60 ± 10 min later. Three-dimensional emission scans of 2.5 min per bed position were acquired from vertex to pelvis. Blood glucose levels were measured in all patients and 140 mg/dl was considered the upper limit for the 18F-FDG PET scan. Unenhanced low-dose CT (80–120 mAs using dose modulation, 80 kV, pitch of 0.938, and slice thickness of 3.75 mm) for segmented attenuation correction was carried out in each patient. Immediately after, the PET scans were acquired covering the same field of view as the CT. Images (256 × 256 matrix) were obtained with a 3D iterative ordered-subset expectation maximization (OSEM) and time of flight (TOF) technologies (GE VUE Point FX, GE Healthcare, Chicago, IL, USA). The algorithms were applied to the ratio sinograms using attenuation-weighted iterative reconstruction (three iterations, 18 subsets) and all the reconstructions always included a z axis filter. Ten millimeter-long circular region of interest (ROI) including 58 pixels was used to extract the standardized uptake value based on the body weight (SUVbw) values in a region with increased 18F-FDG uptake (Figure S3). A pathologic lesion with increased 18FDG uptake was defined as a pathologic area shown by TC with an increased uptake that appeared focal, and more intense than that of the adjacent background tissues.
The SUVmax values of involved lymph nodes or other involved tissues were recorded. Based on the results of our prior study [8], the patients’ characteristics and outcomes were analyzed according to a SUVmax cut-off of five or higher.

4.3. Histologic Analysis

An excisional lymph node biopsy was performed in all cases. The site with the highest SUV was considered to drive the biopsy to the most metabolically active area within a lymph node or to extra nodal tissue. Experienced pathologists of local academic institutions evaluated the histologic specimens. All the cases diagnosed as CLL/small lymphocytic lymphoma (SLL) were included in this study. The PCs were defined as described previously [18]. PCs with the major diameter exceeding the ax20 microscopic field were considered as large. Ki-67 index was evaluated by immunostaining (Dako, Glostrup, Denmark) in 8–10 PCs, as described previously [18]. A Zeiss Axiophot microscope (Carl Zeiss, Sheung kehen, Germany) was used.

4.4. Statistical Analysis

Patients’ characteristics were reported using the median for continuous variables and frequency for categorical variables. A chi-square test was used to assess the association between the categorical variables and the patients’ characteristics. Overall survival (OS) was calculated from the time of biopsy until death or last follow-up, progression-free survival (PFS) was calculated from the time of biopsy until disease progression, death, or last follow-up. The Kaplan–Meier method was considered to estimate the survival probabilities and differences between the survival curves assessed using the log-rank test. Univariate and multivariate Cox regression analyses were performed to evaluate the association between the patients’ characteristics and survival.
Statistical significance was considered for p values ≤ 0.05. All the calculations were made using a standard statistical package (SPSS for Windows Version 25.0; Chicago, IL, USA).

4.5. Ethics

This retrospective, observational study was carried out according to the Guidelines for Good Clinical Practice and was approved by the Ethics Committee (Rif.3342/11.09/2014). Patients were asked to provide informed consent.

5. Conclusions

Our results show that higher SUVmax values identify CLL patients with a pronounced rate of proliferating cells in the lymph-node compartment, inferior survival, and an increased risk of developing RS. The prognostic significance of PET/CT deserves to be further investigated in trials, including the CLL patients treated with novel agents.

Supplementary Materials

The following are available online at https://www.mdpi.com/2072-6694/12/7/1773/s1, Figure S1: Two representative cases with different SUVmax values, Figure S2: Consort diagram-trial profile, Figure S3: Example of ROI positioning, Table S1: Response to treatment, CLL progression, Richter syndrome according to the SUVmax values, Table S2: Multivariable Cox regression model for PFS and OS.

Author Contributions

M.P. and F.R.M. were involved in the study design, patient enrollment, data analysis, and manuscript writing. E.N. was involved in the review of PET/TC and manuscript reviewing. R.C. was involved in the excisional biopsy of the involved lymph nodes or other tissues. M.R. was involved in the histopathological diagnosis and manuscript reviewing. C.V., M.C., L.D.P., A.R., G.M., S.L., G.G., A.C. and A.D.P. were involved in patient enrollment, data collection, and manuscript reviewing. G.B. was involved in the statistical analysis and manuscript reviewing. All authors have read and agreed to the published version of the manuscript.

Funding

This research was funded by the Associazione Italiana per la Ricerca sul Cancro (AIRC) Foundation Milan, Italy, grant number (AIRC 5 × 1000 No. 21198).

Conflicts of Interest

The authors declare no conflict of interest.

References

  1. Yee, K.W.; O’Brien, S.M. Chronic Lymphocytic Leukemia: Diagnosis and Treatment. Mayo Clin. Proc. 2006, 81, 1105–1129. [Google Scholar] [CrossRef] [Green Version]
  2. Rossi, D.; Spina, V.; Gaïdano, G. Biology and treatment of Richter syndrome. Blood 2018, 131, 2761–2772. [Google Scholar] [CrossRef] [Green Version]
  3. Rossi, D.; Gaïdano, G. Richter syndrome: Pathogenesis and management. Semin. Oncol. 2016, 43, 311–319. [Google Scholar] [CrossRef] [PubMed]
  4. Fabbri, G.; Khiabanian, H.; Holmes, A.B.; Wang, J.; Messina, M.; Mullighan, C.G.; Pasqualucci, L.; Rabadan, R.; Dalla-Favera, R. Genetic lesions associated with chronic lymphocytic leukemia transformation to Richter syndrome. J. Exp. Med. 2013, 210, 2273–2288. [Google Scholar] [CrossRef] [PubMed] [Green Version]
  5. Bruzzi, J.F.; Macapinlac, H.; Tsimberidou, A.M.; Truong, M.T.; Keating, M.J.; Marom, E.M.; Munden, R. Detection of Richter’s transformation of chronic lymphocytic leukemia by PET/CT. J. Nucl. Med. 2006, 47, 1267–1273. [Google Scholar] [PubMed]
  6. Falchi, L.; Keating, M.J.; Marom, E.M.; Truong, M.T.; Schlette, E.J.; Sargent, R.L.; Trinh, L.; Wang, X.; Smith, S.C.; Jain, N.; et al. Correlation between FDG/PET, histology, characteristics, and survival in 332 patients with chronic lymphoid leukemia. Blood 2014, 123, 2783–2790. [Google Scholar] [CrossRef] [PubMed] [Green Version]
  7. Conte, M.J.; Bowen, D.A.; Wiseman, G.A.; Rabe, K.G.; Slager, S.L.; Schwager, S.M.; Call, T.G.; Viswanatha, D.S.; Zent, C.S. Use of Positron Emission Tomography-Computerized Tomography (PET-CT) in the Management of Patients with Chronic Lymphocytic Leukemia/Small Lymphocytic Lymphoma (CLL). Leuk. Lymphoma 2014, 55, 2079–2084. [Google Scholar] [CrossRef] [Green Version]
  8. Mauro, F.R.; Chauvie, S.; Paoloni, F.; Biggi, A.; Cimino, G.; Rago, A.; Gentile, M.; Morabito, F.; Coscia, M.; Bello, M.; et al. Diagnostic and prognostic role of PET/CT in patients with chronic lymphocytic leukemia and progressive disease. Leukemia 2015, 29, 1360–1365. [Google Scholar] [CrossRef]
  9. Michallet, A.-S.; Sesques, P.; Rabe, K.G.; Itti, E.; Tordot, J.; Tychyj-Pinel, C.; Baseggio, L.; Subtil, F.; Salles, G.; Dupuis, J.M.; et al. An 18F-FDG-PET maximum standardized uptake value > 10 represents a novel valid marker for discerning Richter’s Syndrome. Leuk. Lymphoma 2016, 57, 1474–1477. [Google Scholar] [CrossRef]
  10. Boellaard, R. Standards for PET Image Acquisition and Quantitative Data Analysis. J. Nucl. Med. 2009, 50, 11–20. [Google Scholar] [CrossRef] [Green Version]
  11. Makris, N.E.; Huisman, M.C.; Kinahan, P.E.; Lammertsma, A.A.; Boellaard, R. Evaluation of strategies towards harmonization of FDGPET/CT studies in multicentretrials: Comparison of scanner validation phantoms and data analysis procedures. Eur. J. Nucl. Med. Mol. Imaging 2013, 40, 1507–1515. [Google Scholar] [CrossRef]
  12. Boellaard, R.; Delgado-Bolton, R.; Oyen, W.J.; Giammarile, F.; Tatsch, K.; Eschner, W.; Verzijlbergen, F.J.; Barrington, S.F.; Pike, L.C.; Weber, W.A.; et al. FDG PET/CT: EANM procedure guidelines for tumor imaging: Version 2.0. Eur. J. Nucl. Med. Mol. Imaging 2015, 42, 328–354. [Google Scholar] [CrossRef]
  13. Cheson, B.D.; Fisher, R.I.; Barrington, S.F.; Cavalli, F.; Schwartz, L.H.; Zucca, E.; Lister, T.A.; Alliance, Australasian Leukaemia and Lymphoma Group; Eastern Cooperative Oncology Group; European Mantle Cell Lymphoma Consortium; et al. Recommendations for Initial Evaluation, Staging, and Response Assessment of Hodgkin and Non-Hodgkin Lymphoma: The Lugano Classification. J. Clin. Oncol. 2014, 32, 3059–3067. [Google Scholar] [CrossRef] [PubMed]
  14. Kumar, R.; Maillard, I.; Schuster, S.J.; Alavi, A. Utility of fluorodeoxyglucose-PET imaging in the management of patients with Hodgkin’s and non-Hodgkin’s lymphomas. Radiol. Clin. N. Am. 2004, 42, 1083–1100. [Google Scholar] [CrossRef] [PubMed]
  15. Burton, C.; Ell, P.; Linch, D.C. The role of PET imaging in lymphoma. Br. J. Haematol. 2004, 126, 772–784. [Google Scholar] [CrossRef] [PubMed]
  16. Rhodes, J.M.; Mato, A.R. PET/Computed Tomography in Chronic Lymphocytic Leukemia and Richter Transformation. PET Clin. 2019, 14, 405–410. [Google Scholar] [CrossRef] [PubMed]
  17. Ciccone, M.; Agostinelli, C.; Rigolin, G.M.; Piccaluga, P.P.; Cavazzini, F.; Righi, S.; Sista, M.T.; Sofritti, O.; Rizzotto, L.; Sabattini, E.; et al. Proliferation centers in chronic lymphocytic leukemia: Correlation with cytogenetic and clinicobiological features in consecutive patients analyzed on tissue microarrays. Leukemia 2011, 26, 499–508. [Google Scholar] [CrossRef] [PubMed]
  18. Giné, E.; Martinez, A.; Villamor, N.; López-Guillermo, A.; Camos, M.; Martinez, D.; Esteve, J.; Calvo, X.; Muntañola, A.; Abrisqueta, P.; et al. Expanded and highly active proliferation centers identify a histologic subtype of chronic lymphocytic leukemia (“accelerated” chronic lymphocytic leukemia) with aggressive clinical behavior. Haematologica 2010, 95, 1526–1533. [Google Scholar] [CrossRef]
  19. Döhner, H.; Stilgenbauer, S.; James, M.R.; Benner, A.; Weilguni, T.; Bentz, M.; Fischer, K.; Hunstein, W.; Lichter, P. 11q Deletions Identify a New Subset of B-Cell Chronic Lymphocytic Leukemia Characterized by Extensive Nodal Involvement and Inferior Prognosis. Blood 1997, 89, 2516–2522. [Google Scholar] [CrossRef]
  20. Mato, A.R.; Wierda, W.G.; Davids, M.S.; Cheson, B.D.; Coutre, S.E.; Choi, M.; Furman, R.R.; Heffner, L.; Barr, P.M.; Eradat, H.; et al. Utility of positron emission tomography-computed tomography in patients with chronic lymphocytic leukemia following B-cell receptor pathway inhibitor therapy. Haematologica 2019, 104, 2258–2264. [Google Scholar] [CrossRef] [Green Version]
  21. Wang, Y.; Rabe, K.G.; Bold, M.S.; Shi, M.; Hanson, C.A.; Schwager, S.M.; Call, T.G.; Kenderian, S.S.; Muchtar, E.; Hayman, S.R.; et al. The role of 18F-FDG FDG PET in detecting Richter’s transformation of chronic lymphocytic leukemia in patients receiving therapy with a B-cell receptor inhibitor. Haematologica 2020. [Google Scholar] [CrossRef] [PubMed]
  22. Balogh, Z.; Reiniger, L.; Rajnai, H.; Csomor, J.; Szepesi, A.; Balogh, A.; Deák, L.; Gagyi, E.; Bödör, C.; Matolcsy, A. High rate of neoplastic cells with genetic abnormalities in proliferation centers of chronic lymphocytic leukemia. Leuk. Lymphoma 2011, 52, 1080–1084. [Google Scholar] [CrossRef] [PubMed]
  23. Herishanu, Y.; Pérez-Galán, P.; Liu, D.; Biancotto, A.; Pittaluga, S.; Vire, B.; Gibellini, F.; Njuguna, N.; Lee, E.; Stennett, L.; et al. The lymph node microenvironment promotes B-cellreceptor signaling, NF-kappaB activation, and tumor proliferation in chronic lymphocytic leukemia. Blood 2011, 117, 563–574. [Google Scholar] [CrossRef] [PubMed]
  24. Hallek, M.; Cheson, B.D.; Catovsky, D.; Caligaris-Cappio, F.; Dighiero, G.; Döhner, H.; Hillmen, P.; Keating, M.J.; Montserrat, E.; Rai, K.R.; et al. Guidelines for the diagnosis and treatment of chronic lymphocytic leukemia: A report from the International Workshop on Chronic Lymphocytic Leukemia updating the National Cancer Institute—Working Group 1996 guidelines. Blood 2008, 111, 5446–5456. [Google Scholar] [CrossRef] [Green Version]
Figure 1. Progression-free survival (PFS) of patients with biopsy-proven CLL. (A) Thirty-six-month PFS according to the characteristics of proliferation centers (PCs): patients without large and confluent PCs, 85% (95% CI: 71.4–98.6) vs. with large and confluent PCs, 30% (95% CI: 12–78); p = 0.003. (B) Thirty-six-month PFS according to Ki67% expression: patients with Ki67% < 30, 85% (95% CI: 70–100) vs. patients with Ki67% ≥ 30, 51% (95% CI: 25.3–77.3); p = 0.04. (C) Thirty-six-month PFS according to deletion (11q): patients without del(11q), 75% (95% CI: 77.6–92.4) vs. patients with del(11q), 40% (95% CI: −1–81); p = 0.01.
Cancers 12 01773 g001
Figure 2. Overall survival (OS) of patients with biopsy-proven CLL. (A) Thirty-six-month OS according to the SUVmax < 5, 100% vs. SUVmax ≥ 5, 83% (95% CI: 64–102); p = 0.002. (B) Thirty-six-month OS according to the characteristics of proliferation centers (PCs): patients without large and confluent PCs, 96% (95% CI: 88.5–103.5) vs. with large and confluent PCs, 85% (95% CI: 89.3–110); p = 0.02. (C) Thirty-six-month OS according to Ki67% expression: Ki67% < 30, 100% vs. Ki67% ≥ 30, 93% (95% CI: 80.4–105.6); p = 0.009. (D) Thirty-six-month OS according to IGHV mutational status: IGHV mutated, 100% vs. IGHV unmutated, 90% (95% CI: 76.7–103.2), p = 0.04 (E) Thirty-six-month OS according to deletion (11q): patients without del(11q), 100% vs. patients with del(11q), 83% (95% CI: 53–113); p = 0.01.
Cancers 12 01773 g002
Table 1. Clinical and biologic characteristics of the patients with biopsy-proven chronic lymphocytic leukemia (CLL) according to the SUVmax values.
Tested VariablesAll Patients
n (%)
SUVmax ≥ 5
n (%)
SUVmax < 5
n (%)
p Value
40 (100)13 (33)27 (67)-
Age
≥65 years14 (35)6 (46)8 (30)0.30
<65 years26 (65)7 (54)19 (70)
Sex
Male31 (78)12 (92)19 (70)0.12
Female9 (22)1(8)8 (30)
Binet stage
A+B34 (85)11 (85)23 (85)0.96
C6 (15)4 (15)2 (15)
B symptoms
Present11 (28)3 (23)8 (30)0.66
Absent29 (72)10 (77)19 (70)
LDH
Normal13 (33)6 (50)20 (74)0.14
Increased26 (67)6 (50)7 (26)
Beta 2 microglobulin
≥3.5 mg/L21 (58)4 (40)11 (42)0.9
<3.5 mg/L15 (42)6 (60)15 (58)
Lymph nodes diameter
≥5 cm17 (46)8 (62)9 (38)0.16
<5 cm20 (54)5 (38)15 (62)
Large and confluent PCs
Present9 (24)4 (36)5 (19)0.26
Absent28 (76)7 (64)21 (81)
Ki67%
≥30%15 (40)8 (67)7 (27)0.02
<30%23 (60)4 (33)19 (73)
CD38 positive
Present18 (47)7 (58)11 (44)0.41
Absent19 (51)5 (42)14 (56)
Unmutated IGHV
Present21 (54)9 (75)12 (44)0.07
Absent18 (46)3 (25)15 (56)
FISH b
Del(11q)
Present6 (19)5 (45)1 (5)0.006
Absent25 (81)6 (55)19 (95)
Trisomy 12
Present8 (26)4 (36)4 (20)0.32
Absent23 (74)7 (64)16 (80)
Del(13q)
Present5 (16)1 (9)4 (20)0.43
Absent26 (84)10 (91)16 (80)
Del(17p) and/or mutated TP53 c
Present7 (19)3 (27)4 (15)0.39
Absent30 (81)8 (72)22 (85)
Abbreviations: BR, bendamustine, rituximab; Del, deletion; F, female; FCR, fludarabine, cyclophosphamide, rituximab; LDH, lactate dehydrogenase; PCs, proliferation centers; SUV, Standardized uptake value; WBC, white blood cell. Extra-nodal involvement in 3 patients: skin two cases, gastric one case. b FISH investigated in 31 patients, TP53 mutation investigated in 37. c Deletion 17p detected in 3/31 patients. TP53 mutation detected in 6/37 patients (2 patients with deletion 17p also had TP53 mutation).
Table 2. PFS and OS according to the baseline characteristics of the patients: univariate analysis.
Tested VariablesNo. Patients
n (%)
PFSOS
3 Year
%
Median Monthsp ValueHR
(95% CI)
3 Year
%
Median
Months
p ValueHR
(95% CI)
40 (100)7548--94---
SUVmax
≥513 (33)55370.480.72
(0.2–1,7)
83560.0020.12
(0.3–0.5)
<527 (67)7949100-
Age
≥65 years14 (35)62470.781.13
(0.4–2.7)
841260.331.81
(0.5–6)
<65 years26 (65)7548100-
Sex
Male31 (78)68470.440.65
(0.2–1.9)
100-0.210.02
(0–8.6)
Female9 (22)855393-
B symptoms
Present11 (28)72470.571.28
(0.5–3)
1001260.370.50
(0.1–2.3)
Absent29 (72)714892-
Binet stage
A+B34 (85)71470.450.57
(0.1–2.4)
93-0.650.62
(0.8–4.9)
C6 (15)7549100-
LDH
Normal13 (33)70620.311.56
(0.6–3.6)
91-0.750.80
(0.2–3.1)
Increased26 (67)744290-
Beta 2 microglobulin
≥3.5 mg/L21(58)77530.316.35
(0.2–1.5)
92-0.940.95
(0.2–3.5)
<3.5 mg/L15 (42)644295-
Lymph nodes diameter
≥5 cm17 (46)67440.781.1
(0.4–2.6)
94-0.351.7
(0.5–5.8)
<5 cm20 (54)734793-
Large and confluent PCs
Present9 (24)30350.0034.50
(1.6–12.1)
85590.025.17
(1.2–21.1)
Absent28 (76)8562960
Ki67%
≥30%15 (40)58400.042.41
(1–5.6)
931260.0098.1
(1.7–38.6)
<30%23 (60)8553100-
CD38+
Present18 (47)65490.930.96
(0.3–2.4)
921260.202.19
(0.6–7.2)
Absent19 (51)734789-
Unmutated IGHV
Present21 (54)59400.070.43
(0.2–1)
95-0.040.20
(0.04–0.9)
Absent18 (46)8653100-
Del(17p) and or mutated TP53
Present7 (19)57470.701.21
(0.4–3.3)
831260.711.31
(0.3–5.6)
Absent30 (81)764896-
Del(11q)
Present6 (19)75320.014.21
(1.3–13)
83400.015.49
(1.4–20.8)
Absent25 (81)4048100-
Trisomy 12
Present8 (26)85490.430.64
(0–1.9)
100-0.930.40
(0.05–3.2)
Absent23 (74)644795126
Del(13q)
Present4(14)50350.202.04
(0.6–6.1)
100-0.600.57
(0.07–4.5)
Absent27 (86)724795126
Abbreviations: BR, bendamustine, rituximab; Del, deletion; FCR, fludarabine, cyclophosphamide, rituximab; HR, hazard ratio; LDH, lactate dehydrogenase; PCs, proliferation centers; OS, overall survival; PFS, progression-free survival; SUV, standardized uptake value.

