Article

The Combination of Low Skeletal Muscle Mass and High Tumor Interleukin-6 Associates with Decreased Survival in Clear Cell Renal Cell Carcinoma

1
Departments of Surgery, IU School of Medicine, Indianapolis, IN 46202, USA
2
Indiana University Simon Cancer Center, Indianapolis, IN 46202, USA
3
Indiana Center for Musculoskeletal Health, Indianapolis, IN 46202, USA
4
Indiana University Purdue University Indianapolis Center for Cachexia Research Innovation and Therapy, Indianapolis, IN 46202, USA
5
Department of Medicine, IU School of Medicine, Indianapolis, IN 46202, USA
6
Department of Medical and Molecular Genetics, IU School of Medicine, Indianapolis, IN 46202, USA
7
Richard L. Roudebush Veterans Administration Medical Center, Indianapolis, IN 46202, USA
*
Author to whom correspondence should be addressed.
Cancers 2020, 12(6), 1605; https://doi.org/10.3390/cancers12061605
Submission received: 30 November 2019 / Revised: 1 June 2020 / Accepted: 1 June 2020 / Published: 17 June 2020
(This article belongs to the Special Issue Cancer Cachexia)

Abstract

:
Clear cell renal carcinoma (ccRCC) is frequently associated with cachexia which is itself associated with decreased survival and quality of life. We examined relationships among body phenotype, tumor gene expression, and survival. Demographic, clinical, computed tomography (CT) scans and tumor RNASeq for 217 ccRCC patients were acquired from the Cancer Imaging Archive and The Cancer Genome Atlas (TCGA). Skeletal muscle and fat masses measured from CT scans and tumor cytokine gene expression were compared with survival by univariate and multivariate analysis. Patients in the lowest skeletal muscle mass (SKM) quartile had significantly shorter overall survival versus the top three SKM quartiles. Patients who fell into the lowest quartiles for visceral adipose mass (VAT) and subcutaneous adipose mass (SCAT) also demonstrated significantly shorter overall survival. Multiple tumor cytokines correlated with mortality, most strongly interleukin-6 (IL-6); high IL-6 expression was associated with significantly decreased survival. The combination of low SKM/high IL-6 was associated with significantly lower overall survival compared to high SKM/low IL-6 expression (26.1 months vs. not reached; p < 0.001) and an increased risk of mortality (HR = 5.95; 95% CI = 2.86–12.38). In conclusion, tumor cytokine expression, body composition, and survival are closely related, with low SKM/high IL-6 expression portending worse prognosis in ccRCC.

Graphical Abstract

1. Introduction

Renal Cell Carcinoma is the third most common cancer of the genitourinary tract [1] and its incidence is increasing in the United States [2]. The clear cell variant of Renal Cell Carcinoma (ccRCC) represents over 80% of all histologic subtypes of renal cancer [3], and is frequently associated with the development cachexia symptoms [4,5,6]. Cachexia, a complex metabolic derangement characterized by skeletal muscle and fat loss develops in a significant number of patients with ccRCC. Previous studies have shown that development of cachexia is associated with a three-fold increased rate of disease recurrence and a four-fold increased risk of disease specific death in patients with ccRCC [7].
Cachexia, which affects up to 80% of patients with advanced cancer [8], is also associated with decreased quality of life, poor response to chemotherapy, and has been implicated as the cause of death as many as 20% of cancer patients [9,10,11]. Furthermore it has been established that the development of cachexia symptoms is associated with a decreased overall survival [3,6,12,13], and poor outcomes following surgery or targeted therapy for ccRCC [14,15,16,17]. Additionally, low muscle mass has been shown to be a significant predictor of sorafenib toxicity in patients with metastatic renal carcinoma [18].
Cachexia is caused, in part, by the pleiotropic actions of inflammatory cytokines on multiple tissues from modulating the tumor microenvironment, to disrupting hematopoiesis, to altering central mechanisms of food intake, basal temperature, activity, and energy expenditure, to direct induction of lipolysis, muscle catabolism and bone loss [19,20]. The collective action of cytokines result in impaired host defenses and wasting of peripheral tissues, leading to reduced response to chemotherapy, high rates of adverse events, progressive functional decline, and death. Cytokines implicated in these disease processes, either through association in patient studies or via functional studies in animal models include Tumor Necrosis Factor (TNF), interleukin-1α (IL-1α), interferon-gamma (INF-γ), members of the Transforming Growth Factor-β (TGF-β) superfamily, including TGF-β itself as well as the Activins, Myostatin, Growth Differentiation Factor-15 (GDF-15), GDF-11, and members of the Interleukin-6/GP130 superfamily, including IL-6, Leukemia Inhibitor Factor (LIF), and ciliary neurotrophic factor (CNTF) [21,22,23] Among these, TNF [24] and IL-6 [25] are the best studied, followed by IL-1α [26], Activin [27], and TGF-β [28], with far less information about the other cytokines.
Consistent with a role for inflammatory cytokines in cachexia of patients with ccRCC, cytokines and markers of the inflammatory response such as C-reactive protein, low albumin and high neutrophil-to-lymphocyte ratio are also associated with poor outcomes in ccRCC. Serum concentrations of TNF-∝, IL-6 and INF-γ are elevated in a subset of patients with ccRCC compared to healthy controls [29]. Elevated serum L-6 has also been shown to be a negative prognostic factor in patients with renal cell carcinoma [29,30] and to associate with weight loss and other paraneoplastic symptoms in this disease [31]. Less studied is the association of tumor-expressed cytokines and the systemic response to cancer.
This study uses a national database of patient CT scans, demographic information, tumor gene expression data and disease specific data to assesses the association between skeletal muscle (SKM), visceral adipose (VAT), and subcutaneous adipose (SCAT) mass and overall survival in patients with ccRCC. Additionally, tumor-derived cachexia-associated cytokines were assessed for correlation with skeletal muscle, fat, and overall survival. The results demonstrate, for the first time, a strong association of low muscle mass and high tumor IL-6 expression with mortality, a finding that could eventually be useful in treatment and prognostication in ccRCC.

2. Results

2.1. Patient Clinical Characteristics

The baseline patient characteristics were determined and are shown in Table 1. The overall mean age was 59.65 years (SD = 12.46) with no significant difference between men and women. There was no significant difference in tumor grade, American Joint Committee on Cancer (AJCC) stage, or tumor laterality between men and women.

2.2. Body Composition

The analysis of body composition by age showed patients below the median age had significantly more SKM but no difference in VAT or SCAT when compared to those above the median (Table 2). The lower stage was also associated with increased SKM, VAT and SCAT (Table 2).

2.3. Characteristics Associated with Survival

The median overall survival (OS) for all patients was calculated using Kaplan–Meier analysis methods and was 75.2 months. There was no sex-specific difference in overall survival, which was 75.6 months for males and 64.6 months for females (p = 0.123). The univariate analysis revealed that age greater than median, lowest SKM, VAT and SCAT quartiles, AJCC stage 3/4, and left sided tumors were associated with increased risk of mortality (Table 3). The Kaplan–Meier analysis showed the highest three SKM quartiles had significantly longer overall survival than the bottom quartile (Figure 1A). This was also true for IL-6 expression below the median (Figure 1B). The combination of low SKM/high IL-6 expression showed significantly worse overall survival than the combination of high SKM/low IL-6 expression (Figure 1C).

2.4. Body Composition Versus Tumor Gene Expression

Body composition and tumor gene expression were analyzed for correlation, and the results are shown in Table 4. SKM was found to have significant direct correlation with INHBB and TGFB2. VAT had a significant direct correlation with INHBB and inversely correlates with CCL2. SCAT was found to have significant direct correlation with CNTF. Seven genes were found to be associated with ACM and are summarized in Table 4. Of these seven genes, two were found to have a strong inverse correlation with survival, IL-6 and IL-11. Others include INHA, OSM, IL1A, TGFB1, and CLCF1.

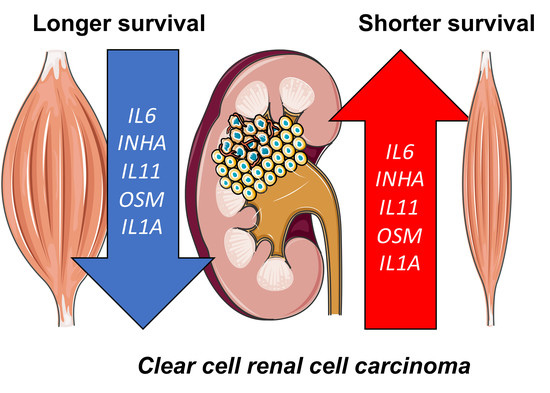
2.5. Body Composition and Tumor Gene Expression Versus Survival

Patients were then stratified into groups based on SKM mass and expression of each cytokine shown to have a significant association with survival. Of all possible combinations, low SKM/high IL-6 and low SKM/high CLCF1 demonstrated the lowest overall median survival at 26.1 months (Table 5). The combination of low SKM/high IL-6 expression had the highest risk of mortality with HR = 5.95 (95%CI = 2.86–12.38) (Table 5).

3. Discussion

The current study evaluated the associations between body composition, tumor cytokine gene expression and survival in patients with ccRCC. To the authors knowledge, this is the first study to examine these relationships in ccRCC. The data show a clear relationship between body composition, tumor cytokine expression, and survival in ccRCC. The most notable relationship is the association of the combination of low SKM/high IL-6 expression and significantly decreased survival. These results provide additional evidence of the interconnectivity of these factors and support their potential as prognostic factors and possibly targets for intervention to improve outcomes.
Sarcopenia, defined as low skeletal muscle mass, is a well-established poor prognostic factor for patients with malignancies including ccRCC [32]. One of the most widely used prognostic models for ccRCC is the Memorial Sloan Kettering Cancer Center Renal Carcinoma Risk model (MSKCC-RCC), which uses the Karnofsky performance scale as its measure of performance status. This scale relies heavily on patient self-reporting and subjective physician observations, both of which can be inconsistent. The incorporation of sarcopenia into the MSKCC-RCC model has been shown to improve its predictive accuracy [32]. Unfortunately, the current study lacked all data points to calculate the MSKCC-RCC score for patients. However, our data reinforce the importance of SKM and highlight the importance of objective measures of SKM, perhaps even to fully replace subjective measures of patient performance.
Obesity has also been shown to have prognostic value in renal cell carcinoma as it has been shown to be associated with increased survival in patients with both localized and metastatic ccRCC [33,34]. While the reason for this survival advantage is unclear, the current study reinforces the notion that fat has a protective role in ccRCC. Obesity, however, is also a known risk factor for developing RCC, specifically the clear cell variant [35,36]. This paradox may be explained by how the fat is distributed in the body, and not just its general presence.
Fat is no longer considered an inert tissue. Adipose tissue has been shown to produce multiple inflammatory cytokines including IL-6 [37,38], and in particular, visceral adipose tissue has been shown to produce IL-6 at greater levels than subcutaneous adipose tissue [39,40]. Elevated IL-6 levels have also been shown to be associated with increased invasiveness and decreased survival in other cancers, especially colon cancer [41,42]. Not only is IL-6 frequently elevated in renal cell carcinoma [31], Table 4 shows its expression is associated with a 2.3 times increased risk of mortality. No previous studies have examined the correlations between fat compartment distribution and the risk of developing ccRCC, however with the data presented in the current study showing higher levels of SCAT to be protective while higher levels of VAT show no advantage, it is possible that the culprit behind the increased risk of ccRCC in obesity is VAT. Further studies will need to be performed to determine if this hypothesis is correct.
The combination of low SKM and high IL-6 expression was shown above to be associated with a significantly decreased overall survival. IL-6, an activator of STAT3, frequently elevated in RCC [31], is known to induce tumor progression and metastasis across tumor types [43], and is sufficient to induce skeletal muscle STAT3 activation leading to muscle wasting resulting cachexia [44,45]. Tumor-specific antineoplastic agents have also been suspected to contribute to muscle and fat-wasting observed in many cancers, however, few have been characterized. Sorafenib, a tyrosine kinase inhibitor often used to treat ccRCC, is one that has been shown to independently cause muscle and fat loss, possibly via hyperactiviation of STAT3 and ERK at the muscle [46]. Dual activation of these cachexia pathways would be expected to cause severe cachexia resulting in shorter median survival.
Although the data presented here do not show a significant correlation between IL-6 with any specific tissue, it does show that IL-6 expression to have an exceedingly strong negative correlation with overall survival. With this data in mind, along with the previously established connections between IL-6 and cachexia, care must be taken when designing chemotherapy regimens in order to prevent possible acceleration of cachexia, especially in patients who present with low skeletal muscle mass, resulting in poorer outcomes and decreased survival.
This study does have limitations. First, there was significant difference in age in the top three SKM quartiles compared to the lowest quartile. It is not surprising that the lowest quartile for SKM would be older as muscle loss is part of the aging process. The multivariate analysis showed SKM to trend towards independent association with OS, while age showed no such evidence. In a larger cohort, the authors expect that SKM would show an independent association with OS, while age would not.
There was also a difference in AJCC stage between quartiles for SKM and VAT and AJCC strongly correlated with survival. The difference for SKM occurred between the first and the fourth quartiles. OS was significantly different between the second and fourth and third and fourth SKM quartiles as well with no difference in AJCC stage, so it can be concluded that this difference between the first and fourth quartiles was not responsible for the difference in survival between the two groups. The post-hoc analysis for the difference in AJCC stage in between the VAT quartiles was unable to identify where the difference occurred, therefore, it cannot be concluded that the difference in survival between the quartiles was due to any influence from AJCC stage.
Twenty percent (54/271) of the patients with data available in the registry were removed from the study due to CT scans that were unable to be analyzed. This represents a significant number and inclusion of these patients may have influenced the results. Additionally, several variables of interest were not available in the dataset including all variables in the MSKCC-RCC risk model, type of chemotherapy, and BMI.
Despite these limitations, the study demonstrates a clear and significant difference in OS based on body composition and tumor cytokine expression in ccRCC. Additionally, the data were collected from a national tumor registry, increasing the probability of a true representation of the national population and not just a specific area of the country allowing for the results to be applied broadly.
Currently, there are limited opportunities for medical oncologists and surgical oncologists to assess muscularity in patients with cancer. Few oncology clinics monitor body composition quantitatively. With the advent of automated body composition analysis from diagnostic CT or MRI scans, however, the standardized reporting of muscularity could become commonplace. Moreover, in the era of precision medicine for oncology, many centers routinely sequence tumors, both genomic and transcriptomic. Such molecular characterization of tumors, even for single features such as IL6, could also become as routine as immunohistochemistry is now. These tools would permit the stratification of patient risk of mortality, and ultimately, targeted therapy.

4. Materials and Methods

The Cancer Imaging Archive (TCIA) [47,48] and The Cancer Genome Atlas (TCGA) https://www.cancer.gov/tcga were queried for patients with ccRCC. Demographic and clinical data are available for 536 patients and RNAseq data are available for 533 patients. Abdominal computed tomography (CT) scans adequate for analysis were available for 217 of the patients with available clinical data and 215 of the patients with available RNAseq data. Images were analyzed for cross-sectional area (cm2) of SKM, VAT, and SCAT at the level of the third lumbar vertebrae (L3) using Slice-O-Matic software V4.3 (Tomovision, Montreal, Quebec, Canada) (Figure 1). Hounsfield unit thresholds were set at −29 to +150 for SKM, −50 to −150 for VAT, and at −30 to −190 for SCAT. Two consecutive images at L3 were assessed. The mean of the 2 images was used for statistical analysis. Total muscle measurements included the rectus abdominus, external and internal oblique, transversus abdominus, psoas, erector spinae, and quadratus lumborum.
The TCGA database was queried for RNAseq data for the 217 patients with analyzed CT scans. Only 2 patients did not have RNAseq data available resulting in a total of 215 patients. A total of 20,531 total genes were identified. A total of 1,369 genes were found to be expressed in <10% of the samples and were removed resulting in 19,162 genes for analysis.
Patients were divided into quartile for each tissue by sex. The male and female quartiles were analyzed individually and combined by the Kaplan–Meier method to evaluate for differences in overall survival. When a difference was present, Kaplan–Meier survival curves were created between each quartile to identify where the difference existed. Univariate and multivariate Cox proportional hazard models were created for each sex and the sexes combined. All hazard ratios are reported 95% confidence intervals and p values.
Body composition and overall survival were compared with tumor gene expression of 21 cachexia-associated cytokines which included Interleukin-1 alpha (IL1a), Interleukin-1 beta (IL1b), Interleukin-6 (IL6), Interleukin-11 (IL11), Tumor Necrosis Factor (TNF), Growth Differentiation Factor-11 (GDF11), Growth Differentiation Factor-15 (GDF15), Myostatin (MSTN), Oncostatin M (OSM), Chemokine C-C motif ligand 2 (CCL2), Ciliary Neurotrophic Factor (CNTF), Cardiotrophin-like Cytokine Factor 1 (CLCF1), Cardiotrophin 1 (CTF1), Inhibin alpha (INHA), Inhibin Beta A (INHBA), Inhbin Beta B (INHBB), Follistatin (FST), Follistatin-like 3 (FSTL3), Transforming Growth Factor Beta-1 (TGFB1), Transforming Growth Factor Beta-2 (TGFB2), and Transforming Growth Factor Beta-3 (TGFB3). Spearman’s rank correlation with false discovery rate for multiple comparisons was performed. A rho value >0.1 and p value < 0.05 were considered significant. Only significant associations are reported.
Continuous variables were assessed with student t-test or one-way analysis of variance (ANOVA) when appropriate. Categorical variables were analyzed using chi-squared test and Mann–Whitney U test. All results are reported as means with standard deviation. All statistical analyses were completed using IBM SPSS Statistics for Windows version 23.0 (SPSS, Chicago, IL). Results were considered significant at the p < 0.05.

5. Conclusions

Low skeletal muscle and visceral and subcutaneous adipose masses have a clear and significant association with decreased overall survival in patients with clear cell renal carcinoma. These findings support previous studies, agreeing that cachexia is a major cause of mortality in cancer, adding ccRCC to the list of malignancies in which this association has been made. Additionally, a number of tumor-derived cytokines are associated with an increased risk of all-cause mortality, perhaps most importantly IL-6. Finally, we show, for the first time, that the combination of low skeletal muscle mass and high IL-6 expression is an especially concerning combination that predicts early death in patients with ccRCC. Ultimately, once the appropriate tools are available, including automated body composition analysis and reporting of tumor transcriptomics, these factors could be considered when designing a patient care plan and counseling ccRCC patients on prognoses.

Author Contributions

Conceptualization, L.G.K., R.P. and T.A.Z.; Data curation, J.K.K., C.A.C. and G.J.; Formal analysis, J.K.K., C.A.C., G.J. and T.A.Z.; Funding acquisition, T.A.Z.; Investigation, J.K.K., C.A.C. and G.J.; Methodology, J.K.K., G.J., Y.L. and T.A.Z.; Project administration, L.G.K. and T.A.Z.; Supervision, L.G.K.s, R.P., Y.L. and T.A.Z.; Validation, L.G.K.; Visualization, T.A.Z.; Writing – original draft, J.K.K.; Writing – review & editing, J.K.K., L.G.K. and T.A.Z. All authors have read and agreed to the published version of the manuscript.

Funding

The results <published or shown> here are in whole or part based upon data generated by the TCGA Research Network: http://cancergenome.nih.gov/. This work was funded in part by grants to T.A.Z. from the Veterans Administration (grant I01 BX004177), the National Institutes of Health (grants R01 CA122596 and R01 CA194593), the IU Simon Cancer Center, the Lustgarten Foundation, and the IUPUI Signature Center for Pancreatic Cancer Research, and by grants to L.G.K. from the National Institutes of Health (R01 DK096167) and the Lilly Endowment, Inc. We thank the Collaborative Core for Cancer Bioinformatics, a resource supported by the IU Simon Cancer Center (NCI Grant P30 CA082709), the Purdue University Center for Cancer Research (Grant P30CA023168), and the Walther Cancer Foundation.

Conflicts of Interest

The authors declare no conflict of interest.

References

  1. Siegel, R.L.; Miller, K.D.; Jemal, A. Cancer Statistics, 2016. CA Cancer J. Clin. 2016, 66, 7–30. [Google Scholar] [CrossRef] [Green Version]
  2. Chow, W.-H.; Devesa, S.S.; Warren, J.L.; Fraumeni, J.J.F. Rising Incidence of Renal Cell Cancer in the United States. JAMA 1999, 281, 1628–1631. [Google Scholar] [CrossRef] [PubMed] [Green Version]
  3. Lee, W.K.; Hong, S.K.; Lee, S.; Kwak, C.; Oh, J.J.; Jeong, C.W.; Kim, Y.J.; Kang, S.H.; Hong, S.-H.; Byun, S.-S. Prognostic Value of Body Mass Index According to Histologic Subtype in Nonmetastatic Renal Cell Carcinoma: A Large Cohort Analysis. Clin. Genitourin. Cancer 2015, 13, 461–468. [Google Scholar] [CrossRef] [PubMed]
  4. Ding, G.; Feng, C.; Song, N.; Fang, Z.; Xia, G.; Jiang, H.-W.; Hua, L.-X.; Ding, Q. Paraneoplastic symptoms: Cachexia, polycythemia, and hypercalcemia are, respectively, related to vascular endothelial growth factor (VEGF) expression in renal clear cell carcinoma. Urol. Oncol. Semin. Orig. Investig. 2013, 31, 1820–1825. [Google Scholar] [CrossRef] [PubMed]
  5. Ding, G.; Song, N.; Feng, C.; Xia, G.; Jiang, H.-W.; Hua, L.-X.; Ding, Q. Is There an Association between Advanced Stage of Renal Cell Carcinoma and Paraneoplastic Syndrome? Med. Princ. Pract. 2012, 21, 370–374. [Google Scholar] [CrossRef] [Green Version]
  6. Kim, H.L.; Belldegrun, A.S.; Freitas, D.G.; Bui, M.H.; Han, K.-R.; Dorey, F.J.; Figlin, R.A. Paraneoplastic Signs and Symptoms of Renal Cell Carcinoma: Implications for Prognosis. J. Urol. 2003, 170, 1742–1746. [Google Scholar] [CrossRef] [PubMed] [Green Version]
  7. Kim, H.L.; Han, K.-R.; Zisman, A.; Figlin, R.A.; Belldegrun, A.S. Cachexia-Like Symptoms Predict a Worse Prognosis in Localized T1 Renal Cell Carcinoma. J. Urol. 2004, 171, 1810–1813. [Google Scholar] [CrossRef]
  8. Baracos, V. Pitfalls in defining and quantifying cachexia. J. Cachexia Sarcopenia Muscle 2011, 2, 71–73. [Google Scholar] [CrossRef] [Green Version]
  9. Von Haehling, S.; Anker, S.D. Cachexia as a major underestimated and unmet medical need: facts and numbers. J. Cachex-Sarcopenia Muscle 2010, 1, 1–5. [Google Scholar] [CrossRef] [PubMed] [Green Version]
  10. Blum, D.; Stene, G.B.; Solheim, T.S.; Fayers, P.; Hjermstad, M.J.; Baracos, V.E.; Fearon, K.; Strasser, F.; Kassa, S. Validation Fo the Consensus-Definition for Cancer Cachexia and Evaluation of a Classification Model—a Study Based on Data from an International Multicentre Project (Epcrc-Csa). Ann. Oncol. 2014, 25, 1635–1642. [Google Scholar] [CrossRef] [PubMed]
  11. Tan, B.H.; Fearon, K.C. Cachexia: Prevalence and impact in medicine. Curr. Opin. Clin. Nutr. Metab. Care 2008, 11, 400–407. [Google Scholar] [CrossRef] [PubMed]
  12. Park, B.; Jeong, B.C.; Seo, S.I.; Jeon, S.S.; Choi, H.Y.; Lee, H.M. Influence of Body Mass Index, Smoking, and Blood Pressure on Survival of Patients with Surgically-Treated, Low Stage Renal Cell Carcinoma: A 14-Year Retrospective Cohort Study. J. Korean Med. Sci. 2013, 28, 227–236. [Google Scholar] [CrossRef] [PubMed]
  13. Sharma, P.; Shoshtari, K.Z.; Caracciolo, J.T.; Fishman, M.; Poch, M.A.; Pow-Sang, J.; Sexton, W.J.; Spiess, P.E. Sarcopenia as a predictor of overall survival after cytoreductive nephrectomy for metastatic renal cell carcinoma. Urol. Oncol. Semin. Orig. Investig. 2015, 33, 339.e17–339.e23. [Google Scholar] [CrossRef] [PubMed]
  14. Haferkamp, A.; Pritsch, M.; Bedke, J.; Wagener, N.; Pfitzenmaier, J.; Buse, S.; Hohenfellner, M. The Infuence of Body Mass Index on the Long-Term Survival of Patients with Renal Cell Carcinoma after Tumour Nephrectomy. BJU Int. 2008, 101, 1243–1246. [Google Scholar] [CrossRef]
  15. Morgan, T.M.; Tang, D.; Stratton, K.L.; Barocas, D.A.; Anderson, C.B.; Gregg, J.R.; Chang, S.S.; Cookson, M.S.; Herrell, S.B.; Smith, J.A., Jr.; et al. Preoperative Nutrtional Status Is an Important Predictor of Survival in Patients Undergoing Surgery for Renal Cell Carcinoma. Eur. J. Urol. 2011, 59, 923–928. [Google Scholar] [CrossRef] [Green Version]
  16. Antoun, S.; Lanoy, E.; Iacovelli, R.; Albiges-Sauvin, L.; Loriot, Y.; Merad-Taoufik, M.; Fizazi, K.; Di Palma, M.; Baracos, V.; Escudier, B. Skeletal muscle density predicts prognosis in patients with metastatic renal cell carcinoma treated with targeted therapies. Cancer 2013, 119, 3377–3384. [Google Scholar] [CrossRef]
  17. Corcoran, A.; Kaffenberger, S.; Clark, P.E.; Walton, J.; Handorf, E.; Piotrowski, Z.; Tomaszewski, J.J.; Ginzburg, S.; Mehrazin, R.; Plimack, E.; et al. Hypoalbuminaemia is associated with mortality in patients undergoing cytoreductive nephrectomy. BJU Int. 2014, 116, 351–357. [Google Scholar] [CrossRef] [Green Version]
  18. Antoun, S.; Baracos, V.; Birdsell, L.; Escudier, B.; Sawyer, M.B. Low body mass index and sarcopenia associated with dose-limiting toxicity of sorafenib in patients with renal cell carcinoma. Ann. Oncol. 2010, 21, 1594–1598. [Google Scholar] [CrossRef]
  19. Zimmers, T.A.; Fishel, M.; Bonetto, A. STAT3 in the systemic inflammation of cancer cachexia. Semin. Cell Dev. Biol. 2016, 54, 28–41. [Google Scholar] [CrossRef] [Green Version]
  20. Tuomisto, A.; Mäkinen, M.J.; Väyrynen, J.P. Systemic inflammation in colorectal cancer: Underlying factors, effects, and prognostic significance. World J. Gastroenterol. 2019, 25, 4383–4404. [Google Scholar] [CrossRef]
  21. Aoyagi, T.; Terracina, K.P.; Raza, A.; Matsubara, H.; Takabe, K. Cancer cachexia, mechanism and treatment. World J. Gastrointest. Oncol. 2015, 7, 17–29. [Google Scholar] [CrossRef] [PubMed]
  22. Argilés, J.M.; López-Soriano, F.J. The role of cytokines in cancer cachexia. Med. Res. Rev. 1999, 19, 223–248. [Google Scholar] [CrossRef]
  23. Belizário, J.; Fontes-Oliveira, C.C.; Borges, J.P.; Kashiabara, J.A.; Vannier, E. Skeletal muscle wasting and renewal: A pivotal role of myokine IL-6. SpringerPlus 2016, 5, 619. [Google Scholar] [CrossRef] [PubMed] [Green Version]
  24. Onesti, J.K.; Guttridge, D.C. Inflammation Based Regulation of Cancer Cachexia. BioMed Res. Int. 2014, 2014, 1–7. [Google Scholar] [CrossRef] [PubMed]
  25. Narsale, A.; Carson, J.A. Role of interleukin-6 in cachexia: Therapeutic implications. Curr. Opin. Support. Palliat. Care 2014, 8, 321–327. [Google Scholar] [CrossRef] [Green Version]
  26. McDonald, J.; McMillan, D.C.; Laird, B.J. Targeting IL-1α in cancer cachexia. Curr. Opin. Support. Palliat. Care 2018, 12, 453–459. [Google Scholar] [CrossRef] [PubMed]
  27. Marino, F.E.; Risbridger, G.P.; Gold, E. The therapeutic potential of blocking the activin signalling pathway. Cytokine Growth Factor Rev. 2013, 24, 477–484. [Google Scholar] [CrossRef]
  28. Guttridge, D.C. A TGF-β pathway associated with cancer cachexia. Nat. Med. 2015, 21, 1248–1249. [Google Scholar] [CrossRef] [Green Version]
  29. Dosquet, C.; Schaetz, A.; Faucher, C.; Lepage, E.; Wautier, J.-L.; Richard, F.; Cabane, J. Tumour necrosis factor-α, interleukin-1β and interleukin-6 in patients with renal cell carcinoma. Eur. J. Cancer 1994, 30, 162–167. [Google Scholar] [CrossRef]
  30. Blay, J.Y.; Negrier, S.; Combaret, V.; Attali, S.; Goillot, E.; Merrouche, Y.; Mercatello, A.; Ravault, A.; Tourani, J.M.; Moskovtchenko, J.F. Serum level of interleukin 6 as a prognosis factor in metastatic renal cell carcinoma. Cancer Res. 1992, 52, 3317–3322. [Google Scholar]
  31. Blay, J.-Y.; Rossi, J.-F.; Wijdenes, J.; Menetrier-Caux, C.; Schemann, S.; Negrier, S.; Phillip, T.; Favrot, M. Role of Interleukin-6 in the Paraneoplastic Inflammatory Syndrome Associated with Renal-Cell Carcinoma. Int. J. Cancer 1997, 72, 424–430. [Google Scholar] [CrossRef]
  32. Fukushima, H.; Nakanishi, Y.; Kataoka, M.; Tobisu, K.-I.; Koga, F. Prognostic Significance of Sarcopenia in Patients with Metastatic Renal Cell Carcinoma. J. Urol. 2016, 195, 26–32. [Google Scholar] [CrossRef] [PubMed]
  33. Waalkes, S.; Merseburger, A.S.; Kramer, M.W.; Herrmann, T.R.W.; Wegener, G.; Rustemeier, J.; Hofmann, R.; Schrader, M.; Kuczyk, M.A.; Schrader, A.J. Obesity is associated with improved survival in patients with organ-confined clear-cell kidney cancer. Cancer Causes Control. 2010, 21, 1905–1910. [Google Scholar] [CrossRef] [PubMed]
  34. Steffens, S.; Grunwald, V.; Ringe, K.I.; Seidel, C.; Eggers, H.; Schrader, M.; Wacker, F.; Kuczyk, M.A.; Schrader, A.J. Does Obesity Influence the Prognosis of Metastatic Renal Cell Carcinoma in Patientstreated with Vascular Endothelial Growth Factor-Targeted Therapy? Oncologist 2011, 16, 1565–1571. [Google Scholar] [CrossRef] [PubMed] [Green Version]
  35. Chow, W.-H.; Dong, L.M.; Devesa, S.S. Epidemiology and risk factors for kidney cancer. Nat. Rev. Urol. 2010, 7, 245–257. [Google Scholar] [CrossRef] [PubMed]
  36. Lowrance, W.T.; Thompson, R.H.; Yee, D.S.; Kaag, M.; Donat, S.; Russo, P. Obesity is associated with a higher risk of clear-cell renal cell carcinoma than with other histologies. BJU Int. 2009, 105, 16–20. [Google Scholar] [CrossRef] [Green Version]
  37. Fantuzzi, G. Adipose tissue, adipokines, and inflammation. J. Allergy Clin. Immunol. 2005, 115, 911–919. [Google Scholar] [CrossRef]
  38. Mohamed-Ali, V.; Goodrick, S.; Rawesh, A.; Katz, D.R.; Miles, J.M.; Yudkin, J.S.; Klein, S.; Coppack, S. Subcutaneous Adipose Tissue Releases Interleukin-6, But Not Tumor Necrosis Factor-α, In Vivo. J. Clin. Endocrinol. Metab. 1997, 82, 4196–4200. [Google Scholar] [CrossRef]
  39. Fain, J.; Madan, A.K.; Hiler, M.L.; Cheema, P.; Bahouth, S.W. Comparison of the Release of Adipokines by Adipose Tissue, Adipose Tissue Matrix, and Adipocytes from Visceral and Subcutaneous Abdominal Adipose Tissues of Obese Humans. Endocrinology 2004, 145, 2273–2282. [Google Scholar] [CrossRef] [Green Version]
  40. Fried, S.; Bunkin, D.; Greenberg, A. Omental and Subcutaneous Adipose Tissue of Obese Subjects Release Interleukin-6: Depot Difference Ad Regulation by Glucocorticoid. J. Clin. Endocrinol. Metab. 1998, 83, 847–850. [Google Scholar]
  41. Hsu, C.-P.; Chung, Y.-C. Influence of interleukin-6 on the invasiveness of human colorectal carcinoma. Anticancer Res. 2007, 26, 4607–4614. [Google Scholar]
  42. Chung, Y.-C.; Chang, Y.-F. Serum interleukin-6 levels reflect the disease status of colorectal cancer. J. Surg. Oncol. 2003, 83, 222–226. [Google Scholar] [CrossRef] [PubMed]
  43. Johnson, D.E.; O’Keefe, R.A.; Grandis, J.R. Targeting the IL-6/JAK/STAT3 signalling axis in cancer. Nat. Rev. Clin. Oncol. 2018, 15, 234–248. [Google Scholar] [CrossRef] [PubMed]
  44. Bonetto, A.; Aydoğdu, T.; Kunzevitzky, N.; Guttridge, D.C.; Khuri, S.; Koniaris, L.G.; Zimmers, T.A. STAT3 Activation in Skeletal Muscle Links Muscle Wasting and the Acute Phase Response in Cancer Cachexia. PLoS ONE 2011, 6, e22538. [Google Scholar] [CrossRef] [PubMed] [Green Version]
  45. Bonetto, A.; Aydogdu, T.; Jin, X.; Zhang, Z.; Zhan, R.; Puzis, L.; Koniaris, L.G.; Zimmers, T.A. Jak/Stat3 Pathway Inhibition Blocks Skeletal Muscle Wasting Downstrea of Il-6 and in Experimental Cancer Cachexia. Am. J. Physiol. Endocrinol. Metab. 2012, 303, E410–E421. [Google Scholar] [CrossRef] [PubMed] [Green Version]
  46. Kümmell, S.B.; Frey, E. Range of Movement in Ray I of Manus and Pes and the Prehensility of the Autopodia in the Early Permian to Late Cretaceous Non-Anomodont Synapsida. PLoS ONE 2014, 9, e113911. [Google Scholar] [CrossRef] [Green Version]
  47. Clark, K.; Vendt, B.; Smith, K.; Freymann, J.; Kirby, J.; Koppel, P.; Moore, S.; Phillips, S.; Maffitt, D.; Pringle, M.; et al. The Cancer Imaging Archive (TCIA): Maintaining and Operating a Public Information Repository. J. Digit. Imaging 2013, 26, 1045–1057. [Google Scholar] [CrossRef] [Green Version]
  48. Radiology Data from The Cancer Genome Atlas Kidney Renal Clear Cell Carcinoma [TCGA-KIRC] Collection. The Cancer Imaging Archive. Available online: http://doi.org/10.7937/K9/TCIA.2016.V6PBVTDR (accessed on 1 June 2020).
Figure 1. Survival stratified by skeletal muscle and IL-6 expression. (A) Patients in the lowest skeletal muscle mass quartile (blue line) had significantly shorter overall survival compared to the highest quartile (red line), second highest quartile (yellow line) and third highest quartile (green line). (B) Patients with IL-6 expression above the median (green line) have significantly shorter overall survival compared to those with expression below the median (blue line). (C) The combination of low SKM/high IL-6 expression (blue line) resulted in a decreased survival compared to high SKM/low IL-6 (red line), high SKM/high IL-6 (yellow line) and low SKM/low IL-6 (green line). SKM, skeletal muscle.
Cancers 12 01605 g001
Table 1. Patient Characteristics n = 217.
VariableNo. (%)Male/Femalep Value
Age, mean years (SD)59.7 (12.5) 0.09
Males58.6 (12.6)
Females61.6 (12.1)
Tumor Grade
Grade 10 (0)0/0
Grade 287 (40)48/39
Grade 394 (43)69/250.123
Grade 436 (17)22/14
AJCC Stage
Stage 1112 (52)71/41
Stage 218 (8)17/1
Stage 354 (25)34/200.459
Stage 433 (15)17/16
Tumor Laterality
Right116 (53)78/380.295
Left101 (47)61/40
Abbreviations: AJCC = American Joint Commission on Cancer.
Table 2. Body Composition/Tissue Area Measurements.
VariationMean SKM, cm2 (SD)p ValueMean VAT, cm2 (SD)p ValueMean SCAT, cm2 (SD)p Value
Overall155.1 (41.3) 179.3 (109.9) 200.8 (93.3)
Top Quartile192.3 (38.1)<0.001310.0 (85.3)<0.001326.6 (73.3)<0.001
Bottom Quartile121.9 (28.6)<0.00165.2 (41.8)<0.001104.5 (27.0)<0.001
Age
<59.7 years169.3 (41.3)<0.001177.4 (107.8)0.80205.4 (94.5)0.49
≥59.7 years140.1 (35.6)181.2 (112.5)195.5 (92.1)
AJCC Stage
Stage I159.8 (42.3)<0.001193.6 (109.7)<0.001212.3 (99.0)0.16
Stage II181.5 (37.6)247.9 (143.4)204.4 (75.3)
Stage III149.4 (39.3)165.2 (143.4)197.3 (93.4)
Stage IV133.7 (31.2)116.0 (71.0)166.2 (77.1)
Abbreviations: SKM = skeletal muscle mass, VAT = visceral adipose tissue mass, SCAT = subcutaneous adipose tissue mass.
Table 3. Association with All-Cause Mortality.
Univariate Analysis Multivariate Analysis
VariationHR (95% CI)p ValueHR (95% CI)p Value
Overall
Age
<59.7 yearsRef0.004Ref0.440
≥59.7 years2.1 (1.3–3.6)1.3 (0.7–2.6)
SKM mass
Top 3 quartilesRef<0.001Ref0.081
Lowest quartile3.2 (2.0–5.3)1.8 (0.9–3.5)
VAT mass
Top 3 quartilesRef0.03Ref0.61
Lowest quartile1.8 (1.1–3.0)1.2 (0.6–2.6)
SCAT mass
Top 3 quartilesRef<0.001Ref0.027
Lowest quartile2.7 (1.6–4.7)2.4 (1.1–5.4)
Tumor Grade
Grade 1/2Ref0.067Ref0.10
Grade 3/41.7 (0.96–2.9)0.52 (0.2–1.1)
AJCC Stage
Stage 1/2Ref<0.001Ref<0.001
Stage 3/44.0 (2.4–6.8)7.0 (3.3–14.5)
Laterality
RightRef0.023Ref0.004
Left1.8 (1.1–2.9)2.3 (1.3–4.2)
Sex
MaleRef0.123Not Included
Female1.5 (0.9–2.3)
Abbreviations: SKM = skeletal muscle mass, VAT = visceral adipose tissue mass, SCAT = subcutaneous adipose tissue mass, AJCC = American Joint Commission on Cancer.
Table 4. Tumor Gene Expression and Associations with Body Composition and Overall Survival.
TissueGeneCorrelation Coefficientp Value
SKMINHBB
TGFB2
0.149
0.150
0.029
0.028
VATINHBB
CCL2
1.79
−0.172
0.009
0.012
SCATCNTF0.1670.027
GeneCorrelation CoefficientHazard Ratiop Value
IL60.8352.31<0.0001
IL110.7002.01<0.0001
INHA0.6221.860.0001
OSM0.5851.800.0004
IL1A0.4831.620.003
TGFB10.4221.520.008
CLCF10.4001.490.01
Abbreviations: SKM = skeletal muscle mass, VAT = visceral adipose tissue mass, SCAT = subcutaneous adipose tissue mass, INHBB = Inhibin beta B, TGFB2 = Transforming Growth Factor β2, IL11 = Interluekin-11, GDF11 = growth differentiation factor 11, CCL2 = C-C Motif Chemokine Ligand 2, CNTF = Ciliary Neurotrophic Factor, IL6 = Interleukin 6. IL11 = Interleukin 11. INHA = Inhibin-α. OSM = Oncostatin M. IL1A = Interluekin 1a. TGFB1 = Transforming Growth Factor β1. CLCF1 = Cardiotrophin-like Cytokine Factor 1.
Table 5. Skeletal Muscle Mass-Cytokine Expression Survival and Mortality Risk.
GroupMedian OS (Months)p ValueHazard Ratio95% CI
SKM/IL6
High SKM/Low IL6Not Defined a<0.001Reference
High SKM/High IL679.51.670.81–3.45
Low SKM/Low IL674.21.450.54–3.87
Low SKM/High IL626.15.952.86–12.38
SKM/INHA
High SKM/Low INHANot Defined a<0.001Reference
High SKM/High INHA70.21.820.88–3.77
Low SKM/Low INHANot Defined a3.171.24–8.10
Low SKM/High INHA40.004.712.24–9.87
SKM/IL11
High SKM/Low IL11Not Defined a<0.001Reference
High SKM/High IL11Not Defined a1.390.68–2.84
Low SKM/Low IL1173.02.541.08–5.97
Low SKM/High IL1140.04.712.24–9.94
SKM/OSM
High SKM/Low OSMNot Defined a<0.001Reference
High SKM/High OSMNot Defined a0.830.41–1.67
Low SKM/Low OSM79.51.450.57–3.71
Low SKM/High OSM37.84.102.08–8.06
SKM/IL1A
High SKM/Low IL1ANot Defined a0.001Reference
High SKM/High IL1ANot Defined a0.930.47–1.87
Low SKM/Low IL1A75.22.400.99–5.85
Low SKM/High IL1A43.92.841.42–5.68
SKM/TGFB1
High SKM/Low TGFB1Not Defined a<0.001Reference
High SKM/High TGFB1Not Defined a1.310.65–2.66
Low SKM/Low TGFB141.03.951.74–8.93
Low SKM/High TGFB144.63.151.50–6.60
SKM/CLCF1
High SKM/Low CLCF1Not Defined a<0.001Reference
High SKM/High CLCF1Not Defined a0.530.26–1.09
Low SKM/Low CLCF175.21.440.65–3.18
Low SKM/High CLCF126.13.441.74–6.82
Abbreviations: SKM—skeletal muscle mass; OS—overall survival; IL-6—interleukin-6; INHA—inhibin alpha; IL-11—interleukin-11; OSM—oncostatin M; IL1A—interleukin 1 alpha; TGFB1 – tumor growth factor beta 1; CLCF1 —cardiotrophin like cytokine factor 1. a—median survival was not reached as greater than 50% of patients were still alive at time of analysis.

