Azasteroid Alkylators as Dual Inhibitors of AKT and ERK Signaling for the Treatment of Ovarian Carcinoma

 , , , ,
  ,
, 
Abstract
1. Introduction
2. Results
3. Discussion
4. Materials and Methods
4.1. Synthesis of Chemical Compounds
4.2. Cell Lines
4.3. Determination of Cell Viability by the MTT Assay
4.4. Determination of ERK 1/2 and AKT 1/2/3 Phosphorylation by ELISA
4.5. Determination of ERK 1/2 and AKT 1/2/3 Phosphorylation by Western Immunoblotting
4.6. Determination of In Vivo Toxicity and Antitumor Efficacy
4.7. Elucidation of Underlined Molecular Mechanism(s) by in Silico Approaches
4.8. Statistical Analysis
5. Conclusions
Supplementary Materials
Author Contributions
Funding
Conflicts of Interest
Appendix A

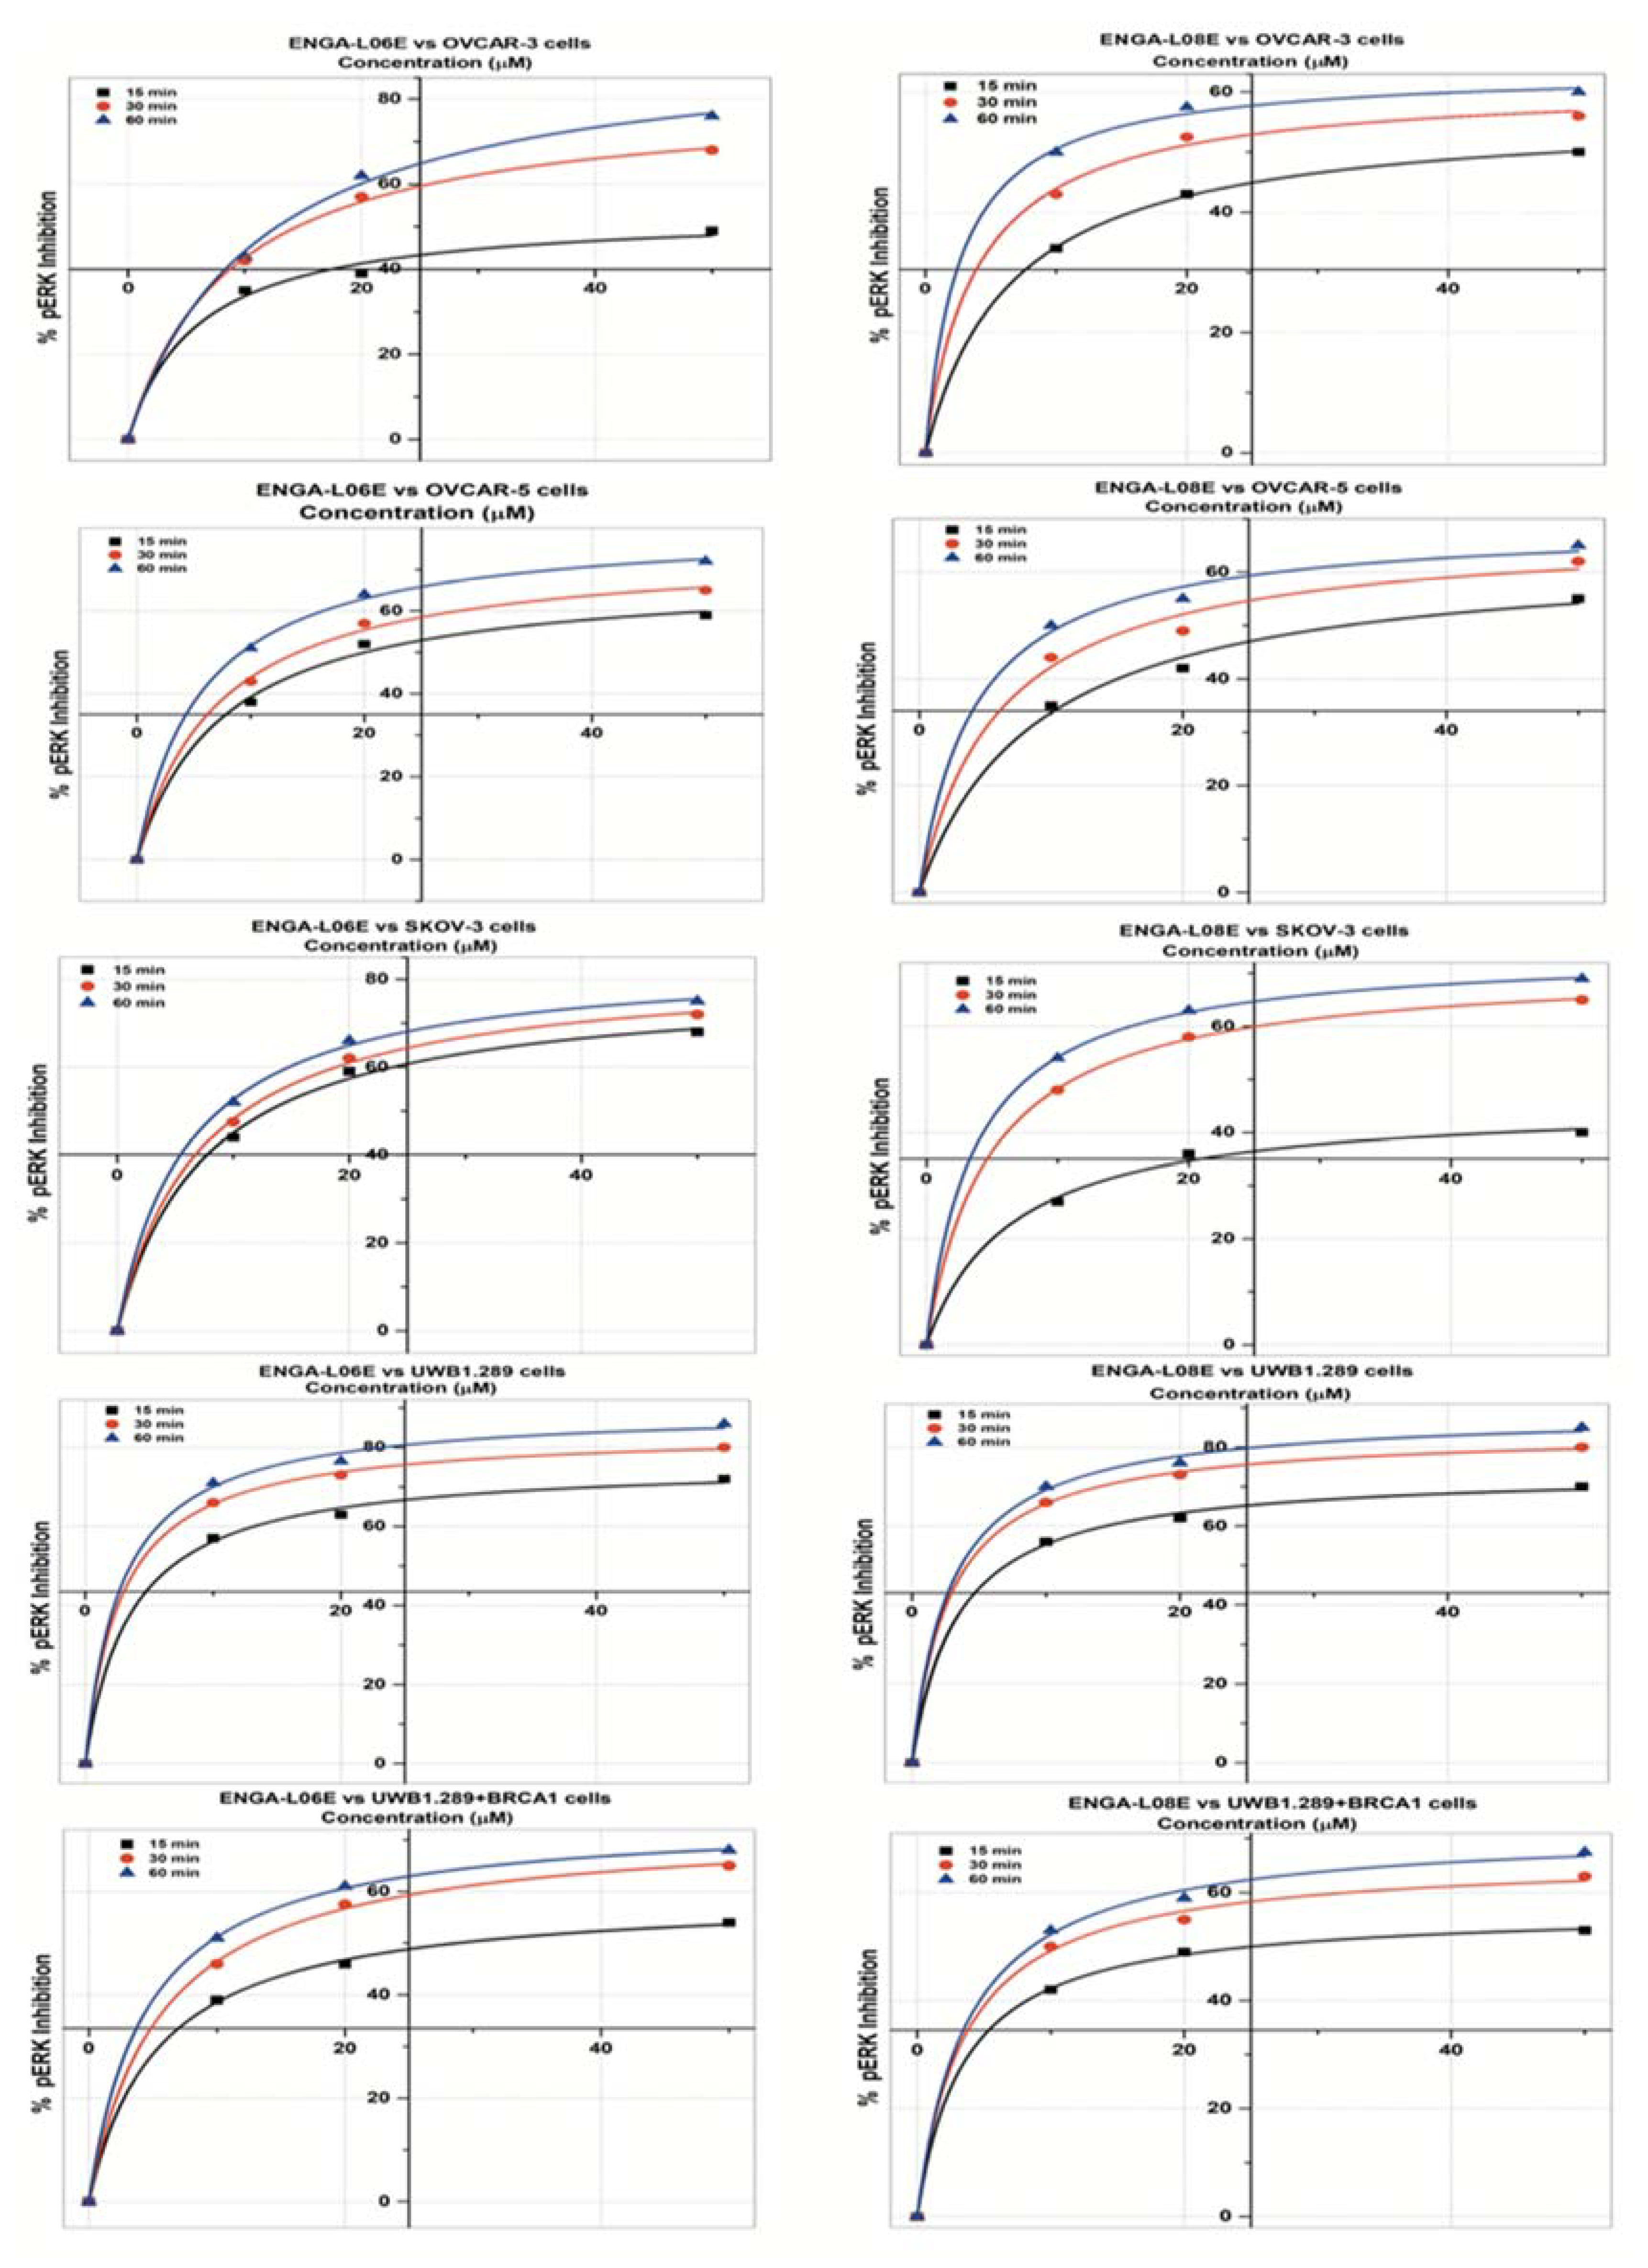
| pERK 1/2 INHIBITION Model Michaelis Menten/Equation: y = Vmax ∗ x/(Km + x) | ||||||
|---|---|---|---|---|---|---|
| ENGA-L06E | ENGA-L08E | |||||
| OVCAR-5 cells | 15 min | 30 min | 60 min | 15 min | 30 min | 60 min |
| Reduc. Chi-Sqr | 3.126 | 1.950 | 0.867 | 3.435 | 7.354 | 3.869 |
| Adj. R-Square | 0.995 | 0.998 | 0.999 | 0.994 | 0.990 | 0.995 |
| Vmax ± SE | 68.95 ± 3.21 | 74.99 ± 2.47 | 80.67 ± 1.52 | 63.85 ± 3.62 | 67.94 ± 4.54 | 69.19 ± 2.95 |
| Km ± SE | 7.58 ± 1.33 | 7.06 ± 0.91 | 5.64 ± 0.48 | 8.97 ± 1.75 | 6.09 ± 1.74 | 4.17 ± 0.97 |
| IC50 (μM) | 20.02 | 14.12 | 9.18 | 32.38 | 16.96 | 10.86 |
| OVCAR-3 cells | ||||||
| Reduc. Chi-Sqr | 4.244 | 1.035 | 2.725 | 0.081 | 1.600 | 0.941 |
| Adj. R-Square | 0.991 | 0.999 | 0.998 | 0.9998 | 0.998 | 0.999 |
| Vmax ± SE | 53.57 ± 3.41 | 80.62 ± 1.98 | 93.91 ± 3.61 | 56.77 ± 0.49 | 61.29 ± 1.88 | 63.79 ± 1.33 |
| Km ± SE | 5.91 ± 1.64 | 8.87 ± 0.75 | 11.21 ± 1.32 | 6.61 ± 0.23 | 4.01 ± 0.69 | 2.63 ± 0.42 |
| IC50 (μM) | 49 | 14.47 | 12.76 | 48.85 | 17.77 | 9.51 |
| SK-OV-3 cells | ||||||
| Reduc. Chi-Sqr | 2.074 | 0.895 | 0.906 | 1.449 | 0.126 | 0.086 |
| Adj. R-Square | 0.998 | 0.999 | 0.999 | 0.996 | 0.9998 | 0.9999 |
| Vmax ± SE | 79.14 ± 2.62 | 82.95 ± 1.69 | 84.71 ± 1.60 | 45.92 ± 2.07 | 71.49 ± 0.55 | 74.32 ± 0.43 |
| Km ± SE | 7.59 ± 0.95 | 7.23 ± 0.57 | 6.10 ± 0.49 | 6.52 ± 1.20 | 4.83 ± 0.19 | 3.72 ± 0.13 |
| IC50 (μM) | 13.01 | 10.97 | 8.78 | >50 | 11.25 | 7.67 |
| UWB1.289 cells | ||||||
| Reduc. Chi-Sqr | 2.119 | 0.404 | 3.360 | 1.322 | 0.404 | 2.372 |
| Adj. R-Square | 0.998 | 0.9997 | 0.998 | 0.9987 | 0.9997 | 0.99844 |
| Vmax ± SE | 76.21 ± 2.11 | 84.08 ± 0.88 | 89.63 ± 2.53 | 73.97 ± 1.64 | 84.08 ± 0.88 | 88.83 ± 2.13 |
| Km ± SE | 3.57 ± 0.60 | 2.81 ± 0.21 | 2.80 ± 0.57 | 3.36 ± 0.47 | 2.81 ± 0.21 | 2.84 ± 0.49 |
| IC50 (μM) | 6.81 | 4.12 | 3.53 | 7.02 | 4.25 | 3.67 |
| UWB1.289+BRCA1 cells | ||||||
| Reduc. Chi-Sqr | 0.465 | 0.483 | 0.101 | 0.181 | 1.908 | 1.626 |
| Adj. R-Square | 0.999 | 0.999 | 0.9998 | 0.9997 | 0.998 | 0.998 |
| Vmax ± SE | 59.43 ± 1.10 | 72.79 ± 1.14 | 74.35 ± 0.49 | 56.97 ± 0.61 | 66.56 ± 1.99 | 71.72 ± 1.86 |
| Km ± SE | 5.41 ± 0.46 | 5.67 ± 0.40 | 4.52 ± 0.15 | 3.49 ± 0.23 | 3.53 ± 0.65 | 3.72 ± 0.57 |
| IC50 (μM) | 28.68 | 12.43 | 9.29 | 25.02 | 10.65 | 8.56 |
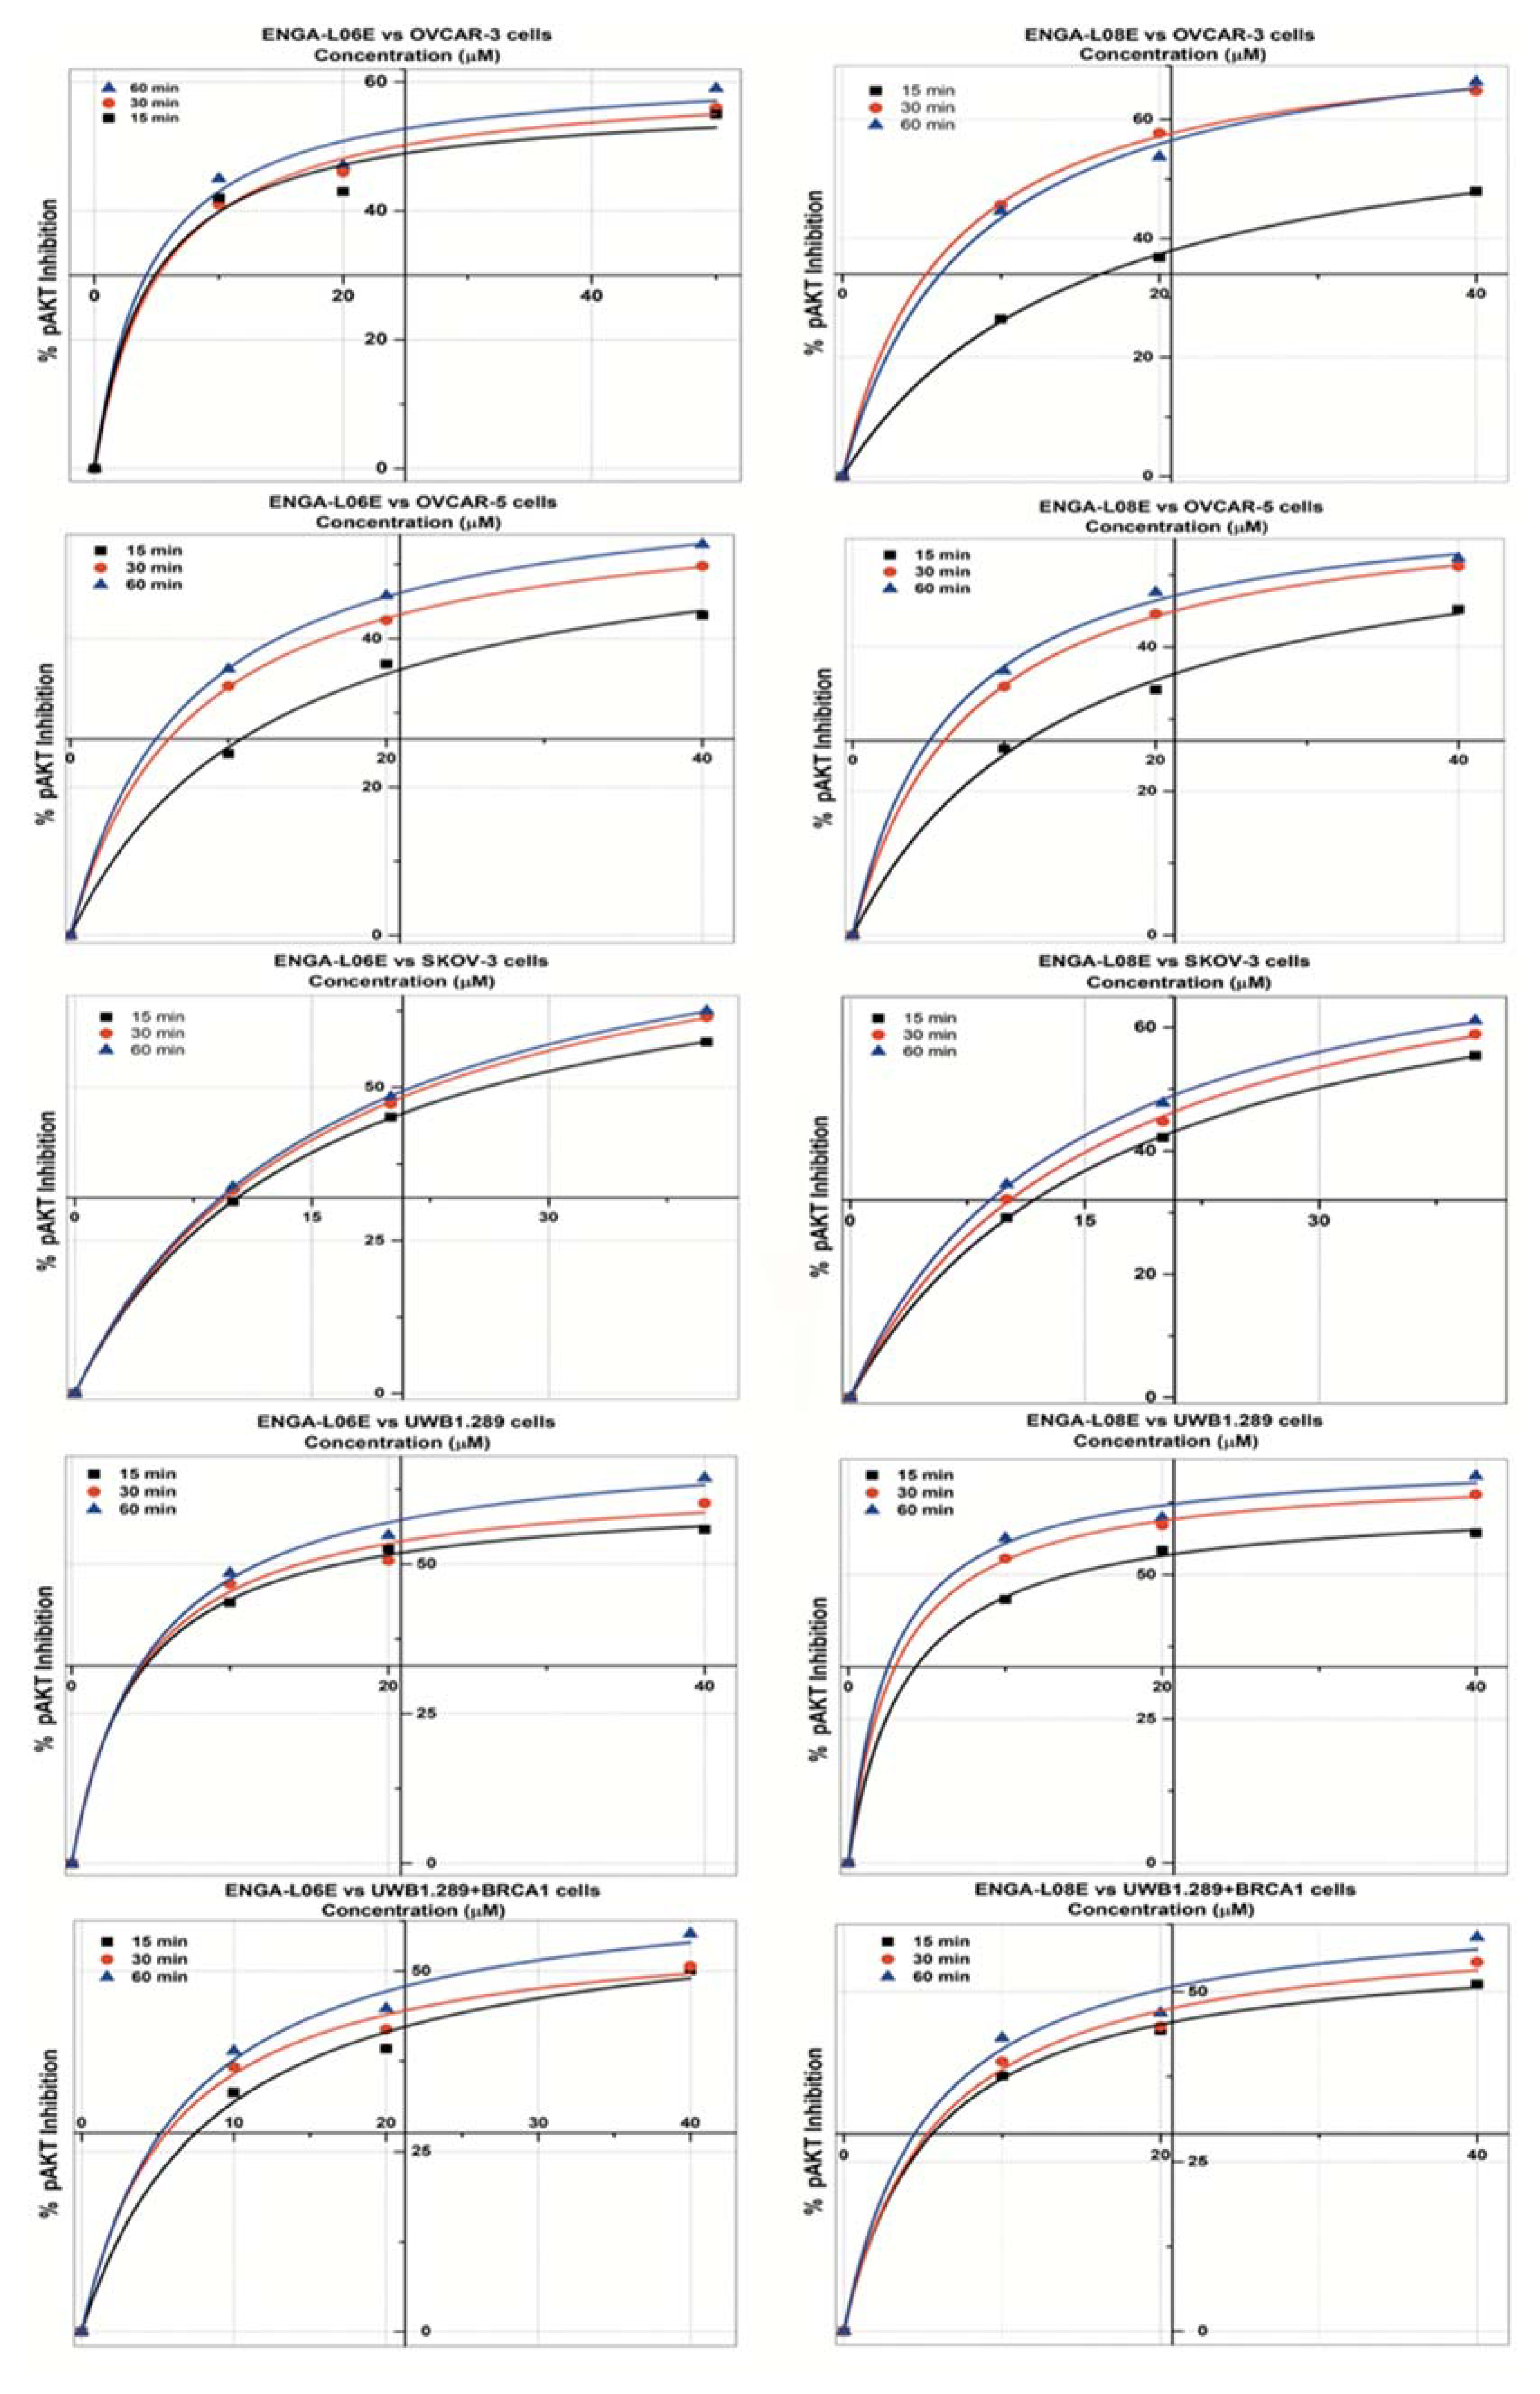
| pAKT 1/2 INHIBITION Model Michaelis Menten/Equation: y = Vmax ∗ x/(Km + x) | ||||||
|---|---|---|---|---|---|---|
| ENGA-L06E | ENGA-L08E | |||||
| OVCAR-5 cells | 15 min | 30 min | 60 min | 15 min | 30 min | 60 min |
| Reduc. Chi-Sqr | 0.429 | 0.321 | 2.198 | 1.376 | 0.086 | 1.047 |
| Adj. R-Square | 0.999 | 0.999 | 0.996 | 0.996 | 0.9998 | 0.998 |
| Vmax ± SE | 57.76 ± 3.49 | 59.24 ± 0.49 | 62.49 ± 0.25 | 60.45 ± 3.65 | 61.17 ± 0.62 | 61.47 ± 2.03 |
| Km ± SE | 12.77 ± 2.12 | 7.71 ± 0.23 | 7.37 ± 0.11 | 14.15 ± 2.24 | 7.64 ± 0.28 | 6.48 ± 0.85 |
| IC50 (μM) | >50 | 49.84 | 29.51 | >50 | 34.19 | 28.26 |
| OVCAR-3 cells | ||||||
| Reduc. Chi-Sqr | 11.207 | 3.445 | 12.978 | 0.233 | 0.250 | 3.633 |
| Adj. R-Square | 0.983 | 0.994 | 0.978 | 0.999 | 0.9997 | 0.996 |
| Vmax ± SE | 57.71 ± 5.51 | 60.76 ± 2.97 | 62.20 ± 5.12 | 65.97 ± 1.60 | 75.64 ± 0.99 | 78.39 ± 4.18 |
| Km ± SE | 4.49 ± 2.22 | 5.25 ± 1.20 | 4.47 ± 1.91 | 15.34 ± 0.94 | 6.48 ± 0.34 | 8.06 ± 1.51 |
| IC50 (μM) | 29.13 | 24.42 | 18.31 | >50 | 12.75 | 14.19 |
| SK-OV-3 cells | ||||||
| Reduc. Chi-Sqr | 0.014 | 0.1064 | 0.030 | 1.848 | 2.867 | 2.637 |
| Adj. R-Square | 0.9999 | 0.9998 | 0.9999 | 0.996 | 0.995 | 0.996 |
| Vmax ± SE | 79.23 ± 0.39 | 86.10 ± 1.13 | 87.27 ± 0.59 | 79.22 ± 0.89 | 81.78 ± 2.53 | 82.20 ± 1.68 |
| Km ± SE | 15.16 ± 0.19 | 16.13 ± 0.52 | 15.92 ± 0.27 | 17.31 ± 0.46 | 15.85 ± 1.21 | 14.03 ± 0.76 |
| IC50 (μM) | 25.94 | 22.34 | 21.37 | 29.62 | 24.94 | 21.78 |
| UWB1.289 cells | ||||||
| Reduc. Chi-Sqr | 0.702 | 6.108 | 3.483 | 0.670 | 0.409 | 3.296 |
| Adj. R-Square | 0.999 | 0.992 | 0.996 | 0.999 | 0.9995 | 0.997 |
| Vmax ± SE | 62.12 ± 1.41 | 64.94 ± 4.22 | 71.12 ± 3.34 | 63.02 ± 1.33 | 68.23 ± 0.99 | 70.28 ± 2.75 |
| Km ± SE | 4.11 ± 0.50 | 4.31 ± 1.45 | 4.98 ± 1.10 | 3.67 ± 0.45 | 3.00 ± 0.29 | 2.68 ± 0.77 |
| IC50 (μM) | 16.93 | 14.41 | 11.77 | 14.07 | 8.24 | 6.60 |
| UWB1.289+BRCA1 cells | ||||||
| Reduc. Chi-Sqr | 4.130 | 3.108 | 4.314 | 0.587 | 4.069 | 8.907 |
| Adj. R-Square | 0.991 | 0.994 | 0.993 | 0.999 | 0.993 | 0.986 |
| Vmax ± SE | 59.78 ± 4.67 | 57.10 ± 3.38 | 63.12 ± 4.19 | 57.59 ± 1.42 | 60.90 ± 3.82 | 63.84 ± 5.49 |
| Km ± SE | 8.81 ± 2.30 | 6.00 ± 1.49 | 6.76 ± 1.75 | 5.49 ± 0.60 | 5.80 ± 1.55 | 5.37 ± 2.07 |
| IC50 (μM) | 44.42 | 40.26 | 25.78 | 36.23 | 26.62 | 19.42 |
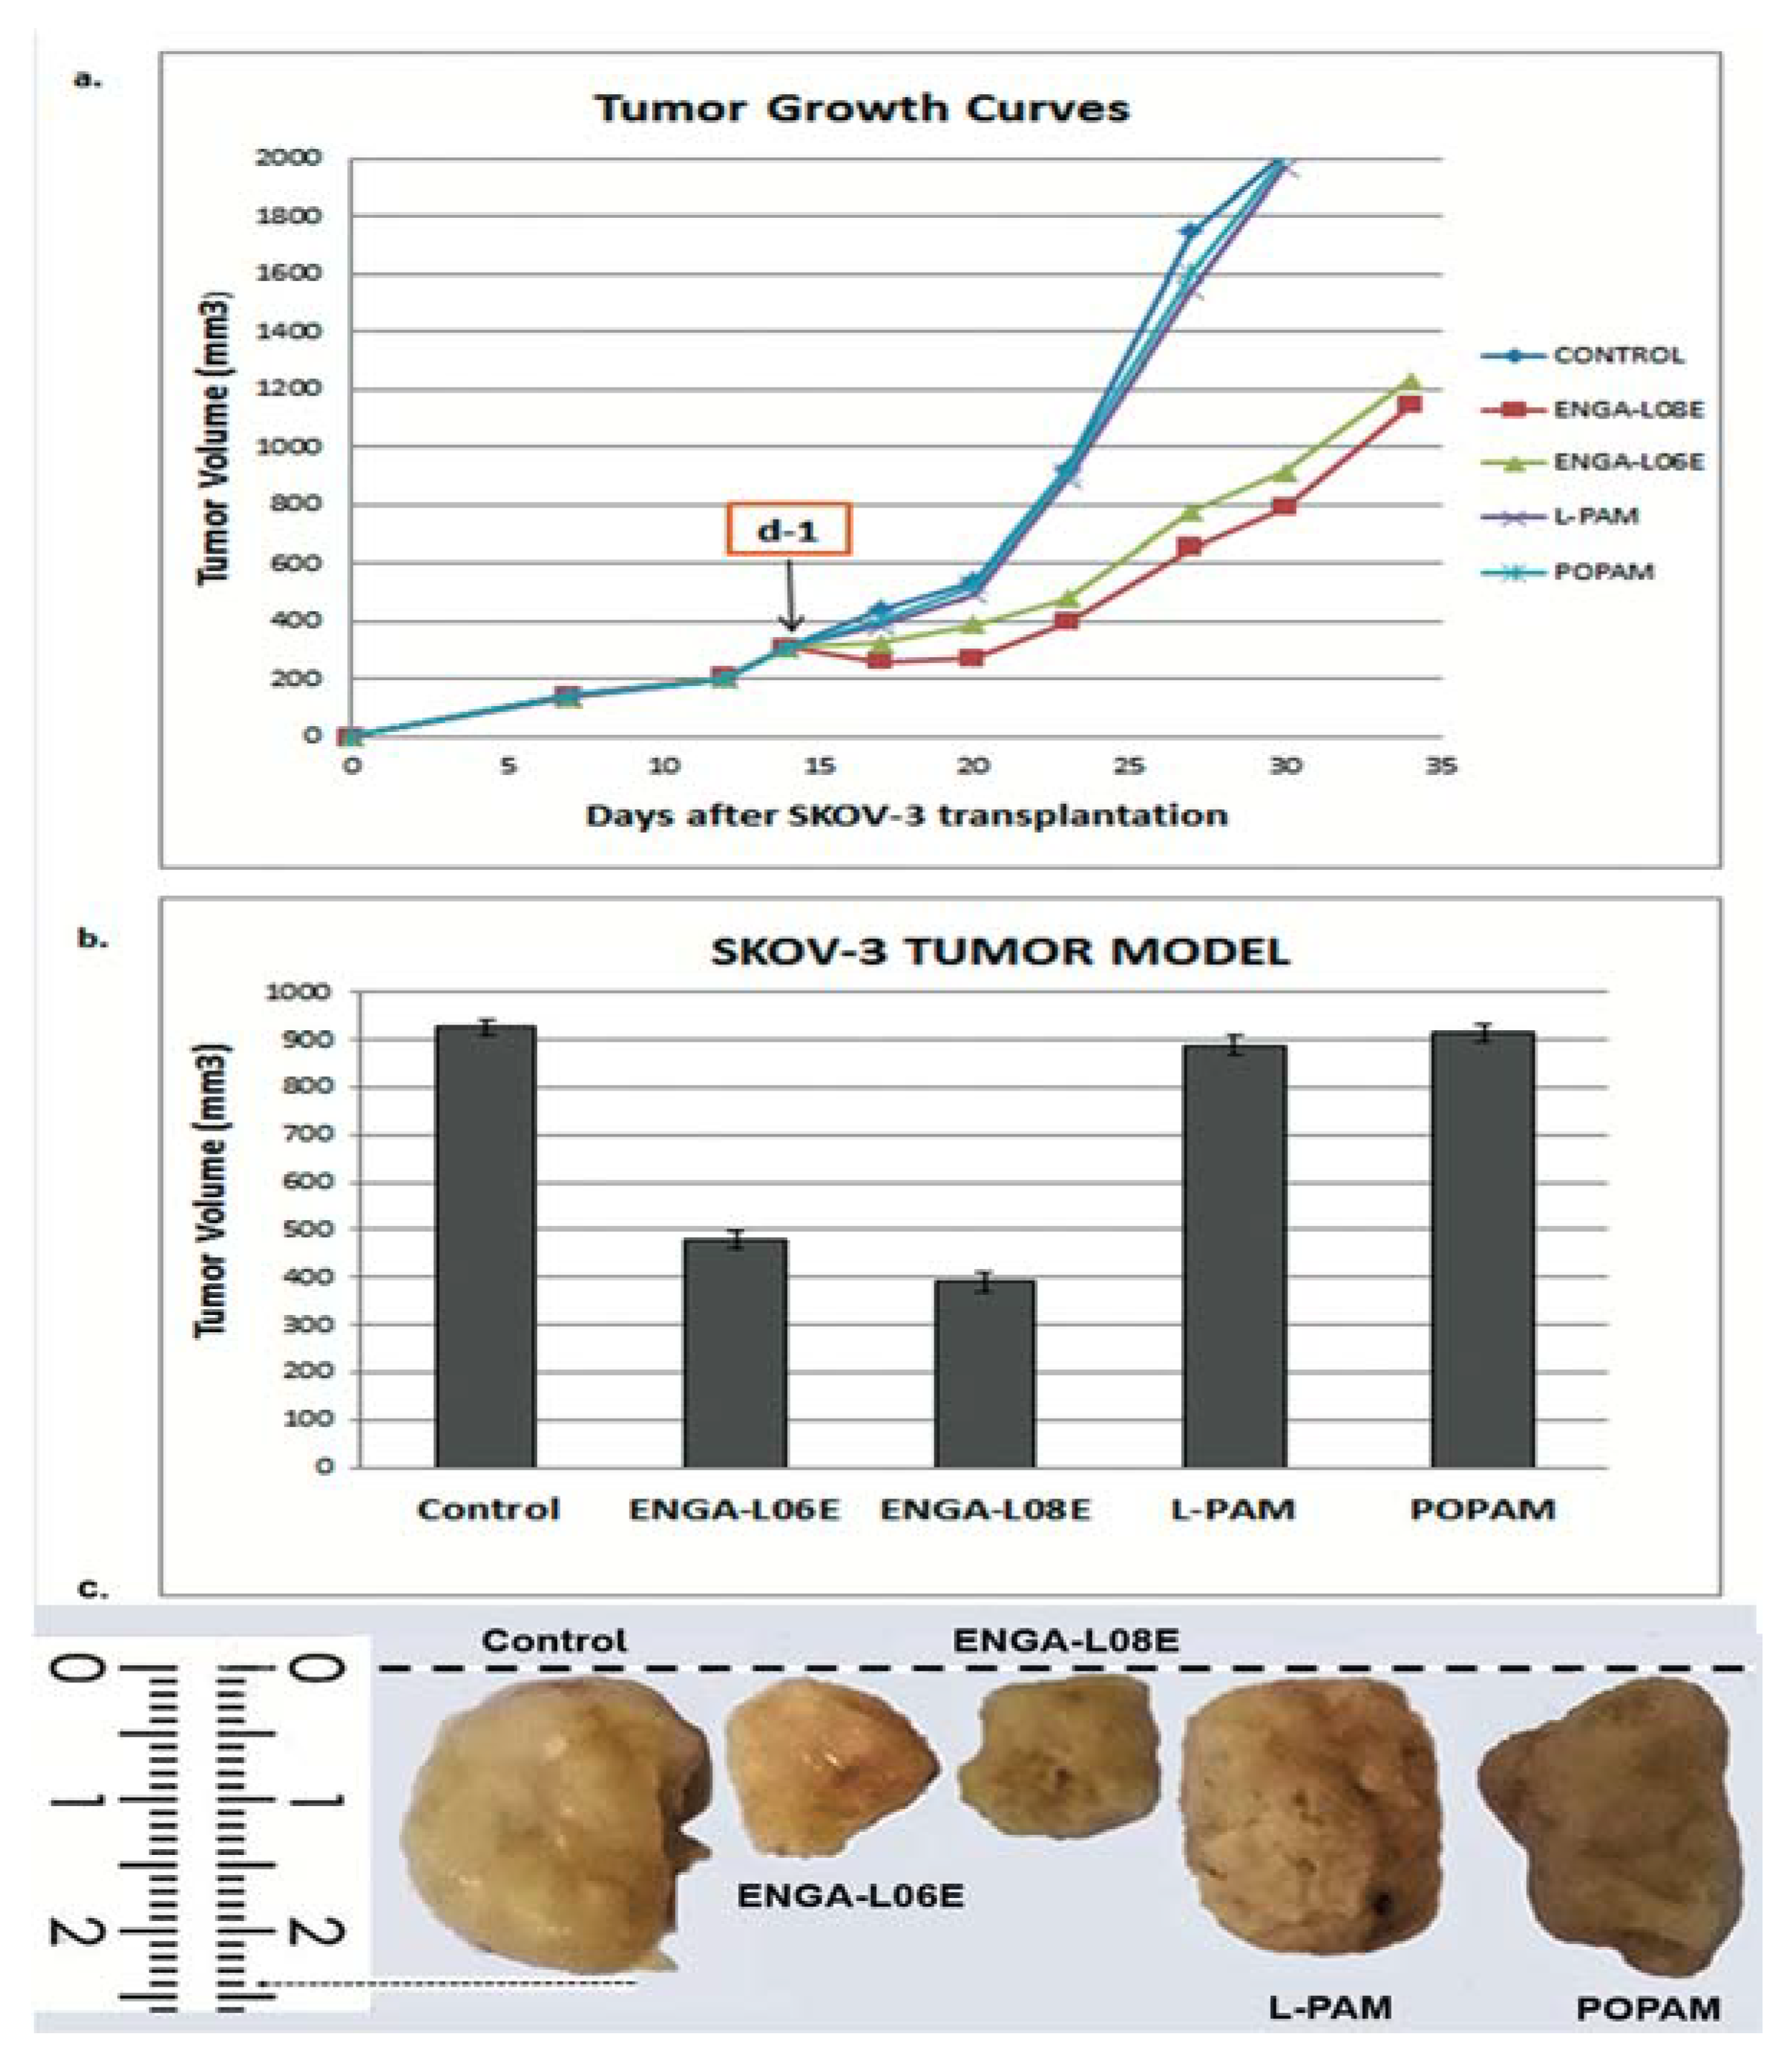
| Compounds | Treatment Schedule (Days) | Dose (mg/kg) | MST a (Days) | TI% b | T/C% c | Cures d |
|---|---|---|---|---|---|---|
| ENGA-L08E | d-1 | 75 (i.p.) | 76.5 ± 3.9 p < 0.01 | 76.4 | 187.9 | 2/5 |
| ENGA-L06E | d-1 | 120 (i.p.) | 79.6 ± 4.0 p < 0.01 | 67.6 | 195.6 | 2/5 |
| L-PAM | d-1 | 14 (i.p.) | 48.5 ± 2.3 | 10.5 | 119.7 | 0/5 |
| POPAM | d-1 | 15 (i.p.) | 47.7 ± 1.5 | 12.0 | 117.2 | 0/5 |
| Controls | d-1 | saline | 40.7 ± 3.0 | -- | 100.0 | 0/7 |
| Compounds | Treatment Schedule (Days) | Dose (mg/kg) | MST a (Days) | TI% b | T/C% c | Cures d |
|---|---|---|---|---|---|---|
| ENGA-L08 | d-1 | 75 (i.p.) | 94.8 ± 6.3 p < 0.01 | 131.0 | 187.8 | 3/5 |
| ENGA-L06E | d-1 | 120 (i.p.) | 93.2 ± 2.4 p < 0.01 | 117.0 | 184.8 | 0/5 |
| L-PAM | d-1 | 14 (i.p.) | 61.0 ± 4.3 | 24.5 | 120.8 | 0/5 |
| POPAM | d-1 | 14 (i.p.) | 59.7 ± 3.3 | 6.22 | 118.3 | 0/5 |
| Controls | d-1 | saline | 50.5 ± 5.8 | -- | 100.0 | 0/7 |
| Clinical Research Criteria | ||||||
|---|---|---|---|---|---|---|
| Median Overall Survival (OS) (Days) | Progression Free Survival (PFS) (Days) | Response Rate (%) (RR) | ||||
| Drugs | SK-OV-3 | OVCAR-5 | SK-OV-3 | OVCAR-5 | SK-OV-3 | OVCAR-5 |
| ENGA-L06 | 112 | 98 | 11 | 27 | 100 | 100 |
| ENGA-L08 | 105 | 127 | 13 | 34 | 100 | 100 |
| L-PAM | 49 | 60 | 0 | 0 | 0 | 0 |
| POPAM | 49 | 57 | 0 | 0 | 0 | 0 |
| Control | 50 (>2000 mm3) | 40 | 0 | 0 | 0 | 0 |
| ERK1 (pdb ID: 4QTB) | ERK2 (pdb ID: 4QTA) | |||
|---|---|---|---|---|
| Docking Score (kcal mol−1) | Glide e-Model (kcal mol−1) | Docking Score (kcal mol−1) | Glide e-Model (kcal mol−1) | |
| Co-crystalized ligand 38Z0 | −10.372 | −129.250 | −8.244 | −104.505 |
| ENGA-L06E | −5.155 | −60.642 | −6.848 | −71.318 |
| ENGA-L08E | −7.156 | −81.061 | −8.982 | −79.097 |
| AKT1 (pdb ID: 4EJN) | AKT2 (pdb ID: 2X39) | |||
|---|---|---|---|---|
| Docking Score (kcal mol−1) | Glide e-Model (kcal mol−1) | Docking Score (kcal mol−1) | Glide e-Model (kcal mol−1) | |
| Co-crystalized ligand | −12,188 | −131,104 | −10,158 | −103,940 |
| ENGA-L06E | −7.060 | −84.653 | −4.273 | −59.558 |
| ENGA-L08E | −9.446 | −86.525 | −4.017 | −57.739 |
| Cancer Type | Human Cell Line Designation | Mutated Oncogenes | Special Characteristics |
|---|---|---|---|
| Ovarian Adenocarcinoma | SK-OV-3 | TP53 (p.S90fs) PIK3CA (p.H1047R) | Tumor Necrosis Factor; Diphtheria Toxin; Cisplatin and Adriamycin not sensitive; Estrogen receptor α (ERα) positive /Progesterone receptor negative MSI-High * |
| Epithelial Ovarian Adenocarcinoma | OVCAR-3 | MEK1 (p.G159R; p.R160K; p.A158) TP53 (p.R248Q) | Androgen/Estrogen/Progesterone receptor positive; Cisplatin Adriamycin not sensitive; Melphalan resistant; MSS ** |
| Epithelial Ovarian Adenocarcinoma | OVCAR-5 | KRAS (p.G12V) | Cisplatin not sensitive; Estrogen receptor α (ERα) negative/GPER positive; MSS ** |
| Ovarian Carcinoma | UWB1.289 | p53 (625delAG) BRCA1-null (2594delC) | p53, cytokeratin 7 (CK-7) positive; calretinin positive; Wilms’ tumor protein (WT) positive; Estrogen/Progesterone receptor negative; MSS ** |
| Ovarian Carcinoma | UWB1.289+BRCA1 | p53 (625delAG) | Estrogen/Progesterone receptor negative |
| Protein | PDB ID’s | Year | Resolution (Å) | Co-Crystallized Inhibitor |
|---|---|---|---|---|
| ERK1 | 4QTB | 2014 | 1.40 | 38Z |
| ERK2 | 4QTA | 2014 | 1.45 | 38Z |
| AKT1 | 4EJN | 2012 | 2.19 | 0R4 |
| AKT2 | 2X39 | 2010 | 1.93 | X39 |
References
- Armbruster, S.; Coleman, R.L.; Rauh-Hain, J.A. Management and Treatment of Recurrent Epithelial Ovarian Cancer. Hematol. Oncol. Clin. North. Am. 2018, 32, 965–982. [Google Scholar] [CrossRef]
- Smolle, E.; Taucher, V.; Pichler, M.; Petru, E.; Lax, S.; Haybaeck, J. Targeting signaling pathways in epithelial ovarian cancer. Int. J. Mol. Sci. 2013, 14, 9536–9555. [Google Scholar] [CrossRef]
- Boussios, S.; Zarkavelis, G.; Seraj, E.; Zerdes, I.; Tatsi, K.; Pentheroudakis, G. Non-epithelial Ovarian Cancer: Elucidating Uncommon Gynaecological Malignancies. Anticancer Res. 2016, 36, 5031–5042. [Google Scholar] [CrossRef]
- Gasparri, M.L.; Bardhi, E.; Ruscito, I.; Papadia, A.; Farooqi, A.A.; Marchetti, C.; Bogani, G.; Ceccacci, I.; Mueller, M.D.; Benedetti, P.P. PI3K/AKT/mTOR Pathway in Ovarian Cancer Treatment: Are We on the Right Track? Geburtshilfe Frauenheilkd 2017, 77, 1095–1103. [Google Scholar] [CrossRef]
- Cheaib, B.; Auguste, A.; Leary, A. The PI3K/Akt/mTOR pathway in ovarian cancer: Therapeutic opportunities and challenges. Chin. J. Cancer 2015, 34, 4–16. [Google Scholar] [CrossRef]
- Wang, J.; Zhou, J.Y.; Wu, G.S. ERK-dependent MKP-1-mediated cisplatin resistance in human ovarian cancer cells. Cancer Res. 2007, 67, 11933–11941. [Google Scholar] [CrossRef]
- Camoutsis, C.; Trafalis, D.T.P. An overview on the antileukemic potential of D-homo-aza-and respective 17β-acetamido-steroidal alkylating esters. Invest. New Drugs 2003, 21, 47–54. [Google Scholar] [CrossRef]
- Camoutsis, C.; Trafalis, D.; Pairas, G.; Papageorgiou, A. On the formation of 4-[N, N-bis (2-chloroethyl) amino] phenyl acetic acid esters of hecogenin and aza-homo-hecogenin and their antileukemic activity. Il Farmaco 2005, 60, 826–829. [Google Scholar] [CrossRef]
- Trafalis, D.T.P.; Camoutsis, C.; Papageorgiou, A. Research on the anti-tumour effect of steroid lactam alkylator (NSC-294859) in comparison with conventional chemotherapeutics in malignant melanoma. Melanoma Res. 2005, 15, 273–281. [Google Scholar] [CrossRef]
- Trafalis, D.T.; Camoutsis, C.; Dalezis, P.; Papageorgiou, A.; Kontos, M.; Karamanakos, P.; Giannakos, G.; Athanassiou, A.E. Antitumor effect of a- and d- lactam androgen nitrogen mustards on non-small cell lung carcinoma. J. BUON 2004, 9, 275–282. [Google Scholar]
- Trafalis, D.T. Hybrid aza-steroid alkylators in the treatment of colon cancer. Cancer Lett. 2006, 243, 202–210. [Google Scholar] [CrossRef]
- Trafalis, D.T.; Polonifi, A.; Dalezis, P.; Nikoleousakos, N.; Katsamakas, S.; Sarli, V. Targeting on poly (ADP-ribose) polymerase activity with DNA-damaging hybrid lactam-steroid alkylators in wild-type and BRCA1-mutated ovarian cancer cells. Chem. Biol. Drug Des. 2017, 90, 854–866. [Google Scholar] [CrossRef]
- Hamilton, T.C.; Young, R.C.; McKoy, W.M.; Grotzinger, K.R.; Green, J.A.; Chu, E.W.; Whang-Peng, J.; Rogan, A.M.; Green, W.R.; Ozols, R.F. Characterization of a Human Ovarian Carcinoma Cell Line (NIH:OVCAR-3) with Androgen and Estrogen Receptors. Cancer Res. 1983, 43, 5379–5389. [Google Scholar]
- Yan, X.D.; Li, M.; Yuan, Y.; Mao, N.; Pan, L.Y. Biological comparison of ovarian cancer resistant cell lines to cisplatin and Taxol by two different administrations. Oncol. Rep. 2007, 17, 1163–1169. [Google Scholar] [CrossRef]
- Godwin, A.K.; Meister, A.; O’Dwyer, P.J.; Huang, C.S.; Hamilton, T.C.; Anderson, M.E. High resistance to cisplatin in human ovarian cancer cell lines is associated with marked increase of glutathione synthesis. Proc. Natl. Acad. Sci. USA 1992, 89, 3070–3074. [Google Scholar] [CrossRef]
- Surnar, B.; Kolishetti, N.; Basu, U.; Ahmad, A.; Goka, E.; Marples, B.; Kolb, D.; Lippman, M.E.; Dhar, S. Reduction of Cisplatin-Induced Ototoxicity without Compromising Its Antitumor Activity. Biochemistry 2018, 57, 6500–6513. [Google Scholar] [CrossRef]
- Boussios, S.; Karathanasi, A.; Cooke, D.; Neille, C.; Sadauskaite, A.; Moschetta, M.; Zakynthinakis-Kyriakou, N.; Pavlidis, N. PARP Inhibitors in Ovarian Cancer: The Route to “Ithaca”. Diagnostics 2019, 9, 55. [Google Scholar] [CrossRef]
- Olsson, M.H.M.; Søndergaard, C.R.; Rostkowski, M.; Jensen, J.H. PROPKA3: Consistent treatment of internal and surface residues in empirical pKa predictions. J. Chem. Theory Comput. 2011, 7, 525–537. [Google Scholar] [CrossRef]
- Shivakumar, D.; Williams, J.; Wu, Y.; Damm, W.; Shelley, J.; Sherman, W. Prediction of Absolute Solvation Free Energies using Molecular Dynamics Free Energy Perturbation and the OPLS Force Field. J. Chem. Theory Comput. 2010, 6, 1509–1519. [Google Scholar] [CrossRef]
- Fosgerau, K.; Hoffmann, T. Peptide therapeutics: Current status and future directions. Drug Discov. Today 2015, 20, 122–128. [Google Scholar] [CrossRef]
- Trafalis, D.T.; Tsavdaridis, D.; Camoutsis, C.; Karayiani, V.; Mourelatos, D.; Dalezis, P.; Athanassiou, A.; Pangalis, G.A.; Papageorgiou, A. Preclinical studies on NSC290205 aza-steroid alkylator activity in combination with Adriamycin against lymphoid leukaemia. Br. J. Haematol. 2005, 128, 343–350. [Google Scholar] [CrossRef]
- Geromichalos, G.D.; Geromichalou, E.; Camoutsis, C.; Kontos, M.; Dalezis, P.; Papageorgiou, A.; Grivas, A.A.; Tsigris, C.; Trafalis, D.T. In silico/in vitro study of hybrid D-modified steroidal alkylator anticancer activity using uridine phosphorylase as target protein. Anticancer Res. 2011, 31, 831–842. [Google Scholar]
- Trafalis, D.; Geromichalou, E.; Dalezis, P.; Nikoleousakos, N.; Sarli, V. Synthesis and evaluation of new steroidal lactam conjugates with aniline mustards as potential antileukemic therapeutics. Steroids 2016, 115, 1–8. [Google Scholar] [CrossRef]
- Trafalis, D.; Dalezis, P.; Geromichalou, P.; Sagredou, S.; Sfakidou, E.; Voura, M.; Grammatikopoulou, M.; Gabriel, C.; Sarli, V. Discovery of steroidal lactam conjugates of POPAM-NH2 with potential anticancer activity. Fut. Med. Chem. 2019, 12, 19–35. [Google Scholar] [CrossRef]
- Trafalis, D.T.P.; Geromichalos, G.D.; Koukoulitsa, C.; Papageorgiou, A.; Karamanakos, P.; Camoutsis, C. Lactandrate: A D-homo-aza-androsterone alkylator in the treatment of breast cancer. Breast Cancer Res. Treat. 2006, 97, 17–23. [Google Scholar] [CrossRef]
- Boussios, S.; Karihtala, P.; Moscetta, M.; Karathanasi, A.; Sadauskaite, A.; Rassy, E.; Pavlidis, N. Combined Strategies with Poly (ADP-Ribose) Polymerase (PARP) Inhibitors for the Treatment of Ovarian Cancer: A Literature Review. Diagnostics 2019, 9, 87. [Google Scholar] [CrossRef]
- Ye, Q.; She, Q.B. Integration of AKT and ERK Signaling Pathways in Cancer: Biological and Therapeutic Implications. J. Pharmacol. Clin. Toxicol. 2013, 1, 1009. [Google Scholar]
- Ye, Q.; Cai, W.; Zheng, Y.; Evers, B.M.; She, Q.B. ERK and AKT signaling cooperate to translationally regulate survivin expression for metastatic progression of colorectal cancer. Oncogene 2014, 33, 1828–1839. [Google Scholar] [CrossRef]
- Hayashi, H.; Tsuchiya, Y.; Nakayama, K.; Satoh, T.; Nishida, E. Down-regulation of the PI3-kinase/Akt pathway by ERK MAP kinase in growth factor signaling. Genes Cells 2008, 13, 941–947. [Google Scholar] [CrossRef]
- Altomare, D.; Wang, H.; Skele, K.; Rienzo, A.; Klein-Szanto, A.; Godwin, A.; Testa, J. AKT and mTOR phosphorylation is frequently detected in ovarian cancer and can be targeted to disrupt ovarian tumor cell growth. Oncogene 2004, 23, 5853–5857. [Google Scholar] [CrossRef]
- Burotto, M.; Chiou, V.L.; Lee, J.M.; Kohn, E.C. The MAPK pathway across different malignancies: A new perspective. Cancer 2014, 120, 3446–3456. [Google Scholar] [CrossRef]
- Boussios, S.; Karihtala, P.; Moschetta, M.; Abson, C.; Karathanasi, A.; Zakynthinakis-Kyriakou, N.; Ryan, J.E.; Sheriff, M.; Rassy, E.; Pavlidis, N. Veliparib in ovarian cancer: A new synthetically lethal therapeutic approach. Invest. New Drugs 2020, 38, 181–193. [Google Scholar] [CrossRef]
- Liu, F.W.; Tewari, K.S. New Targeted Agents in Gynecologic Cancers: Synthetic Lethality, Homologous Recombination Deficiency and PARP Inhibitors. Curr. Treat. Options Oncol. 2016, 17, 12. [Google Scholar] [CrossRef]
- Conrad, L.B.; Lin, K.Y.; Nandu, T.; Gibson, B.A.; Lea, J.S.; Kraus, W.L. ADP-ribosylation Levels and Patterns Correlate with Gene Expression and Clinical Outcomes in Ovarian Cancers. Mol. Cancer Ther. 2020, 19, 282–291. [Google Scholar] [CrossRef]
- Cohen-Armon, M. PARP-1 activation in the ERK signaling pathway. Trends Pharmacol. Sci. 2007, 28, 556–560. [Google Scholar] [CrossRef]
- Weaver, A.N.; Yang, S.E. Beyond DNA repair: Additional functions of PARP-1 in cancer. Front. Oncol. 2013, 3, 290. [Google Scholar] [CrossRef]
- Sun, C.; Fang, Y.; Yin, J.; Chen, J.; Ju, Z.; Zhang, D.; Chen, X.; Vellano, C.P.; Jeong, K.J.; Ng, P.K.; et al. Rational combination therapy with PARP and MEK inhibitors capitalizes on therapeutic liabilities in RAS mutant cancers. Sci. Transl. Med. 2017, 9, 392. [Google Scholar] [CrossRef]
- Bitler, B.G.; Watson, Z.L.; Wheeler, L.J.; Behbakht, K. PARP inhibitors: Clinical utility and possibilities of overcoming resistance. Gynecol. Oncol. 2017, 147, 695–704. [Google Scholar] [CrossRef]
- Mendoza, M.C.; Er, E.E.; Blenis, J. The Ras-ERK and PI3K-mTOR Pathways: Cross-talk and Compensation. Trends Biochem. Sci. 2011, 36, 320–328. [Google Scholar] [CrossRef]
- Cao, Z.; Liao, Q.; Su, M.; Huang, K.; Jin, J.; Cao, D. AKT and ERK dual inhibitors: The way forward? Cancer Lett. 2019, 459, 30–40. [Google Scholar] [CrossRef]
- Sheppard, K.E.; Cullinane, C.; Hannan, K.M.; Wall, M.; Chan, J.; Barber, F.; Foo, J.; Cameron, D.; Neilsen, A.; Ng, P.; et al. Synergistic inhibition of ovarian cancer cell growth by combining selective PI3K/mTOR and RAS/ERK pathway inhibitors. Eur. J. Cancer 2013, 49, 3936–3944. [Google Scholar] [CrossRef]
- Lenhard, M.; Tereza, L.; Heublein, S.; Ditsch, N.; Himsl, I.; Mayr, D.; Friese, K.; Jeschke, U. Steroid hormone receptor expression in ovarian cancer: Progesterone receptor B as prognostic marker for patient survival. BMC Cancer 2012, 12, 553. [Google Scholar] [CrossRef]
- Paleari, L.; Gandini, S.; Provinciali, N.; Puntoni, M.; Colombo, N.; DeCensi, A. Clinical benefit and risk of death with endocrine therapy in ovarian cancer: A comprehensive review and meta-analysis. Gynecol. Oncol. 2017, 146, 504–513. [Google Scholar] [CrossRef]
- Modugno, F.; Laskey, R.; Smith, A.L.; Andersen, C.L.; Haluska, P.; Oesterreich, S. Hormone response in ovarian cancer: Time to reconsider as a clinical target? Endocr. Relat. Cancer 2012, 19, 255–279. [Google Scholar] [CrossRef]
- Kontos, M.; Nikolopoulou, M.; Trafalis, D.T.; Geromichalos, G.D.; Koukoulitsa, C.; Camoutsis, J.C.; Bastounis, E.; Karamanakos, P. The effect of an estrone D-lactam steroid ester derivative on breast cancer cells and its predicted binding interactions with the ligand binding domain of estrogen receptor-alpha. Oncol. Res. 2005, 16, 129–142. [Google Scholar] [CrossRef]
- Finlay, G.J.; Wilson, W.R.; Baguley, B.C. Comparison of in vitro activity of cytotoxic drugs towards human carcinoma and leukaemia cell lines. Eur. J. Cancer Clin. Oncol. 1986, 22, 655–662. [Google Scholar] [CrossRef]
- Goldim, A. Experimental evaluation of antitumor drugs in the USA and USSR and clinical correlations. Natl. Cancer Inst. Monogr. 1980, 55, 1–179. [Google Scholar]
- Tomayko, M.M.; Reynolds, C.P. Determination of subcutaneous tumor size in athymic (nude) mice. Cancer Chemother. Pharmacol. 1989, 24, 148–154. [Google Scholar] [CrossRef]
- Mahmood, T.; Yang, P.C. Western blot: Technique, theory, and trouble shooting. North. Am. J. Med. Sci. 2012, 4, 429–434. [Google Scholar]
- Geromichalos, G.D.; Alifieris, C.E.; Geromichalou, E.G.; Trafalis, D.T. Overview on the current status of virtual high-throughput screening and combinatorial chemistry approaches in multi-target anticancer drug discovery; Part, I. J. BUON 2016, 21, 764–779. [Google Scholar]
- Farid, R.; Day, T.; Friesner, R.A.; Pearlstein, R.A. New insights about HERG blockade obtained from protein modeling, potential energy mapping, and docking studies. Bioorg. Med. Chem. 2006, 14, 3160–3173. [Google Scholar] [CrossRef]
- Sherman, W.; Day, T.; Jacobson, M.P.; Friesner, R.A.; Farid, R. Novel procedure for modeling ligand/receptor induced fit effects. J. Med. Chem. 2006, 49, 534–553. [Google Scholar] [CrossRef]
- Friesner, R.A.; Murphy, R.B.; Repasky, M.P.; Frye, L.L.; Greenwood, J.R.; Halgren, T.A.; Sanschagrin, P.C.; Mainz, D.T. Extra Precision Glide: Docking and Scoring Incorporating a Model of Hydrophobic Enclosure for Protein-Ligand Complexes. J. Med. Chem. 2006, 49, 6177–6196. [Google Scholar] [CrossRef]
- Halgren, T.A.; Murphy, R.B.; Friesner, R.A.; Beard, H.S.; Frye, L.L.; Pollard, W.T.; Banks, J.L. Glide: A New Approach for Rapid, Accurate Docking and Scoring. 2. Enrichment Factors in Database Screening. J. Med. Chem. 2004, 47, 1750–1759. [Google Scholar] [CrossRef]


| POPAM | ENGA-L06E | ENGA-L08E | |||||||
|---|---|---|---|---|---|---|---|---|---|
| GI50 | TGI | IC50 | GI50 | TGI | IC50 | GI50 | TGI | IC50 | |
| OVCAR-3 | 56 ± 2.7 | 92 ± 7.5 | >100 | 22 ± 0.9 | 32 ± 1.8 | 43 ± 2.9 | 30 ± 2.1 | 40 ± 2.7 | 56 ± 3.2 |
| OVCAR-5 | 52 ± 2.3 | 87 ± 7.8 | >100 | 25 ± 1.4 | 42 ± 2.8 | 65 ± 3.4 | 11 ± 0.6 | 60 ± 2.7 | 92 ± 8.4 |
| SK-OV-3 | 50 ± 2.9 | >100 | >100 | 18 ± 0.9 | 52 ± 3.3 | 76 ± 7.5 | 10 ± 0.5 | 76 ± 7.2 | >100 |
| UWB1.289 | 22 ± 1.9 | 86 ± 7.4 | >100 | 3.5 ± 0.4 | 8 ± 0.8 | 20 ± 1.1 | 8 ± 0.9 | 20 ± 1.5 | 45 ± 3.3 |
| UWB1.289+BRCA1 | >100 | >100 | >100 | 12 ± 0.7 | 28 ± 1.9 | 40 ± 3.5 | 18 ± 1.0 | 76 ± 7.2 | 88 ± 8.1 |
| Compounds | LD50 (mg/kg) | LD10 (mg/kg) |
|---|---|---|
| L-PAM | 20.8 | 14 |
| POPAM | 20 | 15 |
| ENGA-L06E | 150 | 120 |
| ENGA-L08E | 95 | 75 |
© 2020 by the authors. Licensee MDPI, Basel, Switzerland. This article is an open access article distributed under the terms and conditions of the Creative Commons Attribution (CC BY) license (http://creativecommons.org/licenses/by/4.0/).
Share and Cite
Dalezis, P.; Geromichalou, E.; Polonifi, A.; Sagredou, S.; Nikoleousakos, N.; Nikolaou, M.; Sarli, V.; Panayiotidis, M.I.; Trafalis, D.T. Azasteroid Alkylators as Dual Inhibitors of AKT and ERK Signaling for the Treatment of Ovarian Carcinoma. Cancers 2020, 12, 1263. https://doi.org/10.3390/cancers12051263
Dalezis P, Geromichalou E, Polonifi A, Sagredou S, Nikoleousakos N, Nikolaou M, Sarli V, Panayiotidis MI, Trafalis DT. Azasteroid Alkylators as Dual Inhibitors of AKT and ERK Signaling for the Treatment of Ovarian Carcinoma. Cancers. 2020; 12(5):1263. https://doi.org/10.3390/cancers12051263
Chicago/Turabian StyleDalezis, Panagiotis, Eleni Geromichalou, Aikaterini Polonifi, Sofia Sagredou, Nikolaos Nikoleousakos, Michael Nikolaou, Vasiliki Sarli, Mihalis I. Panayiotidis, and Dimitrios T. Trafalis. 2020. "Azasteroid Alkylators as Dual Inhibitors of AKT and ERK Signaling for the Treatment of Ovarian Carcinoma" Cancers 12, no. 5: 1263. https://doi.org/10.3390/cancers12051263
APA StyleDalezis, P., Geromichalou, E., Polonifi, A., Sagredou, S., Nikoleousakos, N., Nikolaou, M., Sarli, V., Panayiotidis, M. I., & Trafalis, D. T. (2020). Azasteroid Alkylators as Dual Inhibitors of AKT and ERK Signaling for the Treatment of Ovarian Carcinoma. Cancers, 12(5), 1263. https://doi.org/10.3390/cancers12051263