Multi-Modal PET and MR Imaging in the Hen’s Egg Test-Chorioallantoic Membrane (HET-CAM) Model for Initial In Vivo Testing of Target-Specific Radioligands

 ,
,  ,
,
Abstract
1. Introduction
2. Results
2.1. Methodological Aspects
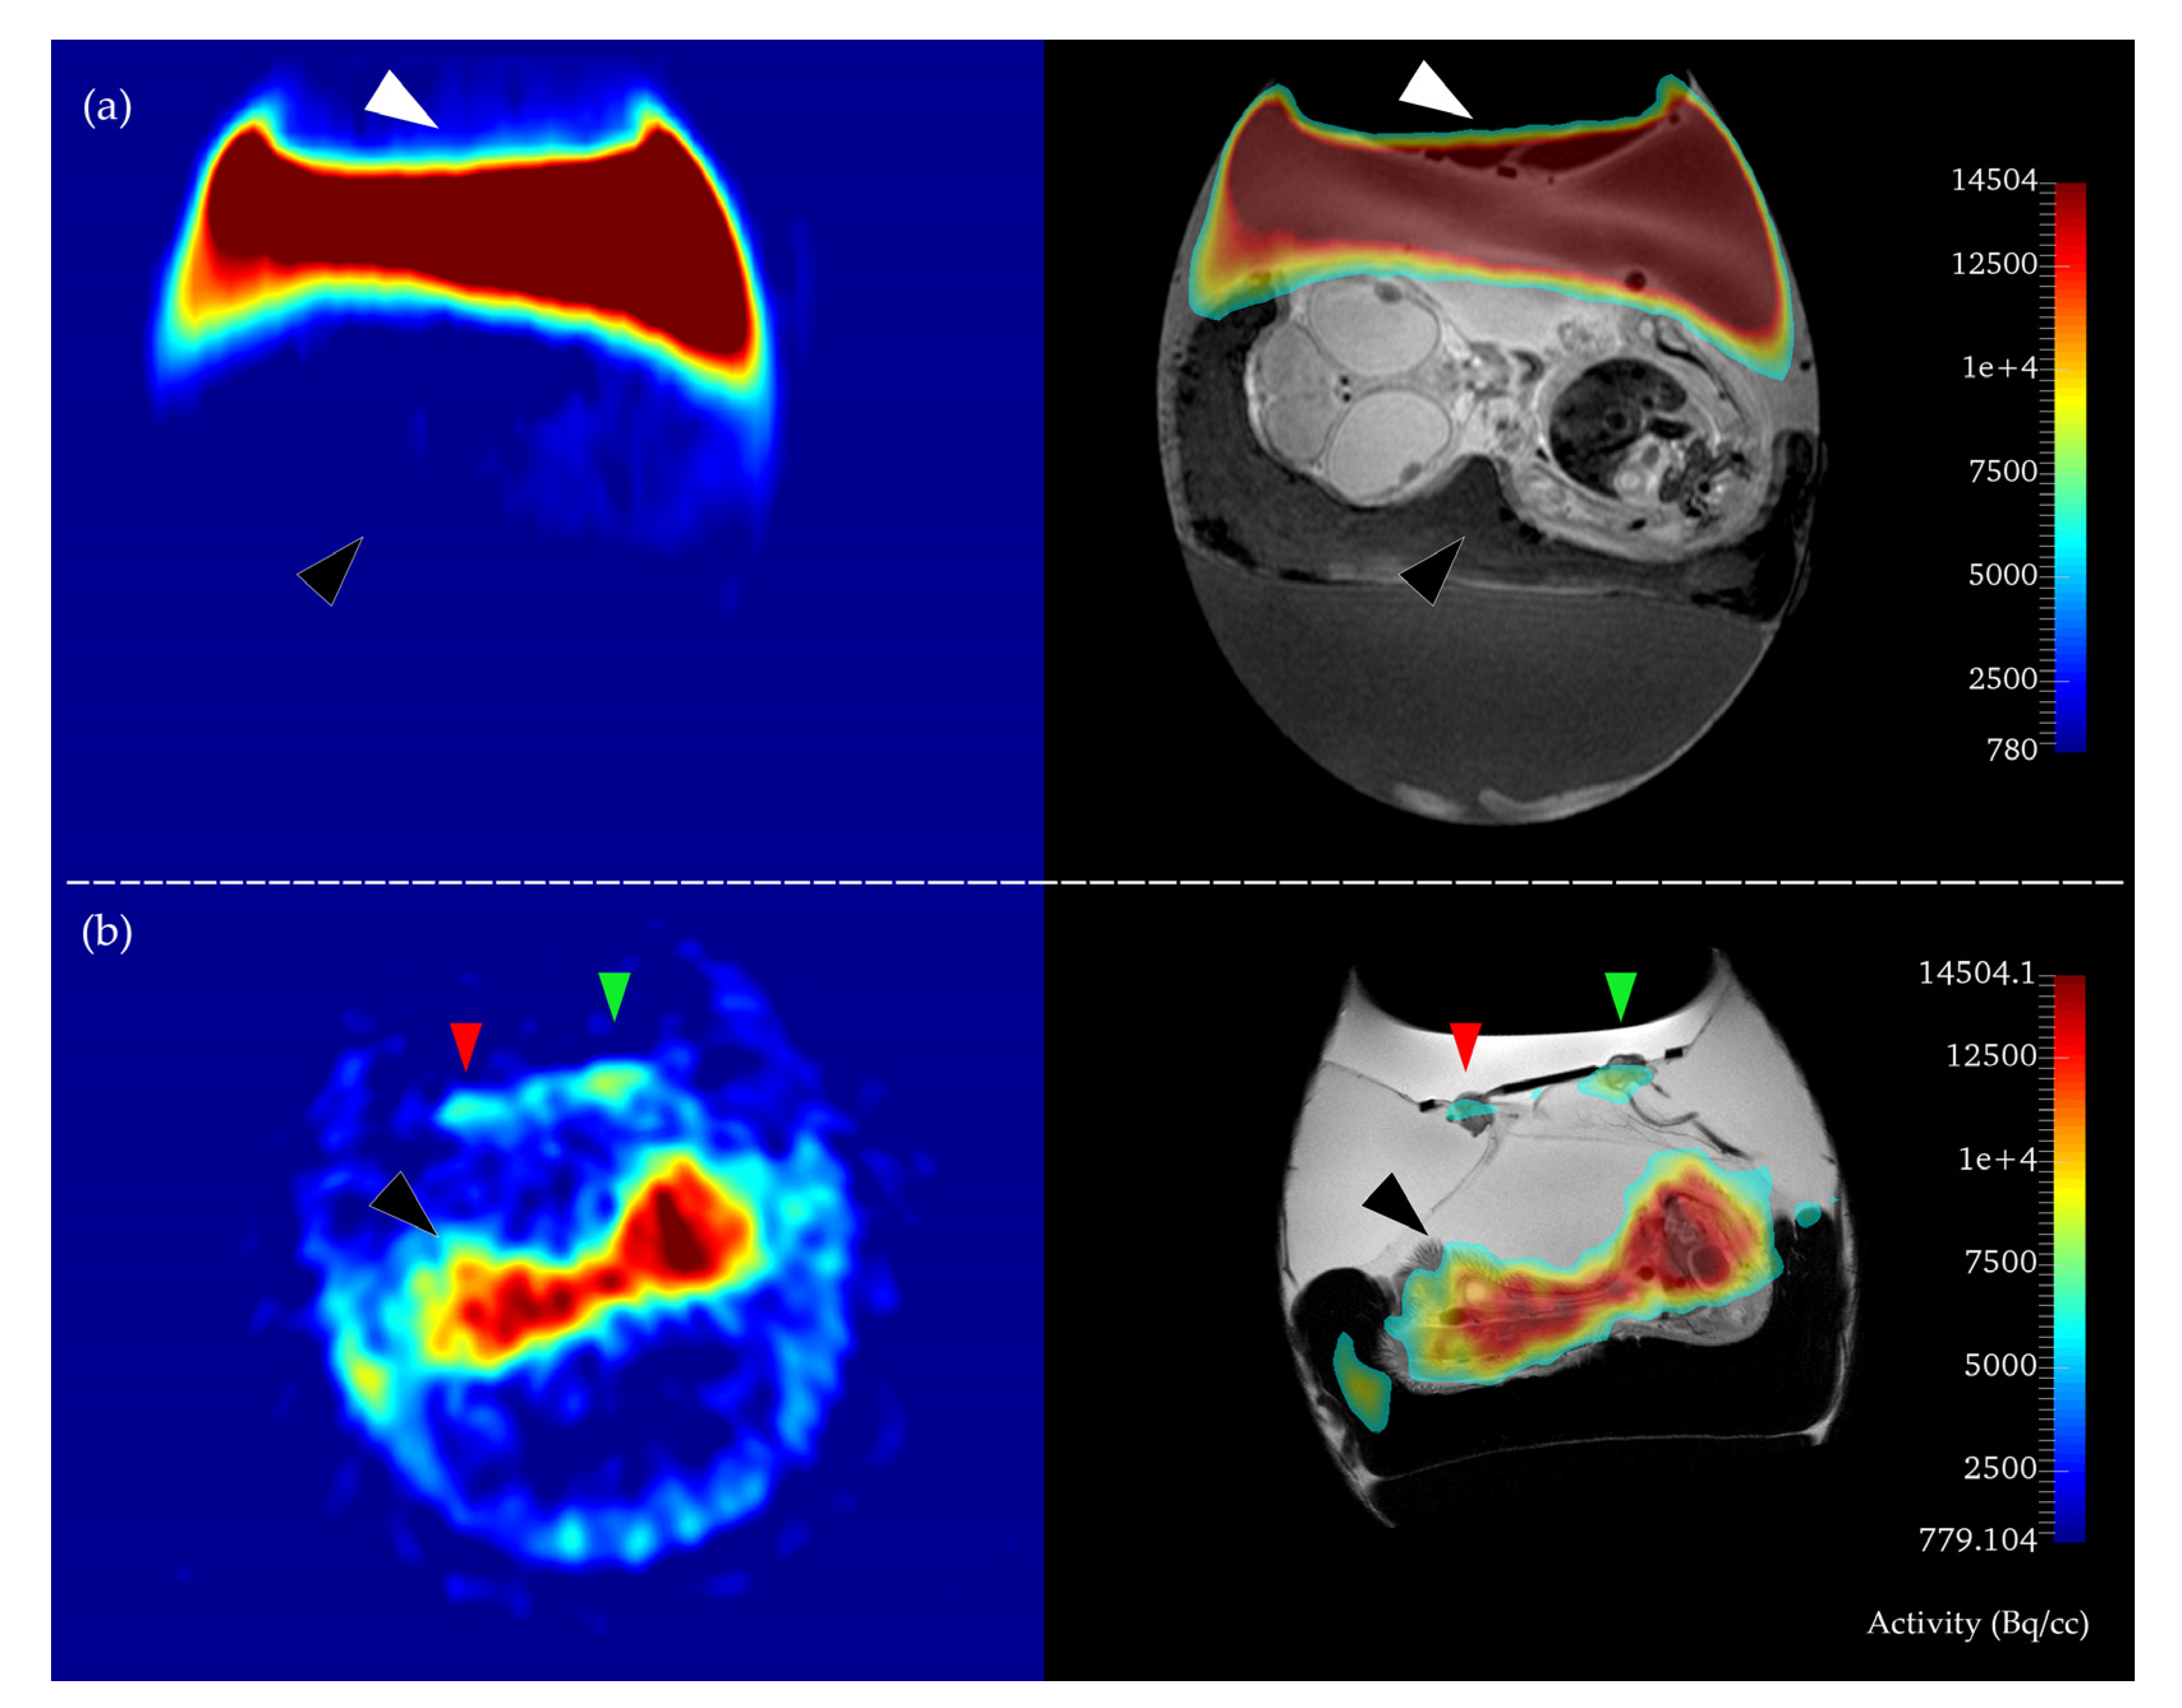
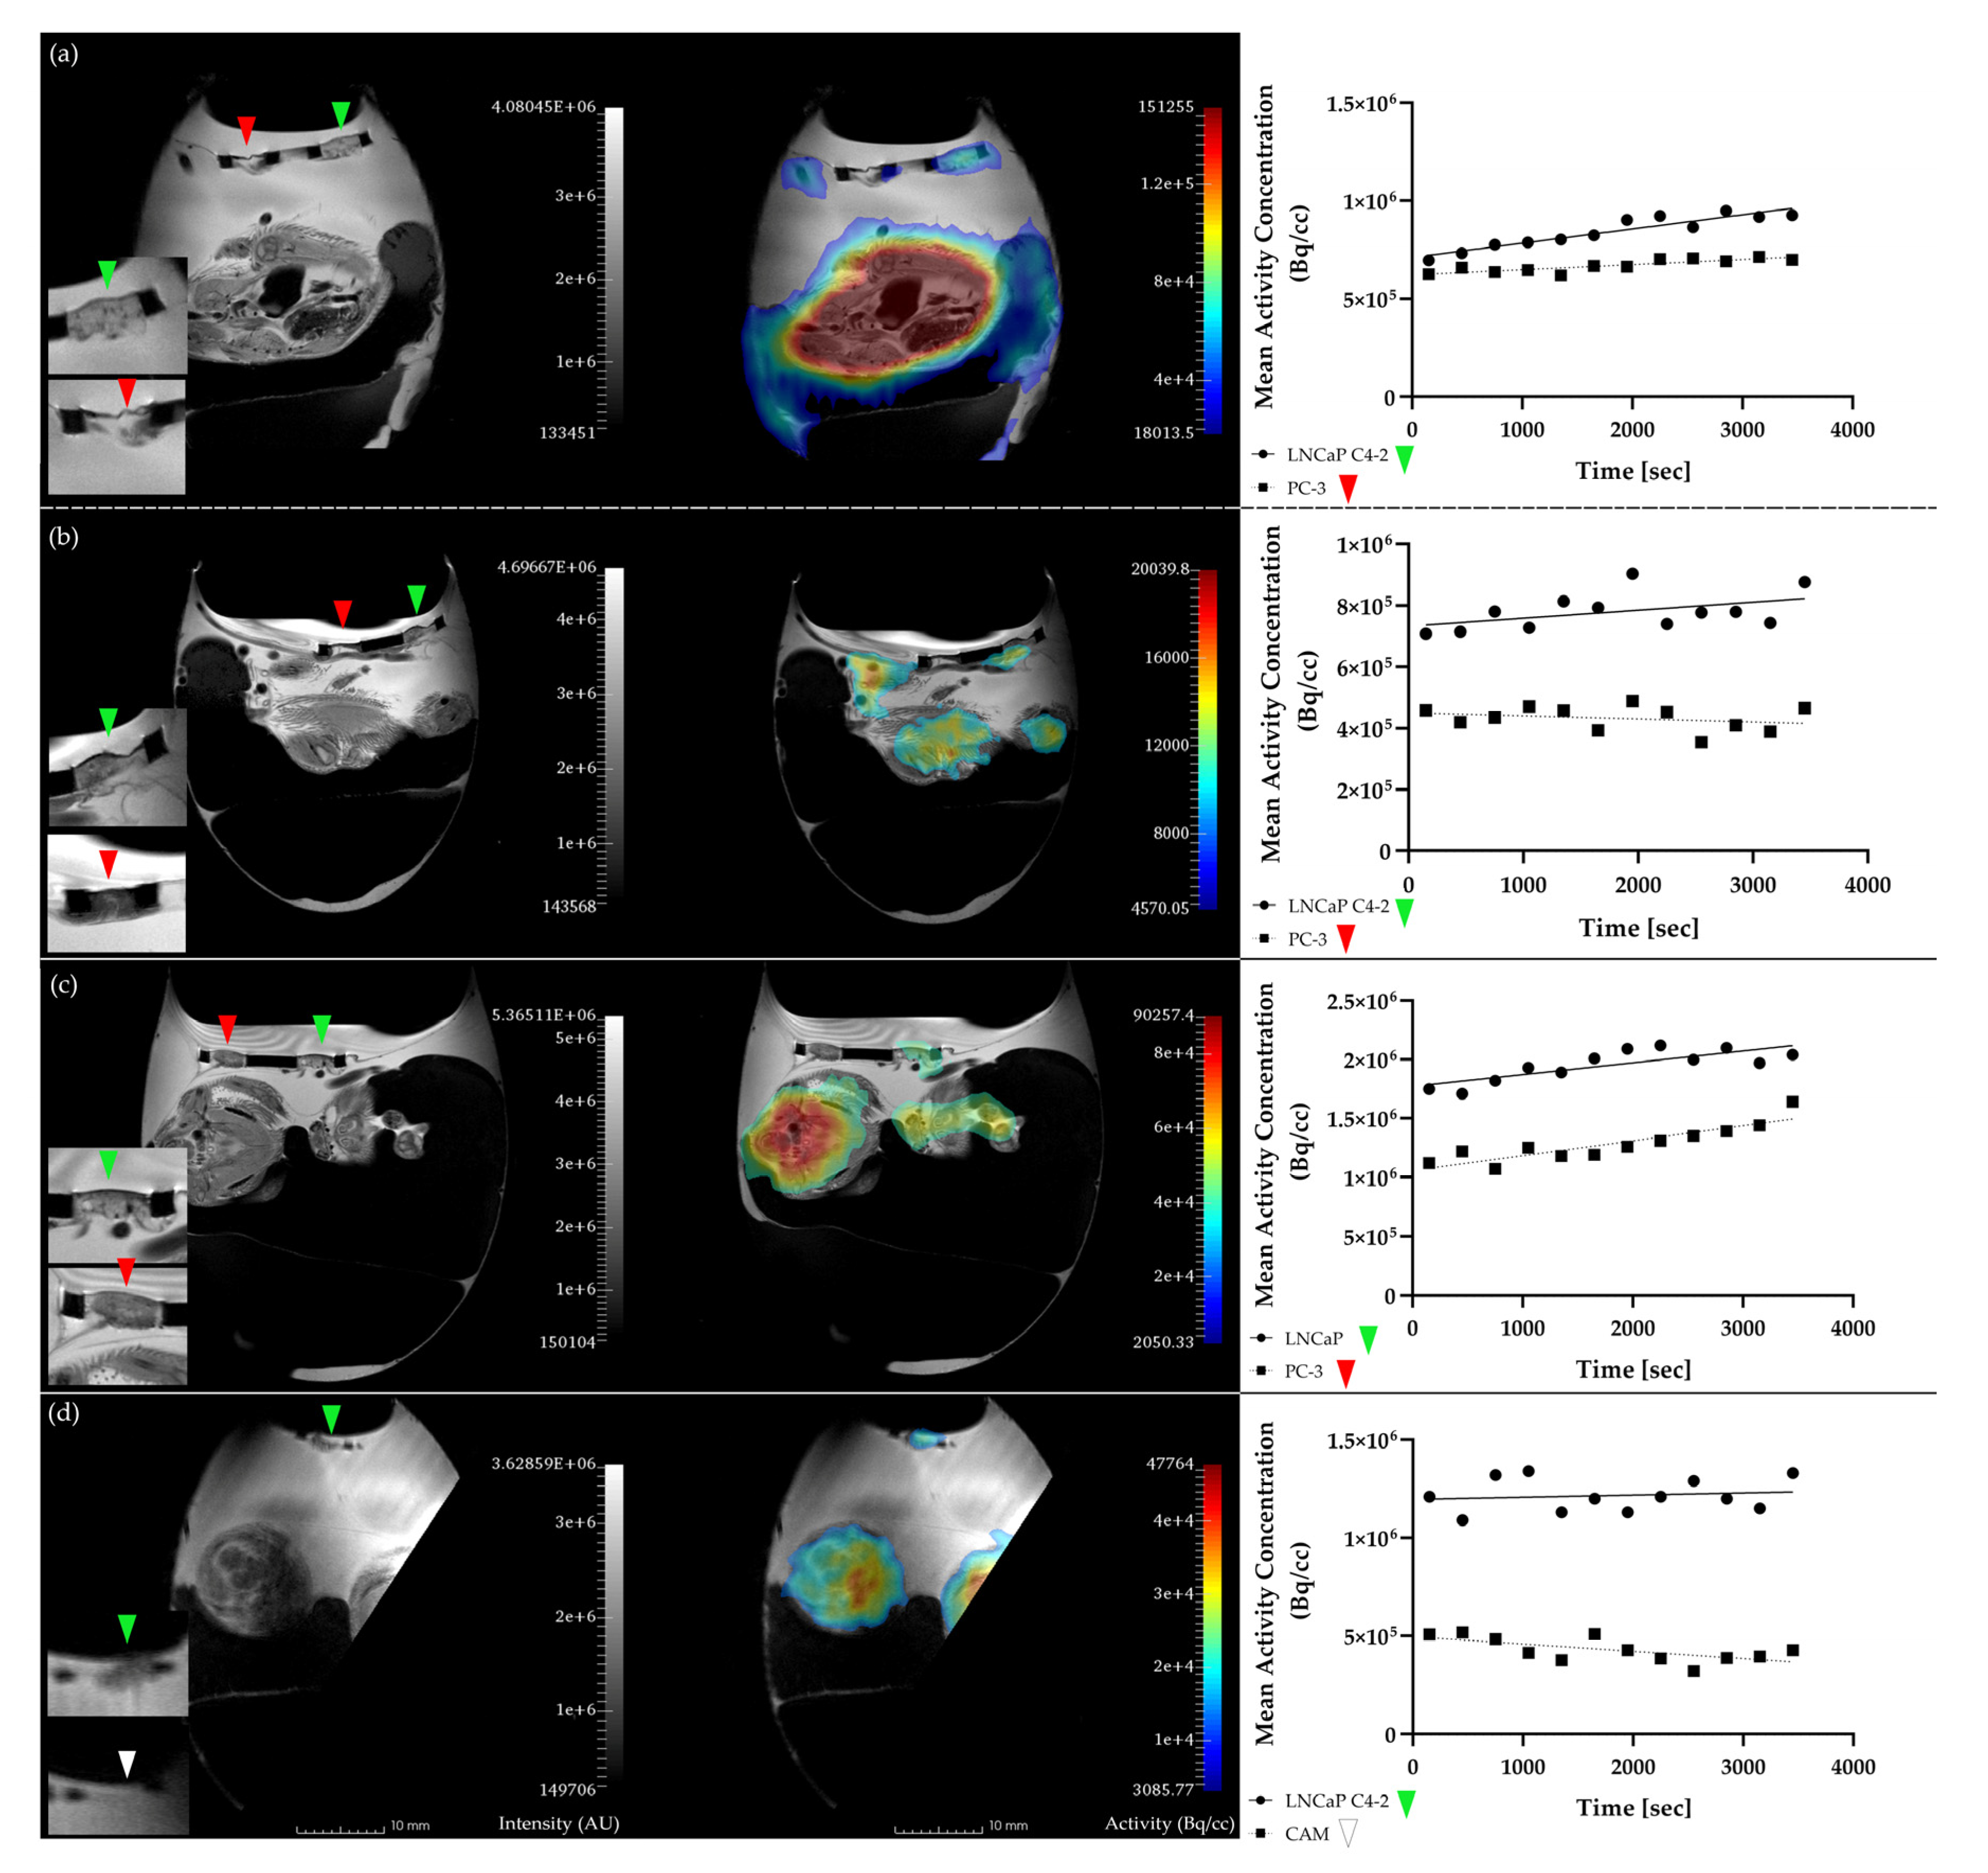
2.2. In Ovo MR and PET Imaging
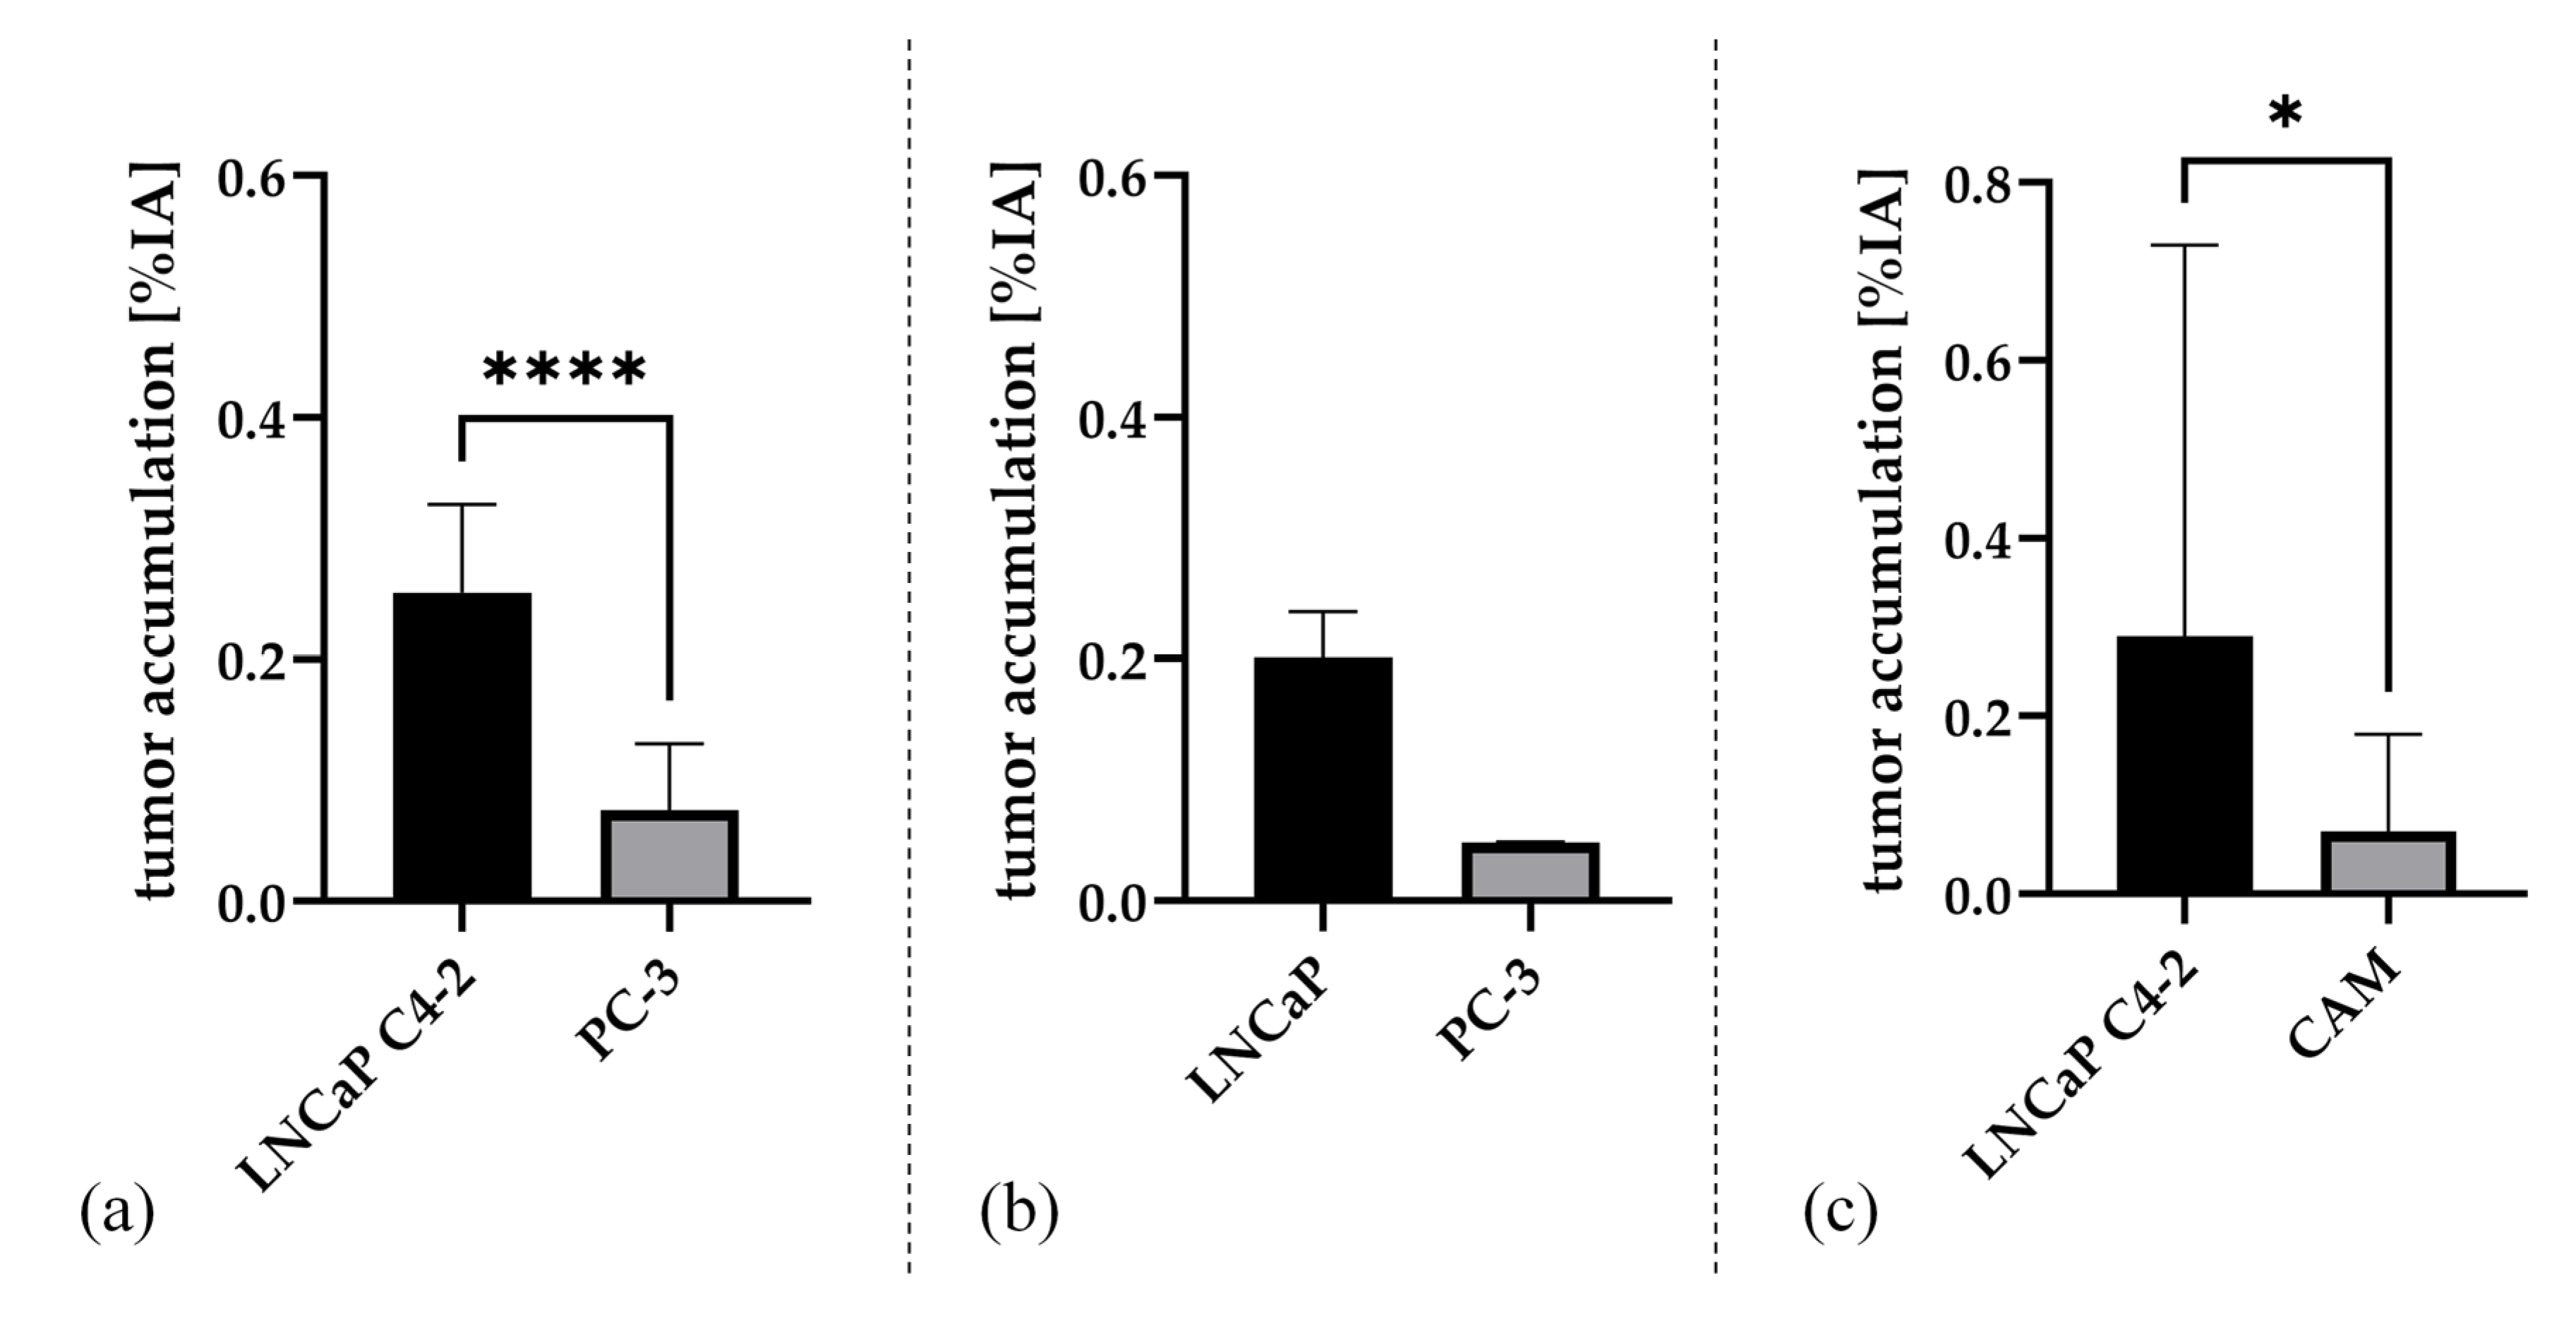
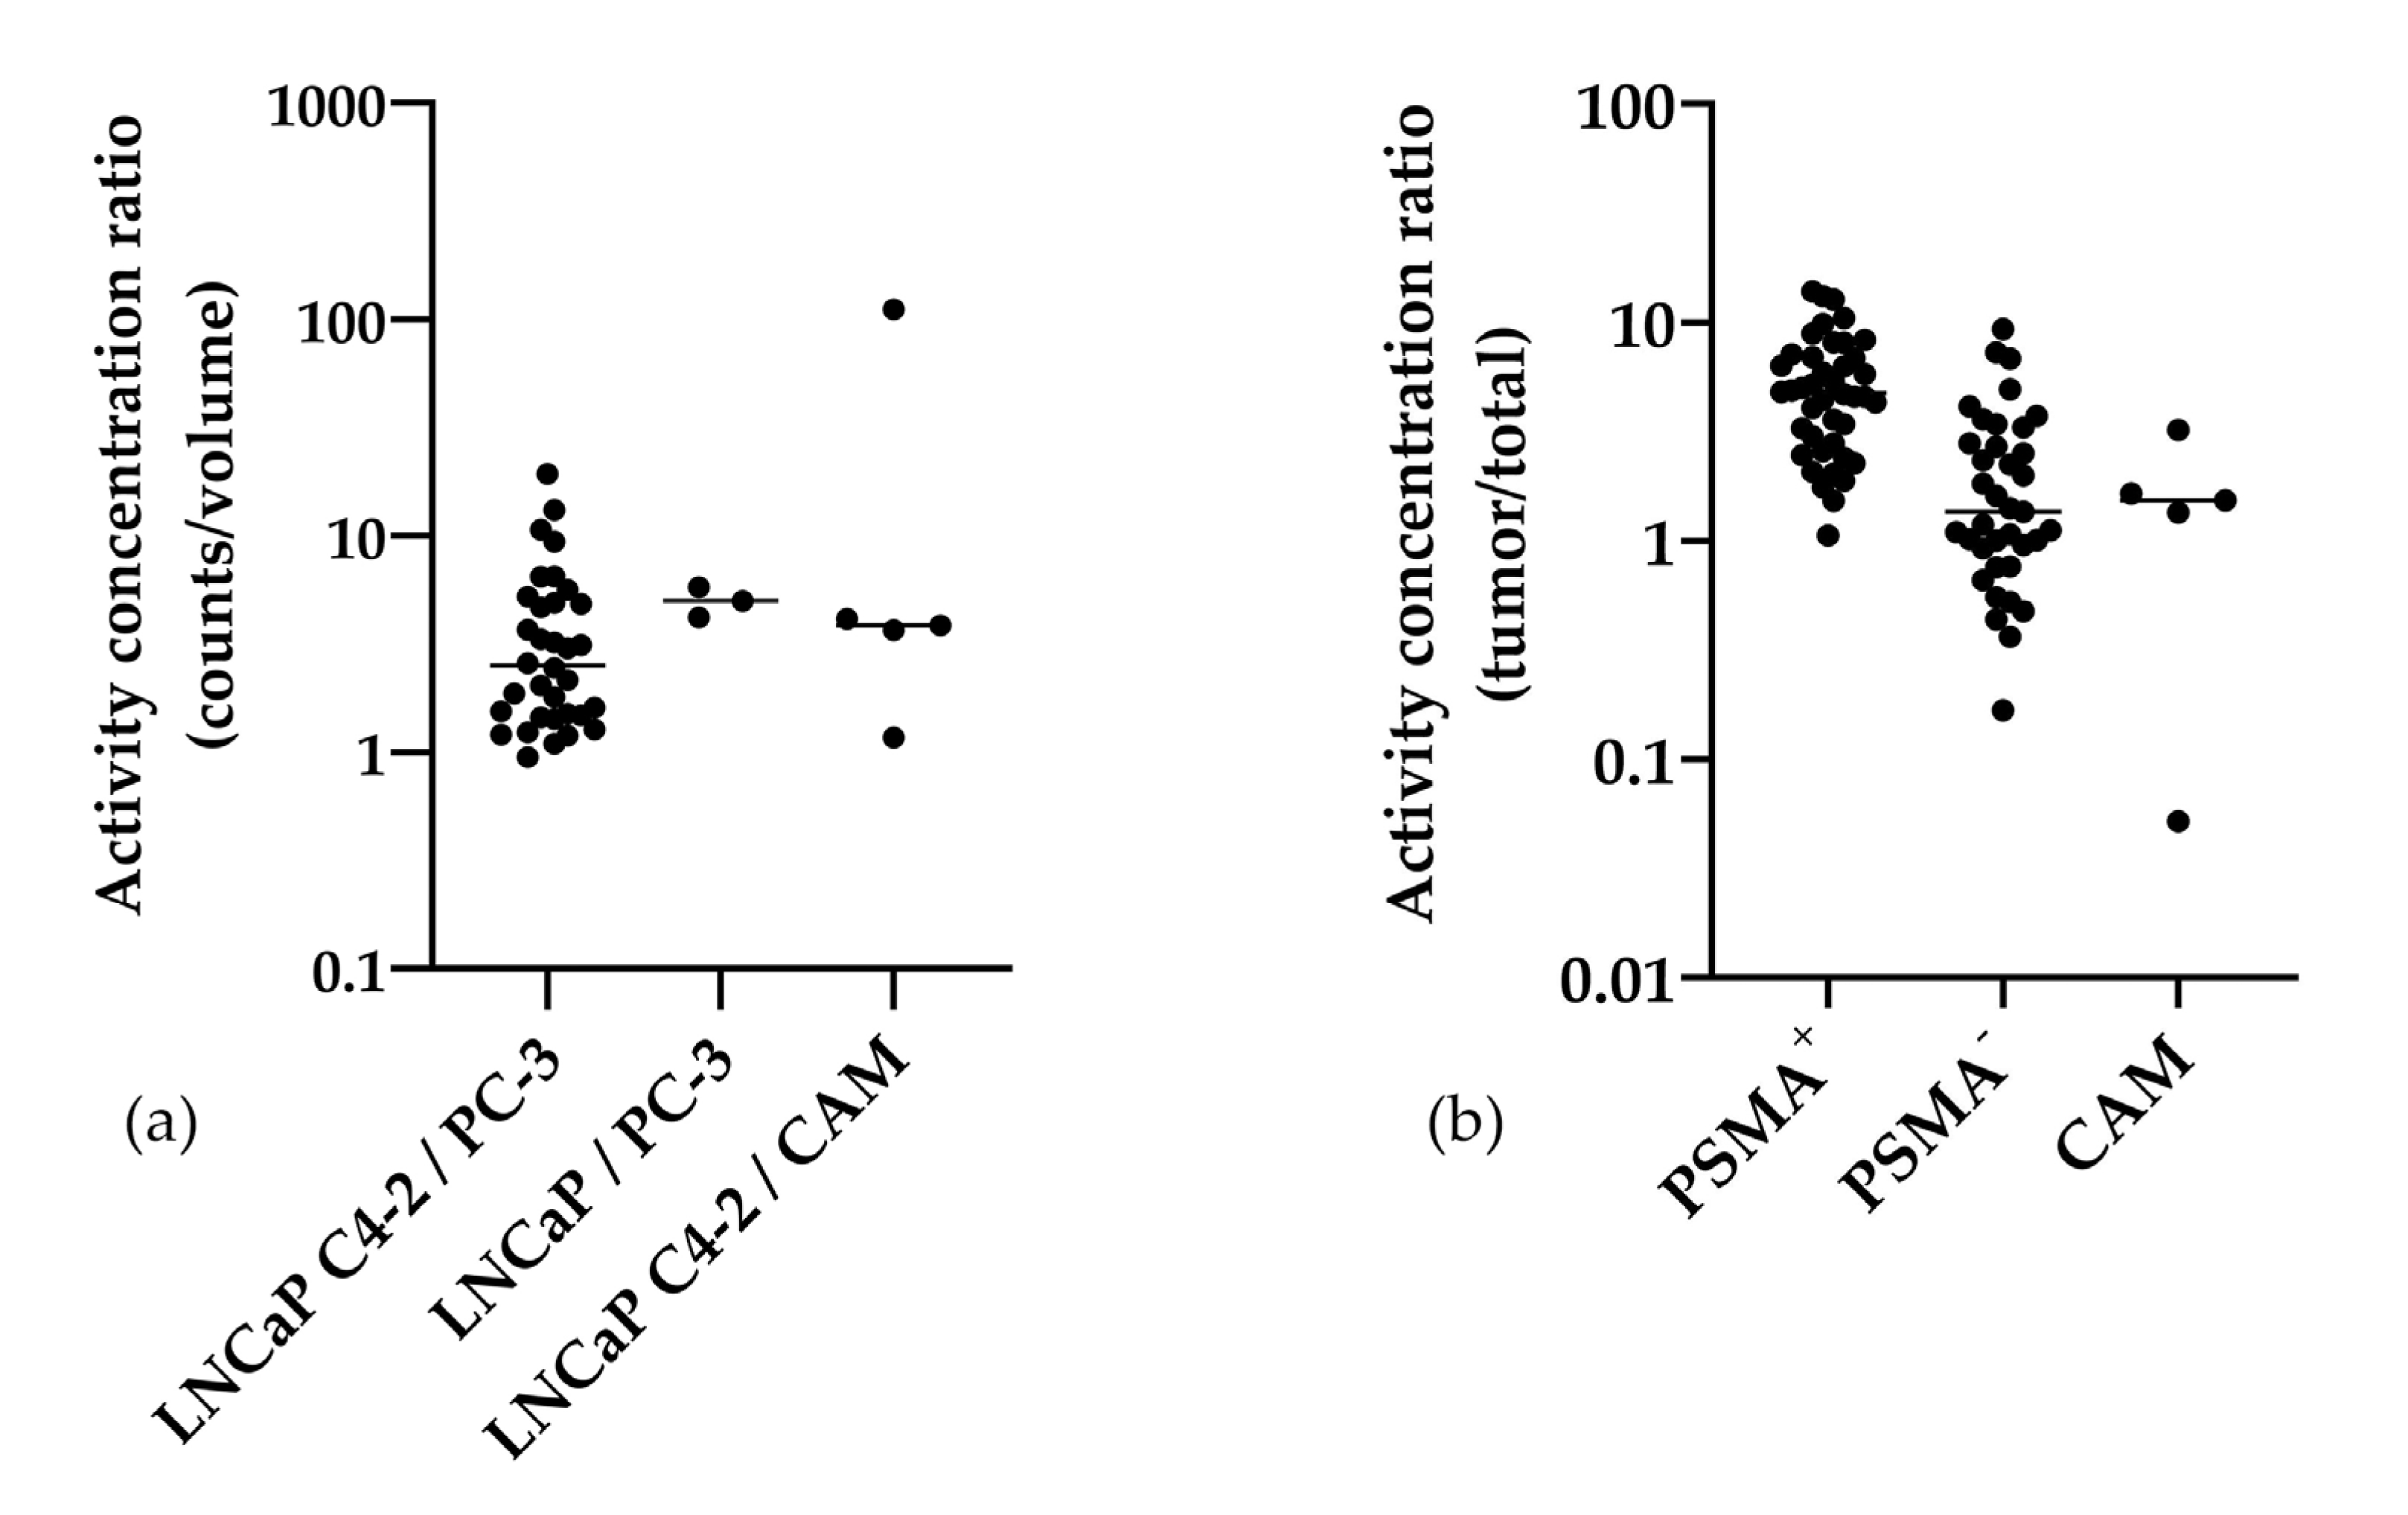
2.3. Gamma Counter-Based Evaluation
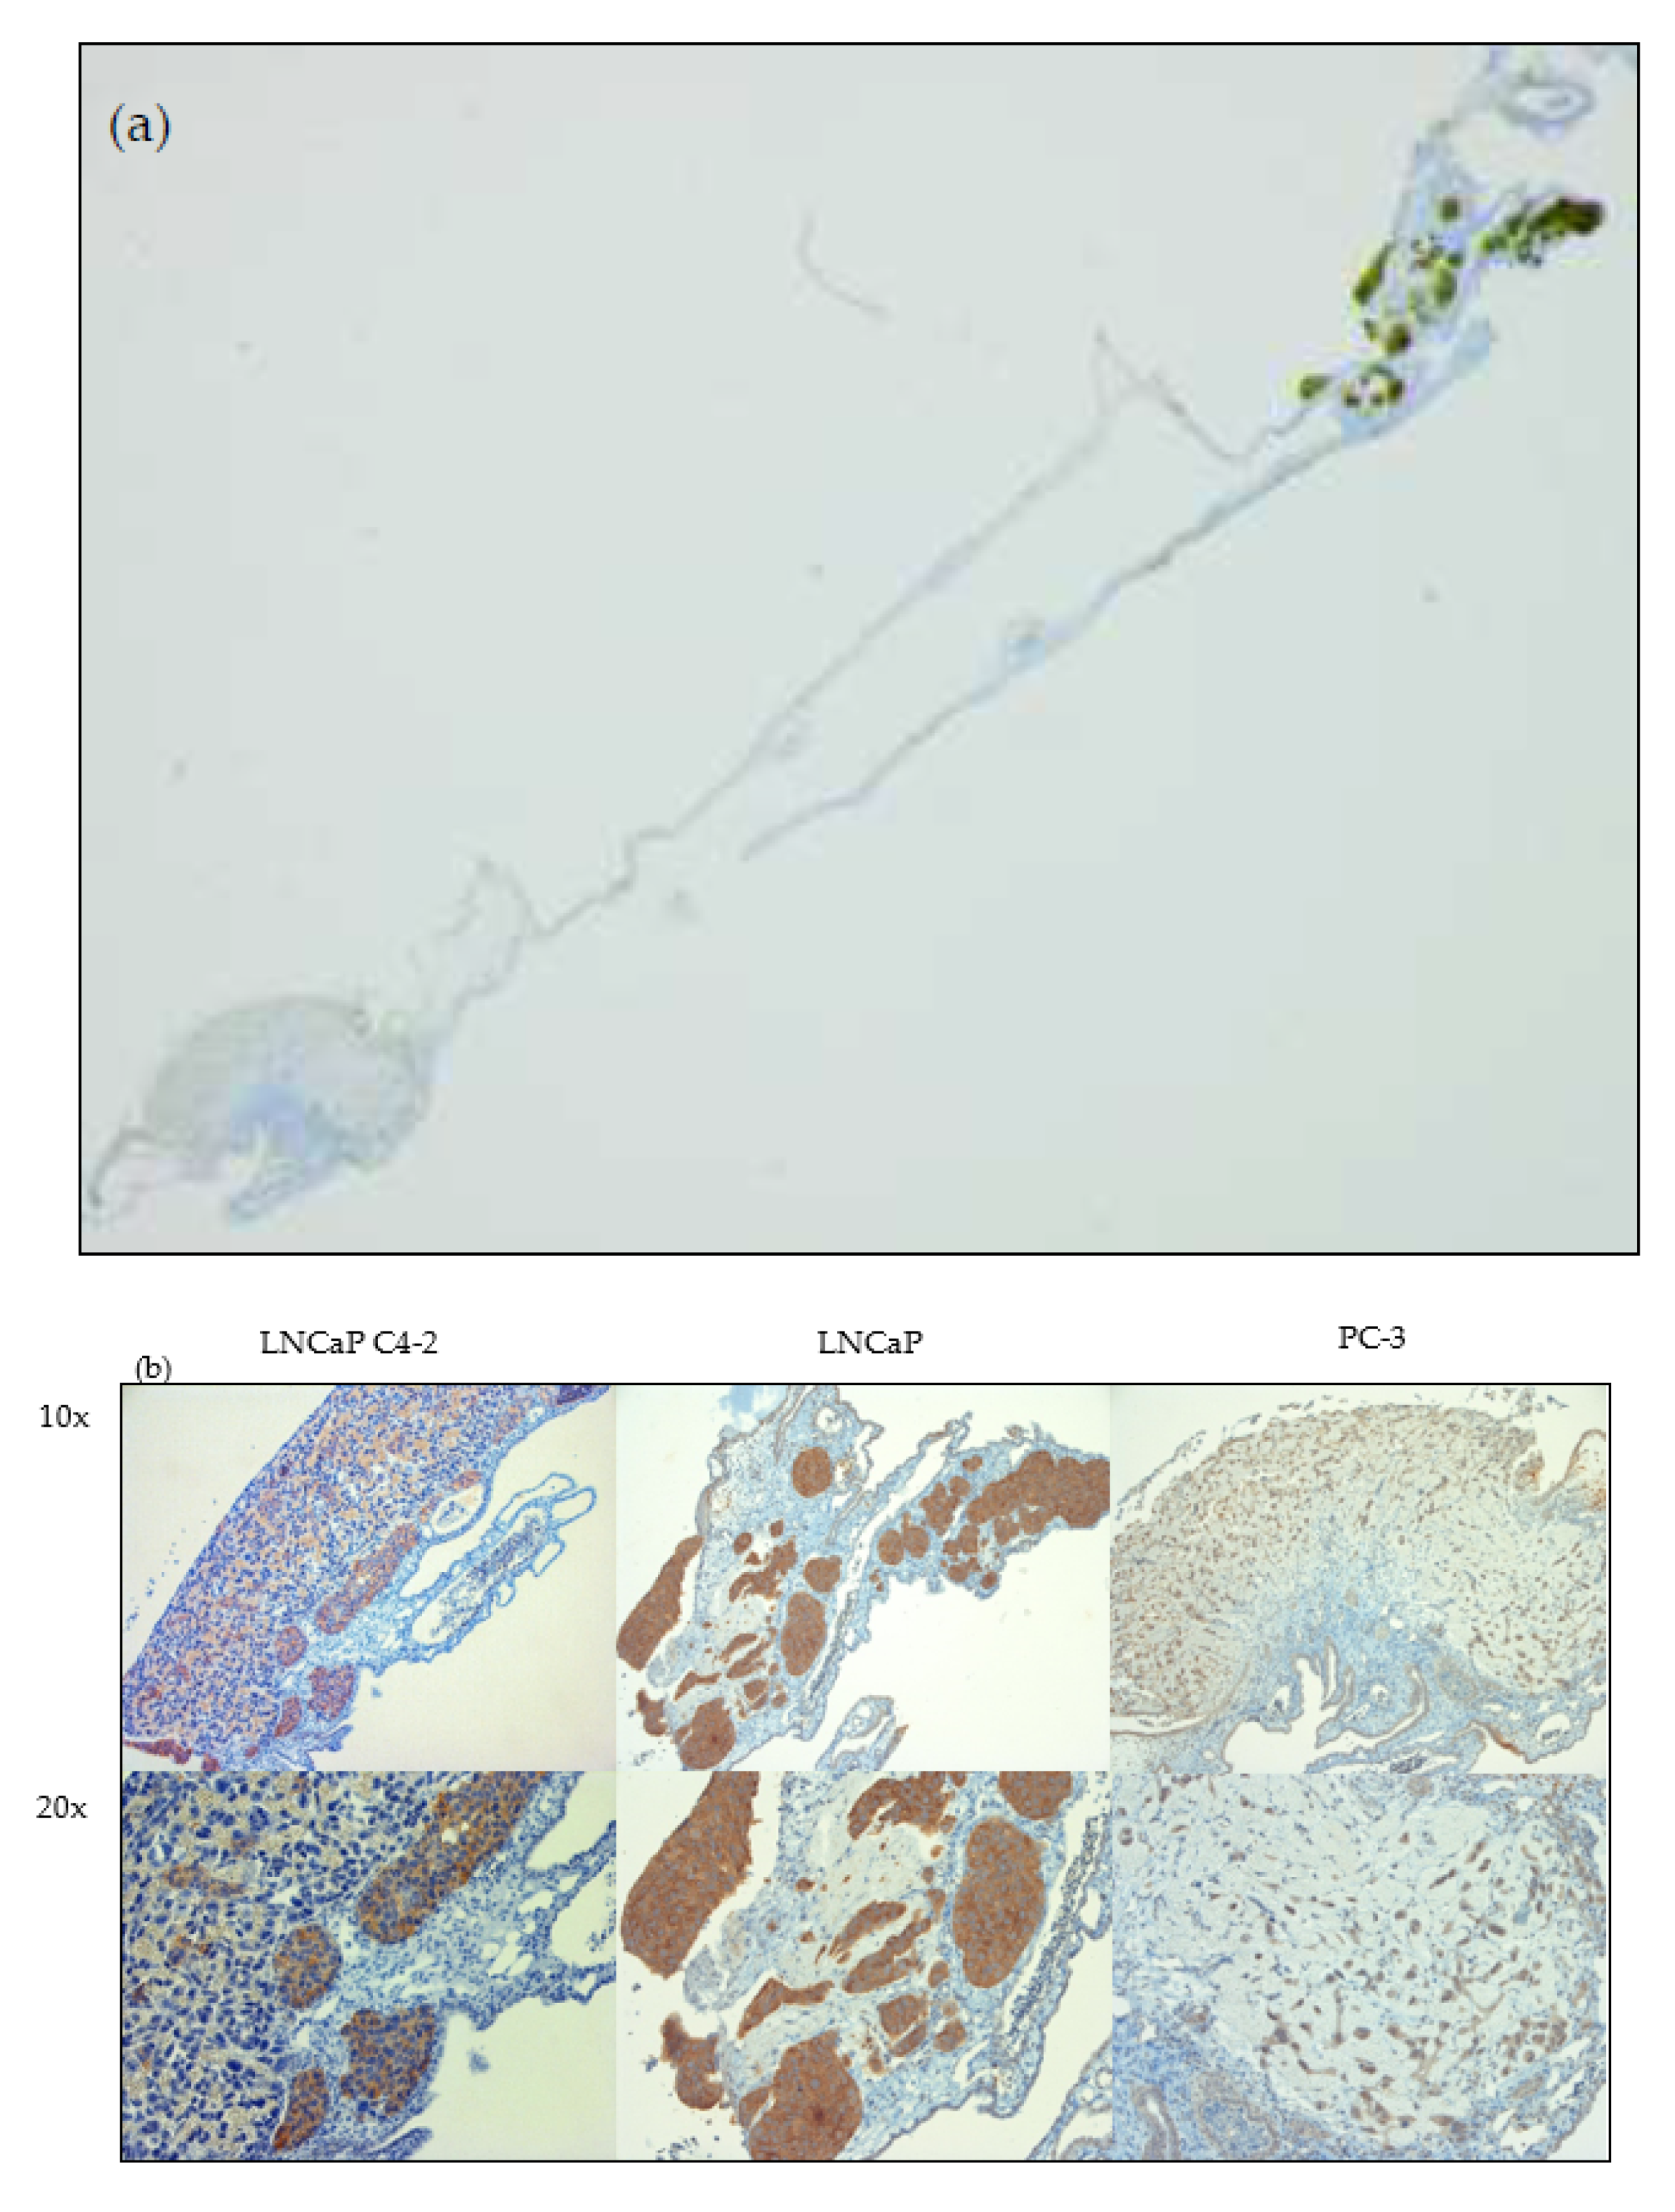
2.4. Immunohistochemistry for PSMA Detection
3. Discussion
3.1. Analysis of In Ovo Target-Specific Binding of [68Ga]Ga-PSMA-11 and Comparison to Reported Data in Mice
3.2. MR Imaging, Tumor Volumetry, and PET-MR Image Fusion
3.3. Methodological and Logistical Aspects of the HET-CAM Xenograft Model
3.4. Limitations
4. Materials and Methods
4.1. Cell Culture
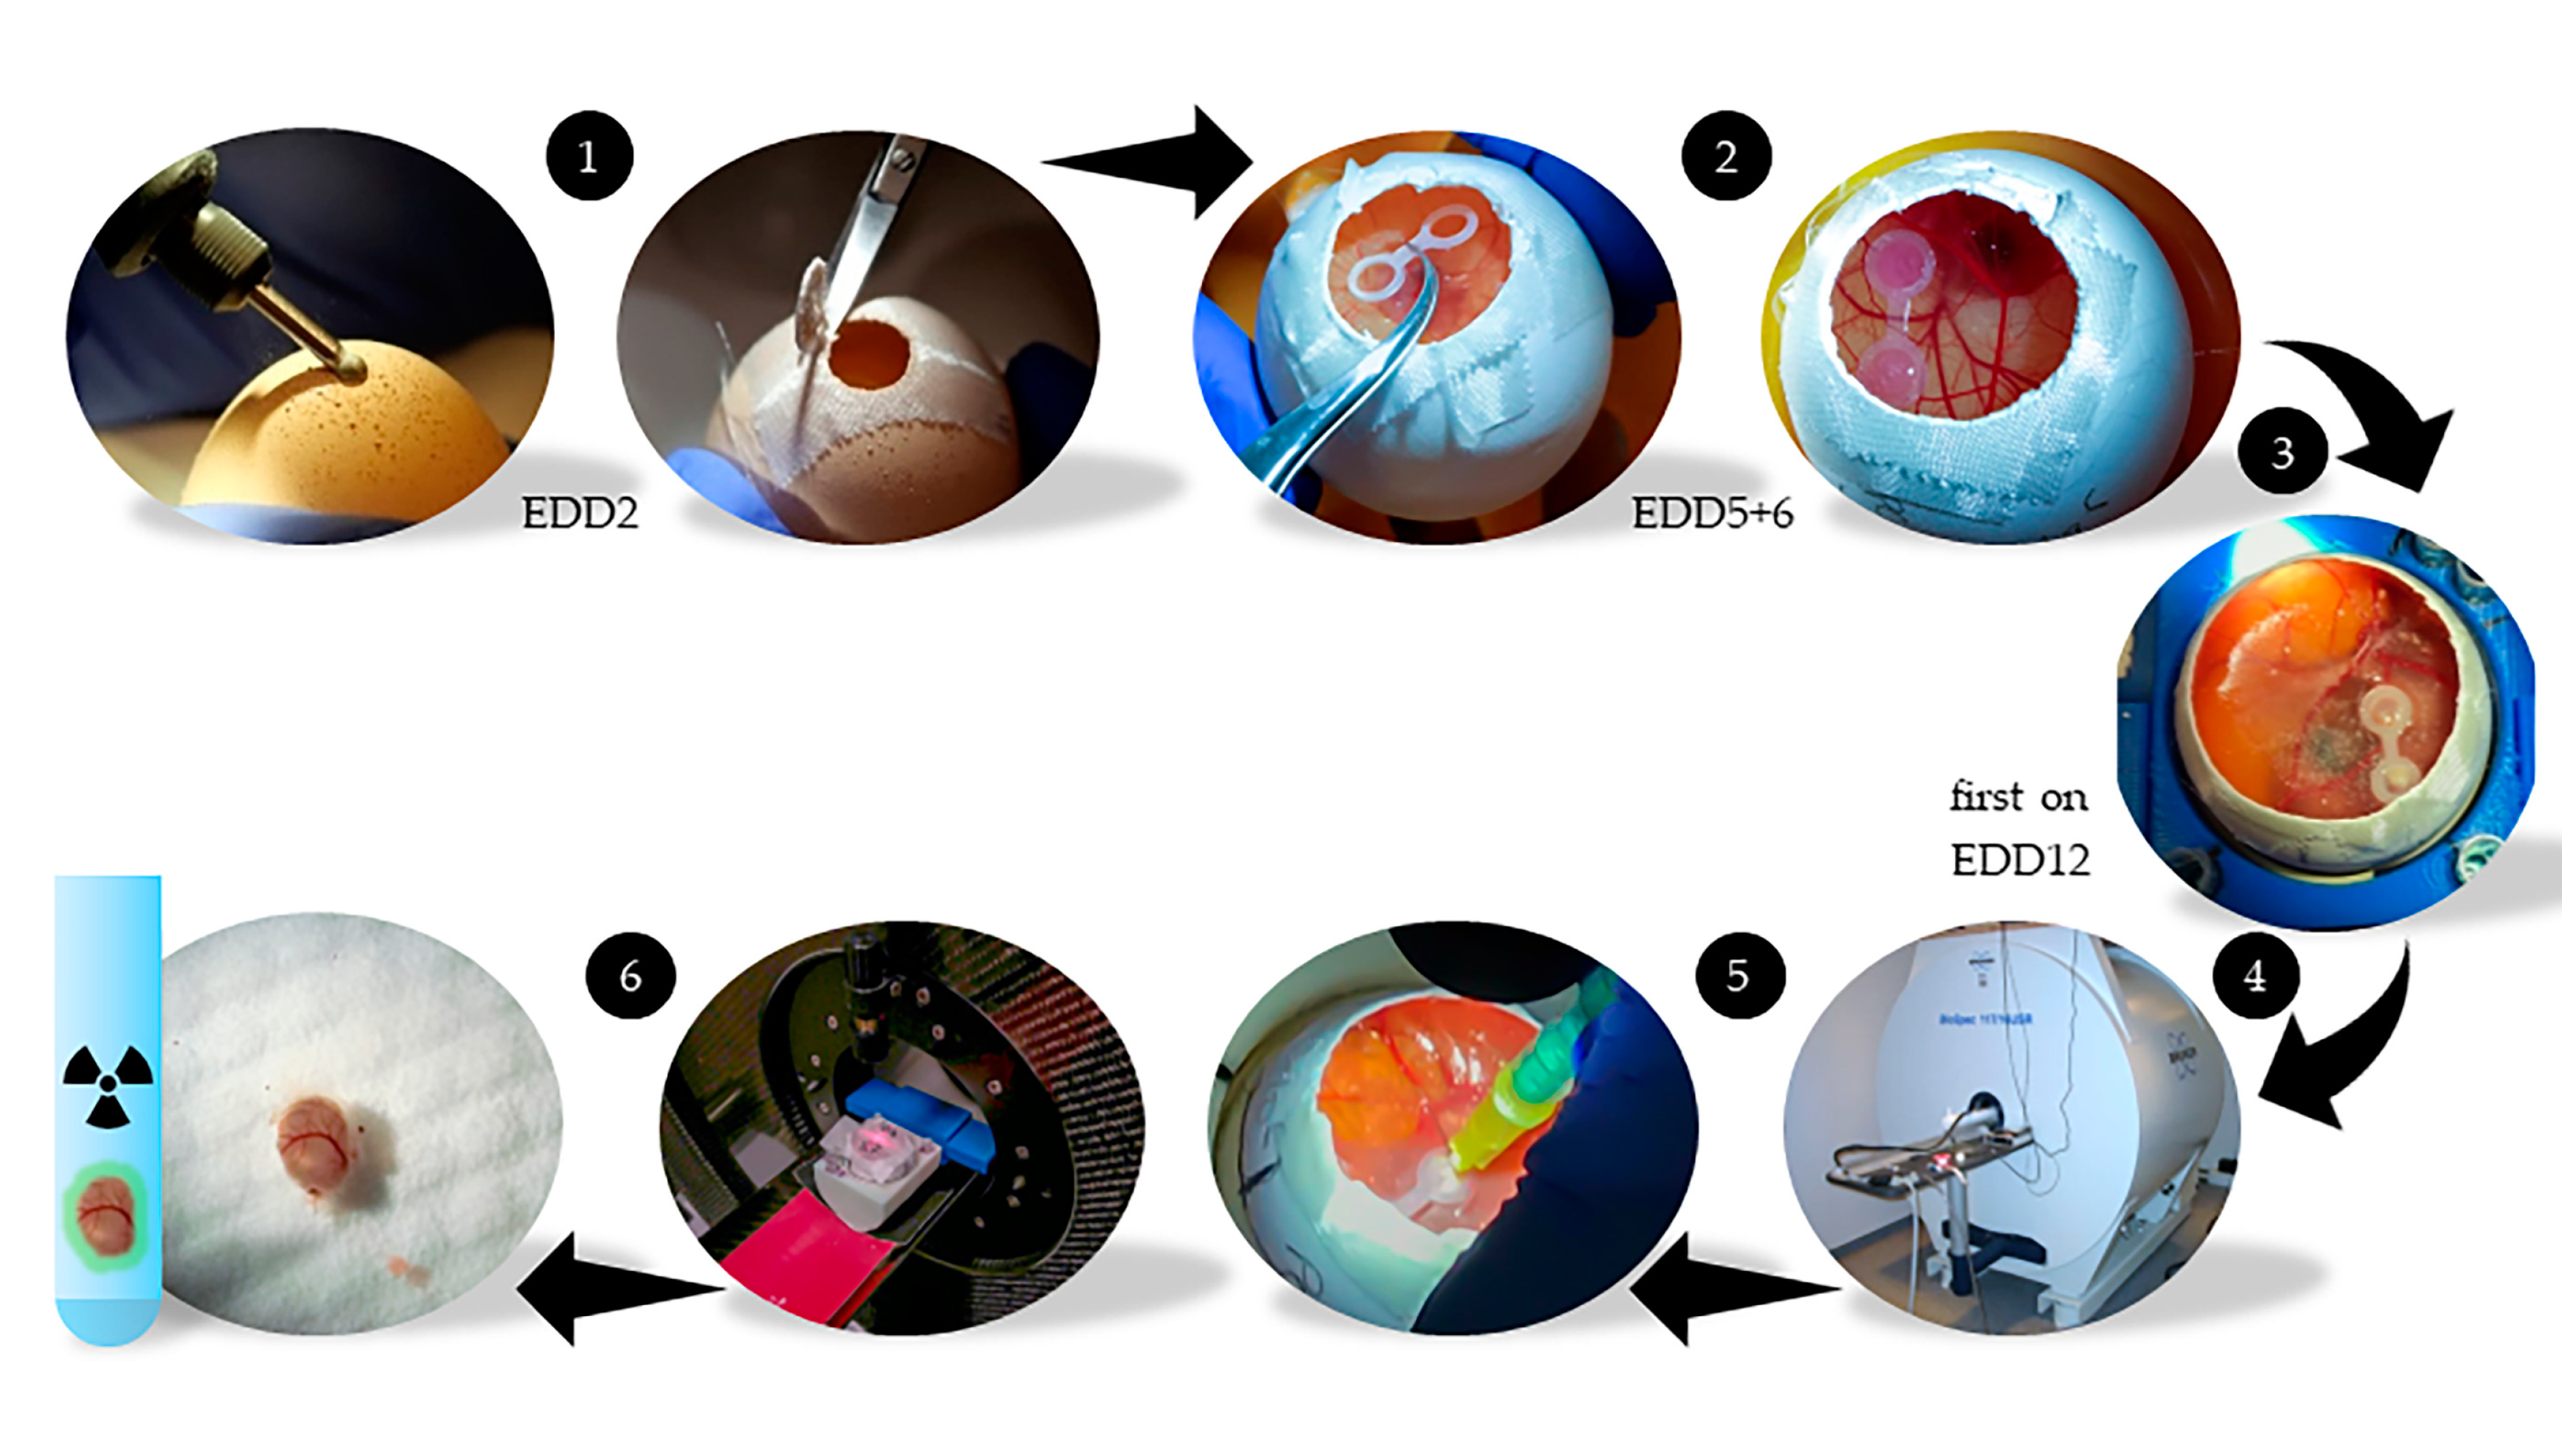
4.2. HET-CAM Model
4.3. MR and PET Imaging
4.4. Gamma Counter Quantification and Evaluation
4.5. Immunohistochemistry
5. Conclusions
Supplementary Materials
Author Contributions
Funding
Acknowledgments
Conflicts of Interest
References
- De Silva, R.A.; Kumar, D.; Lisok, A.; Chatterjee, S.; Wharram, B.; Venkateswara Rao, K.; Mease, R.; Dannals, R.F.; Pomper, M.G.; Nimmagadda, S. Peptide-based 68Ga-PET radiotracer for imaging PD-L1 expression in cancer. Mol. Pharm. 2018, 15, 3946–3952. [Google Scholar] [CrossRef] [PubMed]
- Amor-Coarasa, A.; Kelly, J.; Ponnala, S.; Vedvyas, Y.; Nikolopoulou, A.; Williams, C., Jr.; Jin, M.M.; David Warren, J.; Babich, J.W. [18F]RPS-544: A PET tracer for imaging the chemokine receptor CXCR4. Nucl. Med. Biol. 2018, 60, 37–44. [Google Scholar] [CrossRef] [PubMed]
- Lindner, T.; Loktev, A.; Altmann, A.; Giesel, F.; Kratochwil, C.; Debus, J.; Jager, D.; Mier, W.; Haberkorn, U. Development of quinoline-based theranostic ligands for the targeting of fibroblast activation protein. J. Nucl. Med. 2018, 59, 1415–1422. [Google Scholar] [CrossRef] [PubMed]
- Beckford Vera, D.R.; Smith, C.C.; Bixby, L.M.; Glatt, D.M.; Dunn, S.S.; Saito, R.; Kim, W.Y.; Serody, J.S.; Vincent, B.G.; Parrott, M.C. Immuno-PET imaging of tumor-infiltrating lymphocytes using zirconium-89 radiolabeled anti-CD3 antibody in immune-competent mice bearing syngeneic tumors. PLoS ONE 2018, 13, e0193832. [Google Scholar] [CrossRef]
- Stockhofe, K.; Postema, J.M.; Schieferstein, H.; Ross, T.L. Radiolabeling of nanoparticles and polymers for PET imaging. Pharmaceuticals 2014, 7, 392–418. [Google Scholar] [CrossRef]
- Leary, S.; Underwood, W.; Anthony, R.; Cartner, S.; Grandin, T.; Greenacre, C.; Gwaltney-Brant, S.; McCrackin, M.A.; Meyer, R.; Miller, D.; et al. AVMA Guidelines for the Euthanasia of Animal: 2020 Edition; AVMA American Veterinary Medical Association: Schaumburg, IL, USA, 2020. [Google Scholar]
- Deutscher Bundestag. Zum Schmerzempfinden von Hühnerembryonen. Deutscher Bundestag/Wissenschaftliche Dienste 2017, Umwelt, Naturschutz, Reaktorsicherheit, Bildung und Forschung; Deutscher Bundestag: Berlin, Germany, 2017. [Google Scholar]
- Aleksandrowicz, E.; Herr, I. Ethical euthanasia and short-term anesthesia of the chick embryo. ALTEX 2015, 32, 143–147. [Google Scholar] [CrossRef]
- Bjørnstad, S.; Austdal, L.P.E.; Roald, B.; Glover, J.C.; Paulsen, R.E. Cracking the Egg: Potential of the Developing Chicken as a Model System for Nonclinical Safety Studies of Pharmaceuticals. J. Pharmacol. Exp. Ther. 2015, 355, 386–396. [Google Scholar] [CrossRef]
- Campbell, M.L.H.; Mellor, D.J.; Sandoe, P. How should the welfare of fetal and neurologically immature postnatal animals be protected? Anim. Welfare 2014, 23, 369–379. [Google Scholar] [CrossRef]
- Eide, A.L.; Glover, J.C. Development of the longitudinal projection patterns of lumbar primary sensory afferents in the chicken embryo. J. Comp. Neurol. 1995, 353, 247–259. [Google Scholar] [CrossRef]
- Eide, A.L.; Glover, J.C. Developmental dynamics of functionally specific primary sensory afferent projections in the chicken embryo. Anat. Embryol. (Berl.) 1997, 195, 237–250. [Google Scholar] [CrossRef] [PubMed]
- Rosenbruch, M. Early stages of the incubated chicken egg as a model in experimental biology and medicine. ALTEX Altern. Anim. Exp. 1994, 11, 7. [Google Scholar]
- Rosenbruch, M. The sensitivity of chicken embryos in incubated eggs. ALTEX Altern. Anim. Exp. 1997, 14, 3. [Google Scholar]
- Harris, J.J. The human tumor grown in the egg. Ann. N. Y. Acad. Sci. 1958, 76, 764–769. [Google Scholar] [CrossRef] [PubMed]
- Ebert, J.D. The Effects of Chorioallantoic Transplants of Adult Chicken Tissues on Homologous Tissues of the Host Chick Embryo. Proc. Natl. Acad. Sci. USA 1954, 40, 337–347. [Google Scholar] [CrossRef] [PubMed]
- Ribatti, D. The chick embryo chorioallantoic membrane (CAM). A multifaceted experimental model. Mech. Dev. 2016, 141, 70–77. [Google Scholar] [CrossRef] [PubMed]
- Rahn, H.; Paganelli, C.V.; Ar, A. The avian egg: Air-cell gas tension, metabolism and incubation time. Respir. Physiol. 1974, 22, 297–309. [Google Scholar] [CrossRef]
- Romanoff, A.L. The Extraembryonic Membranes. In The Avian Embryo. Structural and Functional Development, 1st ed.; Macmillan: New York, NY, USA, 1960; pp. 1116–1124. [Google Scholar]
- Schlatter, P.; Konig, M.F.; Karlsson, L.M.; Burri, P.H. Quantitative study of intussusceptive capillary growth in the chorioallantoic membrane (CAM) of the chicken embryo. Microvasc. Res. 1997, 54, 65–73. [Google Scholar] [CrossRef]
- Mangieri, D.; Nico, B.; Benagiano, V.; De Giorgis, M.; Vacca, A.; Ribatti, D. Angiogenic activity of multiple myeloma endothelial cells in vivo in the chick embryo chorioallantoic membrane assay is associated to a down-regulation in the expression of endogenous endostatin. J. Cell Mol. Med. 2008, 12, 1023–1028. [Google Scholar] [CrossRef]
- Lokman, N.A.; Elder, A.S.; Ricciardelli, C.; Oehler, M.K. Chick chorioallantoic membrane (CAM) assay as an in vivo model to study the effect of newly identified molecules on ovarian cancer invasion and metastasis. Int. J. Mol. Sci. 2012, 13, 9959–9970. [Google Scholar] [CrossRef]
- Haller, S.; Ametamey, S.M.; Schibli, R.; Müller, C. Investigation of the chick embryo as a potential alternative to the mouse for evaluation of radiopharmaceuticals. Nucl. Med. Biol. 2015, 42, 226–233. [Google Scholar] [CrossRef]
- Dünker, N.; Jendrossek, V. Implementation of the Chick Chorioallantoic Membrane (CAM) Model in Radiation Biology and Experimental Radiation Oncology Research. Cancers 2019, 11, 1499. [Google Scholar] [CrossRef]
- Janse, E.M.; Jeurissen, S.H. Ontogeny and function of two non-lymphoid cell populations in the chicken embryo. Immunobiology 1991, 182, 472–481. [Google Scholar] [CrossRef]
- Vargas, A.; Zeisser-Labouebe, M.; Lange, N.; Gurny, R.; Delie, F. The chick embryo and its chorioallantoic membrane (CAM) for the in vivo evaluation of drug delivery systems. Adv. Drug Deliv. Rev. 2007, 59, 1162–1176. [Google Scholar] [CrossRef] [PubMed]
- Moreno-Jiménez, I.; Hulsart-Billstrom, G.; Lanham, S.A.; Janeczek, A.A.; Kontouli, N.; Kanczler, J.M.; Evans, N.D.; Oreffo, R.O. The chorioallantoic membrane (CAM) assay for the study of human bone regeneration: A refinement animal model for tissue engineering. Sci. Rep. 2016, 6, 32168. [Google Scholar] [CrossRef]
- Zuo, Z.; Syrovets, T.; Wu, Y.; Hafner, S.; Vernikouskaya, I.; Liu, W.; Ma, G.; Weil, T.; Simmet, T.; Rasche, V. The CAM cancer xenograft as a model for initial evaluation of MR labelled compounds. Sci. Rep. 2017, 7, 46690. [Google Scholar] [CrossRef]
- Vu, B.T.; Shahin, S.A.; Croissant, J.; Fatieiev, Y.; Matsumoto, K.; Le-Hoang Doan, T.; Yik, T.; Simargi, S.; Conteras, A.; Ratliff, L.; et al. Chick chorioallantoic membrane assay as an in vivo model to study the effect of nanoparticle-based anticancer drugs in ovarian cancer. Sci. Rep. 2018, 8, 8524. [Google Scholar] [CrossRef]
- Wittig, R.; Rosenholm, J.M.; Haartman, E.v.; Hemming, J.; Genze, F.; Bergman, L.; Simmet, T.; Lindén, M.; Sahlgren, C. Active targeting of mesoporous silica drug carriers enhances γ-secretase inhibitor efficacy in an in vivo model for breast cancer. Nanomedicine 2014, 9, 971–987. [Google Scholar] [CrossRef]
- Zuo, Z.; Syrovets, T.; Genze, F.; Abaei, A.; Ma, G.; Simmet, T.; Rasche, V. High-resolution MRI analysis of breast cancer xenograft on the chick chorioallantoic membrane. NMR Biomed. 2015, 28, 440–447. [Google Scholar] [CrossRef]
- Bain, M.M.; Fagan, A.J.; Mullin, J.M.; McNaught, I.; McLean, J.; Condon, B. Noninvasive monitoring of chick development in ovo using a 7T MRI system from day 12 of incubation through to hatching. J. Magn. Reson. Imaging 2007, 26, 198–201. [Google Scholar] [CrossRef]
- Heidrich, A.; Würbach, L.; Opfermann, T.; Saluz, H.P. Motion-artifact-free in vivo imaging utilizing narcotized avian embryos in ovo. Mol. Imaging Biol. 2011, 13, 208–214. [Google Scholar] [CrossRef]
- Dupertuis, Y.M.; Delie, F.; Cohen, M.; Pichard, C. In ovo method for evaluating the effect of nutritional therapies on tumor development, growth and vascularization. Clin. Nutr. Exp. 2015, 2, 9–17. [Google Scholar] [CrossRef]
- Würbach, L.; Heidrich, A.; Opfermann, T.; Gebhardt, P.; Saluz, H.P. Insights into bone metabolism of avian embryos in ovo via 3D and 4D 18F-fluoride positron emission tomography. Mol. Imaging Biol. 2012, 14, 688–698. [Google Scholar] [CrossRef] [PubMed]
- Warnock, G.; Turtoi, A.; Blomme, A.; Bretin, F.; Bahri, M.A.; Lemaire, C.; Libert, L.C.; Seret, A.E.; Luxen, A.; Castronovo, V.; et al. In vivo PET/CT in a human glioblastoma chicken chorioallantoic membrane model: A new tool for oncology and radiotracer development. J. Nucl. Med. 2013, 54, 1782–1788. [Google Scholar] [CrossRef] [PubMed]
- Steinemann, G.; Dittmer, A.; Schmidt, J.; Josuttis, D.; Fahling, M.; Biersack, B.; Beindorff, N.; Jolante Koziolek, E.; Schobert, R.; Brenner, W.; et al. Antitumor and antiangiogenic activity of the novel chimeric inhibitor animacroxam in testicular germ cell cancer. Mol. Oncol. 2019, 13, 2679–2696. [Google Scholar] [CrossRef]
- Freesmeyer, M.; Kuehnel, C.; Opfermann, T.; Niksch, T.; Wiegand, S.; Stolz, R.; Huonker, R.; Witte, O.W.; Winkens, T. The use of ostrich eggs for in ovo research: Making preclinical imaging research affordable and available. J. Nucl. Med. 2018, 59, 1901–1906. [Google Scholar] [CrossRef]
- Zlatopolskiy, B.D.; Zischler, J.; Schäfer, D.; Urusova, E.A.; Guliyev, M.; Bannykh, O.; Endepols, H.; Neumaier, B. Discovery of 7-[18F]fluorotryptophan as a novel positron emission tomography (PET) probe for the visualization of tryptophan metabolism in vivo. J. Med. Chem. 2018, 61, 189–206. [Google Scholar] [CrossRef]
- Davis, M.I.; Bennett, M.J.; Thomas, L.M.; Bjorkman, P.J. Crystal structure of prostate-specific membrane antigen, a tumor marker and peptidase. Proc. Natl. Acad. Sci. USA 2005, 102, 5981–5986. [Google Scholar] [CrossRef]
- Eder, M.; Schäfer, M.; Bauder-Wüst, U.; Hull, W.E.; Wangler, C.; Mier, W.; Haberkorn, U.; Eisenhut, M. 68Ga-complex lipophilicity and the targeting property of a urea-based PSMA inhibitor for PET imaging. Bioconjug. Chem. 2012, 23, 688–697. [Google Scholar] [CrossRef]
- Schäfer, M.; Bauder-Wüst, U.; Leotta, K.; Zoller, F.; Mier, W.; Haberkorn, U.; Eisenhut, M.; Eder, M. A dimerized urea-based inhibitor of the prostate-specific membrane antigen for 68Ga-PET imaging of prostate cancer. EJNMMI Res. 2012, 2, 23. [Google Scholar] [CrossRef]
- Miksch, J.; Bottke, D.; Krohn, T.; Thamm, R.; Bartkowiak, D.; Solbach, C.; Bolenz, C.; Beer, M.; Wiegel, T.; Beer, A.J.; et al. Interobserver variability, detection rate, and lesion patterns of 68Ga-PSMA-11-PET/CT in early-stage biochemical recurrence of prostate cancer after radical prostatectomy. Eur. J. Nucl. Med. Mol. Imaging 2020. [Google Scholar] [CrossRef]
- Horoszewicz, J.S.; Leong, S.S.; Kawinski, E.; Karr, J.P.; Rosenthal, H.; Chu, T.M.; Mirand, E.A.; Murphy, G.P. LNCaP model of human prostatic carcinoma. Cancer Res. 1983, 43, 1809–1818. [Google Scholar] [PubMed]
- Wu, H.C.; Hsieh, J.T.; Gleave, M.E.; Brown, N.M.; Pathak, S.; Chung, L.W. Derivation of androgen-independent human LNCaP prostatic cancer cell sublines: Role of bone stromal cells. Int. J. Cancer 1994, 57, 406–412. [Google Scholar] [CrossRef] [PubMed]
- Taylor, R.M.; Severns, V.; Brown, D.C.; Bisoffi, M.; Sillerud, L.O. Prostate cancer targeting motifs: Expression of αvβ3, neurotensin receptor 1, prostate specific membrane antigen, and prostate stem cell antigen in human prostate cancer cell lines and xenografts. Prostate 2012, 72, 523–532. [Google Scholar] [CrossRef] [PubMed]
- Troyer, J.K.; Beckett, M.L.; Wright, G.L., Jr. Detection and characterization of the prostate-specific membrane antigen (PSMA) in tissue extracts and body fluids. Int. J. Cancer 1995, 62, 552–558. [Google Scholar] [CrossRef]
- Denmeade, S.R.; Sokoll, L.J.; Dalrymple, S.; Rosen, D.M.; Gady, A.M.; Bruzek, D.; Ricklis, R.M.; Isaacs, J.T. Dissociation between androgen responsiveness for malignant growth vs. Expression of prostate specific differentiation markers PSA, hK2, and PSMA in human prostate cancer models. Prostate 2003, 54, 249–257. [Google Scholar] [CrossRef]
- Smith-Jones, P.M.; Vallabahajosula, S.; Goldsmith, S.J.; Navarro, V.; Hunter, C.J.; Bastidas, D.; Bander, N.H. In vitro characterization of radiolabeled monoclonal antibodies specific for the extracellular domain of prostate-specific membrane antigen. Cancer Res. 2000, 60, 5237–5243. [Google Scholar]
- Schulke, N.; Varlamova, O.A.; Donovan, G.P.; Ma, D.; Gardner, J.P.; Morrissey, D.M.; Arrigale, R.R.; Zhan, C.; Chodera, A.J.; Surowitz, K.G.; et al. The homodimer of prostate-specific membrane antigen is a functional target for cancer therapy. Proc. Natl. Acad. Sci. USA 2003, 100, 12590–12595. [Google Scholar] [CrossRef]
- Kaighn, M.E.; Narayan, K.S.; Ohnuki, Y.; Lechner, J.F.; Jones, L.W. Establishment and characterization of a human prostatic carcinoma cell line (PC-3). Investig. Urol. 1979, 17, 16–23. [Google Scholar]
- Winter, G. In PET Images a Major Accumulation of [68Ga]Ga-PSMA-11 Was Observed in the Developing Heart and Liver Region of the Chick Embryo. A Detailed Analysis Will Be in the Focus of Future Studies; Ulm University Medical Center: Ulm, Germany, 2020. [Google Scholar]
- Wang, Y.; Shao, G.; Wu, J.; Cui, C.; Zang, S.; Qiu, F.; Jia, R.; Wang, Z.; Wang, F. Preparation of 68Ga-PSMA-11 with a synthesis module for micro PET-CT imaging of PSMA expression during prostate cancer progression. Contrast Media Mol. Imaging 2018, 2018, 8046541. [Google Scholar] [CrossRef]
- Liolios, C.; Schäfer, M.; Haberkorn, U.; Eder, M.; Kopka, K. Novel bispecific PSMA/GRPr targeting radioligands with optimized pharmacokinetics for improved PET imaging of prostate cancer. Bioconjug. Chem. 2016, 27, 737–751. [Google Scholar] [CrossRef]
- Greifenstein, L.; Engelbogen, N.; Lahnif, H.; Sinnes, J.-P.; Bergmann, R.; Bachmann, M.; Rösch, F. Synthesis, labeling and preclinical evaluation of a squaric acid containing PSMA inhibitor labeled with 68Ga: A comparison with PSMA-11 and PSMA-617. ChemMedChem 2020, 15, 695–704. [Google Scholar] [CrossRef] [PubMed]
- Kuo, H.T.; Pan, J.; Zhang, Z.; Lau, J.; Merkens, H.; Zhang, C.; Colpo, N.; Lin, K.S.; Benard, F. Effects of linker modification on tumor-to-kidney contrast of 68Ga-labeled PSMA-targeted imaging probes. Mol. Pharm. 2018, 15, 3502–3511. [Google Scholar] [CrossRef] [PubMed]
- Rousseau, E.; Lau, J.; Kuo, H.-T.; Zhang, Z.; Merkens, H.; Hundal-Jabal, N.; Colpo, N.; Lin, K.-S.; Bénard, F. Monosodium glutamate reduces 68Ga-PSMA-11 uptake in salivary glands and kidneys in a preclinical prostate cancer model. J. Nucl. Med. Off. Publ. Soc. Nucl. Med. 2018, 59, 1865–1868. [Google Scholar] [CrossRef] [PubMed]
- Boschi, S.; Lee, J.T.; Beykan, S.; Slavik, R.; Wei, L.; Spick, C.; Eberlein, U.; Buck, A.K.; Lodi, F.; Cicoria, G.; et al. Synthesis and preclinical evaluation of an Al18F radiofluorinated Glu-urea-Lys(Ahx)-HBED-CC PSMA ligand. Eur. J. Nucl. Med. Mol. Imaging 2016, 43, 2122–2130. [Google Scholar] [CrossRef]
- Cardinale, J.; Schafer, M.; Benesova, M.; Bauder-Wust, U.; Leotta, K.; Eder, M.; Neels, O.C.; Haberkorn, U.; Giesel, F.L.; Kopka, K. Preclinical evaluation of 18F-PSMA-1007, a new prostate-specific membrane antigen ligand for prostate cancer imaging. J. Nucl. Med. 2017, 58, 425–431. [Google Scholar] [CrossRef]
- Foss, C.A.; Mease, R.C.; Fan, H.; Wang, Y.; Ravert, H.T.; Dannals, R.F.; Olszewski, R.T.; Heston, W.D.; Kozikowski, A.P.; Pomper, M.G. Radiolabeled small-molecule ligands for prostate-specific membrane antigen: In vivo imaging in experimental models of prostate cancer. Clin. Cancer Res. 2005, 11, 4022–4028. [Google Scholar] [CrossRef]
- Dos Santos, J.C.; Schäfer, M.; Bauder-Wüst, U.; Lehnert, W.; Leotta, K.; Morgenstern, A.; Kopka, K.; Haberkorn, U.; Mier, W.; Kratochwil, C. Development and dosimetry of 203Pb/212Pb-labelled PSMA ligands: Bringing “the lead” into PSMA-targeted alpha therapy? Eur. J. Nucl. Med. Mol. Imaging 2019, 46, 1081–1091. [Google Scholar] [CrossRef]
- Kularatne, S.A.; Wang, K.; Santhapuram, H.K.; Low, P.S. Prostate-specific membrane antigen targeted imaging and therapy of prostate cancer using a PSMA inhibitor as a homing ligand. Mol. Pharm. 2009, 6, 780–789. [Google Scholar] [CrossRef]
- Wüstemann, T.; Bauder-Wüst, U.; Schäfer, M.; Eder, M.; Benesova, M.; Leotta, K.; Kratochwil, C.; Haberkorn, U.; Kopka, K.; Mier, W. Design of internalizing PSMA-specific Glu-ureido-based radiotherapeuticals. Theranostics 2016, 6, 1085–1095. [Google Scholar] [CrossRef]
- Benesova, M.; Schäfer, M.; Bauder-Wüst, U.; Afshar-Oromieh, A.; Kratochwil, C.; Mier, W.; Haberkorn, U.; Kopka, K.; Eder, M. Preclinical evaluation of a tailor-made DOTA-conjugated PSMA inhibitor with optimized linker moiety for imaging and endoradiotherapy of prostate cancer. J. Nucl. Med. 2015, 56, 914–920. [Google Scholar] [CrossRef]
- Han, X.D.; Liu, C.; Liu, F.; Xie, Q.H.; Liu, T.L.; Guo, X.Y.; Xu, X.X.; Yang, X.; Zhu, H.; Yang, Z. 64Cu-PSMA-617: A novel PSMA-targeted radio-tracer for PET imaging in gastric adenocarcinoma xenografted mice model. Oncotarget 2017, 8, 74159–74169. [Google Scholar] [CrossRef] [PubMed]
- Fan, X.; Wang, L.; Guo, Y.; Tu, Z.; Li, L.; Tong, H.; Xu, Y.; Li, R.; Fang, K. Ultrasonic nanobubbles carrying anti-PSMA nanobody: Construction and application in prostate cancer-targeted imaging. PLoS ONE 2015, 10, e0127419. [Google Scholar] [CrossRef] [PubMed]
- Wang, X.; Ma, D.; Olson, W.C.; Heston, W.D. In vitro and in vivo responses of advanced prostate tumors to PSMA ADC, an auristatin-conjugated antibody to prostate-specific membrane antigen. Mol. Cancer Ther. 2011, 10, 1728–1739. [Google Scholar] [CrossRef] [PubMed]
- Michalska, M.; Schultze-Seemann, S.; Bogatyreva, L.; Hauschke, D.; Wetterauer, U.; Wolf, P. In vitro and in vivo effects of a recombinant anti-PSMA immunotoxin in combination with docetaxel against prostate cancer. Oncotarget 2016, 7, 22531–22542. [Google Scholar] [CrossRef]
- Ghosh, A.; Wang, X.; Klein, E.; Heston, W.D. Novel role of prostate-specific membrane antigen in suppressing prostate cancer invasiveness. Cancer Res. 2005, 65, 727–731. [Google Scholar]
- Yao, V.; Berkman, C.E.; Choi, J.K.; O’Keefe, D.S.; Bacich, D.J. Expression of prostate-specific membrane antigen (PSMA), increases cell folate uptake and proliferation and suggests a novel role for PSMA in the uptake of the non-polyglutamated folate, folic acid. Prostate 2010, 70, 305–316. [Google Scholar] [CrossRef]
- Chang, S.S.; Reuter, V.E.; Heston, W.D.; Gaudin, P.B. Metastatic renal cell carcinoma neovasculature expresses prostate-specific membrane antigen. Urology 2001, 57, 801–805. [Google Scholar] [CrossRef]
- Rhee, H.; Ng, K.L.; Tse, B.W.-C.; Yeh, M.-C.; Russell, P.J.; Nelson, C.; Thomas, P.; Samaratunga, H.; Vela, I.; Gobe, G.; et al. Using prostate specific membrane antigen (PSMA) expression in clear cell renal cell carcinoma for imaging advanced disease. Pathology 2016, 48, 613–616. [Google Scholar] [CrossRef]
- Baccala, A.; Sercia, L.; Li, J.; Heston, W.; Zhou, M. Expression of prostate-specific membrane antigen in tumor-associated neovasculature of renal neoplasms. Urology 2007, 70, 385–390. [Google Scholar] [CrossRef]
- Wernicke, A.G.; Kim, S.; Liu, H.; Bander, N.H.; Pirog, E.C. Prostate-specific membrane antigen (PSMA) expression in the neovasculature of gynecologic malignancies: Implications for PSMA-targeted therapy. Appl. Immunohistochem. Mol. Morphol. 2017, 25, 271–276. [Google Scholar] [CrossRef]
- Laidler, P.; Dulińska, J.; Lekka, M.; Lekki, J. Expression of prostate specific membrane antigen in androgen-independent prostate cancer cell line PC-3. Arch. Biochem. Biophys. 2005, 435, 1–14. [Google Scholar] [CrossRef] [PubMed]
- Joseph-Silverstein, J.; Consigli, S.A.; Lyser, K.M.; Ver Pault, C. Basic fibroblast growth factor in the chick embryo: Immunolocalization to striated muscle cells and their precursors. J. Cell Biol. 1989, 108, 2459–2466. [Google Scholar] [CrossRef] [PubMed]
- Danesi, R.; Del Bianchi, S.; Soldani, P.; Campagni, A.; La Rocca, R.V.; Myers, C.E.; Paparelli, A.; Del Tacca, M. Suramin inhibits bFGF-induced endothelial cell proliferation and angiogenesis in the chick chorioallantoic membrane. Br. J. Cancer 1993, 68, 932–938. [Google Scholar] [CrossRef] [PubMed]
- Funakoshi, Y.; Matsuda, S.; Uryu, K.; Fujita, H.; Okumura, N.; Sakanaka, M. An immunohistochemical study of basic fibroblast growth factor in the developing chick. Anat. Embryol. (Berl.) 1993, 187, 415–423. [Google Scholar] [CrossRef]
- Flamme, I.; Schulze-Osthoff, K.; Jacob, H.J. Mitogenic activity of chicken chorioallantoic fluid is temporally correlated to vascular growth in the chorioallantoic membrane and related to fibroblast growth factors. Development 1991, 111, 683–690. [Google Scholar]
- Weiss, P.; Matoltsy, A.G. Absence of wound healing in young chick embryos. Nature 1957, 180, 854. [Google Scholar] [CrossRef]
- Weiss, P.; Matoltsy, A.G. Wound healing in chick embryos in vivo and in vitro. Dev. Biol. 1959, 1, 302–326. [Google Scholar] [CrossRef]
- van Golde, J.M.; Mulder, T.A.; Scheve, E.; Prinzen, F.W.; Blanco, C.E. Hyperoxia and local organ blood flow in the developing chick embryo. J. Physiol. 1999, 515 Pt 1, 243–248. [Google Scholar] [CrossRef]
- DeBord, L.C.; Pathak, R.R.; Villaneuva, M.; Liu, H.-C.; Harrington, D.A.; Yu, W.; Lewis, M.T.; Sikora, A.G. The chick chorioallantoic membrane (CAM) as a versatile patient-derived xenograft (PDX) platform for precision medicine and preclinical research. Am. J. Cancer Res. 2018, 8, 1642–1660. [Google Scholar]
- Armstrong, P.B.; Quigley, J.P.; Sidebottom, E. Transepithelial invasion and intramesenchymal infiltration of the chick embryo chorioallantois by tumor cell lines. Cancer Res. 1982, 42, 1826–1837. [Google Scholar]
- Klingenberg, M.; Becker, J.; Eberth, S.; Kube, D.; Wilting, J. The chick chorioallantoic membrane as an in vivo xenograft model for Burkitt lymphoma. BMC Cancer 2014, 14, 339. [Google Scholar] [CrossRef] [PubMed]
- Chen, Y.; Foss, C.A.; Byun, Y.; Nimmagadda, S.; Pullambhatla, M.; Fox, J.J.; Castanares, M.; Lupold, S.E.; Babich, J.W.; Mease, R.C.; et al. Radiohalogenated prostate-specific membrane antigen (PSMA)-based ureas as imaging agents for prostate cancer. J. Med. Chem. 2008, 51, 7933–7943. [Google Scholar] [CrossRef]
- Chen, Y.; Pullambhatla, M.; Foss, C.A.; Byun, Y.; Nimmagadda, S.; Senthamizhchelvan, S.; Sgouros, G.; Mease, R.C.; Pomper, M.G. 2-(3-{1-carboxy-5-[(6-[18F]fluoro-pyridine-3-carbonyl)-amino]-pentyl}-ureido)-pen tanedioic acid, [18F]DCFPyL, a PSMA-based PET imaging agent for prostate cancer. Clin. Cancer Res. 2011, 17, 7645–7653. [Google Scholar] [CrossRef] [PubMed]
- Soret, M.; Bacharach, S.L.; Buvat, I. Partial-volume effect in PET tumor imaging. J. Nucl. Med. 2007, 48, 932–945. [Google Scholar] [CrossRef] [PubMed]
- Kim, J.S.; Lee, J.S.; Im, K.C.; Kim, S.J.; Kim, S.-Y.; Lee, D.S.; Moon, D.H. Performance measurement of the microPET Focus 120 scanner. J. Nucl. Med. 2007, 48, 1527–1535. [Google Scholar] [CrossRef] [PubMed]
- Kramer, L.; Winter, G.; Baur, B.; Kuntz, A.J.; Kull, T.; Solbach, C.; Beer, A.J.; Linden, M. Quantitative and correlative biodistribution analysis of 89Zr-labeled mesoporous silica nanoparticles intravenously injected into tumor-bearing mice. Nanoscale 2017, 9, 9743–9753. [Google Scholar] [CrossRef] [PubMed]
- Sharrow, A.C.; Ishihara, M.; Hu, J.; Kim, I.H.; Wu, L. Using the chicken chorioallantoic membrane in vivo model to study gynecological and urological cancers. JoVE 2020, e60651. [Google Scholar] [CrossRef]
- Jefferies, B.; Lenze, F.; Sathe, A.; Truong, N.; Anton, M.; von Eisenhart-Rothe, R.; Nawroth, R.; Mayer-Kuckuk, P. Non-invasive imaging of engineered human tumors in the living chicken embryo. Sci. Rep. 2017, 7, 4991. [Google Scholar] [CrossRef]
- Kunzi-Rapp, K.; Genze, F.; Kufer, R.; Reich, E.; Hautmann, R.E.; Gschwend, J.E. Chorioallantoic membrane assay: Vascularized 3-dimensional cell culture system for human prostate cancer cells as an animal substitute model. J. Urol. 2001, 166, 1502–1507. [Google Scholar] [CrossRef]
- Ribatti, D. The chick embryo chorioallantoic membrane as a model for tumor biology. Exp. Cell Res. 2014, 328, 314–324. [Google Scholar] [CrossRef]
- Fedorov, A.; Beichel, R.; Kalpathy-Cramer, J.; Finet, J.; Fillion-Robin, J.C.; Pujol, S.; Bauer, C.; Jennings, D.; Fennessy, F.; Sonka, M.; et al. 3D slicer as an image computing platform for the quantitative imaging network. Magn. Reson. Imaging 2012, 30, 1323–1341. [Google Scholar] [CrossRef] [PubMed]
- Vollmar, S.; Hampl, J.A.; Kracht, L.; Herholz, K. Integration of Functional Data (PET) into Brain Surgery Planning and Neuronavigation; Springer: Berlin/Heidelberg, Germany, 2007; pp. 98–103. [Google Scholar]


| Tumor Entities | Activity Ratio (PSMA+/PSMA−) [Median] | Activity Concentration Ratio (PSMA+/PSMA−) [Median] | Activity Concentration Ratio (Tumor/Total) [Median] | p Value (Two Tailed) |
|---|---|---|---|---|
| LNCaP C4-2 | 3.0 | 2.5 | 4.8 | <0.0001 (****) |
| PC-3 | 1.5 | |||
| LNCaP | 5.0 | 5.0 | 4.6 | 0.250 (ns) |
| PC-3 | 0.9 | |||
| LNCaP C4-2 | 4.1 | 3.9 | 5.8 | 0.0625 (ns) |
| CAM | 1.5 |
| Ligand | Tumor Accumulation [%IA/g] | Activity Concentration Ratio (PSMA+/PSMA−) | Incubation Time [h] | Ref. | ||
|---|---|---|---|---|---|---|
| LNCaP | LNCaP C4-2 | PC-3 | ||||
| 68Ga-PSMA-11 | - | 9.27 ± 5.61 | 4.02 ± 3.78 | 2.3; (4.0) † | 1 | HET-CAM § |
| 68Ga-PSMA-11 | 6.95 ± 1.31 | - | 1.45 ± 0.41 | 4.8; (4.9) † | 1 | HET-CAM § |
| 68Ga-PSMA-11 | 7.70 ± 1.45 | - | 1.30 ± 0.12 | 5.9 | 1 | [41] |
| 68Ga-PSMA-11 | 4.89 ± 1.34 | - | 1.30 ± 0.12 | 3.8 | 1 | [42] |
| 68Ga-PSMA-11 | 7.28 ± 0.82 | - | 1.21 ± 0.07 | 6.0 | 1 | [53] |
| 68Ga-PSMA-11 | 5.89 ± 2.82 | - | - | - | 1 | [54] |
| 68Ga-PSMA-11 | 12.75 ± 2.49 | - | - | - | 1 | [55] |
| 68Ga-PSMA-11 | 8.91 ± 0.86 | - | - | - | 1 | [56] |
| 68Ga-PSMA-11 | 8.42 ± 1.40 | - | - | - | 1 | [57] |
| 68Ga-PSMA-11 | 7.19 ± 0.86 | - | - | - | 1 | [57] |
| 68Ga-PSMA-11 | 8.20 ± 2.44 | - | - | - | 1 | [57] |
| 68Ga-PSMA-11 | 8.67 ± 1.97 | - | - | - | 1 | [57] |
| 68Ga-PSMA-11-Dimer | 8.22 ± 1.78 | - | 0.93 ± 0.53 | 8.8 | 1 | [42] |
| 18F-PSMA-11 | 55.7 ± 11.8 | - | 3.1 ± 0.9 | 18.0 | 6 | [58] |
| 18F-PSMA-1007 | 8.04 ± 2.39 | - | 1.05 ± 0.11 | 7.7 | 1 | [59] |
| [11C]DCMC | 8.73 ± 0.73 | - | 1.65 ± 0.29 | 5.3 | 0.5 | [60] |
| [11C]DCIT | 5.07 ± 1.02 | - | 1.78 ± 0.63 | 2.8 | 0.5 | [60] |
| 68Ga-HE0 | 2.38 ± 0.05 | - | 0.84 ± 0.18 | 2.8 | 1 | [54] |
| 68Ga-HE1 | 2.41 ± 1.24 | - | 2.67 ± 1.25 | 0.9 | 1 | [54] |
| 68Ga-HE2 | 10.66 ± 4.19 | - | 1.99 ± 0.40 | 2.5 | 1 | [54] |
| 68Ga-HE3 | 3.22 ± 0.22 | - | 1.66 ± 0.41 | 1.9 | 1 | [54] |
| 203Pb-PSMA-CA012 | - | 8.4 ± 3.7 | - | - | 1 | [61] |
| DUPA-99mTc | 11.2 | - | - | - | 4 | [62] |
| 68Ga-CHX-A″-DTPA conjugate | ~3 * | - | - | - | 1 | [63] |
| 68Ga-CHX-A″-DOTA conjugate | ~7 * | - | - | - | 1 | [63] |
| 68Ga-PSMA-617 | 8.47 ± 4.09 | - | - | - | 1 | [64] |
| 177Lu-PSMA-617 | 11.20 ± 4.17 | - | - | - | 1 | [64] |
| 64Cu-PSMA-617 | - | - | 3.47 ± 0.48 | - | 24 | [65] |
© 2020 by the authors. Licensee MDPI, Basel, Switzerland. This article is an open access article distributed under the terms and conditions of the Creative Commons Attribution (CC BY) license (http://creativecommons.org/licenses/by/4.0/).
Share and Cite
Winter, G.; Koch, A.B.F.; Löffler, J.; Lindén, M.; Solbach, C.; Abaei, A.; Li, H.; Glatting, G.; Beer, A.J.; Rasche, V. Multi-Modal PET and MR Imaging in the Hen’s Egg Test-Chorioallantoic Membrane (HET-CAM) Model for Initial In Vivo Testing of Target-Specific Radioligands. Cancers 2020, 12, 1248. https://doi.org/10.3390/cancers12051248
Winter G, Koch ABF, Löffler J, Lindén M, Solbach C, Abaei A, Li H, Glatting G, Beer AJ, Rasche V. Multi-Modal PET and MR Imaging in the Hen’s Egg Test-Chorioallantoic Membrane (HET-CAM) Model for Initial In Vivo Testing of Target-Specific Radioligands. Cancers. 2020; 12(5):1248. https://doi.org/10.3390/cancers12051248
Chicago/Turabian StyleWinter, Gordon, Andrea B. F. Koch, Jessica Löffler, Mika Lindén, Christoph Solbach, Alireza Abaei, Hao Li, Gerhard Glatting, Ambros J. Beer, and Volker Rasche. 2020. "Multi-Modal PET and MR Imaging in the Hen’s Egg Test-Chorioallantoic Membrane (HET-CAM) Model for Initial In Vivo Testing of Target-Specific Radioligands" Cancers 12, no. 5: 1248. https://doi.org/10.3390/cancers12051248
APA StyleWinter, G., Koch, A. B. F., Löffler, J., Lindén, M., Solbach, C., Abaei, A., Li, H., Glatting, G., Beer, A. J., & Rasche, V. (2020). Multi-Modal PET and MR Imaging in the Hen’s Egg Test-Chorioallantoic Membrane (HET-CAM) Model for Initial In Vivo Testing of Target-Specific Radioligands. Cancers, 12(5), 1248. https://doi.org/10.3390/cancers12051248