Targeting Nuclear NAD+ Synthesis Inhibits DNA Repair, Impairs Metabolic Adaptation and Increases Chemosensitivity of U-2OS Osteosarcoma Cells


 ,
, 
 and
and 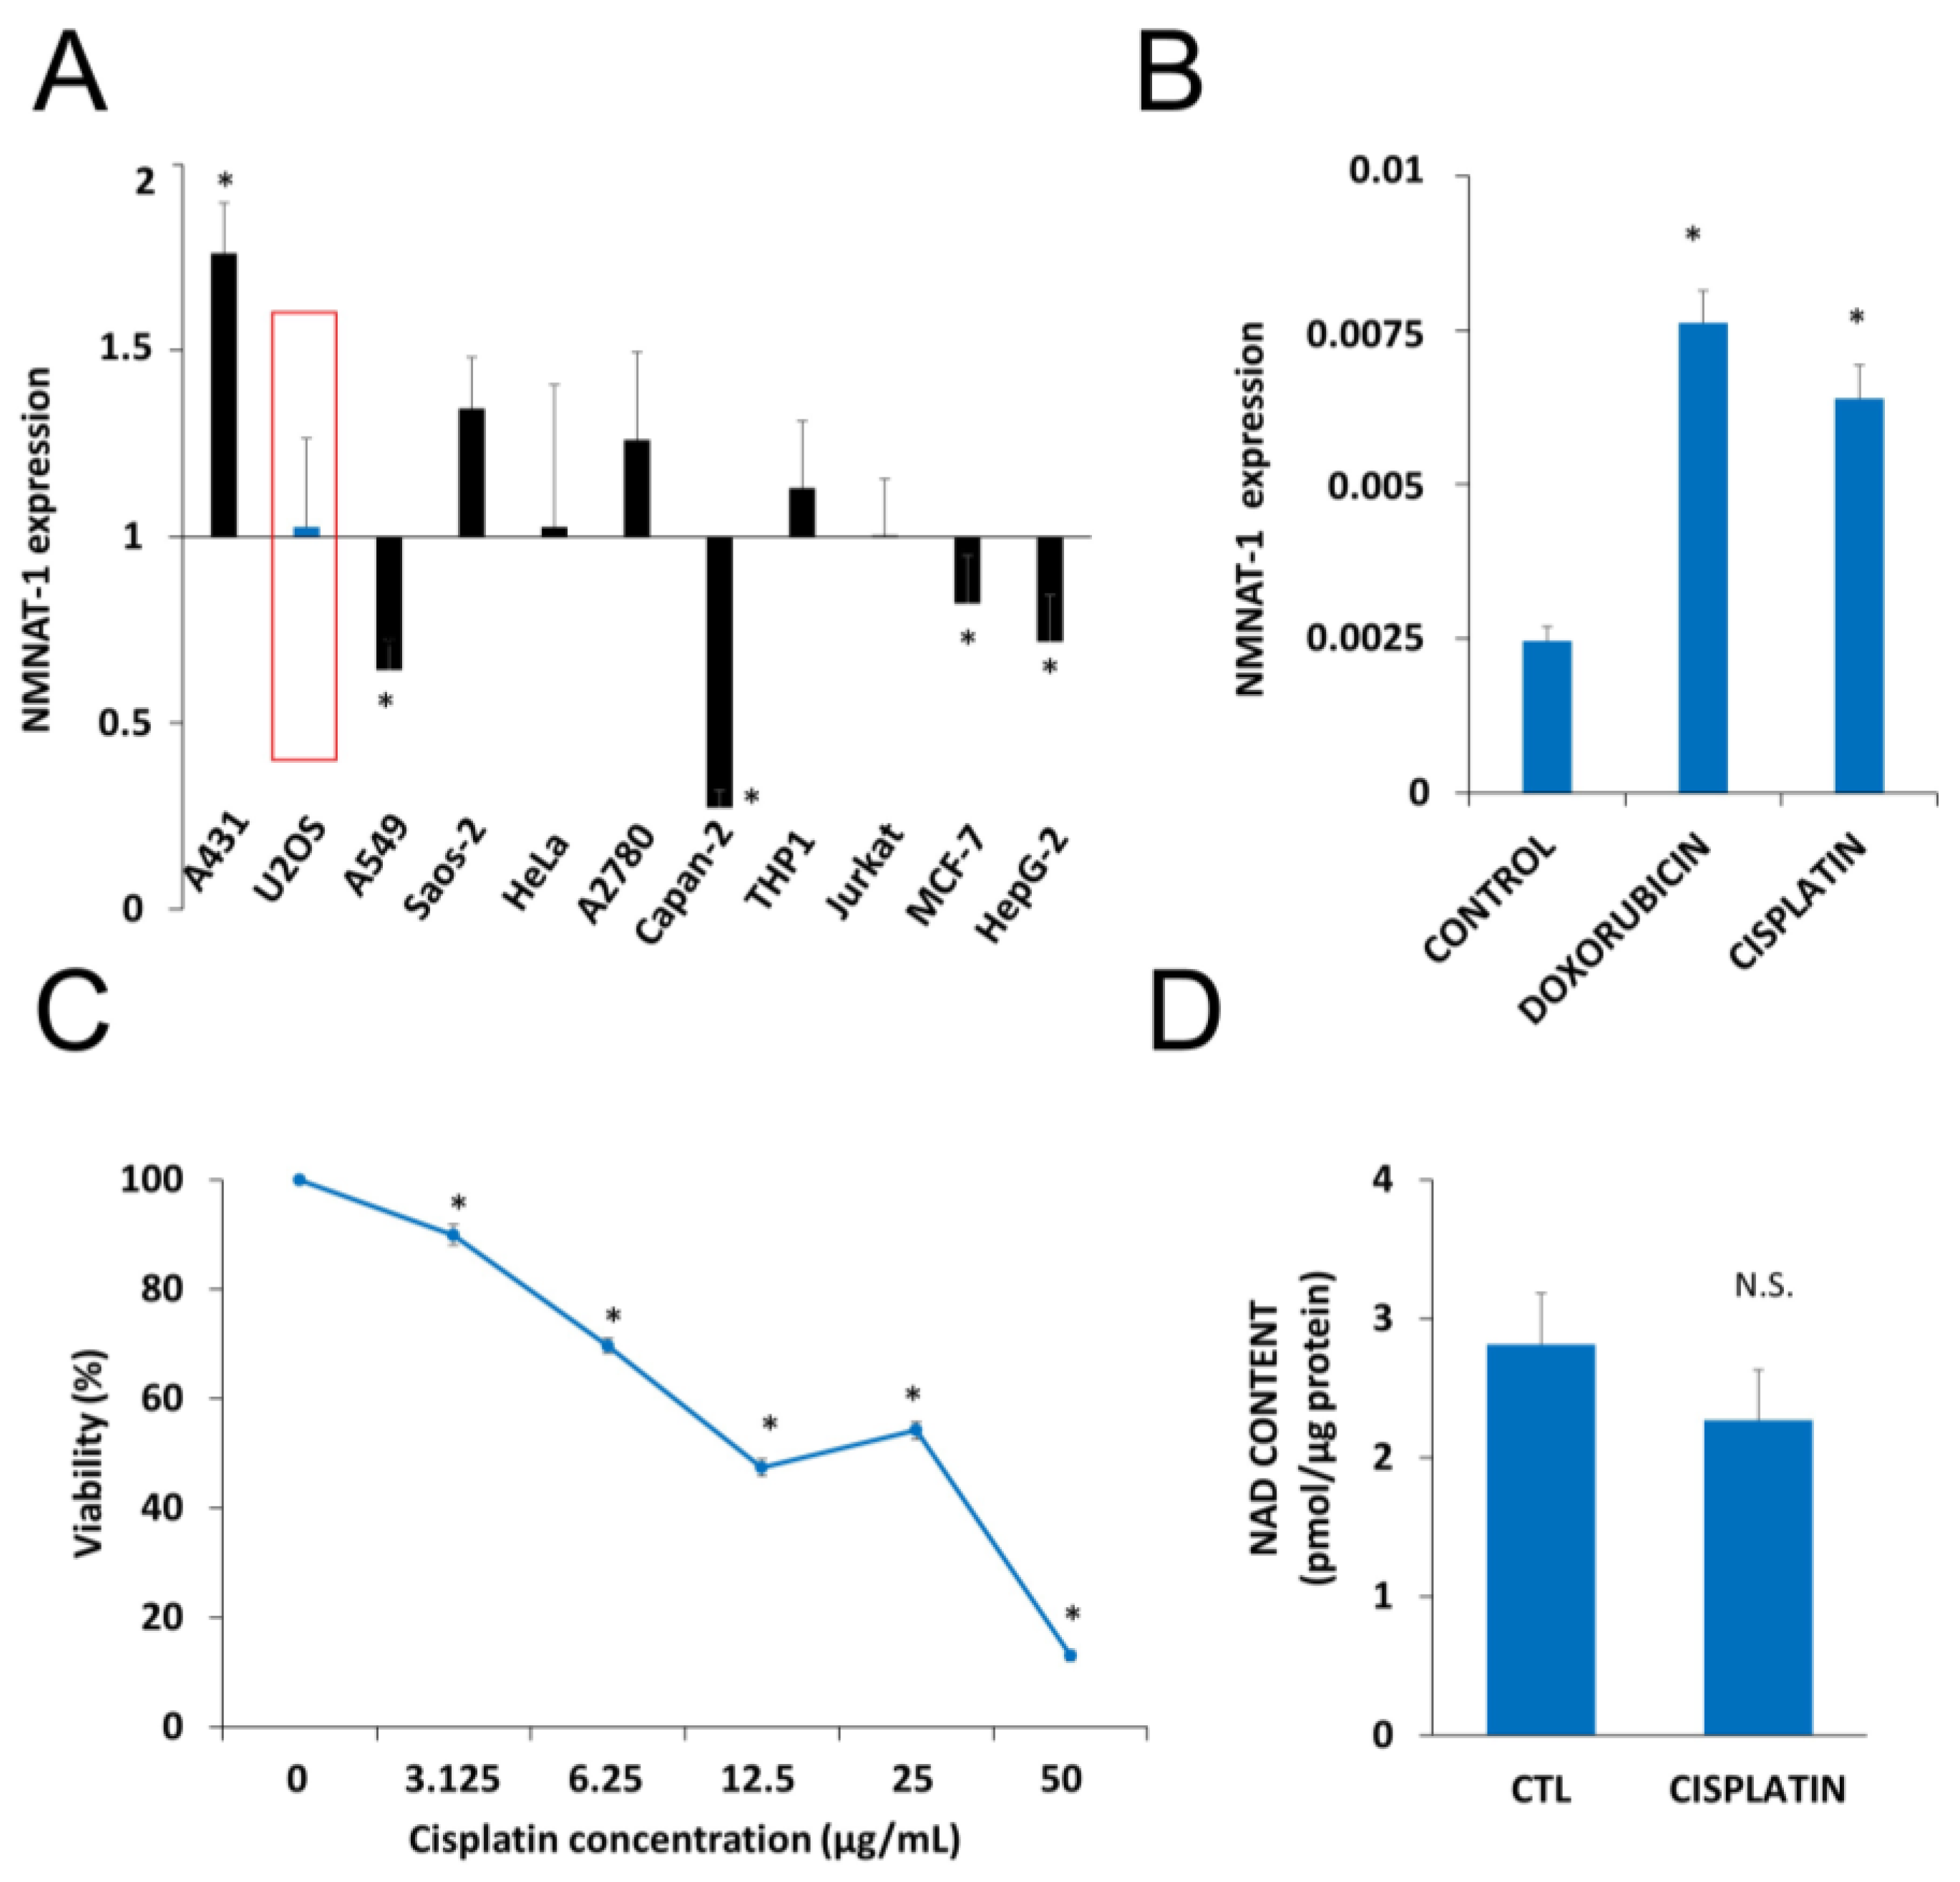
Abstract
:1. Introduction
2. Results
2.1. DNA Damaging Drugs Induce NMNAT1 Expression in Tumor Cell Lines
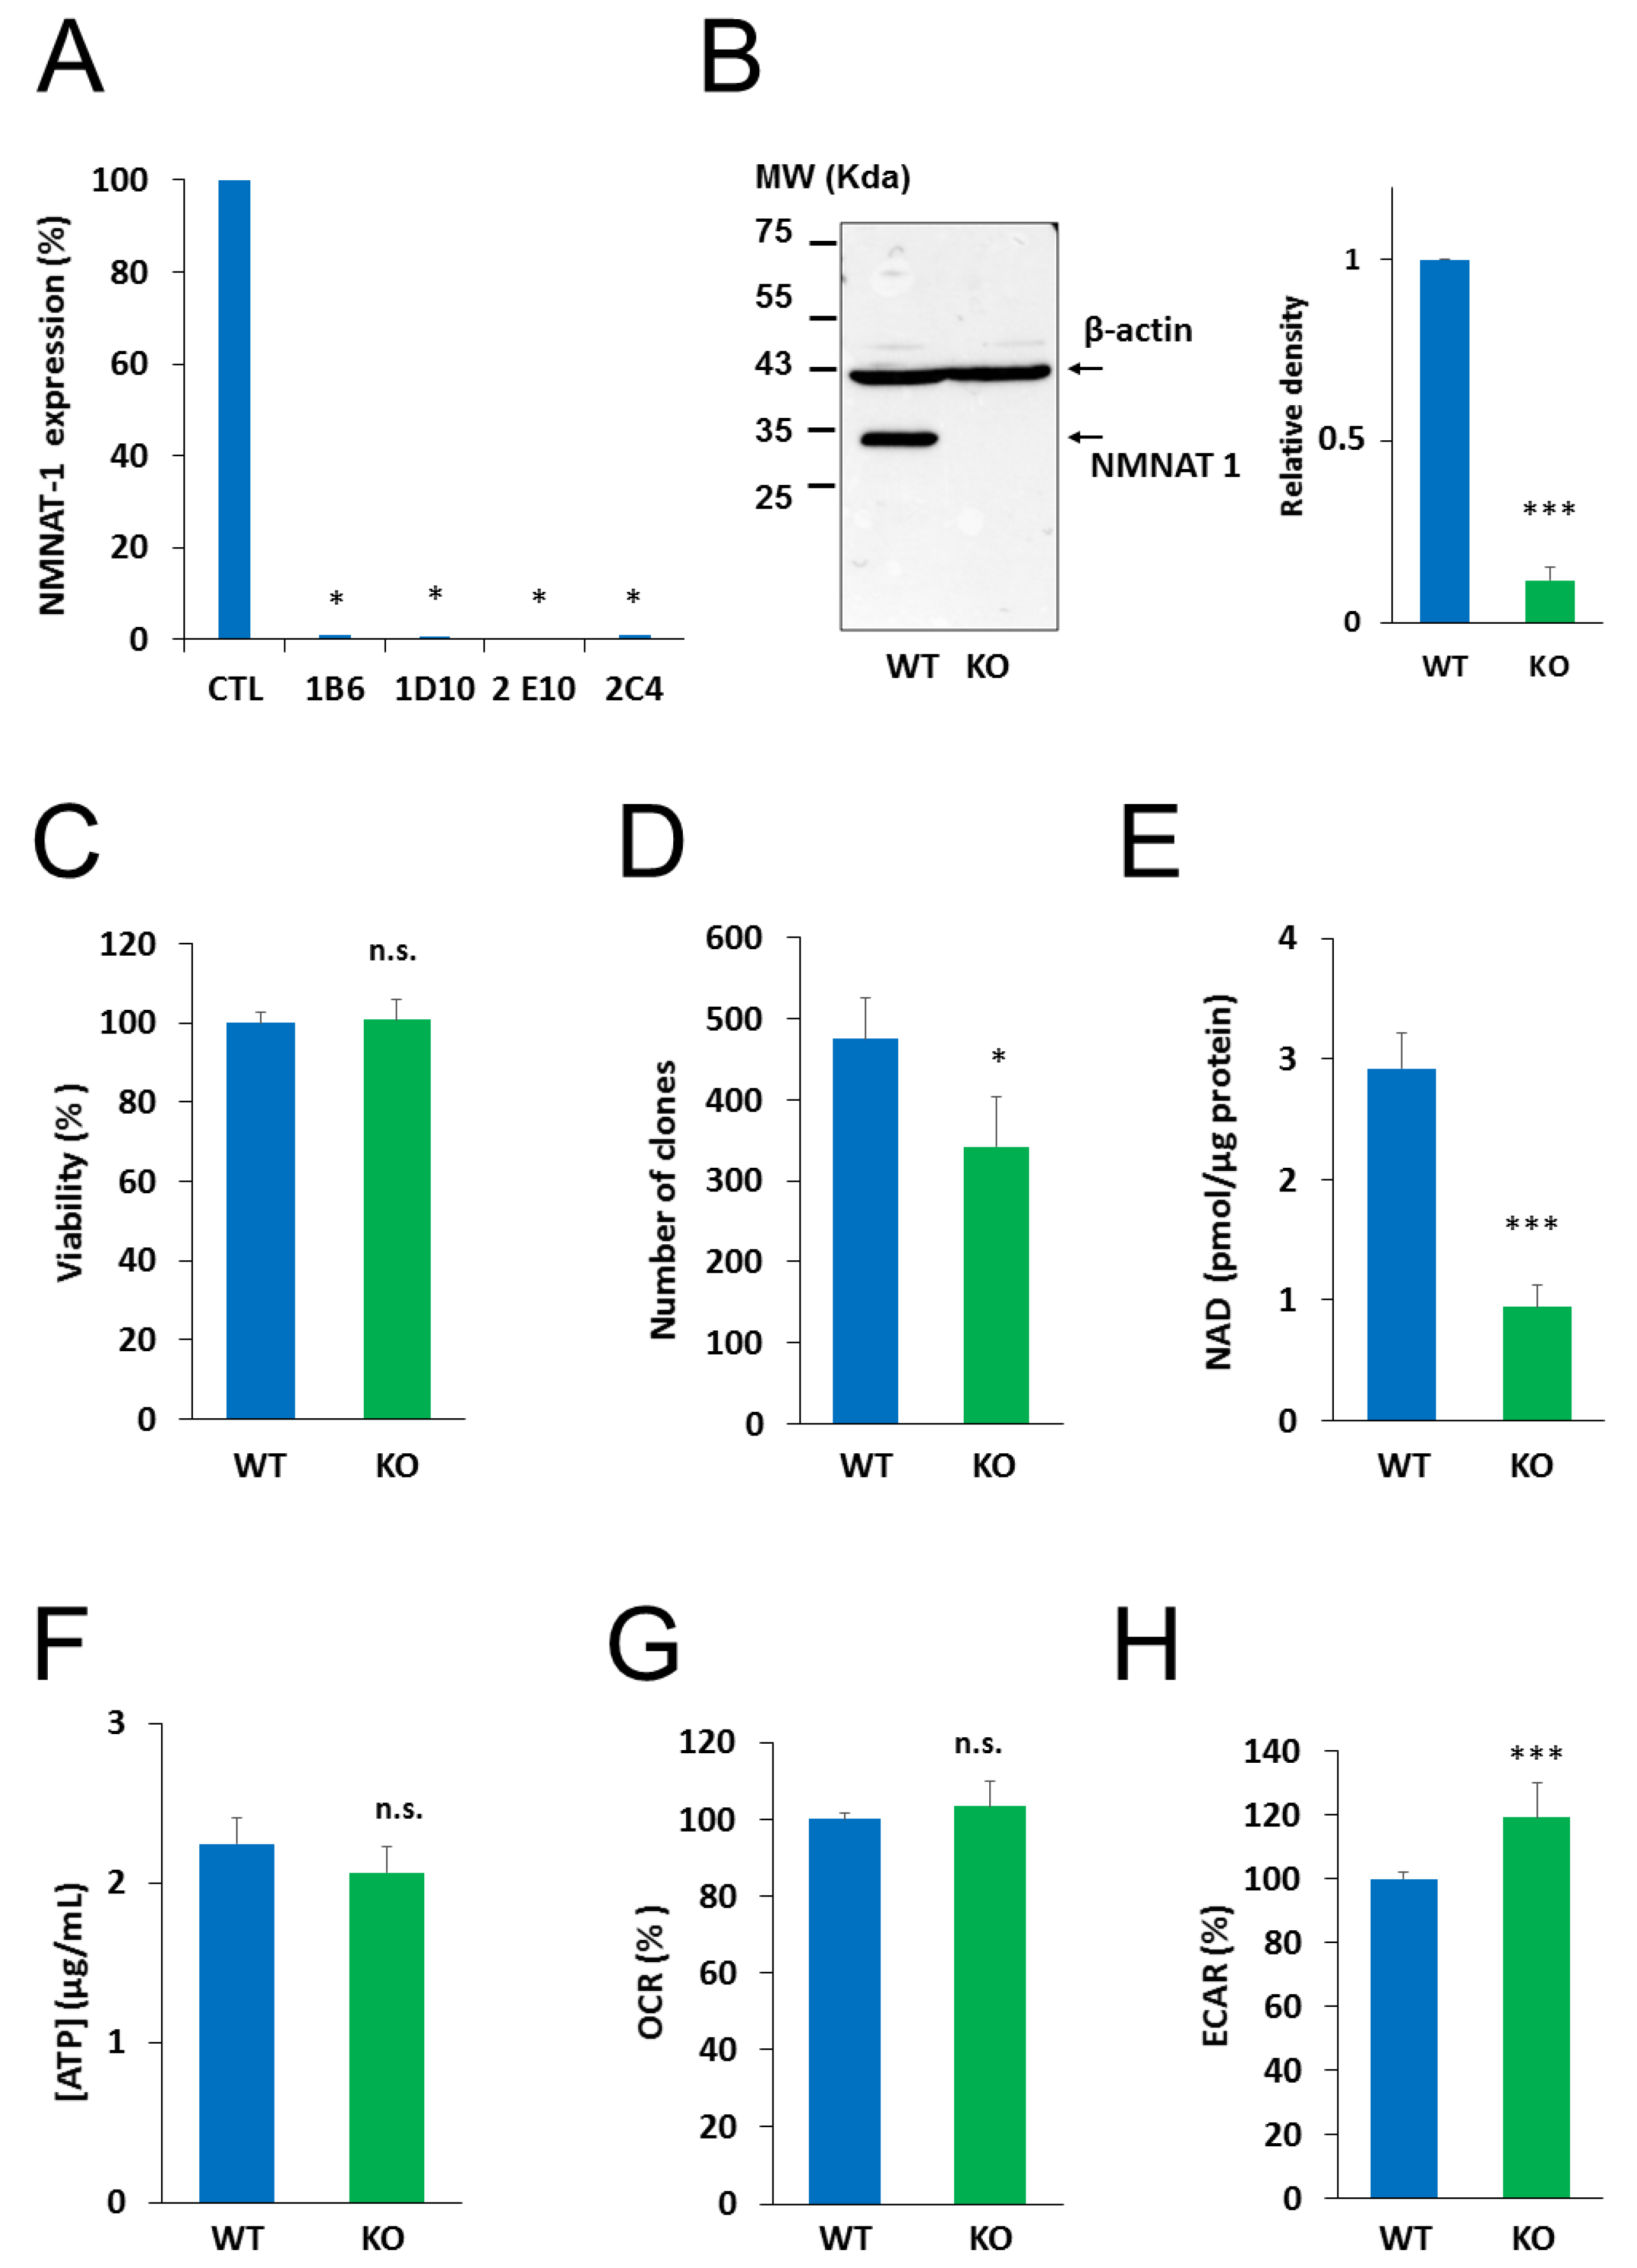
2.2. Generation and Characterization of an NMNAT1−/− Cell Line
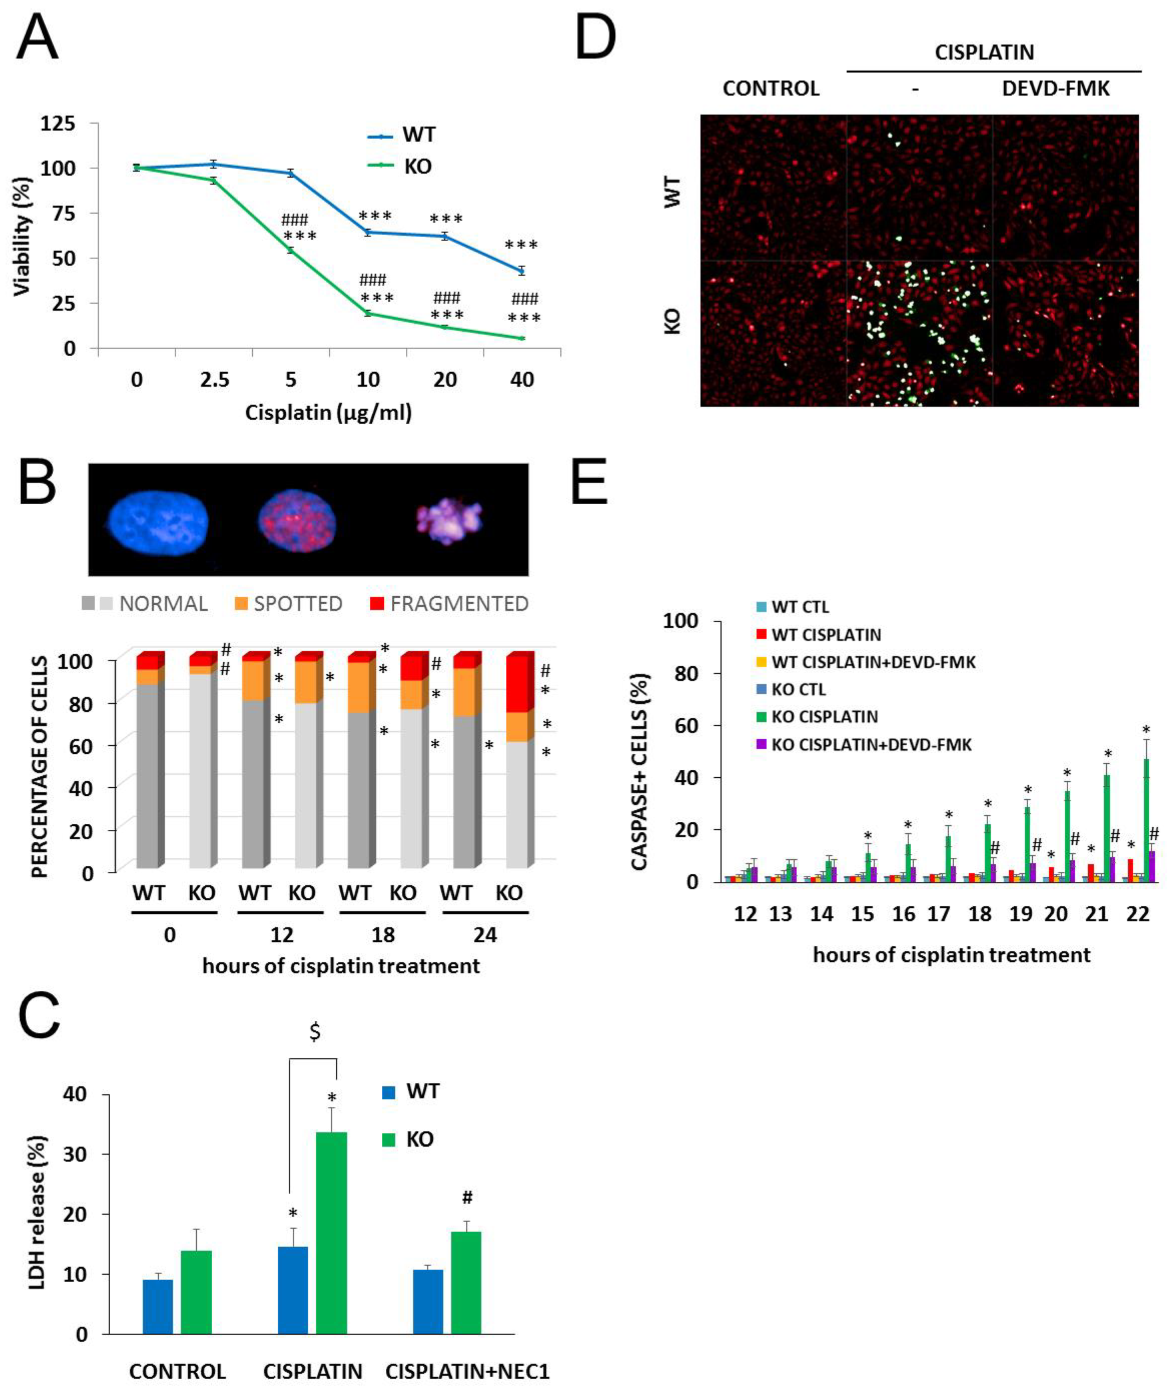
2.3. NMNAT-1 Inactivation Increases Chemosensitivity of the U-2OS Osteosarcoma Cells
2.4. The Role of PARylation in the Increased Cisplatin Sensitivity of NMNAT1−/− K.O. Cells
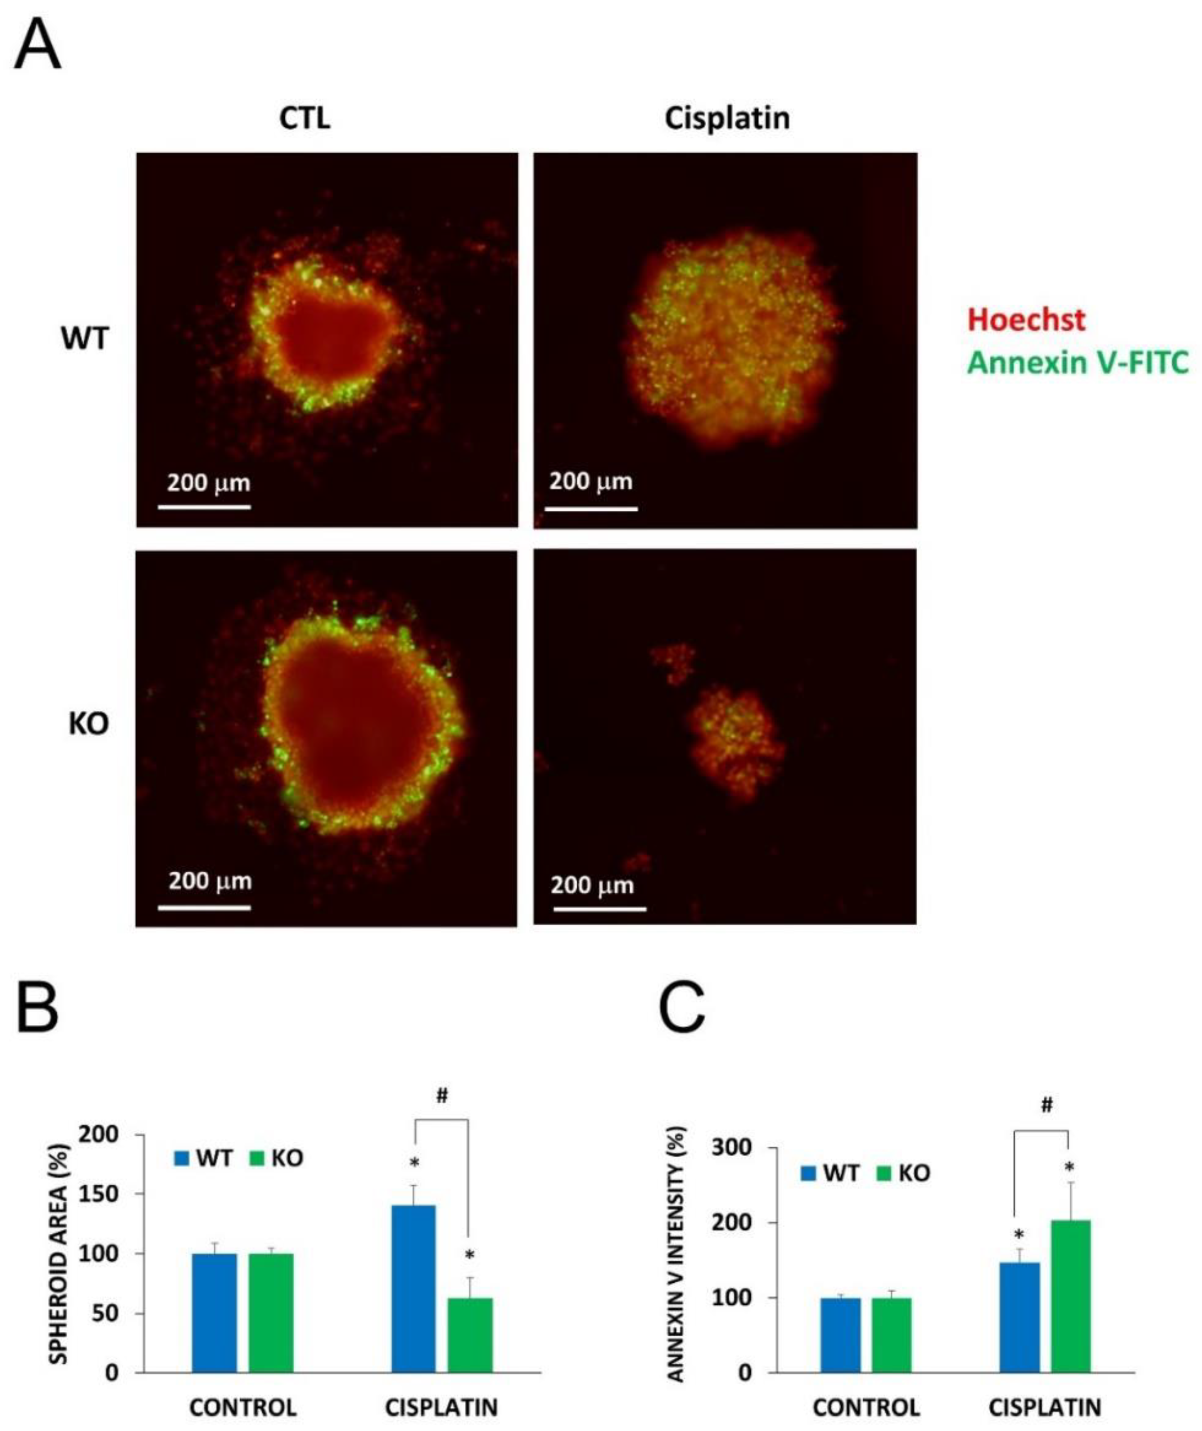
2.5. Chemosensitization in 3D Cultures and in Combination Treatment
3. Discussion
4. Materials and Methods
4.1. D Cell Culture
4.2. D Cell Culture (Spheroids)
4.3. Generation of NMNAT1−/− Cells by Crispr-cas9
4.4. Western Blot
4.5. High Content Analysis (HCA)
4.5.1. HCA on Fixed Cells: Quantification of γH2AX
4.5.2. HCA on Live Cells: Caspase Activation
4.5.3. HCA on Live Cells: Cell Death in Spheroids
4.5.4. HCA on Live Cells: Cell Morphology
4.6. Calcein-AM Viability Assay
4.7. Clonogenic Survival Assay
4.8. Lactate Dehydrogenase (LDH) Release Assay
4.9. Measurement of Total Cellular NAD+ and ATP
4.10. Metabolic Analysis with Seahorse Metabolic Analyzer
4.11. Sulforhodamine B (SRB) Assay
4.12. RNA Extraction and Quantitative PCR
4.13. Statistical Analysis
5. Conclusions
Supplementary Materials
Author Contributions
Funding
Acknowledgments
Conflicts of Interest
References
- Steliarova-Foucher, E.; Colombet, M.; Ries, L.A.G.; Moreno, F.; Dolya, A.; Bray, F.; Hesseling, P.; Shin, H.Y.; A Stiller, C.; Bouzbid, S.; et al. International incidence of childhood cancer, 2001–10: A population-based registry study. Lancet Oncol. 2017, 18, 719–731. [Google Scholar] [CrossRef]
- Mendoza, P.R.; Grossniklaus, H.E. The Biology of Retinoblastoma. Prog. Mol. Biol. Transl. Sci. 2015, 134, 503–516. [Google Scholar] [CrossRef]
- Santibáñez-Koref, M.; Birch, J.; Hartley, A.; Crowther, D.; Harris, M.; Jones, P.M.; Kelsey, A.; Craft, A.; Eden, T. p53 germline mutations in Li-Fraumeni syndrome. Lancet 1991, 338, 1490–1491. [Google Scholar] [CrossRef]
- Lu, L.; Jin, W.; Liu, H.; Wang, L.L. RECQ DNA Helicases and Osteosarcoma. Adv. Exp. Med. Biol. 2014, 804, 129–145. [Google Scholar] [CrossRef] [PubMed]
- Buondonno, I.; Gazzano, E.; Tavanti, E.; Chegaev, K.; Kopecka, J.; Fanelli, M.; Rolando, B.; Fruttero, R.; Gasco, A.; Hattinger, C.M.; et al. Endoplasmic reticulum-targeting doxorubicin: A new tool effective against doxorubicin-resistant osteosarcoma. Cell. Mol. Life Sci. 2018, 76, 609–625. [Google Scholar] [CrossRef] [PubMed]
- Jimmy, R.; Stern, C.; Lisy, K.; White, S. Effectiveness of mifamurtide in addition to standard chemotherapy for high-grade osteosarcoma. JBI Database Syst. Rev. Implement. Rep. 2017, 15, 2113–2152. [Google Scholar] [CrossRef]
- Osteosarcoma—Childhood and Adolescence: Statistics. 2020. Available online: https://www.cancer.net/cancer-types/osteosarcoma-childhood-and-adolescence/statistics (accessed on 30 January 2020).
- Pavlova, N.; Thompson, C.B. The Emerging Hallmarks of Cancer Metabolism. Cell Metab. 2016, 23, 27–47. [Google Scholar] [CrossRef] [Green Version]
- Kim, M.Y.; Zhang, T.; Kraus, W.L. Poly(ADP-ribosyl)ation by PARP-1: ‘PAR-laying’ NAD+ into a nuclear signal. Genes Dev. 2005, 19, 1951–1967. [Google Scholar] [CrossRef] [Green Version]
- Lee, H.C.; Aarhus, R. A Derivative of NADP Mobilizes Calcium Stores Insensitive to Inositol Trisphosphate and Cyclic ADP-ribose. J. Boil. Chem. 1995, 270, 2152–2157. [Google Scholar] [CrossRef] [Green Version]
- Chini, E.; Dousa, T. Enzymatic-Synthesis and Degradation of Nicotinate Adenine Dinucleotide Phosphate (NAADP), a Ca2+-Releasing Agonist, in Rat Tissues. Biochem. Biophys. Res. Commun. 1995, 209, 167–174. [Google Scholar] [CrossRef]
- Cantó, C.; Sauve, A.A.; Bai, P. Crosstalk between poly(ADP-ribose) polymerase and sirtuin enzymes. Mol. Asp. Med. 2013, 34, 1168–1201. [Google Scholar] [CrossRef] [PubMed] [Green Version]
- Eisemann, T.; Pascal, J.M. Poly(ADP-ribose) polymerase enzymes and the maintenance of genome integrity. Cell. Mol. Life Sci. 2019, 77, 19–33. [Google Scholar] [CrossRef] [PubMed]
- Virág, L. 50Years of poly(ADP-ribosyl)ation. Mol. Asp. Med. 2013, 34, 1043–1045. [Google Scholar] [CrossRef] [PubMed]
- Hegedűs, C.; Virág, L. Inputs and outputs of poly(ADP-ribosyl)ation: Relevance to oxidative stress. Redox Boil. 2014, 2, 978–982. [Google Scholar] [CrossRef] [Green Version]
- Hottiger, M.O.; O Hassa, P.; Lüscher, B.; Schüler, H.; Koch-Nolte, F. Toward a unified nomenclature for mammalian ADP-ribosyltransferases. Trends Biochem. Sci. 2010, 35, 208–219. [Google Scholar] [CrossRef]
- Wang, L.; Liang, C.; Li, F.; Guan, D.; Wu, X.; Fu, X.; Lu, A.; Zhang, G. PARP1 in Carcinomas and PARP1 Inhibitors as Antineoplastic Drugs. Int. J. Mol. Sci. 2017, 18, 2111. [Google Scholar] [CrossRef]
- Bürkle, A.; Virág, L. Poly(ADP-ribose): PARadigms and PARadoxes. Mol. Asp. Med. 2013, 34, 1046–1065. [Google Scholar] [CrossRef] [Green Version]
- Bryant, H.E.; Schultz, N.; Thomas, H.D.; Parker, K.M.; Flower, D.; Lopez, E.; Kyle, S.; Meuth, M.; Curtin, N.J.; Helleday, T. Specific killing of BRCA2-deficient tumours with inhibitors of poly(ADP-ribose) polymerase. Nature 2005, 434, 913–917. [Google Scholar] [CrossRef]
- Farmer, H.; McCabe, N.; Lord, C.J.; Tutt, A.N.J.; Johnson, D.A.; Richardson, T.B.; Santarosa, M.; Dillon, K.J.; Hickson, I.; Knights, C.; et al. Targeting the DNA repair defect in BRCA mutant cells as a therapeutic strategy. Nature 2005, 434, 917–921. [Google Scholar] [CrossRef]
- Calabrese, C.R.; Almassy, R.; Barton, S.; Batey, M.A.; Calvert, A.H.; Canan-Koch, S.; Durkacz, B.W.; Hostomsky, Z.; Kumpf, R.A.; Kyle, S.; et al. Anticancer chemosensitization and radiosensitization by the novel poly(ADP-ribose) polymerase-1 inhibitor AG14361. J. Natl. Cancer Inst. 2004, 96, 56–67. [Google Scholar] [CrossRef]
- Plummer, R.; Lorigan, P.C.; Steven, N.; Scott, L.; Middleton, M.R.; Wilson, R.H.; Mulligan, E.; Curtin, N.J.; Wang, D.; Dewji, R.; et al. A phase II study of the potent PARP inhibitor, Rucaparib (PF-01367338, AG014699), with temozolomide in patients with metastatic melanoma demonstrating evidence of chemopotentiation. Cancer Chemother. Pharmacol. 2013, 71, 1191–1199. [Google Scholar] [CrossRef] [PubMed]
- Curtin, N.J.; Szabo, C. Therapeutic applications of PARP inhibitors: Anticancer therapy and beyond. Mol. Asp. Med. 2013, 34, 1217–1256. [Google Scholar] [CrossRef] [PubMed] [Green Version]
- Gossmann, T.I.; Ziegler, M. Sequence divergence and diversity suggests ongoing functional diversification of vertebrate NAD metabolism. DNA Repair 2014, 23, 39–48. [Google Scholar] [CrossRef] [PubMed] [Green Version]
- Chiarugi, A.; Dölle, C.; Felici, R.; Ziegler, M. The NAD metabolome — a key determinant of cancer cell biology. Nat. Rev. Cancer 2012, 12, 741–752. [Google Scholar] [CrossRef] [PubMed]
- Bajrami, I.; Kigozi, A.; Van Weverwijk, A.; Brough, R.; Frankum, J.; Lord, C.J.; Ashworth, A. Synthetic lethality of PARP and NAMPT inhibition in triple-negative breast cancer cells. EMBO Mol. Med. 2012, 4, 1087–1096. [Google Scholar] [CrossRef]
- Berger, F.; Lau, C.; Dahlmann, M.; Ziegler, M. Subcellular Compartmentation and Differential Catalytic Properties of the Three Human Nicotinamide Mononucleotide Adenylyltransferase Isoforms. J. Boil. Chem. 2005, 280, 36334–36341. [Google Scholar] [CrossRef] [Green Version]
- Yamamoto, M.; Hikosaka, K.; Mahmood, A.; Tobe, K.; Shojaku, H.; Inohara, H.; Nakagawa, T. Nmnat3 Is Dispensable in Mitochondrial NAD Level Maintenance In Vivo. PLoS ONE 2016, 11, e0147037. [Google Scholar] [CrossRef] [Green Version]
- Michishita, E.; Park, J.Y.; Burneskis, J.M.; Barrett, J.C.; Horikawa, I. Evolutionarily Conserved and Nonconserved Cellular Localizations and Functions of Human SIRT Proteins. Mol. Boil. Cell 2005, 16, 4623–4635. [Google Scholar] [CrossRef] [Green Version]
- Barraud, M.; Garnier, J.; Loncle, C.; Gayet, O.; Lequeue, C.; Vasseur, S.; Bian, B.; Duconseil, P.; Gilabert, M.; Bigonnet, M.; et al. A pancreatic ductal adenocarcinoma subpopulation is sensitive to FK866, an inhibitor of NAMPT. Oncotarget 2016, 7, 53783–53796. [Google Scholar] [CrossRef]
- Haubrich, B.A.; Ramesha, C.; Swinney, D.C. Development of a Bioluminescent High-Throughput Screening Assay for Nicotinamide Mononucleotide Adenylyltransferase (NMNAT). SLAS Discov. Adv. Life Sci. R & D 2019, 25, 33–42. [Google Scholar] [CrossRef]
- Huang, X.; Okafuji, M.; Traganos, F.; Luther, E.; Holden, E.; Darzynkiewicz, Z. Assessment of histone H2AX phosphorylation induced by DNA topoisomerase I and II inhibitors topotecan and mitoxantrone and by the DNA cross-linking agent cisplatin. Cytom. Part A J. Int. Soc. Anal. Cytol. 2004, 58, 99–110. [Google Scholar] [CrossRef] [PubMed]
- Spincemaille, P.; Alborzinia, H.; Dekervel, J.; Windmolders, P.; Van Pelt, J.; Cassiman, D.; Cheneval, O.; Craik, D.J.; Schur, J.; Ott, I.; et al. The Plant Decapeptide OSIP108 Can Alleviate Mitochondrial Dysfunction Induced by Cisplatin in Human Cells. Molecules 2014, 19, 15088–15102. [Google Scholar] [CrossRef] [PubMed] [Green Version]
- Rytelewski, M.; Tong, J.G.; Buensuceso, A.; Leong, H.; Vareki, S.M.; Figueredo, R.; Di Cresce, C.; Wu, S.Y.; Herbrich, S.; Baggerly, K.A.; et al. BRCA2 inhibition enhances cisplatin-mediated alterations in tumor cell proliferation, metabolism, and metastasis. Mol. Oncol. 2014, 8, 1429–1440. [Google Scholar] [CrossRef] [PubMed]
- Gunn, A.R.; Banos-Pinero, B.; Paschke, P.; Sanchez-Pulido, L.; Ariza, A.; Day, J.; Emrich, M.; Leys, D.; Ponting, C.P.; Ahel, I.; et al. The role of ADP-ribosylation in regulating DNA interstrand crosslink repair. J. Cell Sci. 2016, 129, 3845–3858. [Google Scholar] [CrossRef] [PubMed] [Green Version]
- An, S.S.A.; Seo, O.W.; Lee, J.; Hulme, J.; Baek, N. Real-time monitoring of cisplatin cytotoxicity on three-dimensional spheroid tumor cells. Drug Des. Dev. Ther. 2016, 10, 2155–2165. [Google Scholar] [CrossRef] [Green Version]
- Xie, L.; Zhao, T.; Cai, J.; Su, Y.; Wang, Z.; Dong, W. Methotrexate induces DNA damage and inhibits homologous recombination repair in choriocarcinoma cells. Onco Targets Ther. 2016, 9, 7115–7122. [Google Scholar] [CrossRef] [Green Version]
- López-Camarillo, C.; Rincón, D.G.; Ruiz-García, E.; De La Vega, H.A.; Marchat, L.A. DNA Repair Proteins as Therapeutic Targets in Ovarian Cancer. Curr. Protein Pept. Sci. 2019, 20, 316–323. [Google Scholar] [CrossRef]
- Cole, J.; Guiot, M.-C.; Gravel, M.; Bernier, C.; Shore, G.C.; Roulston, A. Novel NAPRT specific antibody identifies small cell lung cancer and neuronal cancers as promising clinical indications for a NAMPT inhibitor/niacin co-administration strategy. Oncotarget 2017, 8, 77846–77859. [Google Scholar] [CrossRef] [Green Version]
- Ryu, K.W.; Nandu, T.; Kim, J.; Challa, S.; DeBerardinis, R.J.; Kraus, W.L. Metabolic regulation of transcription through compartmentalized NAD+biosynthesis. Science 2018, 360, eaan5780. [Google Scholar] [CrossRef] [Green Version]
- Cambronne, X.A.; Stewart, M.L.; Kim, N.; Jones-Brunette, A.M.; Morgan, R.K.; Farrens, D.L.; Cohen, M.S.; Goodman, R.H. Biosensor reveals multiple sources for mitochondrial NAD+. Science 2016, 352, 1474–1477. [Google Scholar] [CrossRef] [Green Version]
- Gong, Y.; Fan, Z.; Luo, G.; Yang, C.; Huang, Q.; Fan, K.; Cheng, H.; Jin, K.; Ni, Q.; Yu, X.-J.; et al. The role of necroptosis in cancer biology and therapy. Mol. Cancer 2019, 18, 100. [Google Scholar] [CrossRef] [PubMed] [Green Version]
- Nagy, A.; Lánczky, A.; Menyhart, O.; Győrffy, B. Validation of miRNA prognostic power in hepatocellular carcinoma using expression data of independent datasets. Sci. Rep. 2018, 8, 9227. [Google Scholar] [CrossRef] [PubMed]
- McQuade, R.; Stojanovska, V.; De Leiris, J.; Nurgali, K. PARP inhibition in platinum-based chemotherapy: Chemopotentiation and neuroprotection. Pharmacol. Res. 2018, 137, 104–113. [Google Scholar] [CrossRef] [PubMed]
- Zhang, T.; Berrocal, J.G.; Yao, J.; Dumond, M.E.; Krishnakumar, R.; Ruhl, D.D.; Ryu, K.W.; Gamble, M.J.; Kraus, W.L. Regulation of Poly(ADP-ribose) Polymerase-1-dependent Gene Expression through Promoter-directed Recruitment of a Nuclear NAD+ Synthase. J. Boil. Chem. 2012, 287, 12405–12416. [Google Scholar] [CrossRef] [PubMed] [Green Version]
- Berger, F.; Lau, C.; Ziegler, M. Regulation of poly(ADP-ribose) polymerase 1 activity by the phosphorylation state of the nuclear NAD biosynthetic enzyme NMN adenylyl transferase 1. Proc. Natl. Acad. Sci. USA 2007, 104, 3765–3770. [Google Scholar] [CrossRef] [PubMed] [Green Version]
- Park, H.J.; Bae, J.S.; Kim, K.M.; Moon, Y.J.; Park, S.-H.; Ha, S.H.; Hussein, U.K.; Zhang, Z.; Park, H.S.; Park, B.-H.; et al. The PARP inhibitor olaparib potentiates the effect of the DNA damaging agent doxorubicin in osteosarcoma. J. Exp. Clin. Cancer Res. 2018, 37, 107. [Google Scholar] [CrossRef]
- Li, S.; Cui, Z.; Meng, X. Knockdown of PARP-1 Inhibits Proliferation and ERK Signals, Increasing Drug Sensitivity in Osteosarcoma U2OS Cells. Oncol. Res. Featur. Preclin. Clin. Cancer Ther. 2016, 24, 279–286. [Google Scholar] [CrossRef]
- Engert, F.; Kovac, M.; Baumhoer, D.; Nathrath, M.; Fulda, S. Osteosarcoma cells with genetic signatures of BRCAness are susceptible to the PARP inhibitor talazoparib alone or in combination with chemotherapeutics. Oncotarget 2016, 8, 48794–48806. [Google Scholar] [CrossRef] [Green Version]
- Chen, K.; Zhu, C.; Cai, M.; Fu, N.; Cheng, B.; Cai, Z.; Li, G.; Liu, J. Integrative metabolome and transcriptome profiling reveals discordant glycolysis process between osteosarcoma and normal osteoblastic cells. J. Cancer Res. Clin. Oncol. 2014, 140, 1715–1721. [Google Scholar] [CrossRef]
- Zhang, H.; Guo, X.; Feng, X.; Wang, T.; Hu, Z.; Que, X.; Tian, Q.; Zhu, T.; Guo, G.; Huang, W.; et al. MiRNA-543 promotes osteosarcoma cell proliferation and glycolysis by partially suppressing PRMT9 and stabilizing HIF-1α protein. Oncotarget 2016, 8, 2342–2355. [Google Scholar] [CrossRef] [Green Version]
- Xiao, Q.; Wei, Z.; Li, Y.; Zhou, X.; Chen, J.; Wang, T.; Shao, G.; Zhang, M.; Zhang, Z. miR-186 functions as a tumor suppressor in osteosarcoma cells by suppressing the malignant phenotype and aerobic glycolysis. Oncol. Rep. 2018, 39, 2703–2710. [Google Scholar] [CrossRef] [PubMed] [Green Version]
- Song, Y.-D.; Li, D.-D.; Guan, Y.; Wang, Y.-L.; Zheng, J. miR-214 modulates cisplatin sensitivity of osteosarcoma cells through regulation of anaerobic glycolysis. Cell. Mol. Boil. 2017, 63, 75–79. [Google Scholar] [CrossRef] [PubMed]
- Han, X.; Yang, Y.; Sun, Y.; Qin, L.; Yang, Y. LncRNA TUG1 affects cell viability by regulating glycolysis in osteosarcoma cells. Gene 2018, 674, 87–92. [Google Scholar] [CrossRef] [PubMed]
- Mizushima, E.; Tsukahara, T.; Emori, M.; Murata, K.; Akamatsu, A.; Shibayama, Y.; Hamada, S.; Watanabe, Y.; Kaya, M.; Hirohashi, Y.; et al. Osteosarcoma-initiating cells show high aerobic glycolysis and attenuation of oxidative phosphorylation mediated by LIN28B. Cancer Sci. 2019, 111, 36–46. [Google Scholar] [CrossRef] [PubMed]
- Gorospe, M.; De Cabo, R. AsSIRTing the DNA damage response. Trends Cell Boil. 2008, 18, 77–83. [Google Scholar] [CrossRef] [PubMed]
- Feige, J.N.; Auwerx, J. Transcriptional coregulators in the control of energy homeostasis. Trends Cell Boil. 2007, 17, 292–301. [Google Scholar] [CrossRef]
- Abdellatif, M. Sirtuins and pyridine nucleotides. Circ. Res. 2012, 111, 642–656. [Google Scholar] [CrossRef]
- Hu, J.; Deng, F.; Hu, X.; Zhang, W.; Zeng, X.; Tian, X. Histone deacetylase SIRT6 regulates chemosensitivity in liver cancer cells via modulation of FOXO3 activity. Oncol. Rep. 2018, 40, 3635–3644. [Google Scholar] [CrossRef] [Green Version]
- Sociali, G.; Galeno, L.; Parenti, M.D.; Grozio, A.; Bauer, I.; Passalacqua, M.; Boero, S.; Donadini, A.; Millo, E.; Bellotti, M.; et al. Quinazolinedione SIRT6 inhibitors sensitize cancer cells to chemotherapeutics. Eur. J. Med. Chem. 2015, 102, 530–539. [Google Scholar] [CrossRef]
- Zhao, J.; Wozniak, A.; Adams, A.; Cox, J.; Vittal, A.; Voss, J.; Bridges, B.; Weinman, S.A.; Li, Z. SIRT7 regulates hepatocellular carcinoma response to therapy by altering the p53-dependent cell death pathway. J. Exp. Clin. Cancer Res. 2019, 38, 252. [Google Scholar] [CrossRef] [Green Version]
- Jiang, Y.; Han, Z.; Wang, Y.; Hao, W. Depletion of SIRT7 sensitizes human non-small cell lung cancer cells to gemcitabine therapy by inhibiting autophagy. Biochem. Biophys. Res. Commun. 2018, 506, 266–271. [Google Scholar] [CrossRef] [PubMed]
- Zhang, T.; Berrocal, J.G.; Frizzell, K.M.; Gamble, M.J.; Dumond, M.E.; Krishnakumar, R.; Yang, T.; Sauve, A.A.; Kraus, W.L. Enzymes in the NAD+ Salvage Pathway Regulate SIRT1 Activity at Target Gene Promoters*. J. Boil. Chem. 2009, 284, 20408–20417. [Google Scholar] [CrossRef] [PubMed] [Green Version]
- Lakatos, P.; Hegedűs, C.; Ayestarán, N.S.; Juarranz, Á.; Kövér, K.E.; Szabo, E.; Virág, L. The PARP inhibitor PJ-34 sensitizes cells to UVA-induced phototoxicity by a PARP independent mechanism. Mutat. Res. Mol. Mech. Mutagen. 2016, 790, 31–40. [Google Scholar] [CrossRef] [PubMed] [Green Version]
- Hegedűs, C.; Lakatos, P.; Oláh, G.; Tóth, B.I.; Gergely, S.; Szabo, E.; Bíró, T.; Szabó, C.; Virág, L. Protein kinase C protects from DNA damage-induced necrotic cell death by inhibiting poly(ADP-ribose) polymerase-1. FEBS Lett. 2008, 582, 1672–1678. [Google Scholar] [CrossRef] [Green Version]
- Regdon, Z.; Robaszkiewicz, A.; Kovács, K.; Rygielska, Ż.; Hegedűs, C.; Bodoor, K.; Szabó, É.; Virág, L. LPS protects macrophages from AIF-independent parthanatos by downregulation of PARP1 expression, induction of SOD2 expression, and a metabolic shift to aerobic glycolysis. Free. Radic. Boil. Med. 2019, 131, 184–196. [Google Scholar] [CrossRef] [PubMed]
- Hegedűs, C.; Lakatos, P.; Kiss-Szikszai, A.; Patonay, T.; Gergely, S.; Gregus, A.; Bai, P.; Haskó, G.; Szabo, E.; Virág, L. Cytoprotective dibenzoylmethane derivatives protect cells from oxidative stress-induced necrotic cell death. Pharmacol. Res. 2013, 72, 25–34. [Google Scholar] [CrossRef]
- Gergely, S.; Hegedűs, C.; Lakatos, P.; Kovács, K.; Gáspár, R.; Csont, T.; Virág, L. High Throughput Screening Identifies a Novel Compound Protecting Cardiomyocytes from Doxorubicin-Induced Damage. Oxidative Med. Cell. Longev. 2015, 2015, 1–12. [Google Scholar] [CrossRef]
- Erdélyi, K.; Bai, P.; Kovács, I.; Szabó, É.; Mocsár, G.; Kakuk, A.; Szabó, C.; Gergely, P.; Virág, L. Dual role of poly(ADP-ribose) glycohydrolase in the regulation of cell death in oxidatively stressed A549 cells. FASEB J. 2009, 23, 3553–3563. [Google Scholar] [CrossRef] [Green Version]
- Aladdin, A.; Király, R.; Boto, P.; Regdon, Z.; Tar, K. Juvenile Huntington’s Disease Skin Fibroblasts Respond with Elevated Parkin Level and Increased Proteasome Activity as a Potential Mechanism to Counterbalance the Pathological Consequences of Mutant Huntingtin Protein. Int. J. Mol. Sci. 2019, 20, 5338. [Google Scholar] [CrossRef] [Green Version]
- Kovács, P.; Csonka, T.; Kovács, T.; Sári, Z.; Ujlaki, G.; Adrienn, S.; Karányi, Z.; Szeőcs, D.; Hegedűs, C.; Uray, K.; et al. Lithocholic Acid, a Metabolite of the Microbiome, Increases Oxidative Stress in Breast Cancer. Cancers 2019, 11, 1255. [Google Scholar] [CrossRef] [Green Version]


© 2020 by the authors. Licensee MDPI, Basel, Switzerland. This article is an open access article distributed under the terms and conditions of the Creative Commons Attribution (CC BY) license (http://creativecommons.org/licenses/by/4.0/).
Share and Cite
Kiss, A.; Ráduly, A.P.; Regdon, Z.; Polgár, Z.; Tarapcsák, S.; Sturniolo, I.; El‐Hamoly, T.; Virág, L.; Hegedűs, C. Targeting Nuclear NAD+ Synthesis Inhibits DNA Repair, Impairs Metabolic Adaptation and Increases Chemosensitivity of U-2OS Osteosarcoma Cells. Cancers 2020, 12, 1180. https://doi.org/10.3390/cancers12051180
Kiss A, Ráduly AP, Regdon Z, Polgár Z, Tarapcsák S, Sturniolo I, El‐Hamoly T, Virág L, Hegedűs C. Targeting Nuclear NAD+ Synthesis Inhibits DNA Repair, Impairs Metabolic Adaptation and Increases Chemosensitivity of U-2OS Osteosarcoma Cells. Cancers. 2020; 12(5):1180. https://doi.org/10.3390/cancers12051180
Chicago/Turabian StyleKiss, Alexandra, Arnold Péter Ráduly, Zsolt Regdon, Zsuzsanna Polgár, Szabolcs Tarapcsák, Isotta Sturniolo, Tarek El‐Hamoly, László Virág, and Csaba Hegedűs. 2020. "Targeting Nuclear NAD+ Synthesis Inhibits DNA Repair, Impairs Metabolic Adaptation and Increases Chemosensitivity of U-2OS Osteosarcoma Cells" Cancers 12, no. 5: 1180. https://doi.org/10.3390/cancers12051180
APA StyleKiss, A., Ráduly, A. P., Regdon, Z., Polgár, Z., Tarapcsák, S., Sturniolo, I., El‐Hamoly, T., Virág, L., & Hegedűs, C. (2020). Targeting Nuclear NAD+ Synthesis Inhibits DNA Repair, Impairs Metabolic Adaptation and Increases Chemosensitivity of U-2OS Osteosarcoma Cells. Cancers, 12(5), 1180. https://doi.org/10.3390/cancers12051180