Article

CUL4A, ERCC5, and ERCC1 as Predictive Factors for Trabectedin Efficacy in Advanced Soft Tissue Sarcomas (STS): A Spanish Group for Sarcoma Research (GEIS) Study

by
David S. Moura
1,
Paloma Sanchez-Bustos
1,
Antonio Fernandez-Serra
2,
María Lopez-Alvarez
1,
José L. Mondaza-Hernandez
1,
Elena Blanco-Alcaina
1,
Angela Gavilan-Naranjo
1,
Paula Martinez-Delgado
1,
Serena Lacerenza
1,
Paloma Santos-Fernandez
1,3,
Irene Carrasco-Garcia
1,3,
Samuel Hidalgo-Rios
1,
Antonio Gutierrez
4,
Rafael Ramos
5,
Nadia Hindi
1,3,
Miguel Taron
1,6,
Jose Antonio Lopez-Guerrero
2,7 and
Javier Martin-Broto
1,3,*
1
Institute of Biomedicine of Sevilla (IBIS, HUVR, CSIC, Universidad de Sevilla), 41013 Sevilla, Spain
2
Laboratory of Molecular Biology, Fundación Instituto Valenciano de Oncología, 46009 Valencia, Spain
3
Medical Oncology Department, University Hospital Virgen del Rocio, 41013 Sevilla, Spain
4
Hematology Department, University Hospital Son Espases/IdISBa, 07120 Mallorca, Spain
5
Pathology Department, University Hospital Son Espases, 07120 Mallorca, Spain
6
Synlab Diagnosticos Globales SAU, 28108 Madrid, Spain
7
Department of Basic Medical Sciences, School of Medicine, Catholic University of Valencia ‘San Vicente Martir’, 46001 Valencia, Spain
*
Author to whom correspondence should be addressed.
Cancers 2020, 12(5), 1128; https://doi.org/10.3390/cancers12051128
Submission received: 1 April 2020 / Revised: 13 April 2020 / Accepted: 27 April 2020 / Published: 30 April 2020

Abstract

:
A translational study was designed to analyze the expression of nucleotide excision repair (NER) and homologous recombination (HR) genes as potential predictive biomarkers for trabectedin in soft-tissue sarcoma (STS). This study is part of a randomized phase II trial comparing trabectedin plus doxorubicin versus doxorubicin in advanced STS. Gene expression levels were evaluated by qRT-PCR, while CUL4A protein levels were quantified by immunohistochemistry. Expression levels were correlated with patients’ progression-free survival (PFS) and overall survival (OS). Gene expression was also evaluated in cell lines and correlated with trabectedin sensitivity. In doxorubicin arm and in the whole series, which includes samples from both arms, no significant differences in terms of PFS were observed amongst the analyzed genes. In the group treated with trabectedin plus doxorubicin, the median of PFS was significantly longer in cases with CUL4A, ERCC1, or ERCC5 overexpression, while BRCA1 expression did not correlated with PFS. Gene expression had no prognostic influence in OS. CUL4A protein levels correlated with worse PFS in doxorubicin arm and in the whole series. In cell lines, only overexpression of ERCC1 was significantly correlated with trabectedin sensitivity. In conclusion, CUL4A, ERCC5, and mainly ERCC1 acted as predictive factors for trabectedin efficacy in advanced STS.

1. Introduction

Trabectedin is a tetrahydroisoquinoline alkaloid approved in 2007, for the treatment of adult patients with advanced soft-tissue sarcoma (STS), after failure of anthracyclines and ifosfamide, or patients unsuited to receive these agents. Trabectedin has a wide spectrum of mechanisms of action in the tumor and in the microenvironment. As a DNA-binding agent, it interferes with gene transcription and with the DNA repair machinery, leading to DNA damage accumulation and cell cycle perturbation, with a delay in S phase progression and accumulation of cells in G2 phase [1,2,3]. More importantly, trabectedin interacts with the nucleotide excision repair (NER) machinery to exert its antitumor activity [4]. Yet and although the mechanisms of action of trabectedin have been comprehensively described, there are only few potential predictive biomarkers of drug activity [5,6].
Few retrospective studies have shown that NER- and homologous recombination (HR)-associated genes could be potential predictive factors for trabectedin efficacy in STS [5,7,8,9]. Trabectedin seems to bind to specific triplets of the DNA minor groove, projecting out of the DNA a part of its structure, which probably traps other proteins at the site of adduct such as XPG (ERCC5), forming large ternary complexes. Of note, trabectedin seems to be more active in the context of high levels of expression of NER genes (ERCC1 and ERCC5) and low expression levels of HR genes (BRCA1) [8,9,10]. NER-deficient cells are generally more resistant to trabectedin treatment [11]. Noteworthy, trabectedin produces DNA double-strand breaks, which associated with the impaired damage repair present in some sarcomas, through HR deficiency or BRCAness-like phenotype, leads to the rapid cell death of cancer cells; in a concept known as synthetic lethality [12].
Moreover, DNA-damage binding proteins (i.e., DDB1 and DDB2), which are known components of NER pathway [13] have been described to be part of the CUL4A ubiquitin ligase complex, suggesting a link between NER and the ubiquitin–proteasome pathway (UPP). CUL4-DDB1 E3-ligase complex seems to regulate the proteolysis of key proteins responsible for DDR [13]. In fact, after DNA damage, DDBs proteins form a complex that targets histones towards their ubiquitination and degradation during NER. This degradation induces chromatin remodeling and the activation of NER pathway, by recruiting XPC-containing complex that recognizes DNA lesions [14,15]. Therefore, the expression of CUL4A could be an indicator of NER pathway integrity and trabectedin efficacy. In line with this, high expression of CUL4A has been associated with trabectedin activity, suggesting that this gene/protein could be a predictive biomarker of drug efficacy [7,16].
The aim of this study was to analyze the expression of NER and HR genes (i.e., ERCC1, ERCC5, and BRCA1), as well as CUL4A, as potential predictive factors of trabectedin efficacy in STS. These genes were selected from bibliography, where they were described as potential predictive biomarkers for trabectedin [7,8,16,17,18]. This prospective translational analyses were performed as a correlative study within the comparative phase II trial that compared trabectedin plus doxorubicin versus doxorubicin alone as first line of advanced STS [19].

2. Results

2.1. Demographic and Pathologic Features

A cohort of 66 cases, derived from the randomized phase II study of trabectedin and doxorubicin compared with doxorubicin alone as first-line treatment in patients with advanced STS, were included in the translational study associated with the clinical trial. All the patients included in the translational study had FFPE tumor samples available, with enough tissue (i.e., derived from surgery) for gene expression analysis. Of those initially included in the clinical trial (n = 113), 47 were removed from the translational study due to the lack of enough FFPE tumor tissue. All the patients were enrolled in the trial between November 2009 and October 2012, at the time of clinical cut-off the median of follow-up was 13 months.
The median age of the subset of patients included in the translational research was 52 years (21–72); 31 (47%) being females and 35 (53%) males. Median tumor size was of 90 mm (2–300 mm). Primary tumor sites were: Extremities (38.4%), head and neck (3.1%), truck wall (4.6%), retroperitoneum (23.1%), and other sites (30.8%). This translational study includes several subtypes: Leiomyosarcoma (n = 22), liposarcoma (n = 12), undifferentiated pleomorphic sarcoma (UPS; n = 12), fibrosarcoma (n = 4), hemangiopericytoma (n = 3), malignant peripheral nerve sheath tumor (MPNST; n = 3), synovial sarcoma (n = 3), and others (n = 7). Within the clinical trial, 34 patients were included in the control arm (i.e., doxorubicin), whereas 32 were enrolled in the experimental arm (doxorubicin plus trabectedin). Of the 66 cases included in the translational cohort, 12 (18.2%) had specific chromosomal translocations. There were 62 events of progression and 39 patients eventually died, among the patients included in the translational research. The demographic and clinicopathologic characteristics are represented in Table 1.

2.2. Expression of DDR-Associated Genes in STS Samples

Gene expression analysis of 4 genes (BRCA1, CUL4A, ERCC1, and ERCC5), involved in the DNA damage repair (DDR) machinery, was performed in 66 surgical tumor samples. The median absolute expression of BRCA1, CUL4A, ERCC1, and ERCC5 in the whole series and both individual cohorts are shown in Table 2.
In the whole series, which included both arms of the clinical study, the expression of CUL4A significantly correlated with the expression of ERCC1 (ρ = 0.668, p < 0.001) and ERCC5 (ρ = 0.703, p < 0.001). The expression of ERCC1 also significantly correlated with ERCC5 expression; unexpectedly, the expression of BRCA1 was also positively correlated with the expression of the other 3 genes—Table S1.

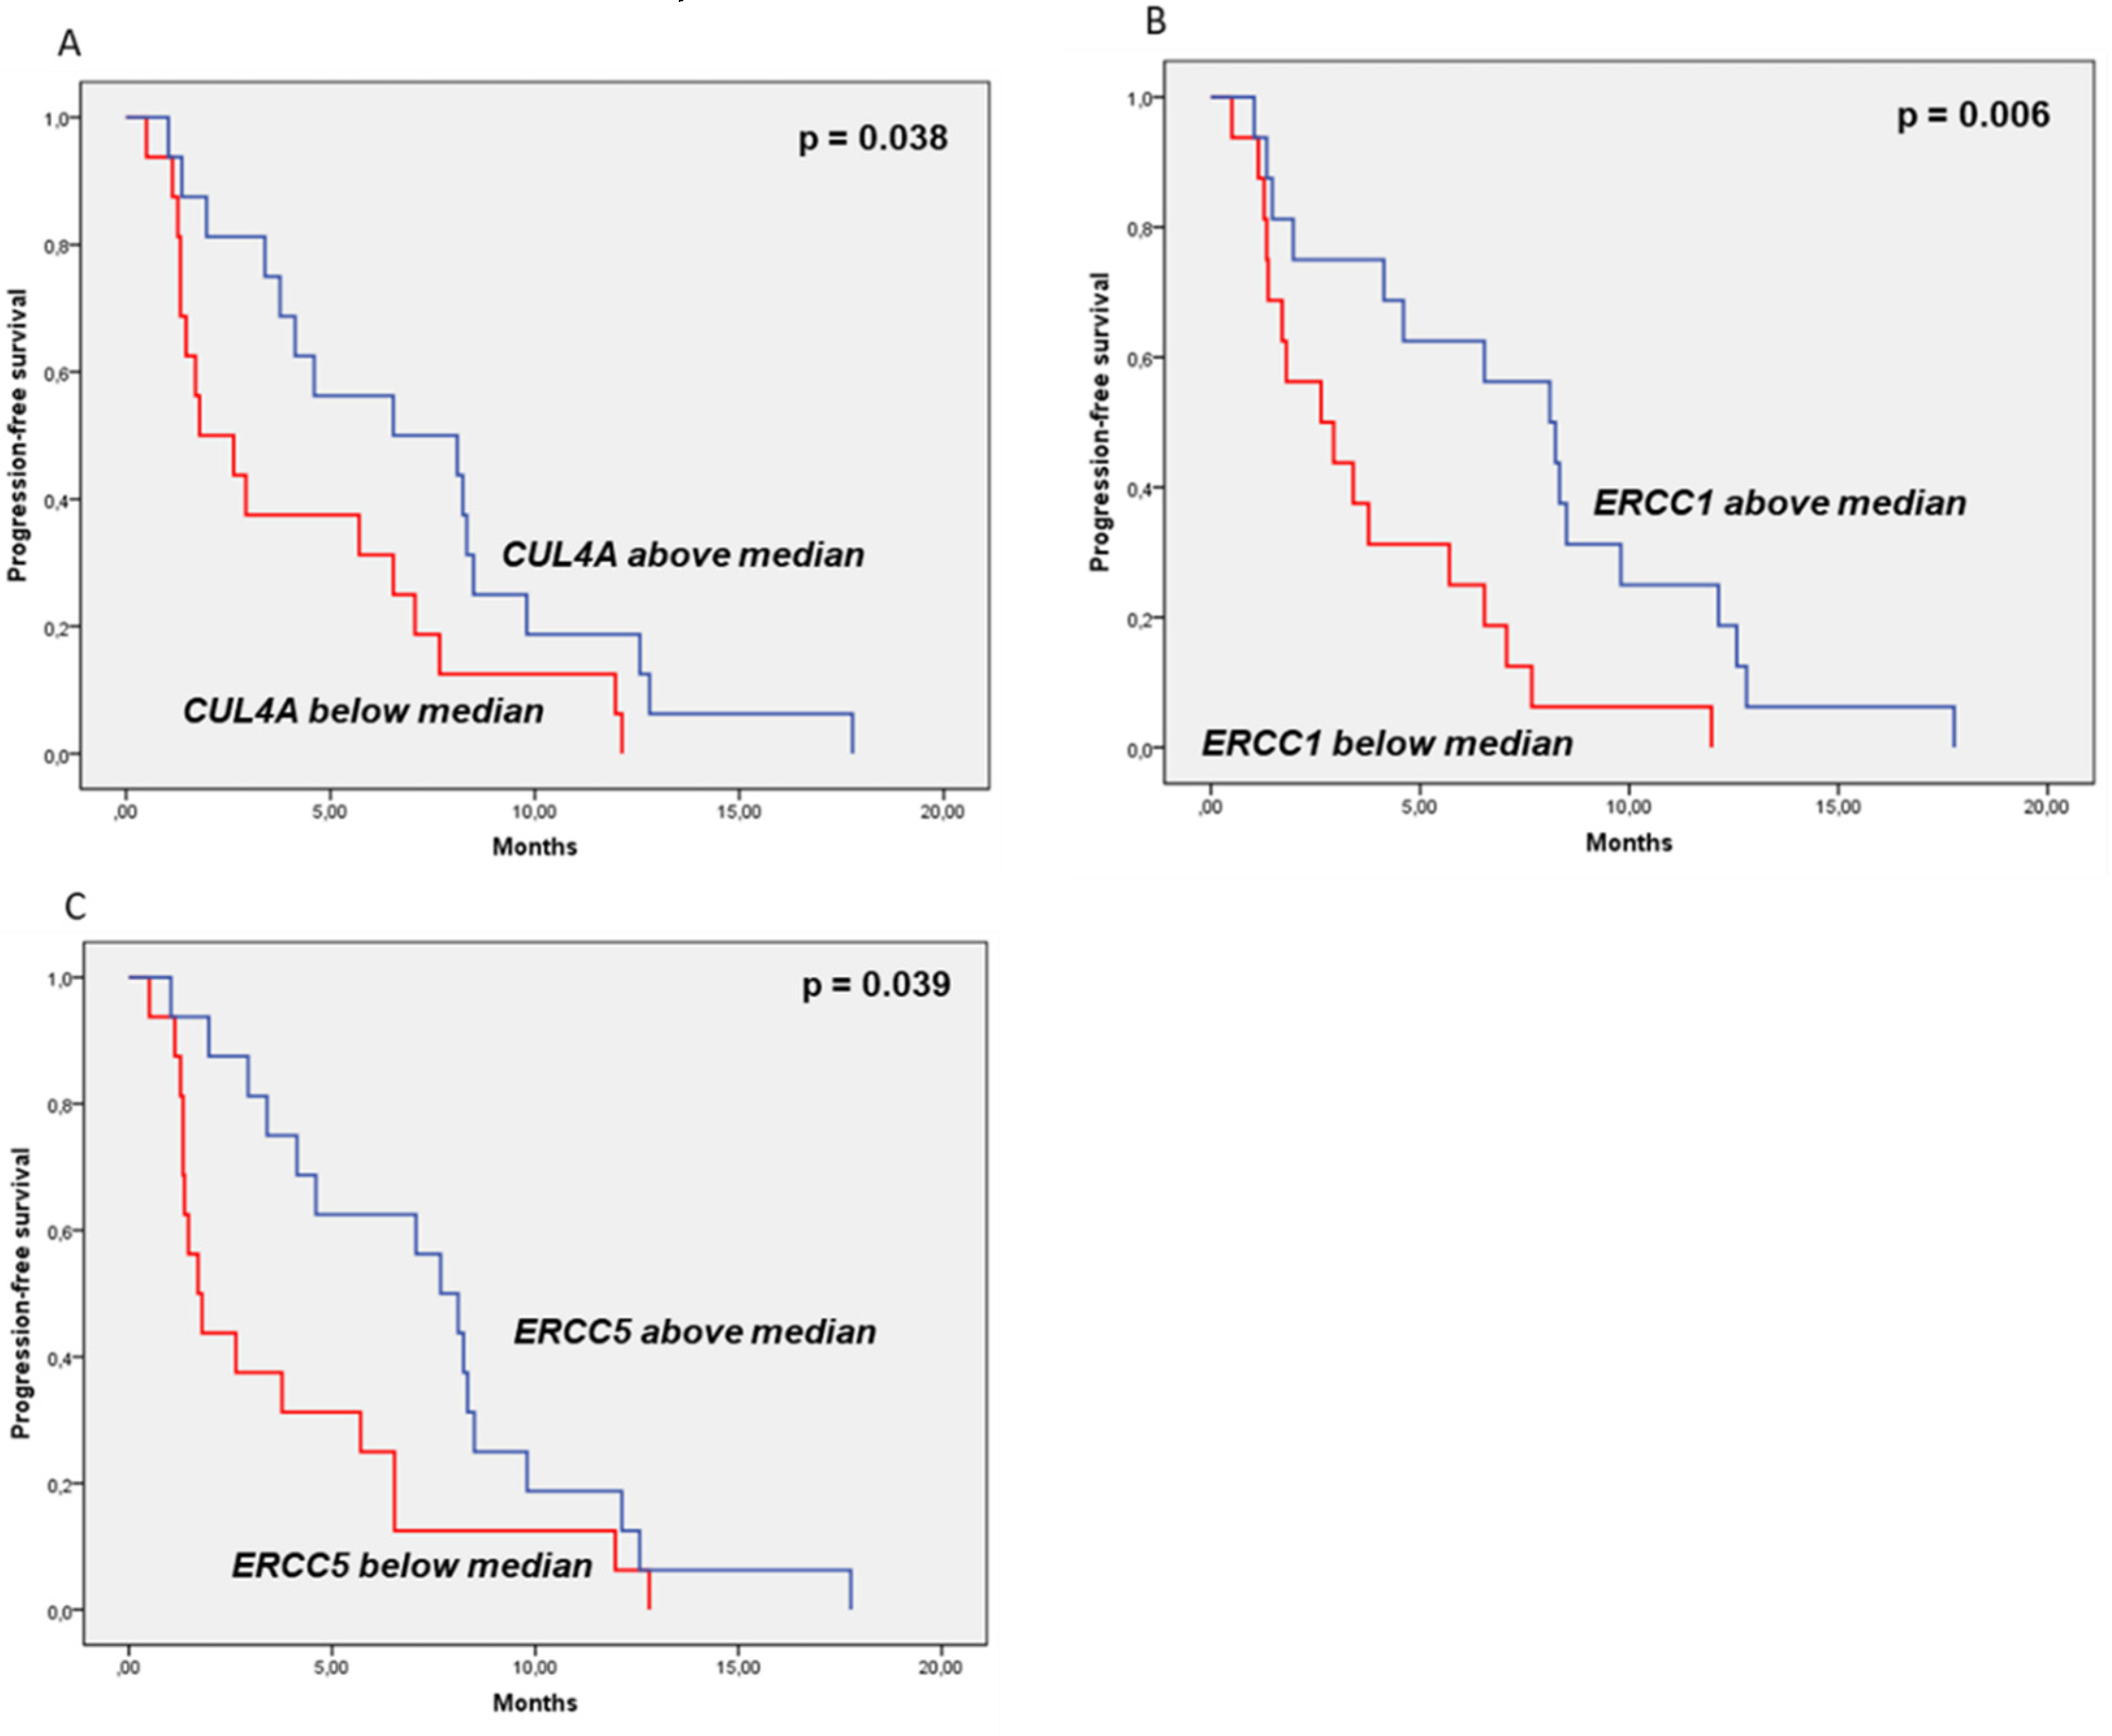
2.3. Association of BRCA1, CUL4A, ERCC1, and ERCC5 with Clinical Outcome

Sixty-six patients were included in the univariate analysis with a median follow-up of 13 months—Table 3.
In the whole series, the expression of BRCA1, CUL4A, ERCC1, and ERCC5 did not achieve significant correlation with PFS and OS. Similar results were observed regarding the control group, which included the patients treated with doxorubicin in monotherapy.
Nonetheless, in the experimental group overexpression of CUL4A, ERCC1, and ERCC5 significantly correlated with better mPFS. Amongst the transcripts analyzed, high expression of ERCC1 was the most significantly associated with longer PFS on trabectedin plus doxorubicin arm (8.10 months (95% CI: 4.77–11.43) vs 2.63 months (95% CI: 0.41–4.86) p = 0.006). Likewise, high expression of ERCC5 (7.67 months (95% CI: 5.64–9.69) vs 1.70 months (95% CI: 1.05–2.35); p = 0.039) and of CUL4A (6.53 months (95% CI: 0.00–13.39) vs 1.80 months (95% CI: 0.00–3.63); p = 0.038) were all associated with better PFS on the experimental group—Table 3 and Figure 1. BRCA1 did not correlate with PFS in this arm—Table 3. Considering these translational variables as continues variables using univariate and univariate COX regression, only ERCC1 was significantly associated to PFS (HR: 0.76; 95%CI: 0.61-0.96; p = 0.021).
None of these genes were statistically significant correlated with OS in the trabectedin plus doxorubicin group; however, a trend was observed in the case of CUL4A, where high expression showed a tendency for better OS (22.63 months (95% CI: 17.02–28.25) vs 13.53 months (95% CI 6.25–20.81); p = 0.059)—As observed in Figure S1.
Gene expression was also correlated with clinical variables that were reported to have prognostic value in this study [19]. In the whole series, the histologic grade negatively correlated with the expression of CUL4A (ρ = −0.298; p = 0.017), ERCC1 (ρ = −0.321; p = 0.011) or ERCC5 (ρ = −0.280; p = 0.025). This statistical significant negative correlation between histologic grade and CUL4A (ρ = −0.423; p = 0.018) or ERCC1 (ρ = −0.423; p = 0.018) expression was maintained in the experimental group, whereas the negative correlation between histologic grade and ERCC5 (ρ = −0.393; p = 0.024) was only maintained in the doxorubicin arm—Table S2.

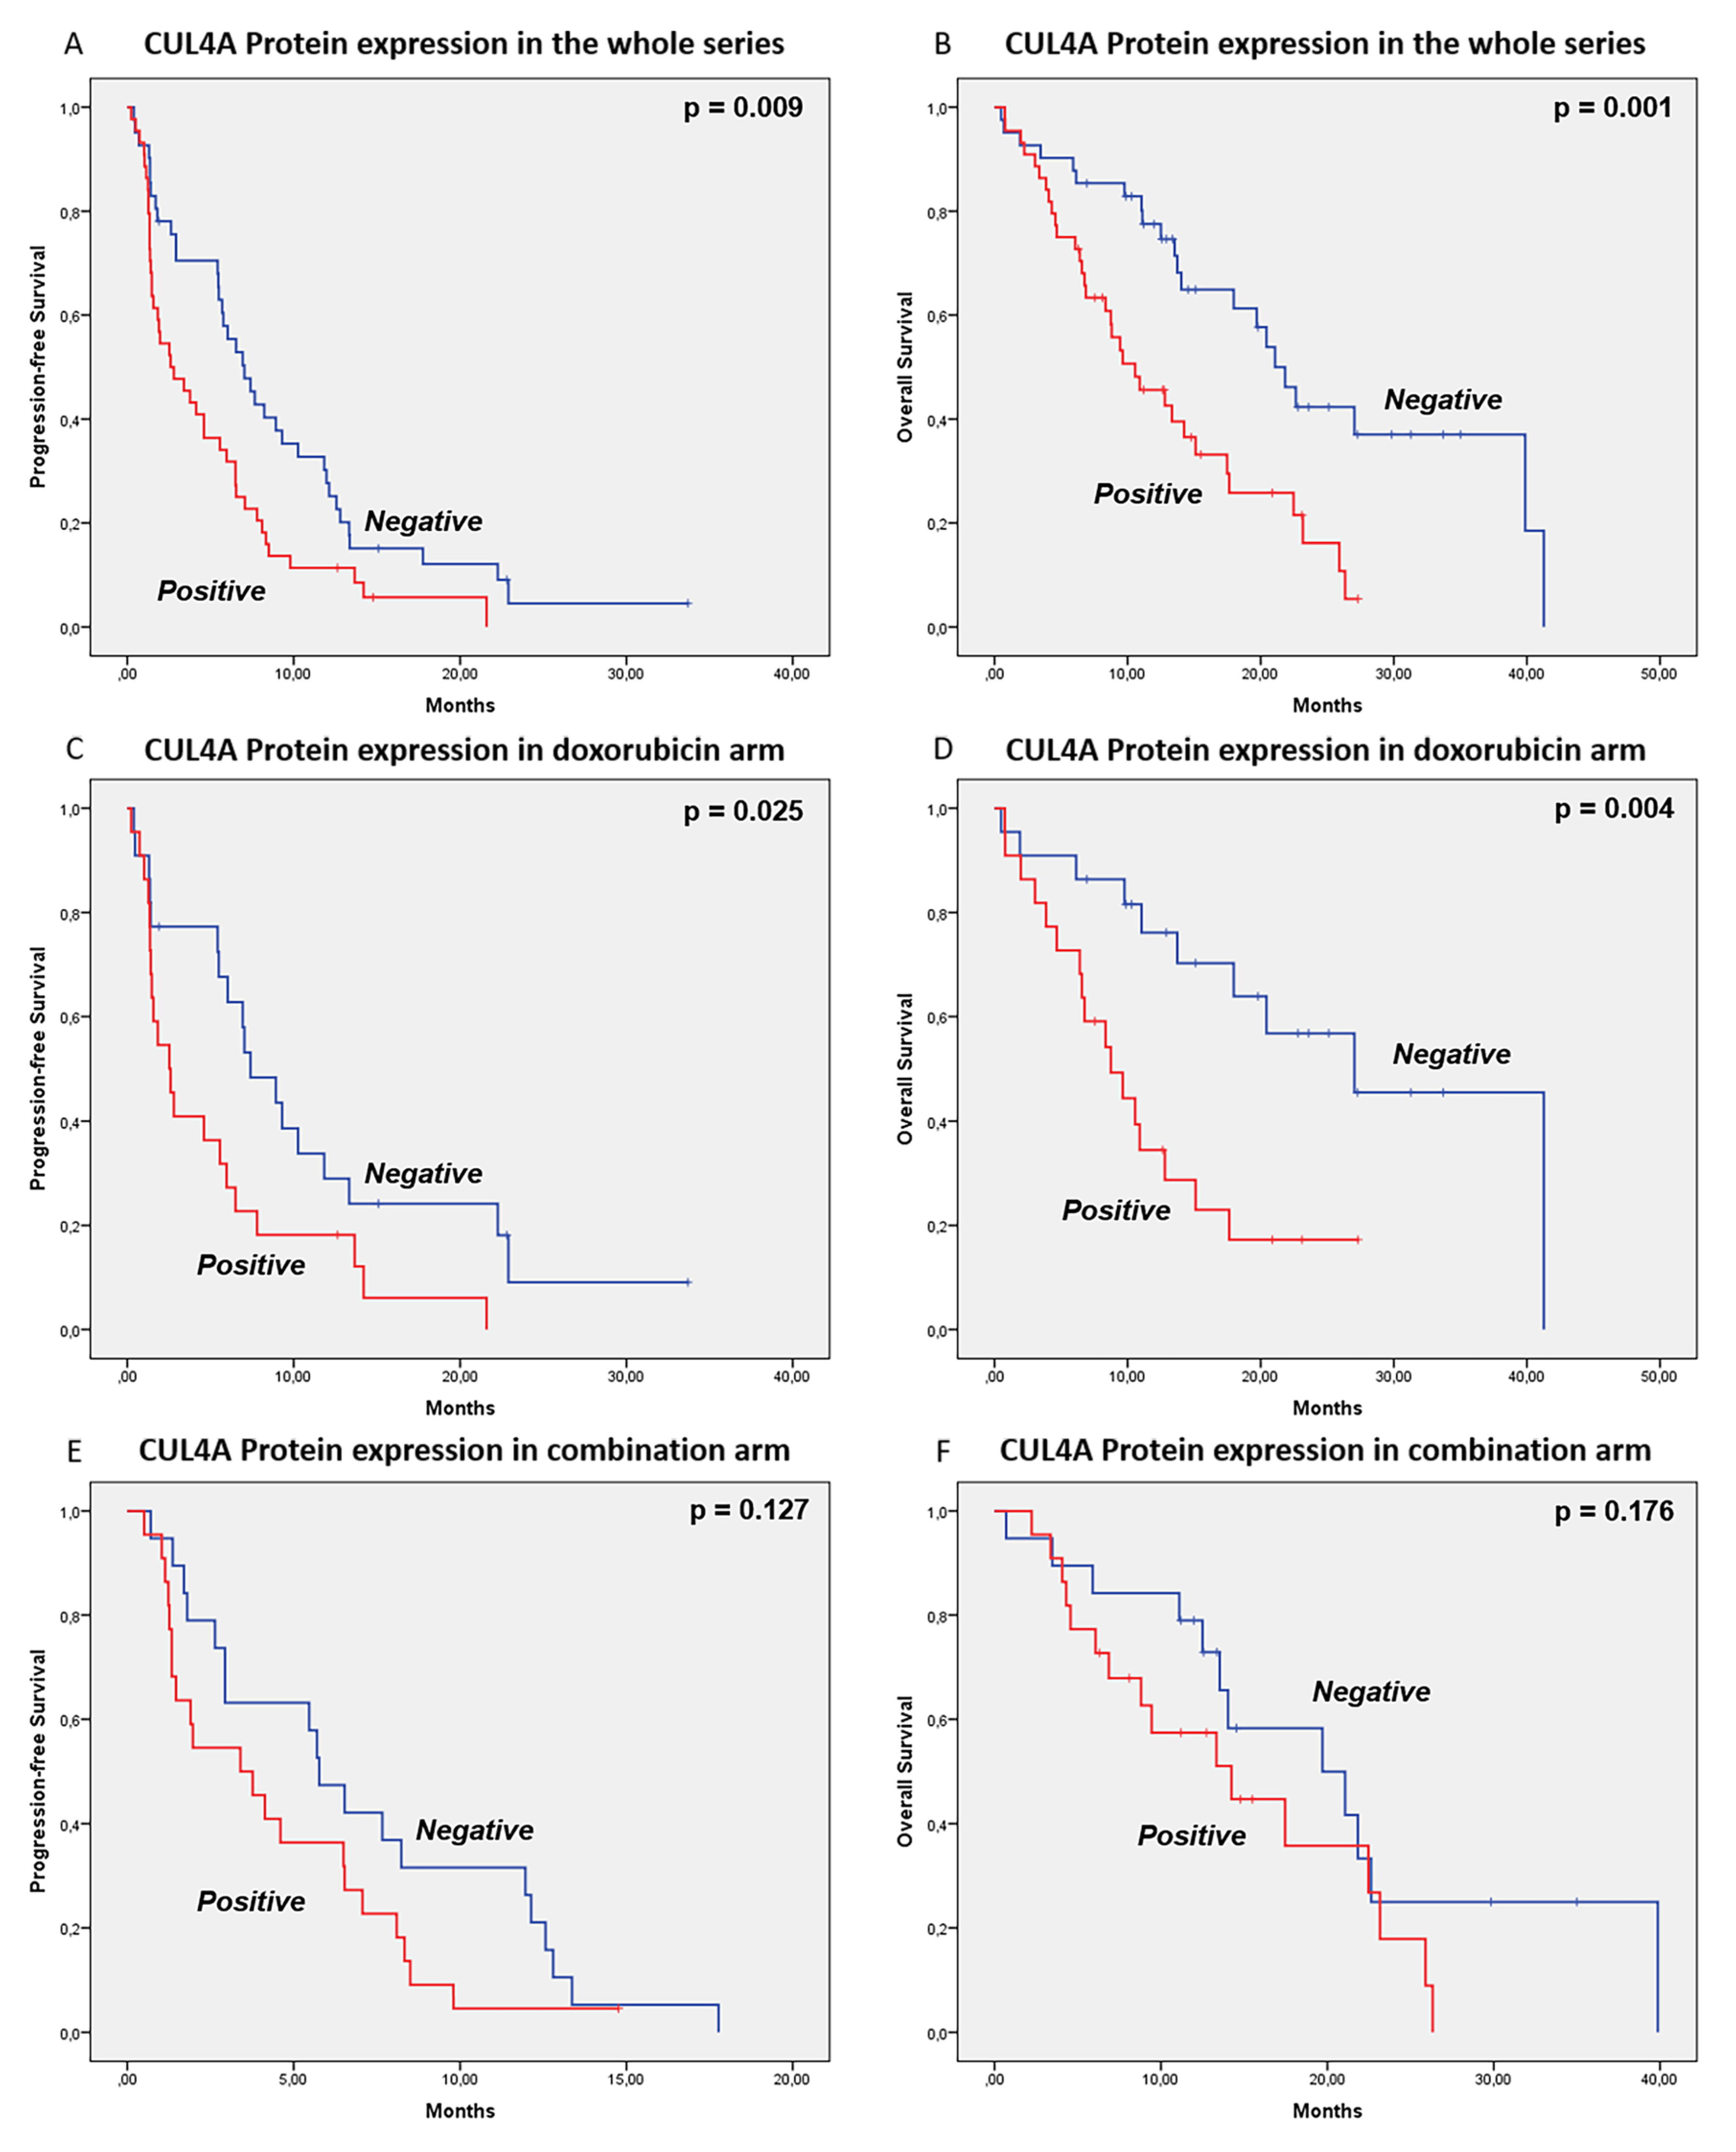
2.4. CUL4A Protein Expression Analysis

CUL4A protein expression was determined in a series of 85 patients, of which 41 cases were negative and 44 cases were positive for CUL4A immunostaining. Among the 85 cases, 44 samples were from patients treated with doxorubicin in monotherapy (n = 22 CUL4A positive and n = 22 CUL4A negative) and 41 samples derived from patients treated with the combination of trabectedin plus doxorubicin (n = 22 CUL4A positive and n = 19 CUL4A negative). An example of CUL4A immunostaining is represented in Figure S2. Demographic and clinicopathologic features of this subset of 85 cases are displayed in the Table S3.
Regarding the univariate analysis, positive expression of nuclear CUL4A protein was associated with worse PFS in the whole series: 2.60 months (95% CI: 0.58–4.62) vs 7.03 months (95% CI: 5.03–9.04), p = 0.009; and with worse PFS in doxorubicin arm: 2.53 months (95% CI: 1.12–4.00) vs 7.4 months (95% CI: 4.45–10.35), p = 0.025. On the other hand, CUL4A protein expression did not significantly correlate with PFS in the combination arm: 3.40 months (95% CI: 0.83–6.00) vs 5.77 months (95% CI: 4.25–7.28), p = 0.127—Figure 2 and Table S4.
Likewise, positive expression of CUL4A protein was significantly associated with worse OS, in the whole series: 10.57 months (95% CI: 5.95–15.18) vs 21.07 months (95% CI: 17.70–24.43), p = 0.001; and in doxorubicin arm: 8.73 months (95% CI: 4.62–12.84) vs 27.03 months (95% CI: 16.99–37.08), p = 0.004. Also, a trend was observed for worse OS in the combination arm, when CUL4A protein expression was positive: 14.23 months (95% CI: 5.68–22.79) vs 19.70 months (95% CI: 8.82–30.58), p = 0.176—Figure 2 and Table S4. The expression of CUL4A did not correlate with CUL4A gene expression in our series (Spearman’s ρ = 0.109; p = 0.386).

2.5. In Vitro Correlation between Gene Expression and Trabectedin Sensitivity

The expression of significant genes (ERCC1, ERCC5, and CUL4A) and its correlation with trabectedin activity were also an object of study in the pre-clinical context, with the purpose of validating the translational results.
In cell lines, the mean absolute levels of ERCC1 were 0.0338 (0.0179–0.0685), of ERCC5 0.0023 (0.0006–0.0068), and of CUL4A 0.0126 (0.046–0.126). The expression levels of each gene, by cell line, are represented in Figure S3.
Noteworthy, high expression of ERCC1 was significantly correlated with lower trabectedin IC50 values (ρ = −0.964; p < 0.001). Higher expression of CUL4A also showed a correlation trend for lower trabectedin IC50 values (ρ = −0.750; p = 0.052). The expression of ERCC5 was not correlated with trabectedin In Vitro activity in the selected STS cell line panel (ρ = −0.143; p = 0.760)—Table 4.

3. Discussion

In this prospective study, only the expression levels of ERCC5, CUL4A, and mainly of ERCC1 behaved as predictive biomarkers of trabectedin efficacy, supporting the relationship between DDR-associated genes and trabectedin activity.
Our data showed that high expression of ERCC5 and mainly ERCC1, which are key factors in NER pathway, were related with increased anti-tumoral activity of trabectedin (i.e., PFS). Additionally, cell lines with higher levels of ERCC1 were also more sensitive to trabectedin treatment. Meanwhile, ERCC5 levels were not significantly correlated with trabectedin activity, in our pre-clinical studies. These results suggest that the overexpression of ERCC1 could be a reliable positive predictive biomarker of trabectedin activity, whereas its low expression may be related with trabectedin-resistance. Indeed, resistance to trabectedin has been reported in human NER-deficient cell lines. Cells lacking functional ERCC1 had a 2- to 8-fold increase in trabectedin IC50 values as compared to the parental cell line. Moreover, the ectopic expression of ERCC1 in NER-deficient cells sensitized them to trabectedin [11]. Besides, high expression levels of ERCC1 and ERCC5 had also been associated with improved PFS on the trabectedin line, in a retrospective series, whereas the levels of BRCA1 were not correlated with the clinical outcome. Similar data was observed in our prospective study [8,20,21,22]. Yet, another study reported that low levels of BRCA1 expression correlated with statistically significant better response to trabectedin [9]. It is worth mentioning that in our series patients were treated with trabectedin at the first-line of advance disease, and samples were collected at the time of diagnosis. Hence, this fact would indicate higher reliability since no systemic treatment that could induce changes in gene or protein expression, were given between diagnostic tumor biopsy time and at the baseline of the study.
The high expression of CUL4A was also significantly associated with better outcome in patients treated with trabectedin. These results could be related to the fact that CUL4A forms proteolytic complexes with DDBs proteins, which are relevant in the activation of NER mechanism of DNA repair [13]. Accordingly, and taking into account that trabectedin activity seems to rely at least partially on NER-efficiency [7,23,24], our results support that high expression of CUL4A should be associated with improved trabectedin activity. The potential predictive value of CUL4A has previously been reported in a panel of 10 breast cancer cell lines, where the expression of CUL4A was associated with higher trabectedin sensitivity [16]. Moreover, the downregulation of CUL4A in these cell lines increased resistance to trabectedin. In the same study, lower BRCA1/ERCC5, BRCA1/CUL4A, and XRCC3/CUL4A expression ratios were also associated with trabectedin activity; however, the ratios between BRCA1/ERCC5, BRCA1/CUL4A, or BRCA1/ERCC1 were not correlated with trabectedin activity (data not shown) in our series.
Nonetheless, it is important to mention that, in our series, the results of CUL4A mRNA levels were not consistent with the results attained at protein level. High expression levels of CUL4A were associated with better PFS for trabectedin in nontranslocation-related sarcomas [16]; however, protein expression analysis showed an unexpected association between worse PFS and cases with high expression of CUL4A in our series. This result was significant in the whole series as well as in the doxorubicin-treated cases, while in the combination group there was also a tendency for worse PFS in samples with high protein levels of CUL4A. Of note, CUL4A has been shown to regulate the expression of ABC efflux pumps, more precisely multidrug resistance-associated protein 1 (MRP-1) and P-glycoprotein (P-gp) [25]. These transporters confer doxorubicin-resistance in STS, which might explain the worse PFS in doxorubicin arm associated with high CUL4A protein expression [26,27].
Yet, it is important to note that accurate quantification of CUL4A immunostaining was deemed to be difficult, mainly due to the lack of unique epitope and the cross-positivity with CUL4B [28]. Accordingly, CUL4A protein expression data should be carefully interpreted, since the levels of protein expression may represent both cullin E3 ligase scaffolding proteins CUL4A and CUL4B. This issue could also justify the different prognostic value of CUL4A protein and RNA.
Contrariwise, NER pathway seems to be involved in the repair of doxorubicin-induced lesions [29,30], indicating that NER-deficient tumors could be more sensitive to doxorubicin treatment. Nevertheless, our data did not show any association between the expression of NER-associated genes and the clinical outcome of patients treated with doxorubicin. These results could be justified by clinical and pre-clinical evidence, describing tissue-specific patterns of DNA repair, which in turn might be related to mutations in DDR-specific genes [31]. Hence, the heterogeneity of STS subtypes and of tumor localizations in our series, associated with other genetic factors not explored (i.e., mutational analysis) may impact the reparation of doxorubicin-induced lesions and the correlations taken from this study.
Our results also showed a statistically significant correlation between histologic grade and gene expression. High expression of CUL4A, ERCC1, and ERCC5 correlated with low histologic grade in the wholes series and this association was also statistically significant in the experimental arm, at least for CUL4A and ERCC1. Similar to our data, high expression of CUL4A or ERCC1 had been associated with better outcome in sarcomas [8,16,32,33]; however, and to our knowledge, no correlation between CUL4A or ERCC1 expression levels and histologic grade had been reported in STS. Pre-clinical studies should be performed in sarcomas to address if these genes may play an anti-tumoral role in sarcomas or if they are only relevant in the mechanisms of action of doxorubicin and trabectedin. Moreover, it could be relevant to perform multivariate analysis in series with a higher number of cases and including both clinical (e.g., histologic grade and others) and translational (e.g., CUL4A and ERCC1) variables. This analysis could help validate the predictive value of these genes. In this study, only 2 variables could be considered for multivariate analysis, taking into account the number of cases included in the trabectedin plus doxorubicin arm.
Our study has however some limitations that should be taken into account. The most important is the lack of a cohort of cases treated with trabectedin in monotherapy and in which the validation of predictive biomarkers could be performed. Still and to further explore the predictive value of these molecular factors, the expression of DDR-associated genes is being currently evaluated in a separate study, using a series of 301 cases treated with trabectedin in second or further lines of advance disease [34]; with the limitation that diagnostic specimens in some cases were collected far from the time in which the patients were treated with trabectedin. Results from this study will help understand and validate the data attained in this prospective analysis. Moreover, it is important to notice that the median cut-off values used in our study to group expression data might represent a limitation. Other statistical metrics as receiver operating characteristic (ROC) curve could be considered to group continuous variables in future biomarkers studies; mostly in big series of cases, where it will be more reliable to detect a high sensitive and specific cut-off, with a meaningful clinical value. For this reason, the data obtained in this study is an interesting exploratory observation, but that should be validated in a bigger independent sample, where a more robust cut-off may arise. Another limitation is the lack of reliable antibodies for protein expression analysis in paraffin tumor samples, which limits the validation of potential biomarkers (e.g., ERCC1 and CUL4A).

4. Methods

4.1. Patients

The cases included in this translational study, for gene (n = 66) and protein expression (n = 85) analyses were collected prospectively within the randomized phase II trial of trabectedin and doxorubicin compared with doxorubicin alone as first-line treatment in patients with advanced STS All subjects gave their informed consent for inclusion before they participated in the study. The study was conducted in accordance with the Declaration of Helsinki, and the protocol was approved by the Ethics Committee of Illes Balears (EudraCT 2008-008922-55). Patients included in this trial had locally advanced non-resectable or metastatic STS, with measurable disease according to Response Evaluation Criteria in Solid Tumors (RECIST) 1.0. Additional inclusion and exclusion criteria have been previously described [19].

4.2. Gene Expression of Tumour Samples

One representative formalin-fixed paraffin-embedded (FFPE) block was selected from each patient and three sections of 20 μm thick were cut. For the isolation of the mRNA, RecoverAll™ Total Nucleic Acid Isolation Kit for FFPE (Ambion, Texas, TX, USA) was used according to manufacturer’s instructions. RNA concentration was measured in a NanoDrop-1000 spectrophotometer (Thermo scientific, Waltham, MA, USA). One μg of RNA obtained was used to test RNA integrity, by the presence of the 28S and 18S ribosomal bands in a 1% agarose gel electrophoresis stained with ethidium-bromide and visualized under ultraviolet light.
Reverse transcription was performed from 200 ng of total RNA using the High Capacity cDNA Reverse Transcription Kit® (Applied Biosystems, Foster City, CA, USA), following manufacturers’ instructions and as described elsewhere [26].
Gene expression was measured by qRT-PCR using the following TaqMan assays on demand (Applied Biosystems, Foster City, CA, USA): BRCA1 (Hs01556190_m1), CUL4A (Hs00757716_m1), ERCC1 (Hs01012159_m1), ERCC5 (Hs01012159_m1) in a 7500 Fast thermocycler (Applied Biosystems). Furthermore, beta-2-microglobulin (Hs99999907_m1) and GAPDH (Hs00266705_m1) were used as housekeeping genes.
Expression was then calibrated using a universal human RNA pool (Stratagene, La Jolla, CA, USA) to normalize the relative expression of the genes analyzed following the 2−ΔΔCt method [35].

4.3. Immunohistochemistry

Two or three representative areas (1 mm in diameter) of each tumor were selected for tissue microarray (TMA) production by first examining the hematoxylin and eosin-stained tumor slide and then sampling the tissue from the corresponding paraffin blocks. A TMA instrument (Beecher Instruments; Sun Prairie, WI, USA) was used for TMA assembly. Immunohistochemistry was performed in TMAs 4-µm sections, using an anti-CUL4A polyclonal antibody (1:50, 2699s, Cell Signaling Technology, Danvers, MA, USA). Nuclear CUL4A expression was analyzed as negative and positive (positive cases were considered if they displayed staining in at least 5% of cells). CUL4A protein expression was determined in 85 tumor samples, collected at disease onset. Colorectal cancer tissue was used as positive control of CUL4A expression.

4.4. Cell Lines

The following STS cell lines were used for ERCC1, ERCC5 and CUL4A gene expression analysis: Liposarcoma cell lines 93T449 (ATCC® CRL-3043™; ATCC, Old Town Manassas, VA, USA) and SW872 (ATCC® HTB-92™; ATCC, Manassas, VA, USA); leiomyosarcoma primary cell lines AA (kindly provided by Dr. Amancio Carnero of the Institute of Biomedicine of Seville, CSIC, US, HUVR; Seville, Spain) and CP0024 (established in Martin-Broto laboratory); SW982 (ATCC® HTB-93™; ATCC) synovial sarcoma cell line; fibrosarcoma cell line HT-1080 (ATCC® CCL-121™; ATCC) and uterine leiomyosarcoma cell line SK-UT-1 (ATCC® HTB-114™; ATCC).
HT-1080 and AA cell line were maintained in F-10 medium (GibcoTM, Thermo Fischer Scientific, Waltham, MA, USA), 93T449 and CP0024 were cultured in RPMI cell medium (GibcoTM), SK-UT-1 was maintained in DMEM cell culture medium (GibcoTM) and both SW872 and SW982 were cultured in Leibovitz’s L-15 Medium (GibcoTM). All the cell culture mediums were supplemented with 10% FBS, and 100 units/mL penicillin (PAA) and 100 μg/mL streptomycin. Cells were checked routinely and test for contamination by Mycoplasma or fungi. All the cells lines were discarded after 2 months and new lines obtained from frozen stocks.

4.5. Determination of Trabectedin IC50 Values

Cell lines were seeded in 96-well plates and treated separately with increasing concentrations (1 × 10⁻¹³ M to 1 × 10⁻⁷ M) of trabectedin for 72 h. Cell proliferation was evaluated by MTS assay (Promega, Madison, WI, USA) and the concentrations that inhibit 50% of cell growth (IC50) were determined using nonlinear regression in Prism 5.0 (GraphPad Software; San Diego, CA, USA).

4.6. Gene Expression Determination in Cell Lines

Cells were cultured in 10 cm dishes for 48 h, time in which they were harvested for gene expression analysis. Total RNA was isolated by TRIzol® (Invitrogen Corp., Carlsbad, CA, USA)—chloroform method, from all the cell lines, according to the manufacturer’s protocol. One microgram of RNA was submitted to reverse transcription using the High Capacity cDNA Reverse Transcription Kit (Applied Biosystems™—Thermo Fischer Scientific), in the presence of MultiScribe™ Reverse Transcriptase and a random primer scheme for initiating cDNA synthesis. The cDNA obtained was amplified and quantified by real-time quantitative PCR, using the GoTaq® qPCR Master Mix Kit (Promega). Individual quantification of gene expression was performed using the comparative CT method (CT) and the relative expression will be calculated as 2−ΔCT. The following assays were used for determine gene expression: ERCC1; ERCC5; CUL4A; and GAPDH. Three biological replicates with three technical replicas each, were performed.

4.7. Statistical Analysis

All the categorical variables were reported as relative frequencies (%) and quantitative variables were expressed as median and ranges. OS and PFS were measured from the date of diagnosis (OS) or from the date of initial treatment within the clinical trial (PFS) to the final event, and were estimated according to the Kaplan–Meier method. The associations between the variables of interest (i.e., gene expression and clinical outcomes) were performed by the log-rank test. Univariate and multivariate COX regression was carried out with continuous translational variables. All these associations were pre-planned to be performed in the whole series and in each treatment cohort. Correlations among gene expression levels and between IC50 values and In Vitro gene expression were performed using Spearman’s rank correlation coefficient (ρ). All p-values reported were 2-sided, and the statistical significance was defined at p = 0.05. All the statistical procedures were performed with SPSS 22.0 software (IBM, Armonk, NY, USA).

5. Conclusions

High expression levels of ERCC1, CUL4A, and ERCC5 seem to be predictive biomarkers of trabectedin activity and they were associated in our series with longer PFS for trabectedin in advanced STS. The results showed in this study support the importance of NER-efficiency on the mechanism of action of trabectedin, while it opens new roads for further research on the role of CUL4A on the activity of other chemotherapeutic agents in the context of STS. CUL4A is activated, in the DDBs complexes, by NEDD8 and this latter protein seems to be critical in the activation of NER [36]; therefore, the combination of pevonidestat, an inhibitor of NEDD8-activating enzyme (NAE) that prevents activation of cullin-RING ligases, with doxorubicin, gemcitabine or other chemotherapeutic agents that are active in NER-deficient conditions should be explored in pre-clinical experiments.

Supplementary Materials

The following are available online at https://www.mdpi.com/2072-6694/12/5/1128/s1, Table S1: Bivariate correlations of gene expression. (Spearman’s rank correlation coefficient (ρ)), Table S2: Correlation between gene expression and clinical variables, Table S3: Demographics and clinical-pathologic information of the subset of cases included in protein expression analysis (n = 85), Table S4: Univariate analysis taking into account CUL4A protein expression, Figure S1: Overall Survival taking into account the median expression of CUL4A, Figure S2: CUL4A protein expression, Figure S3: ERCC1, ERCC5 and CUL4A expression in soft-tissue sarcoma cell lines.

Author Contributions

Conceptualization, J.M.-B. and D.S.M.; Methodology, D.S.M. and J.M.-B.; Validation, D.S.M.; Formal Analysis, D.S.M., A.F., A.G., J.A.L.-G. and J.M.-B.; Investigation, All the authors; Resources, J.M.-B.; Data Curation, D.S.M. and J.M.-B.; Writing—Original Draft Preparation, D.S.M. and J.M.-B.; Writing—Review and Editing, All the authors; Visualization, D.S.M. and J.M.-B.; Supervision, J.M.-B.; Project Administration, D.S.M. and J.M.-B.; Funding Acquisition, J.M.-B. All authors have read and agreed to the published version of the manuscript.

Funding

This research received no external funding.

Conflicts of Interest

DSM reports institutional research grants from PharmaMar, Eisai, Immix BioPharma, and Novartis outside the submitted work; travel support from PharmaMar, Eisai, Celgene, Bayer, and Pfizer. PSB declares institutional research grants from PharmaMar, Eisai, Immix BioPharma, and Novartis outside the submitted work. MLA declares institutional research grants from PharmaMar, Eisai, Immix BioPharma, and Novartis outside the submitted work. JLMH declares institutional research grants from PharmaMar, Eisai, Immix BioPharma, and Novartis outside the submitted work. EBA declares institutional research grants from PharmaMar, Eisai, Immix BioPharma, and Novartis outside the submitted work. NH reports grants, personal fees and non-financial support from PharmaMar, personal fees from Lilly, grants from Eisai, and grants from Novartis, outside the submitted work. MT is an employee of Synlab Diagnosticos Globales SAU. JMB reports research grants from PharmaMar, Eisai, Immix BioPharma, and Novartis outside the submitted work; honoraria for advisory board participation and expert testimony from PharmaMar, honoraria for advisory board participation from Eli Lilly and Company, Bayer and Eisai; and research funding for clinical studies (institutional) from PharmaMar, Eli Lilly and Company, AROG, Bayer, Eisai, Lixte, Karyopharm, Deciphera, GSK, Novartis, Blueprint, Nektar, Forma, Amgen, and Daichii-Sankyo.

References

  1. Minuzzo, M.; Marchini, S.; Broggini, M.; Faircloth, G.; D’Incalci, M.; Mantovani, R. Interference of transcriptional activation by the antineoplastic drug ecteinascidin-743. Proc. Natl. Acad. Sci. USA 2000, 97, 6780–6784. [Google Scholar] [CrossRef] [PubMed] [Green Version]
  2. Larsen, A.K.; Galmarini, C.M.; D’Incalci, M. Unique features of trabectedin mechanism of action. Cancer Chemother. Pharmacol. 2016, 77, 663–671. [Google Scholar] [CrossRef] [PubMed]
  3. D’Incalci, M.; Galmarini, C.M. A Review of Trabectedin (ET-743): A Unique Mechanism of Action. Mol. Cancer Ther. 2010, 9, 2157–2163. [Google Scholar] [CrossRef] [PubMed] [Green Version]
  4. Takebayashi, Y.; Pourquier, P.; Zimonjic, D.B.; Nakayama, K.; Emmert, S.; Ueda, T.; Urasaki, Y.; Kanzaki, A.; Akiyama, S.I.; Popescu, N.; et al. Antiproliferative activity of ecteinascidin 743 is dependent upon transcription-coupled nucleotide-excision repair. Nat. Med. 2001, 7, 961–966. [Google Scholar] [CrossRef]
  5. Tercero, J.C.; Jimeno, J.; Martinez, N.; Montes-Moreno, S.; Rodriguez-Pinilla, S.M.; Sanchez-Beato, M. Predicting sarcoma-patients response to trabectedin treatment with molecular markers detected by immunohistochemistry. Clin. Cancer Res. 2008, 14, B8. [Google Scholar]
  6. El Bairi, K.; Atanasov, A.G.; Amrani, M.; Afqir, S. The arrival of predictive biomarkers for monitoring therapy response to natural compounds in cancer drug discovery. Biomed. Pharmacother. 2019, 109, 2492–2498. [Google Scholar] [CrossRef]
  7. Broto, J.M.; Fernandez-Serra, A.; Lopez-Pousa, A.; Gutierrez, A.; Penas, R.D.L.; Martinez-Trufero, J.; Cruz, J.; Alvarez, R.M.; Cubedo, R.; Redondo, A.; et al. CUL4A and ERCC1 genesas predictive factors for trabectedin efficacy in advanced soft tissue sarcomas (STS): A Spanish Group for Sarcoma Research (GEIS) study. J. Clin. Oncol. 2016, 34, 11048. [Google Scholar] [CrossRef]
  8. Italiano, A.; Laurand, A.; Laroche, A.; Casali, P.; Sanfilippo, R.; Le Cesne, A.; Judson, I.; Blay, J.Y.; Ray-Coquard, I.; Bui, B.; et al. ERCC5/XPG, ERCC1, and BRCA1 gene status and clinical benefit of trabectedin in patients with soft tissue sarcoma. Cancer 2011, 117, 3445–3456. [Google Scholar] [CrossRef]
  9. Schoffski, P.; Taron, M.; Jimeno, J.; Grosso, F.; Sanfilipio, R.; Casali, P.G.; Le Cesne, A.; Jones, R.L.; Blay, J.Y.; Poveda, A.; et al. Predictive impact of DNA repair functionality on clinical outcome of advanced sarcoma patients treated with trabectedin: A retrospective multicentric study. Eur. J. Cancer (Oxf. Engl. 1990) 2011, 47, 1006–1012. [Google Scholar] [CrossRef]
  10. Massuti, B.; Cobo, M.; Camps, C.; Domine, M.; Provencio, M.; Alberola, V.; Vinolas, N.; Rosell, R.; Taron, M.; Gutierrez-Calderon, V.; et al. Trabectedin in patients with advanced non-small-cell lung cancer (NSCLC) with XPG and/or ERCC1 overexpression and BRCA1 underexpression and pretreated with platinum. Lung Cancer (Amst. Neth.) 2012, 76, 354–361. [Google Scholar] [CrossRef]
  11. Damia, G.; Silvestri, S.; Carrassa, L.; Filiberti, L.; Faircloth, G.T.; Liberi, G.; Foiani, M.; D’Incalci, M. Unique pattern of ET-743 activity in different cellular systems with defined deficiencies in DNA-repair pathways. Int. J. Cancer 2001, 92, 583–588. [Google Scholar] [CrossRef] [Green Version]
  12. Ávila-Arroyo, S.; Nuñez, G.S.; García-Fernández, L.F.; Galmarini, C.M. Synergistic Effect of Trabectedin and Olaparib Combination Regimen in Breast Cancer Cell Lines. J. Breast Cancer 2015, 18, 329–338. [Google Scholar] [CrossRef] [Green Version]
  13. Iovine, B.; Iannella, M.L.; Bevilacqua, M.A. Damage-specific DNA binding protein 1 (DDB1): A protein with a wide range of functions. Int. J. Biochem. Cell Biol. 2011, 43, 1664–1667. [Google Scholar] [CrossRef]
  14. Wang, Q.E.; Zhu, Q.; Wani, G.; Chen, J.; Wani, A.A. UV radiation-induced XPC translocation within chromatin is mediated by damaged-DNA binding protein, DDB2. Carcinogenesis 2004, 25, 1033–1043. [Google Scholar] [CrossRef] [PubMed]
  15. Fitch, M.E.; Cross, I.V.; Turner, S.J.; Adimoolam, S.; Lin, C.X.; Williams, K.G.; Ford, J.M. The DDB2 nucleotide excision repair gene product p48 enhances global genomic repair in p53 deficient human fibroblasts. Dna Repair 2003, 2, 819–826. [Google Scholar] [CrossRef]
  16. Garcia, M.J.; Saucedo-Cuevas, L.P.; Munoz-Repeto, I.; Fernandez, V.; Robles, M.J.; Domingo, S.; Palacios, J.; Aracil, M.; Nieto, A.; Tercero, J.C.; et al. Analysis of DNA repair-related genes in breast cancer reveals CUL4A ubiquitin ligase as a novel biomarker of trabectedin response. Mol. Cancer Ther. 2013, 12, 530–541. [Google Scholar] [CrossRef] [Green Version]
  17. D’Incalci, M.; Zambelli, A. Trabectedin for the treatment of breast cancer. Expert Opin. Investig. Drugs 2016, 25, 105–115. [Google Scholar] [CrossRef] [PubMed]
  18. Laroche, A.; Chaire, V.; Le Loarer, F.; Algéo, M.P.; Rey, C.; Tran, K.; Lucchesi, C.; Italiano, A. Activity of trabectedin and the PARP inhibitor rucaparib in soft-tissue sarcomas. J. Hematol. Oncol. 2017, 10. [Google Scholar] [CrossRef] [PubMed]
  19. Martin-Broto, J.; Pousa, A.L.; de Las Penas, R.; Garcia Del Muro, X.; Gutierrez, A.; Martinez-Trufero, J.; Cruz, J.; Alvarez, R.; Cubedo, R.; Redondo, A.; et al. Randomized Phase II Study of Trabectedin and Doxorubicin Compared With Doxorubicin Alone as First-Line Treatment in Patients With Advanced Soft Tissue Sarcomas: A Spanish Group for Research on Sarcoma Study. J. Clin. Oncol. 2016, 34, 2294–2302. [Google Scholar] [CrossRef] [PubMed]
  20. Le Cesne, A.; Blay, J.Y.; Judson, I.; Van Oosterom, A.; Verweij, J.; Radford, J.; Lorigan, P.; Rodenhuis, S.; Ray-Coquard, I.; Bonvalot, S.; et al. Phase II study of ET-743 in advanced soft tissue sarcomas: A European Organisation for the Research and Treatment of Cancer (EORTC) soft tissue and bone sarcoma group trial. J. Clin. Oncol. Off. J. Am. Soc. Clin. Oncol. 2005, 23, 576–584. [Google Scholar] [CrossRef] [Green Version]
  21. Demetri, G.D.; Chawla, S.P.; von Mehren, M.; Ritch, P.; Baker, L.H.; Blay, J.Y.; Hande, K.R.; Keohan, M.L.; Samuels, B.L.; Schuetze, S.; et al. Efficacy and safety of trabectedin in patients with advanced or metastatic liposarcoma or leiomyosarcoma after failure of prior anthracyclines and ifosfamide: Results of a randomized phase II study of two different schedules. J. Clin. Oncol. Off. J. Am. Soc. Clin. Oncol. 2009, 27, 4188–4196. [Google Scholar] [CrossRef] [PubMed]
  22. Jones, R.L.; Demetri, G.D.; Schuetze, S.M.; Milhem, M.; Elias, A.; Van Tine, B.A.; Hamm, J.; McCarthy, S.; Wang, G.; Parekh, T.; et al. Efficacy and tolerability of trabectedin in elderly patients with sarcoma: Subgroup analysis from a phase III, randomized controlled study of trabectedin or dacarbazine in patients with advanced liposarcoma or leiomyosarcoma. Ann. Oncol. Off. J. Eur. Soc. Med. Oncol. 2018, 29, 1995–2002. [Google Scholar] [CrossRef] [PubMed]
  23. D’Incalci, M.; Badri, N.; Galmarini, C.M.; Allavena, P. Trabectedin, a drug acting on both cancer cells and the tumour microenvironment. Br. J. Cancer 2014, 111, 646–650. [Google Scholar] [CrossRef] [PubMed] [Green Version]
  24. Brodowicz, T. Trabectedin in soft tissue sarcomas. Future Oncol. 2014, 10, s1–s5. [Google Scholar] [CrossRef]
  25. Wang, Y.; Ma, G.; Wang, Q.; Wen, M.; Xu, Y.; He, X.; Zhang, P.; Wang, Y.; Yang, T.; Zhan, P.; et al. Involvement of CUL4A in regulation of multidrug resistance to P-gp substrate drugs in breast cancer cells. Molecules 2013, 19, 159–176. [Google Scholar] [CrossRef] [Green Version]
  26. Martin-Broto, J.; Gutierrez, A.M.; Ramos, R.F.; Lopez-Guerrero, J.A.; Ferrari, S.; Stacchiotti, S.; Picci, P.; Calabuig, S.; Collini, P.; Gambarotti, M.; et al. MRP1 overexpression determines poor prognosis in prospectively treated patients with localized high-risk soft tissue sarcoma of limbs and trunk wall: An ISG/GEIS study. Mol. Cancer Ther. 2014, 13, 249–259. [Google Scholar] [CrossRef] [Green Version]
  27. Villar, V.H.; Vogler, O.; Martinez-Serra, J.; Ramos, R.; Calabuig-Farinas, S.; Gutierrez, A.; Barcelo, F.; Martin-Broto, J.; Alemany, R. Nilotinib counteracts P-glycoprotein-mediated multidrug resistance and synergizes the antitumoral effect of doxorubicin in soft tissue sarcomas. PLoS ONE 2012, 7, e37735. [Google Scholar] [CrossRef]
  28. Hannah, J.; Zhou, P. Distinct and overlapping functions of the cullin E3 ligase scaffolding proteins CUL4A and CUL4B. Gene 2015, 573, 33–45. [Google Scholar] [CrossRef] [Green Version]
  29. Bret, C.; Klein, B.; Moreaux, J. Nucleotide excision DNA repair pathway as a therapeutic target in patients with high-risk diffuse large B cell lymphoma. Cell Cycle (Georget. Tex.) 2013, 12, 1811–1812. [Google Scholar] [CrossRef] [Green Version]
  30. Saffi, J.; Agnoletto, M.H.; Guecheva, T.N.; Batista, L.F.Z.; Carvalho, H.; Henriques, J.A.P.; Stary, A.; Menck, C.F.M.; Sarasin, A. Effect of the anti-neoplastic drug doxorubicin on XPD-mutated DNA repair-deficient human cells. Dna Repair 2010, 9, 40–47. [Google Scholar] [CrossRef]
  31. Sun, S.; Osterman, M.D.; Li, M. Tissue specificity of DNA damage response and tumorigenesis. Cancer Biol. Med. 2019, 16, 396–414. [Google Scholar] [CrossRef] [PubMed]
  32. Broto, J.M.; Lopez-Pousa, A.; Ramos, R.; Gronchi, A.; Casali, P.G.; Gutierrez, A.; Picci, P.; Ferrari, S.; Cruz, J.; Fra, P.L.; et al. Relationship of CUL4A gene underexpression and prognosis in localized high-risk soft tissue sarcoma (STS) patients of limbs or trunk wall. J. Clin. Oncol. 2012, 30, 10079. [Google Scholar] [CrossRef]
  33. Kane, J.M., 3rd; Magliocco, A.; Zhang, Q.; Wang, D.; Klimowicz, A.; Harris, J.; Simko, J.; DeLaney, T.; Kraybill, W.; Kirsch, D.G. Correlation of High-Risk Soft Tissue Sarcoma Biomarker Expression Patterns with Outcome following Neoadjuvant Chemoradiation. Sarcoma 2018, 2018, 8310950. [Google Scholar] [CrossRef] [PubMed]
  34. Hindi, N.; Ramos, R.; Martinez-Trufero, J.; Alvarez, R.M.A.; Cordeiro, M.; Sande, L.M.G.d.; Marquina, G.; Cano, J.M.; Cruz, J.; Morales, C.M.V.; et al. Prognostic role of HMG proteins in a series of 301 advanced soft tissue sarcoma patients: A Spanish Group for Sarcoma Research Study (GEIS). J. Clin. Oncol. 2018, 36, 11573. [Google Scholar] [CrossRef]
  35. Livak, K.J.; Schmittgen, T.D. Analysis of relative gene expression data using real-time quantitative PCR and the 2(-Delta Delta C(T)) Method. Methods (San. Diegocalif.) 2001, 25, 402–408. [Google Scholar] [CrossRef]
  36. Groisman, R.; Polanowska, J.; Kuraoka, I.; Sawada, J.-i.; Saijo, M.; Drapkin, R.; Kisselev, A.F.; Tanaka, K.; Nakatani, Y. The Ubiquitin Ligase Activity in the DDB2 and CSA Complexes Is Differentially Regulated by the COP9 Signalosome in Response to DNA Damage. Cell 2003, 113, 357–367. [Google Scholar] [CrossRef] [Green Version]
Figure 1. Prognostic and predictive value of DNA-damage repair genes. Samples were grouped taking into account the median of gene expression. (A) high expression of CUL4A significantly correlated with better progression-free survival (PFS) on trabectedin plus doxorubicin arm (6.53 months (95% CI: 0.00–13.39) vs 1.80 months (95% CI: 0.00–3.63); p = 0.038); (B) high expression of ERCC1 significantly correlated with better (PFS) on trabectedin plus doxorubicin arm (8.10 months (95% CI: 4.77–11.43) vs 2.63 months (95% CI: 0.41–4.86) p = 0.006) and (C) high expression of ERCC5 significantly correlated with better PFS on trabectedin plus doxorubicin arm (7.67 months (95% CI: 5.64–9.69) vs 1.70 months (95% CI: 1.05–2.35); p = 0.039).
Cancers 12 01128 g001
Figure 2. Prognostic and predictive value of CUL4A protein expression. Samples were grouped as CUL4A positive or negative, taking into account the nuclear expression levels evaluated by immunohistochemistry. Antibody: anti-CUL4A polyclonal antibody (1:50, 2699s, Cell Signaling Technology, Danvers, MA, USA). In the whole series CUL4A protein expression was associated with worse PFS (A): 2.60 months (95% CI: 0.58–4.62) vs 7.03 months (95% CI: 5.03–9.04), p = 0.009; and (B) and with worse OS (B): 10.57 months (95% CI: 5.95–15.18) vs 21.07 months (95% CI: 17.70–24.43), p = 0.001. In the doxorubicin arm, CUL4A expression was also associated with worse PFS (C): 2.53 months (95% CI: 1.12–4.00) vs 7.4 months (95% CI: 4.45–10.35), p = 0.025 and worse OS (D): 8.73 months (95% CI: 4.62–12.84) vs 27.03 months (95% CI: 16.99–37.08), p = 0.004. In the combination series, CUL4A protein expression did not correlate with PFS (E): 3.40 months (95% CI: 0.83–6.00) vs 5.77 months (95% CI: 4.25–7.28), p = 0.127, nor OS (F): 14.23 months (95% CI: 5.68–22.79) 19.70 months (95% CI: 8.82–30.58), p = 0.176.
Cancers 12 01128 g002
Table 1. Demographics and clinical-pathologic information (n = 66).
Median Age (Range)52 (21–72)
Sex:
Female31 (47%)
Male35 (53%)
Median tumor Size (mm) (Range)90 (2–300)
Histological Grade:
110 (15.6%)
218 (28.1%)
336 (56.3%)
Primary tumor site
Extremity25 (38.4%)
Head and neck2 (3.1%)
Trunk wall3 (4.6%)
Retroperitoneum15 (23.1%)
Others20 (30.8%)
Disease type
Localized38 (62.3%)
Metastatic23 (37.7%)
Sarcoma subtypes:
Leiomyosarcoma22 (33.3%)
Liposarcoma12 (18.1%)
UPS *12 (18.1%)
Fibrosarcoma4 (6.1%)
Haemangiopericytoma3 (4.6%)
MPNST **3 (4.6%)
Synovial Sarcoma3 (4.6%)
Others ***7 (10.6%)
Experimental Arm
Doxorubicin34 (51.5%)
Doxorubicin plus Trabectedin32 (48.5%)
* UPS: Undifferentiated pleomorphic sarcoma; ** MPNST: Malignant peripheral nerve sheath tumor. *** Others: Angiosarcoma (n = 1) and Unclassified sarcoma (n = 6).
Table 2. Gene expression results.
GeneMedian Expression 1 in Whole Series (Range)Median Expression 1 in Control Arm (Range)Median Expression 1 in Experimental Arm (Range)
BRCA1 (n = 64)0.52 (0.04–3.75)0.47 (0.08–2.97)0.59 (0.04–3.75)
CUL4A (n = 65)1.31 (0.10–31.07)1.20 (0.24–7.79)1.46 (0.10–31.07)
ERCC1 (n = 64)1.18 (0.11–10.82)1.14 (0.16–7.70)1.22 (0.11–10.82)
ERCC5 (n = 66)0.37 (0.01–7.07)0.37 (0.02–1.45)0.39 (0.01–7.07)
1 2−ΔΔCT, median relative expression.
Table 3. Survival analysis in accordance to gene expression.
Whole Series 1
BiomarkerMedian PFS (Months)
(95% CI)
pMedian OS (Months)
(95% CI)
p
BRCA1 (n = 64) 0.902 0.684
Below median (n = 32)4.60 (0.00–9.22)22.47 (4.43–40.51)
Above median (n = 32)5.70 (3.02–8.38)17.47 (12.15–22.78)
CUL4A (n = 65) 0.173 0.343
Below median (n = 33)4.60 (0.25–8.95)14.03 (4.68–23.39)
Above median (n = 32)5.50 (2.17–8.83)21.83 (11.62–32.05)
ERCC1 (n = 64) 0.696 0.406
Below median (n = 32)3.73 (0.30–7.23)17.47 (2.99–31.94)
Above median (n = 32)5.50 (2.87–8.13)17.97 (10.75–25.18)
ERCC5 (n = 66) 0.559 0.593
Below median (n = 33)4.60 (1.15–8.05)17.97 (6.89–29.04)
Above median (n = 33)5.97 (1.99–9.94)17.47 (7.38–27.56)
Control Group 2
BiomarkerMedian PFS (months)
(95% CI)
pMedian OS (months)
(95% CI)
p
BRCA1 (n = 34) 0.642 0.406
Below median (n = 17)5.43 (1.18–9.69)8.73 (-)
Above median (n = 17)6.03 (0.12–11.95)17.97 (11.16–24.77)
CUL4A (n = 33) 0.626 0.994
Below median (n = 16)4.60 (0.00–12.70)-
Above median (n = 17)5.50 (0.97–10.03)15.10 (7.41–22.79)
ERCC1 (n = 32) 0.321 0.871
Below median (n = 16)6.93 (3.80–10.07)27.03 (0.00–61.26)
Above median (n = 16)2.53 (0.18–4.89)13.73 (9.96–17.51)
ERCC5 (n = 34) 0.515 0.746
Below median (n = 17)6.93 (4.78–9.09)-
Above median (n = 17)2.60 (0.00–8.02)13.73 (9.51–17.96)
Experimental Group 3
BiomarkerMedian PFS (months)
(95% CI)
pMedian OS (months)
(95% CI)
p
BRCA1 (n = 30) 0.420 0.608
Below median (n = 15)1.70 (0.00–4.02)14.23 (13.22–15.24)
Above median (n = 15)5.70 (0.87–10.54)21.07 (10.37–31.77)
CUL4A (n = 32) 0.038 0.059
Below median (n = 16)1.80 (0.00–3.63)13.53 (6.25–20.81)
Above median (n = 16)6.53 (0.00–13.39)22.63 (17.02–28.25)
ERCC1 (n = 32) 0.006 0.295
Below median (n = 16)2.63 (0.41–4.86)14.03 (5.73–22.34)
Above median (n = 16)8.10 (4.77–11.43)21.07 (11.32–30.81)
ERCC5 (n = 32) 0.039 0.521
Below median (n = 16)1.70 (1.05–2.35)13.53 (5.94–21.13)
Above median (n = 16)7.67 (5.64–9.69)21.07 (15.04–27.09)
1 Whole series: includes all the cases from both arms; 2 Control Group: Doxorubicin; 3 Experimental Group: Doxorubicin plus Trabectedin. The median values were calculated for each gene in the whole series and in each treatment group.
Table 4. Trabectedin IC50 and gene expression levels in soft-tissue sarcoma (STS) cell lines.
Cell lineIC50 (pM)CUL4A *ERCC1 *ERCC5 *
93T4491560.00460.01790.0006
AA1070.01060.03180.0007
CP00243990.00990.02520.0019
HT-10801480.00830.02630.0022
SK-UT-1870.03230.06850.0015
SW8721420.01240.02700.0068
SW982900.01030.04030.0022
Spearman's rank correlation coefficient (ρ) **CUL4A *ERCC1 *ERCC5 *
Trabectedin IC50−0.750−0.964−0.143
p = 0.052p < 0.001p = 0.760
* Absolute mean levels (∆CT); ** Spearman’s rank correlation coefficient between trabectedin IC50 and gene expression values.

