Near-Infrared Molecular Imaging of Glioblastoma by Miltuximab®-IRDye800CW as a Potential Tool for Fluorescence-Guided Surgery

 , , ,
, , ,  ,
,  and
and 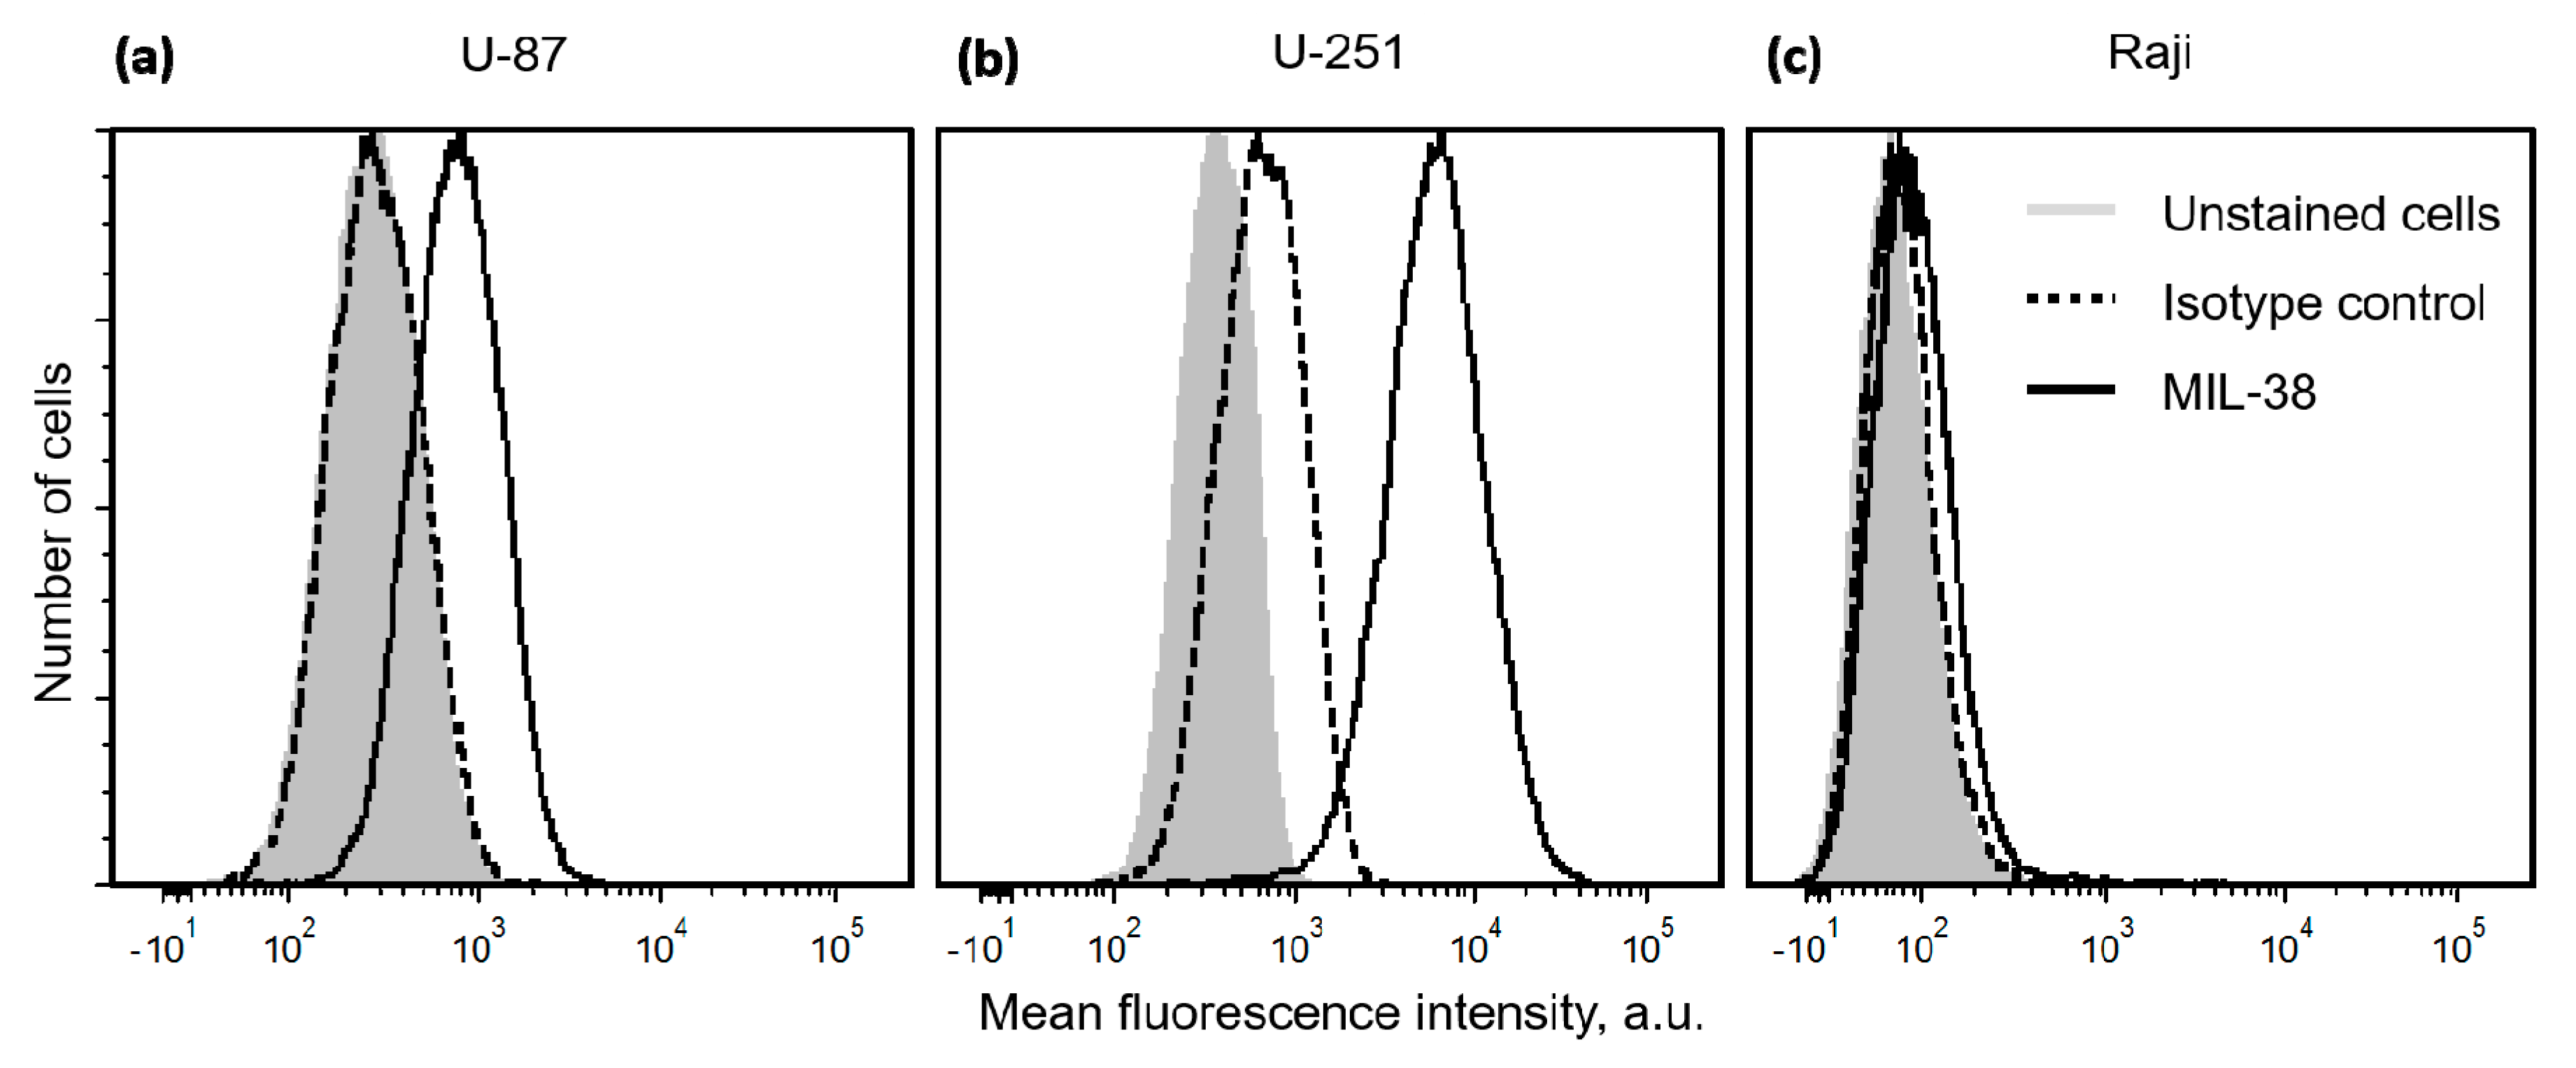
Abstract
1. Introduction
2. Results
2.1. Expression of Glypican-1 in Glioblastoma Cell Lines
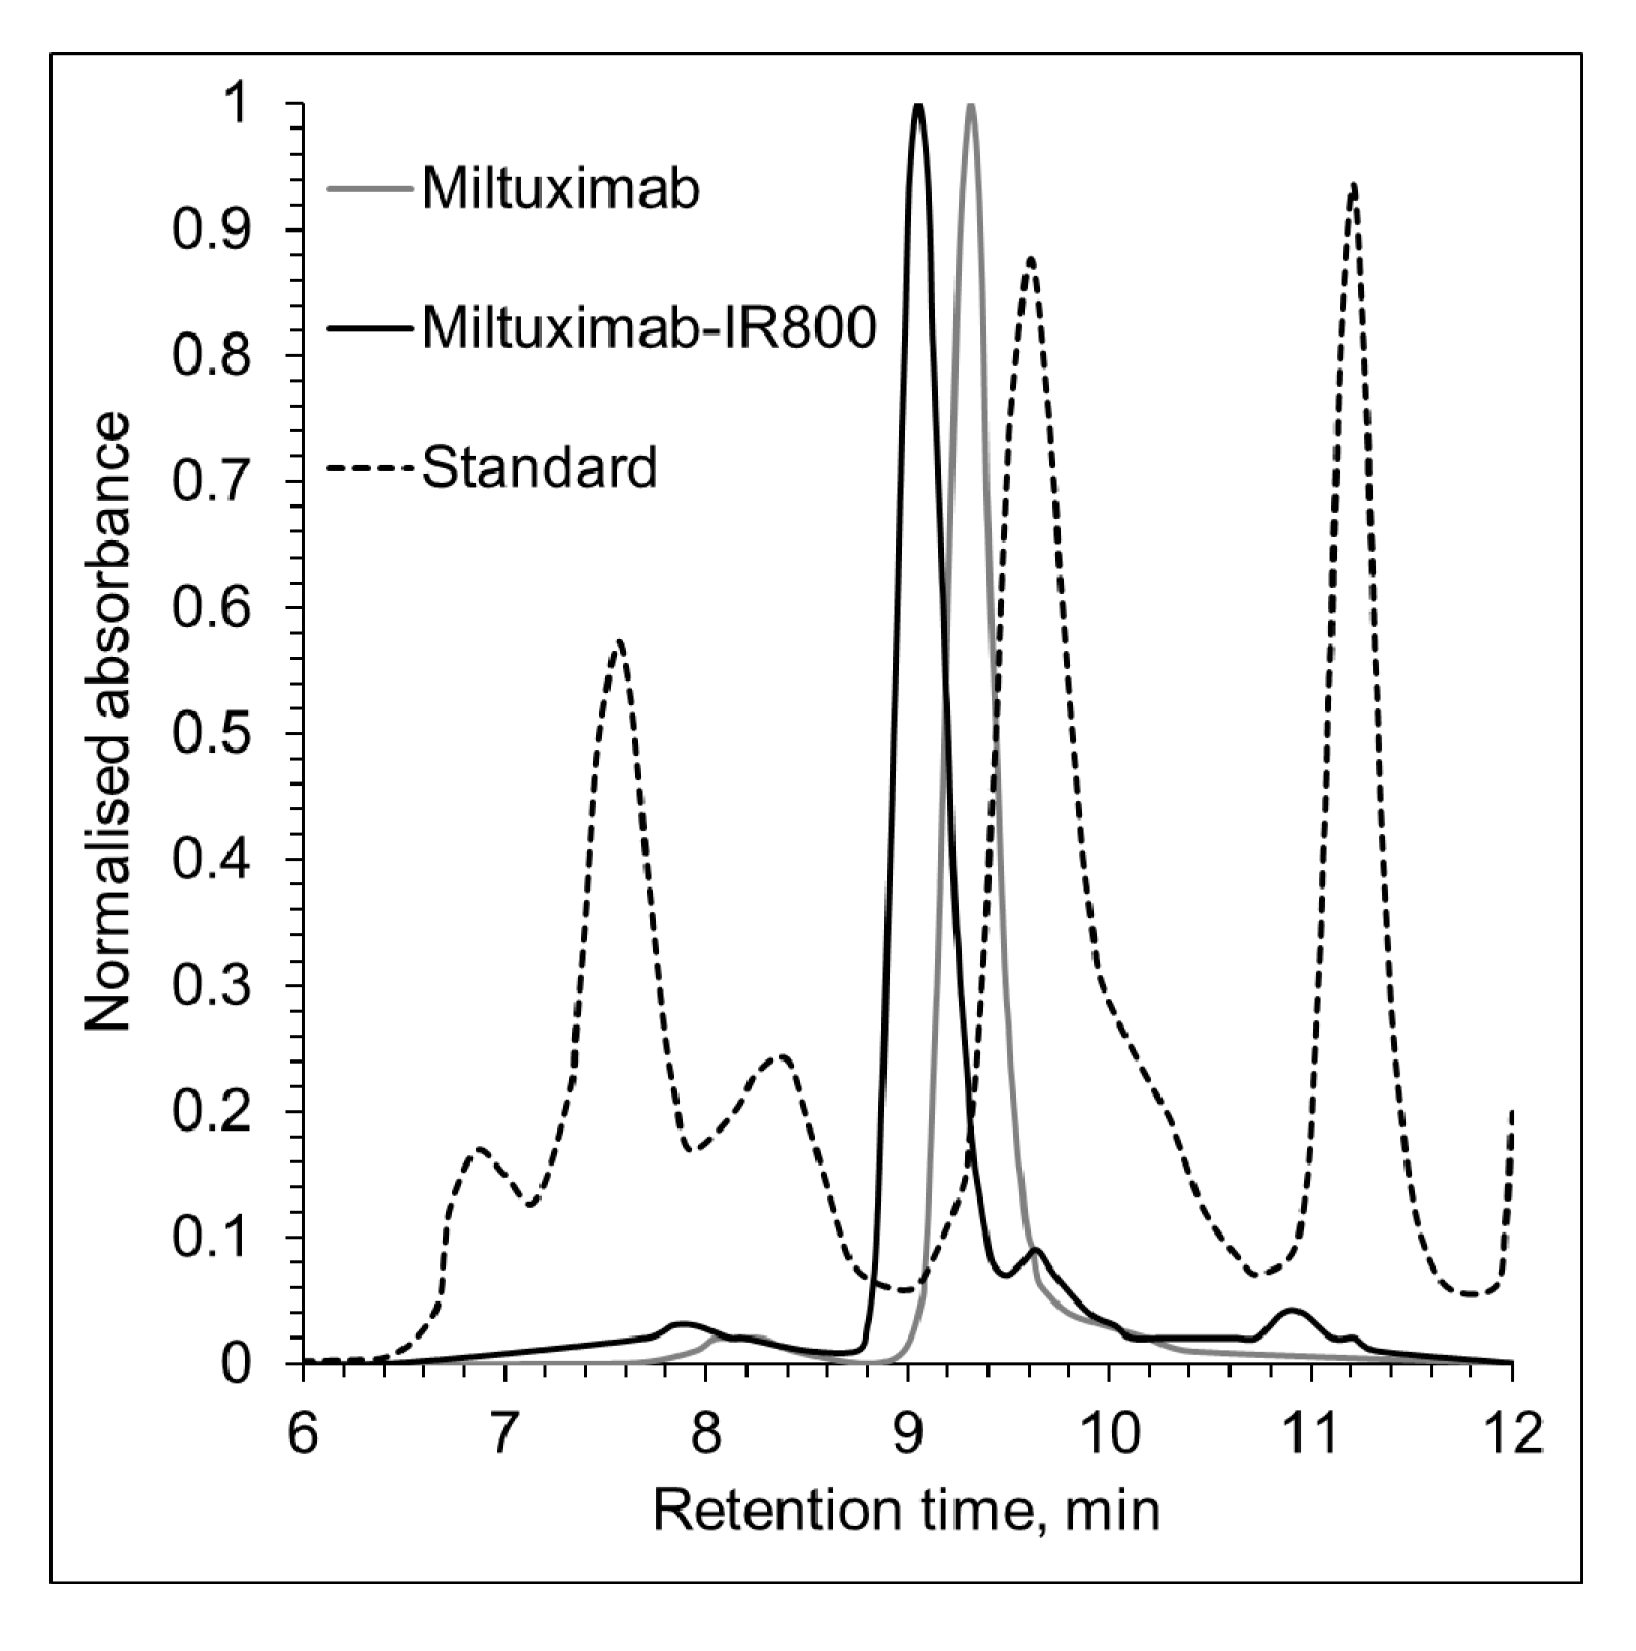
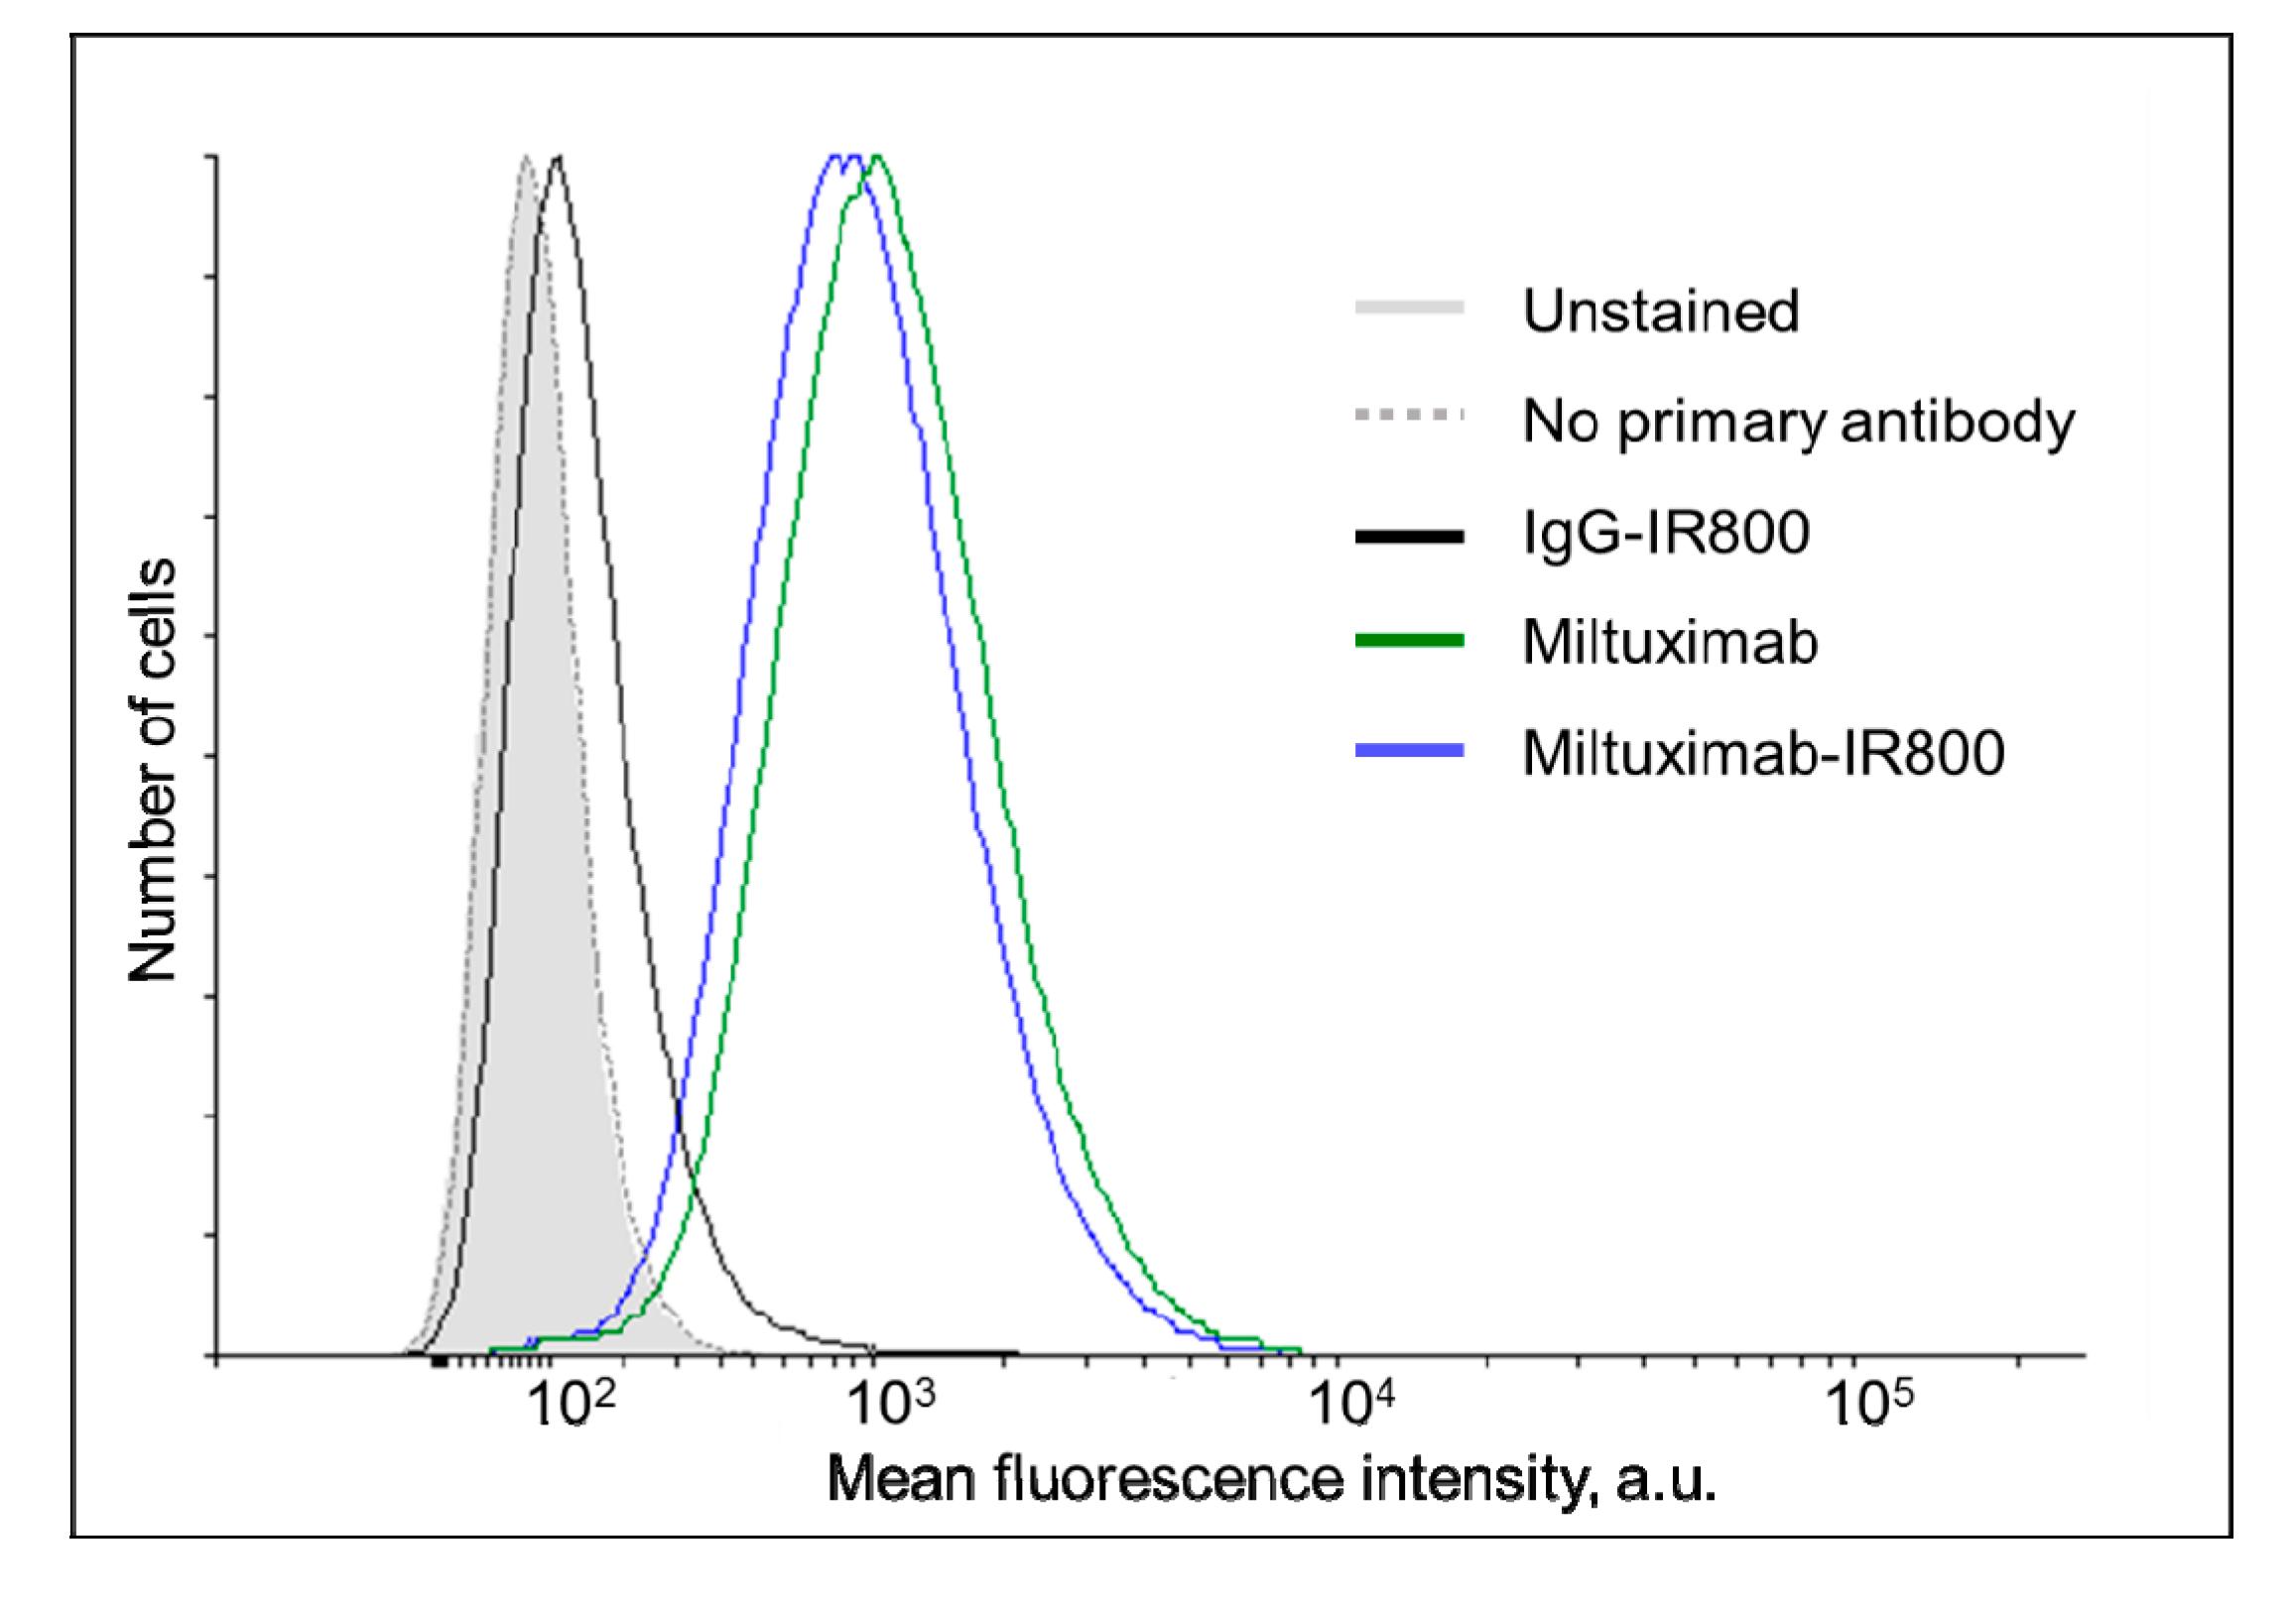
2.2. Characterization of Miltuximab®-IR800
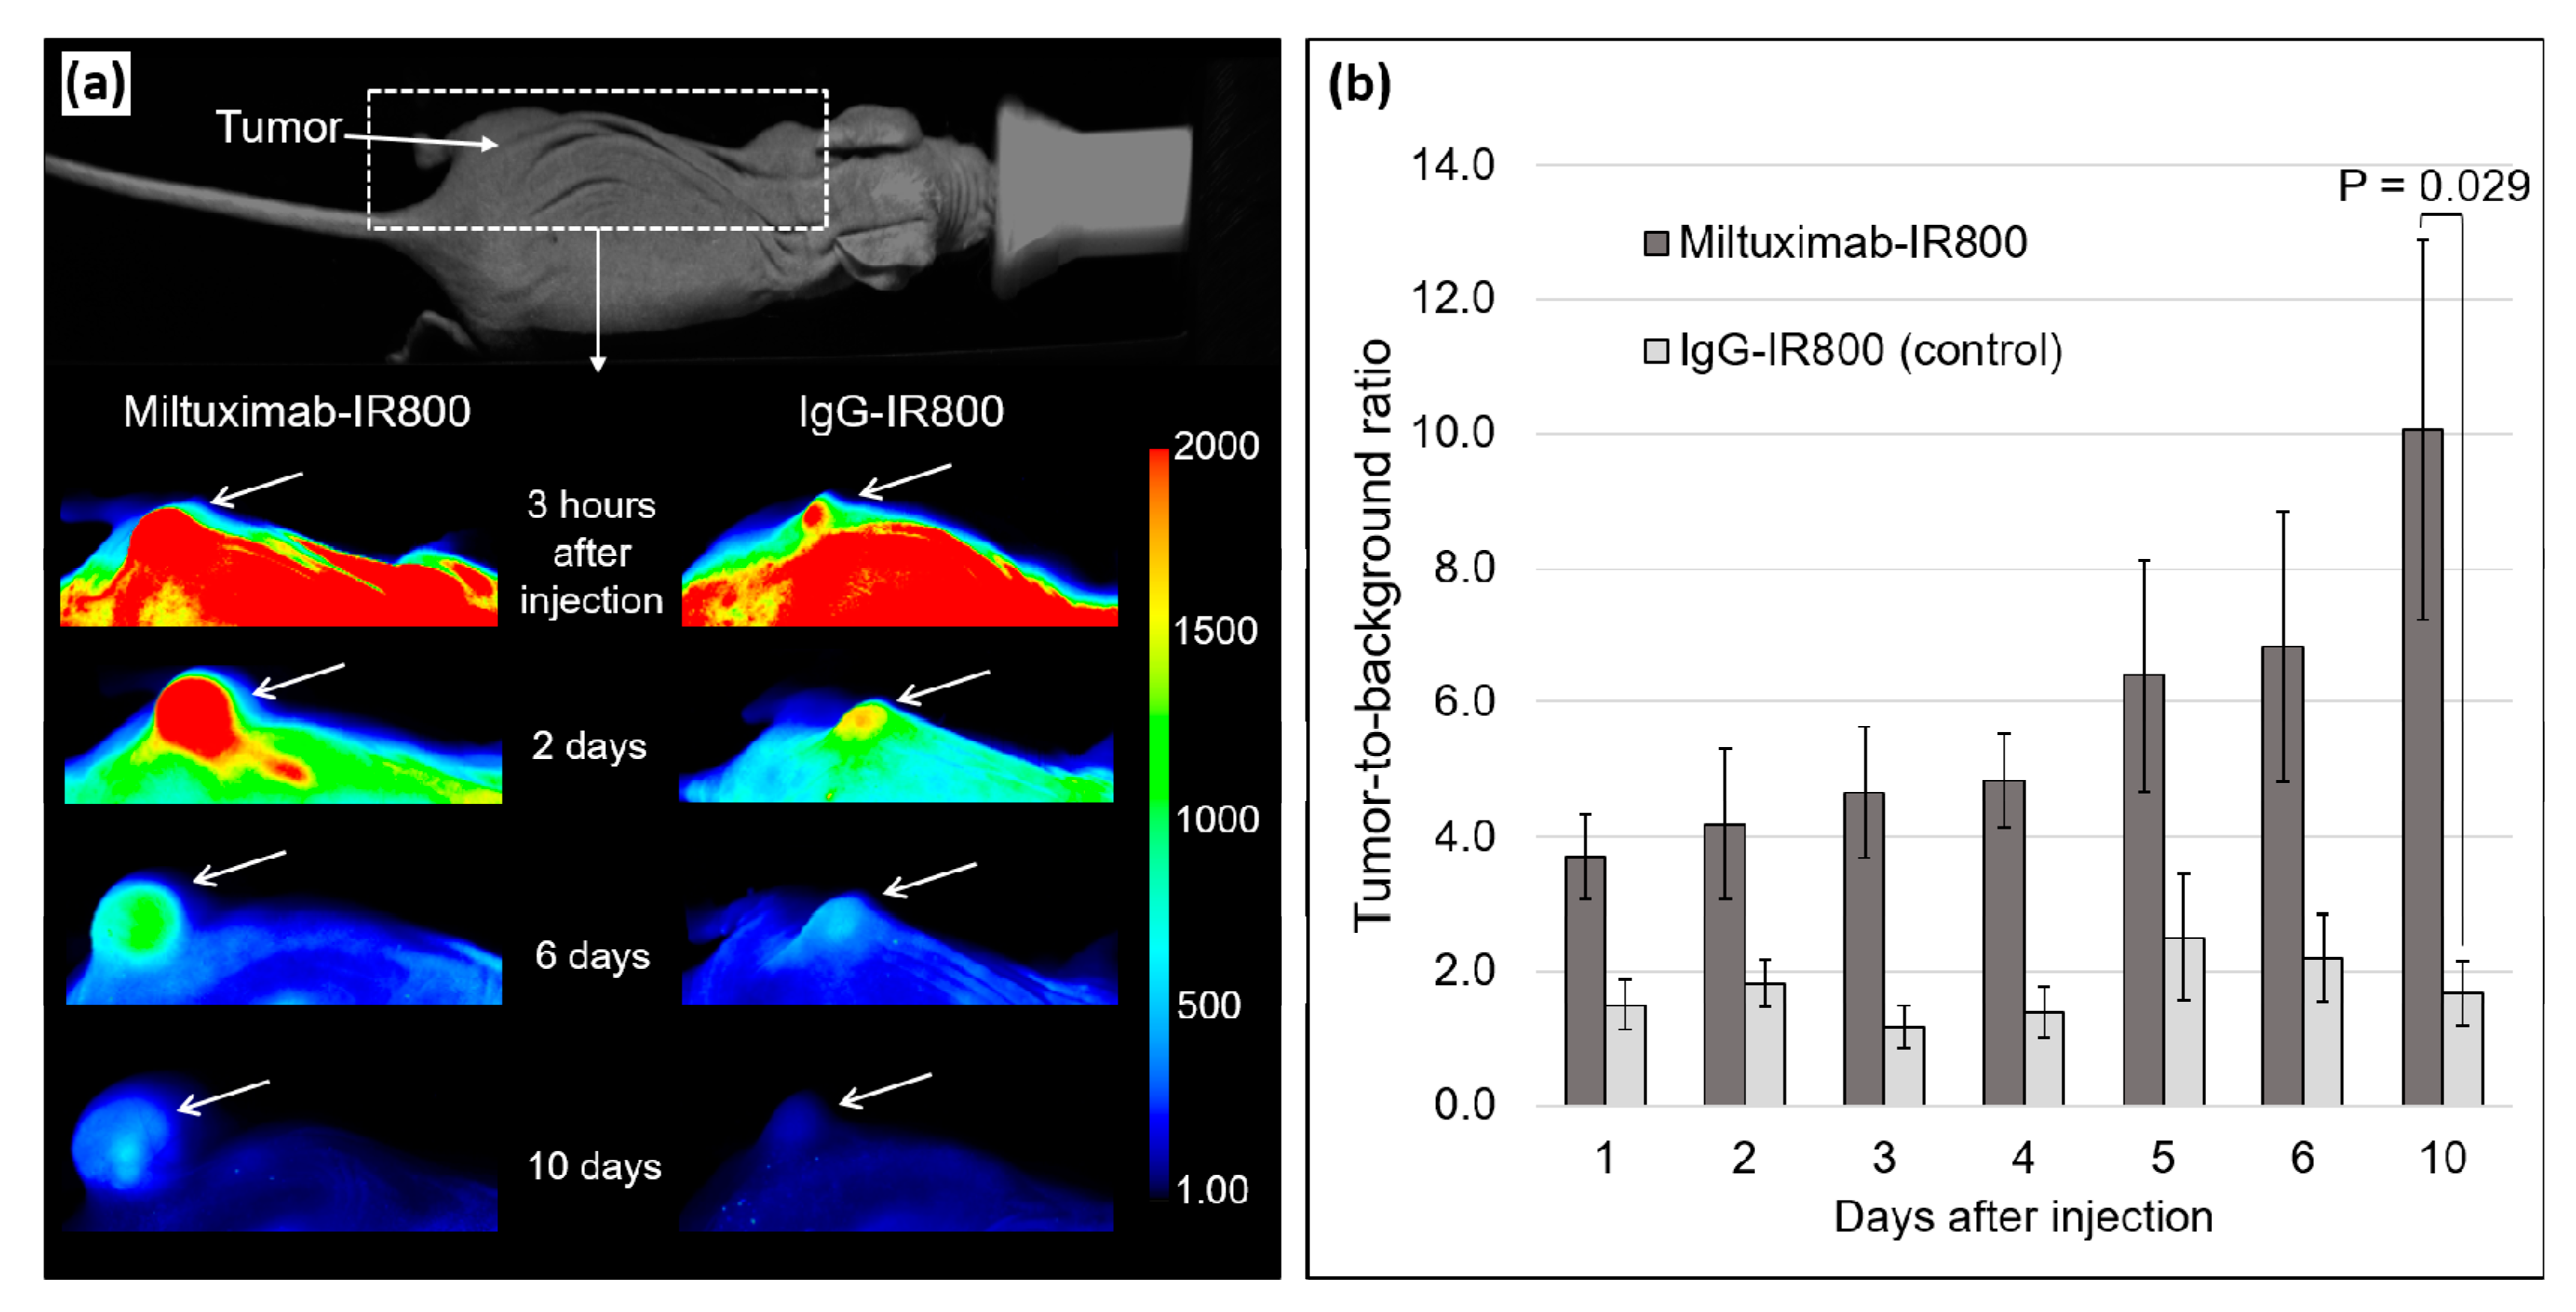
2.3. In Vivo Fluorescence Imaging
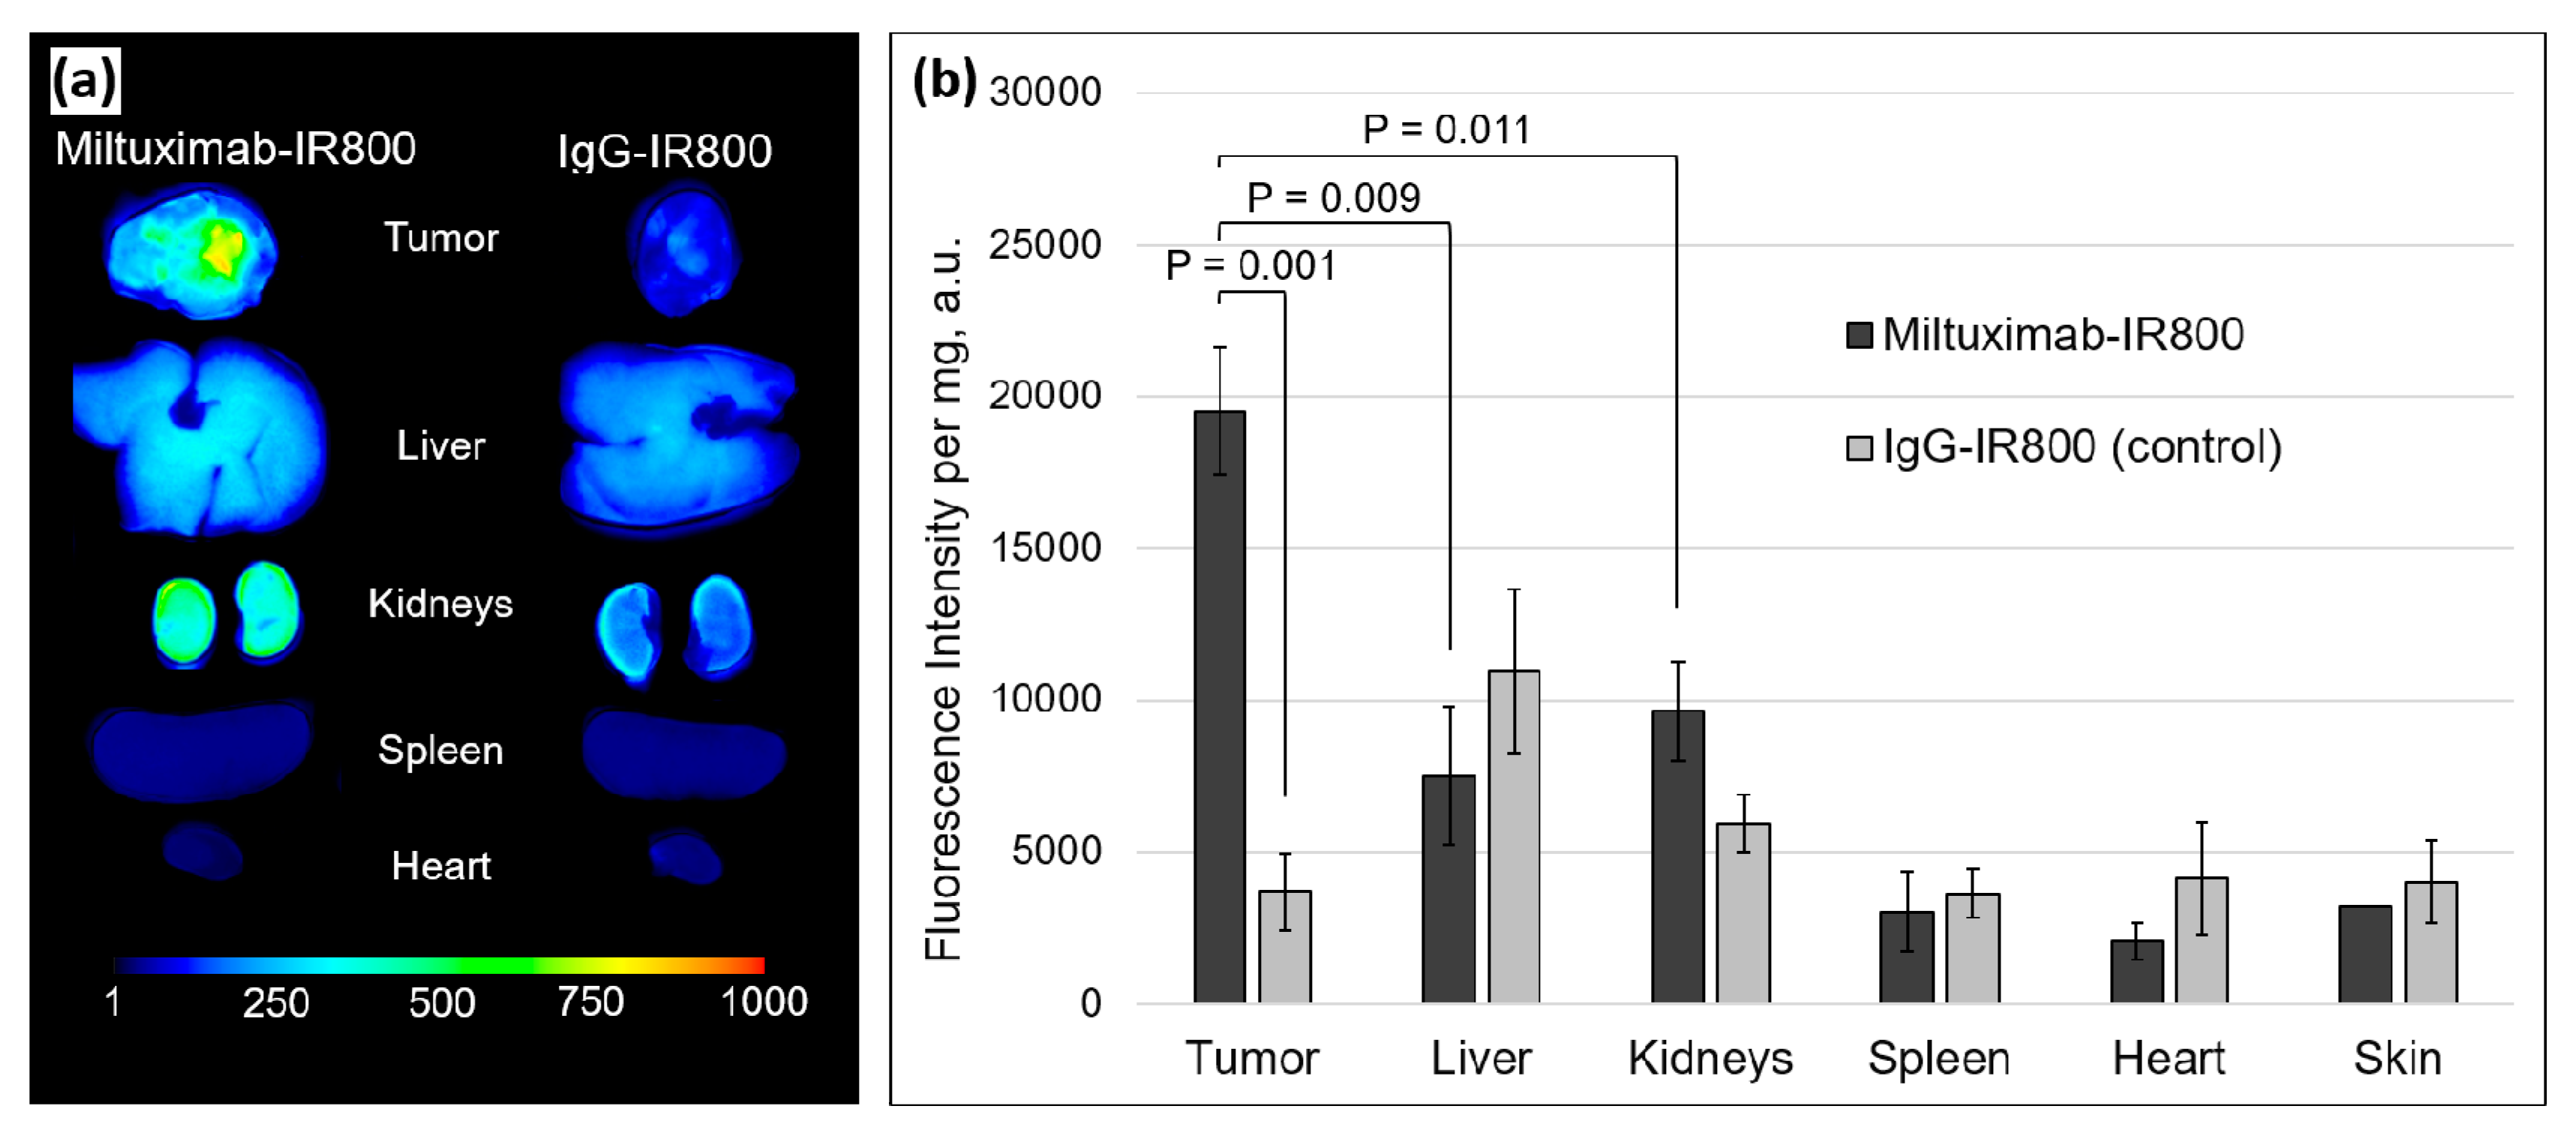
2.4. Ex Vivo Fluorescence of the Tumors and Major Organs
3. Discussion
4. Materials and Methods
4.1. Cell Lines
4.2. Quantification of Glypican-1 Expression on the Surface of Glioblastoma Cells
4.3. Conjugation and Characterization of Miltuximab®-IR800
4.4. Establishment of a Subcutaneous Mouse Model of Glioblastoma
4.5. In Vivo Imaging of the Subcutaneous Tumors
4.6. Ex Vivo Imaging and Biodistribution Study
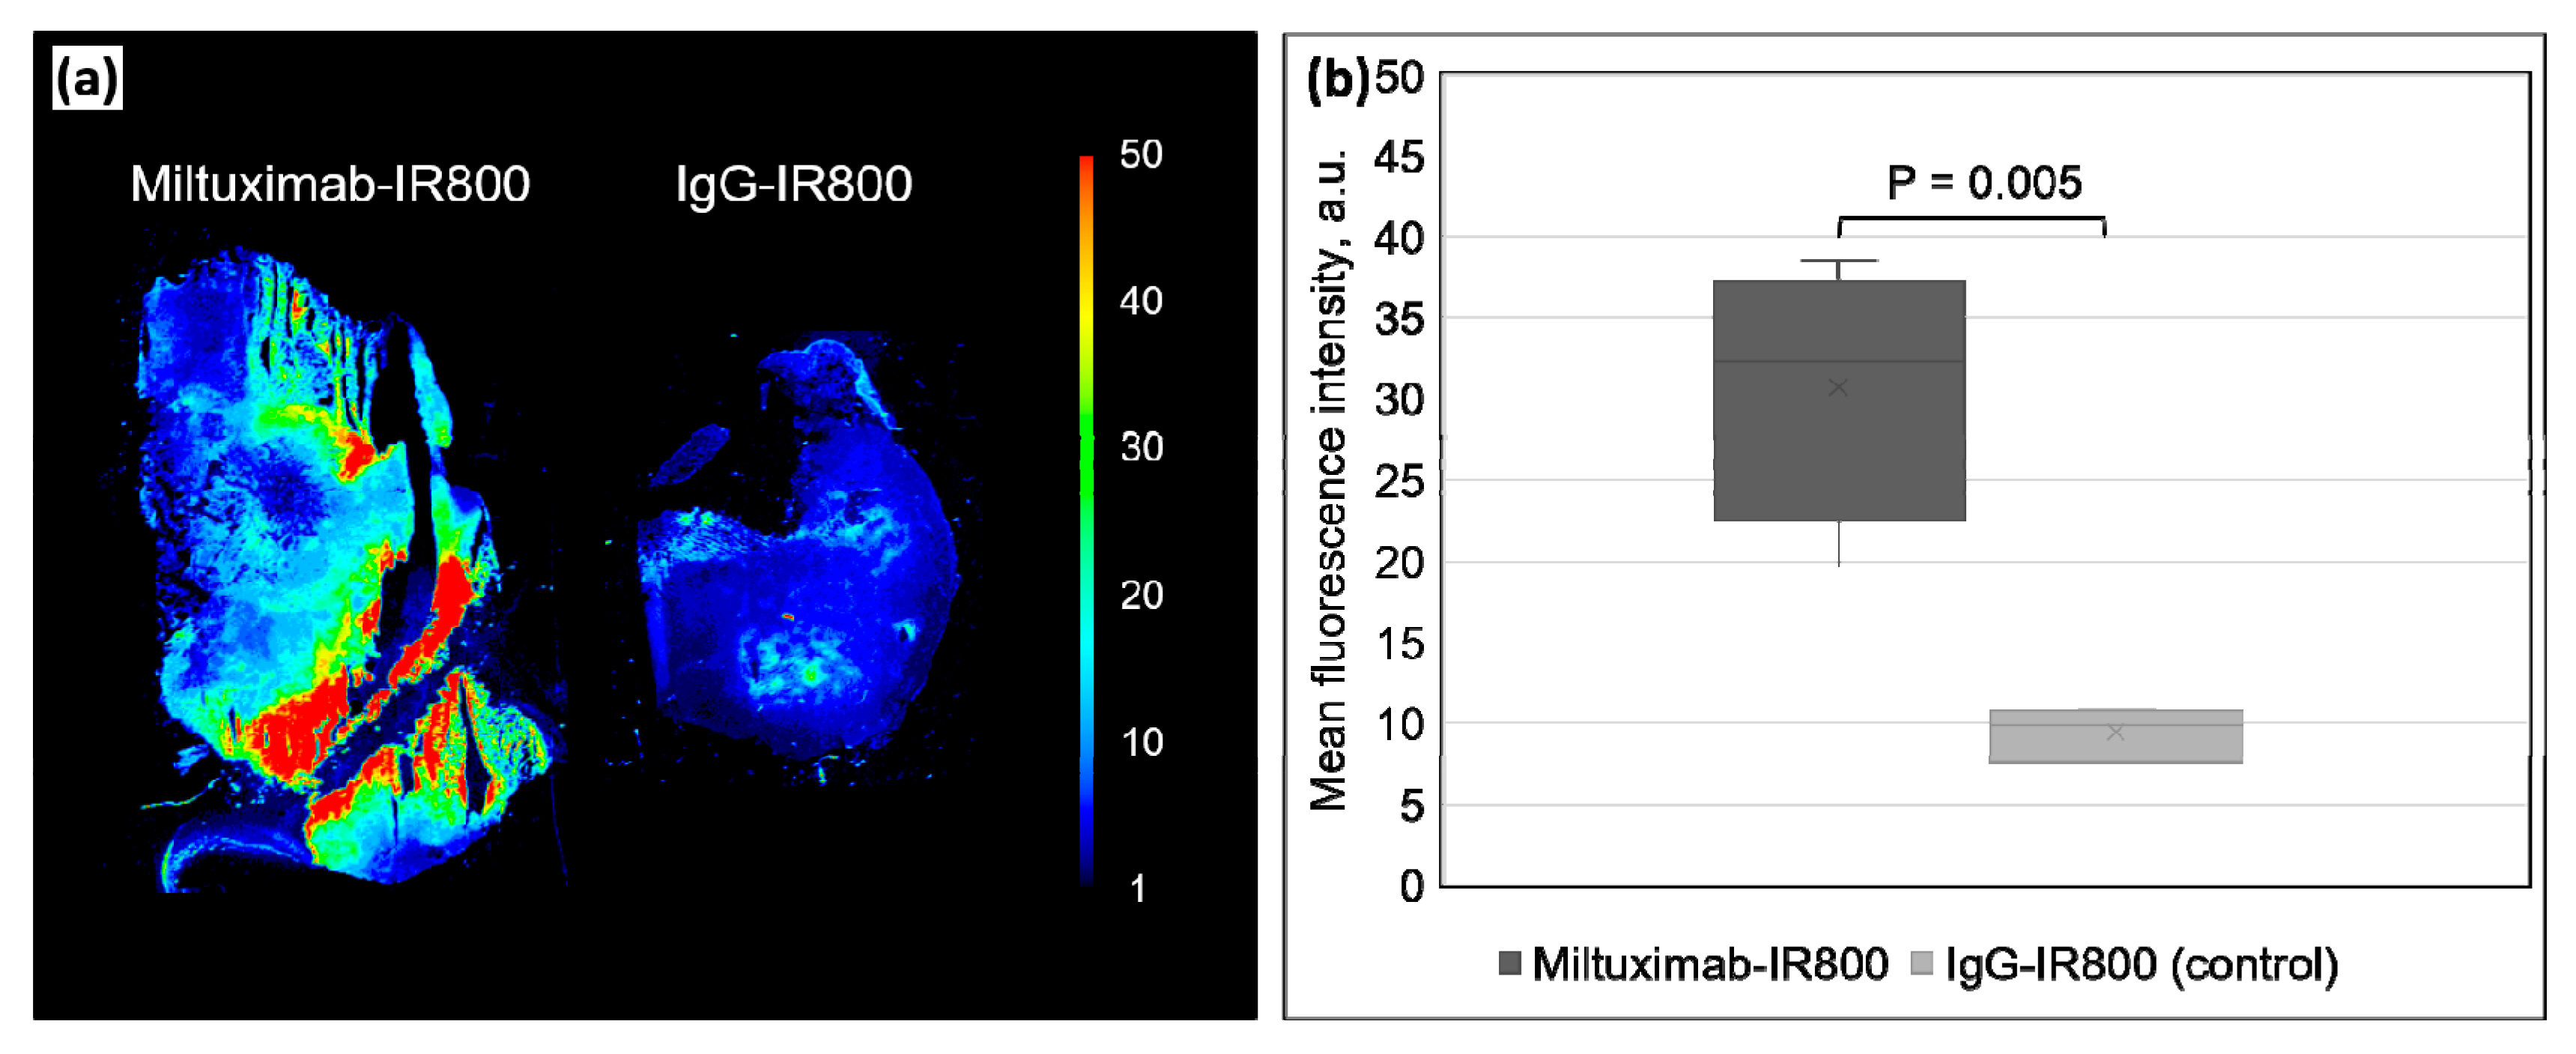
4.7. Ex Vivo Fluorescence Imaging of Sectioned Tumors
4.8. Statistical Analysis
5. Conclusions
Author Contributions
Funding
Acknowledgments
Conflicts of Interest
References
- Louis, D.N.; Perry, A.; Reifenberger, G.; von Deimling, A.; Figarella-Branger, D.; Cavenee, W.K.; Ohgaki, H.; Wiestler, O.D.; Kleihues, P.; Ellison, D.W. The 2016 world health organization classification of tumors of the central nervous system: A summary. Acta Neuropathol. 2016, 131, 803–820. [Google Scholar] [CrossRef] [PubMed]
- D’Amico, R.S.; Kennedy, B.C.; Bruce, J.N. Neurosurgical oncology: Advances in operative technologies and adjuncts. J. Neuro-oncol. 2014, 119, 451–463. [Google Scholar] [CrossRef] [PubMed]
- Lacroix, M.; Abi-Said, D.; Fourney, D.R.; Gokaslan, Z.L.; Shi, W.; DeMonte, F.; Lang, F.F.; McCutcheon, I.E.; Hassenbusch, S.J.; Holland, E.; et al. A multivariate analysis of 416 patients with glioblastoma multiforme: Prognosis, extent of resection, and survival. J. Neurosurg. 2009, 95, 190–198. [Google Scholar] [CrossRef] [PubMed]
- Ostrom, Q.T.; Gittleman, H.; Xu, J.; Kromer, C.; Wolinsky, Y.; Kruchko, C.; Barnholtz-Sloan, J.S. CBTRUS statistical report: Primary brain and other central nervous system tumors diagnosed in the United States in 2009–2013. Neuro-oncology 2016, 18 (Suppl. 5), v1–v75. [Google Scholar] [CrossRef] [PubMed]
- Schucht, P.; Beck, J.; Seidel, K.; Raabe, A. Extending resection and preserving function: Modern concepts of glioma surgery. Swiss Med. Wkly. 2015, 145, w14082. [Google Scholar] [CrossRef] [PubMed]
- Brown, T.J.; Brennan, M.C.; Li, M.; Church, E.W.; Brandmeir, N.J.; Rakszawski, K.L.; Patel, A.S.; Rizk, E.B.; Suki, D.; Sawaya, R.; et al. Association of the extent of resection with survival in glioblastoma. JAMA Oncol. 2016, 2, 1460–1469. [Google Scholar] [CrossRef]
- Sanai, N.; Polley, M.-Y.; McDermott, M.W.; Parsa, A.T.; Berger, M.S. An extent of resection threshold for newly diagnosed glioblastomas. J. Neurosurg. 2011, 115, 3–8. [Google Scholar] [CrossRef]
- Young, R.M.; Jamshidi, A.; Davis, G.; Sherman, J.H. Current trends in the surgical management and treatment of adult glioblastoma. Ann. Transl. Med. 2015, 3, 121. [Google Scholar]
- Liu, J.T.C.; Meza, D.; Sanai, N. Trends in fluorescence image-guided surgery for gliomas. Neurosurgery 2014, 75, 61–71. [Google Scholar] [CrossRef]
- Senders, J.T.; Muskens, I.S.; Schnoor, R.; Karhade, A.V.; Cote, D.J.; Smith, T.R.; Broekman, M.L.D. Agents for fluorescence-guided glioma surgery: A systematic review of preclinical and clinical results. Acta Neurochir. 2017, 159, 151–167. [Google Scholar] [CrossRef]
- Van Keulen, S.; Nishio, N.; Fakurnejad, S.; Birkeland, A.; Martin, B.A.; Lu, G.; Zhou, Q.; Chirita, S.U.; Forouzanfar, T.; Colevas, A.D.; et al. The clinical application of fluorescence-guided surgery in head and neck cancer. J. Nucl. Med. 2019, 60, 758–763. [Google Scholar] [CrossRef] [PubMed]
- Shinoda, J.; Yano, H.; Yoshimura, S.I.; Okumura, A.; Kaku, Y.; Iwama, T.; Sakai, N. Fluorescence-guided resection of glioblastoma multiforme by using high-dose fluorescein sodium. Technical note. J. Neurosurg. 2003, 93, 1003–1013. [Google Scholar]
- Haglund, M.M.; Berger, M.S.; Hochman, D.W. Enhanced optical imaging of human gliomas and tumor margins. Neurosurgery 1996, 38, 308–317. [Google Scholar] [CrossRef] [PubMed]
- Eyupoglu, I.Y.; Hore, N.; Fan, Z.; Buslei, R.; Merkel, A.; Buchfelder, M.; Savaskan, N.E. Intraoperative vascular DIVA surgery reveals angiogenic hotspots in tumor zones of malignant gliomas. Sci. Rep. 2015, 5, 7958. [Google Scholar] [CrossRef] [PubMed]
- Eljamel, S. 5-ALA fluorescence image guided resection of glioblastoma multiforme: A meta-analysis of the literature. Int. J. Mol. Sci. 2015, 5, 10443–10456. [Google Scholar] [CrossRef] [PubMed]
- Hadjipanayis, C.G.; Stummer, W. 5-ALA and FDA approval for glioma surgery. J. Neurooncol. 2019, 141, 479–486. [Google Scholar] [CrossRef] [PubMed]
- Belykh, E.; Martirosyan, N.L.; Yagmurlu, K.; Miller, E.J.; Eschbacher, J.M.; Izadyyazdanabadi, M.; Bardonova, L.A.; Byvaltsev, V.A.; Nakaji, P.; Preul, M.C. Intraoperative fluorescence imaging for personalized brain tumor resection: Current state and future directions. Front. Surg. 2016, 3, 55. [Google Scholar] [CrossRef]
- Nagaya, T.; Nakamura, Y.A.; Choyke, P.L.; Kobayashi, H. Fluorescence-guided surgery. Front. Oncol. 2017, 7, 314. [Google Scholar] [CrossRef]
- Nguyen, Q.T.; Tsien, R.Y. Fluorescence-guided surgery with live molecular navigation—A new cutting edge. Nat. Rev. Cancer 2013, 13, 653–662. [Google Scholar] [CrossRef]
- Pan, Y.; Volkmer, J.-P.; Mach, K.E.; Rouse, R.V.; Liu, J.-J.; Sahoo, D.; Chang, T.C.; Metzner, T.J.; Kang, L.; van de Rijn, M.; et al. Endoscopic molecular imaging of human bladder cancer using a CD47 antibody. Sci. Transl. Med. 2014, 6, 260ra148. [Google Scholar] [CrossRef]
- Weissleder, R.; Pittet, M.J. Imaging in the era of molecular oncology. Nature 2008, 452, 580–589. [Google Scholar] [CrossRef] [PubMed]
- Zhang, R.R.; Schroeder, A.B.; Grudzinski, J.J.; Rosenthal, E.L.; Warram, J.M.; Pinchuk, A.N.; Eliceiri, K.W.; Kuo, J.S.; Weichert, J.P. Beyond the margins: Real-time detection of cancer using targeted fluorophores. Nat. Rev. Clin. Oncol. 2017, 14, 347. [Google Scholar] [CrossRef] [PubMed]
- Weissleder, R.; Ntziachristos, V. Shedding light onto live molecular targets. Nat. Med. 2003, 9, 123–128. [Google Scholar] [CrossRef] [PubMed]
- Van Dam, G.M.; Themelis, G.; Crane, L.M.A.; Harlaar, N.J.; Pleijhuis, R.G.; Kelder, W.; Sarantopoulos, A.; De Jong, J.S.; Arts, H.J.G.; Van Der Zee, A.G.J.; et al. Intraoperative tumor-specific fluorescence imaging in ovarian cancer by folate receptor-α targeting: First in-human results. Nat. Med. 2011, 17, 1315. [Google Scholar] [CrossRef]
- Patil, C.G.; Walker, D.G.; Miller, D.M.; Butte, P.; Morrison, B.; Kittle, D.S.; Hansen, S.J.; Nufer, K.L.; Byrnes-Blake, K.A.; Yamada, M.; et al. Phase 1 safety, pharmacokinetics, and fluorescence imaging study of tozuleristide (BLZ-100) in adults with newly diagnosed or recurrent gliomas. Clin. Neurosurg. 2019, 85, E641–E649. [Google Scholar] [CrossRef] [PubMed]
- Olson, M.T.; Ly, Q.P.; Mohs, A.M. Fluorescence guidance in surgical oncology: Challenges, opportunities, and translation. Mol. Imaging Biol. 2018, 21, 200–218. [Google Scholar] [CrossRef]
- Hernot, S.; van Manen, L.; Debie, P.; Mieog, J.S.D.; Vahrmeijer, A.L. Latest developments in molecular tracers for fluorescence image-guided cancer surgery. Lancet Oncol. 2019, 20, e354–e367. [Google Scholar] [CrossRef]
- Miller, S.E.; Tummers, W.S.; Teraphongphom, N.; van den Berg, N.S.; Hasan, A.; Ertsey, R.D.; Nagpal, S.; Recht, L.D.; Plowey, E.D.; Vogel, H.; et al. First-in-human intraoperative near-infrared fluorescence imaging of glioblastoma using cetuximab-IRDye800. J. Neurooncol. 2018, 139, 135–143. [Google Scholar] [CrossRef]
- Hope, C.H.; Deep, N.L.; Beck, L.N.; Day, K.E.; Sweeny, L.; Zinn, K.R.; Huang, C.C.; Rosenthal, E.L. Use of panitumumab-IRDye800 to image cutaneous head and neck cancer in mice. Otolaryngol. Head Neck Surg. 2013, 148, 982–990. [Google Scholar]
- Warram, J.M.; De Boer, E.; Korb, M.; Hartman, Y.; Kovar, J.; Markert, J.M.; Gillespie, G.Y.; Rosenthal, E.L. Fluorescence-guided resection of experimental malignant glioma using cetuximab-IRDye 800CW. Br. J. Neurosurg. 2015, 29, 850–858. [Google Scholar] [CrossRef]
- Rosenthal, E.L.; Warram, J.M.; De Boer, E.; Chung, T.K.; Korb, M.L.; Brandwein-Gensler, M.; Strong, T.V.; Schmalbach, C.E.; Morlandt, A.B.; Agarwal, G.; et al. Safety and tumor specificity of cetuximab-IRDye800 for surgical navigation in head and neck cancer. Clin. Cancer Res. 2015, 21, 3658–3666. [Google Scholar] [CrossRef]
- Zinn, K.R.; Korb, M.; Samuel, S.; Warram, J.M.; Dion, D.; Killingsworth, C.; Fan, J.; Schoeb, T.; Strong, T.V.; Rosenthal, E.L. IND-directed safety and biodistribution study of intravenously injected cetuximab-IRDye800 in Cynomolgus Macaques. Mol. Imaging Biol. 2014, 17, 49–57. [Google Scholar] [CrossRef] [PubMed]
- Bernhard, W.; El-Sayed, A.; Barreto, K.; Gonzalez, C.; Hill, W.; Parada, A.C.; Fonge, H.; Geyer, C.R. Near infrared fluorescence imaging of EGFR expression in vivo using IRDye800CW-nimotuzumab. Oncotarget 2018, 9, 6213. [Google Scholar] [CrossRef] [PubMed]
- Furnari, F.B.; Fenton, T.; Bachoo, R.M.; Mukasa, A.; Stommel, J.M.; Stegh, A.; Hahn, W.C.; Ligon, K.L.; Louis, D.N.; Brennan, C.; et al. Malignant astrocytic glioma: Genetics, biology, and paths to treatment. Genes Dev. 2007, 21, 2683–2710. [Google Scholar] [CrossRef] [PubMed]
- Szerlip, N.J.; Pedraza, A.; Chakravarty, D.; Azim, M.; McGuire, J.; Fang, Y.; Ozawa, T.; Holland, E.C.; Huse, J.T.; Jhanwar, S.; et al. Intratumoral heterogeneity of receptor tyrosine kinases EGFR and PDGFRA amplification in glioblastoma defines subpopulations with distinct growth factor response. Proc. Natl. Acad. Sci. 2012, 109, 3041–3046. [Google Scholar] [CrossRef] [PubMed]
- Su, G.; Meyer, K.; Nandini, C.D.; Qiao, D.; Salamat, S.; Friedl, A. Glypican-1 is frequently overexpressed in human gliomas and enhances FGF-2 signaling in glioma cells. Am. J. Pathol. 2006, 168, 2014–2026. [Google Scholar] [CrossRef] [PubMed]
- Saito, T.; Sugiyama, K.; Hama, S.; Yamasaki, F.; Takayasu, T.; Nosaka, R.; Onishi, S.; Muragaki, Y.; Kawamata, T.; Kurisu, K. High expression of glypican-1 predicts dissemination and poor prognosis in glioblastomas. World Neurosurg. 2017, 105, 282–288. [Google Scholar] [CrossRef]
- Hara, H.; Takahashi, T.; Serada, S.; Fujimoto, M.; Ohkawara, T.; Nakatsuka, R.; Harada, E.; Nishigaki, T.; Takahashi, Y.; Nojima, S.; et al. Overexpression of glypican-1 implicates poor prognosis and their chemoresistance in oesophageal squamous cell carcinoma. Br. J. Cancer 2016, 115, 66–75. [Google Scholar] [CrossRef]
- Aikawa, T.; Whipple, C.A.; Lopez, M.E.; Gunn, J.; Young, A.; Lander, A.D.; Korc, M. Glypican-1 modulates the angiogenic and metastatic potential of human and mouse cancer cells. J. Clin. Investig. 2008, 118, 89–99. [Google Scholar] [CrossRef]
- Truong, Q.; Justiniano, I.O.; Nocon, A.L.; Soon, J.T.; Wissmueller, S.; Campbell, D.H.; Walsh, B.J. Glypican-1 as a biomarker for prostate cancer: Isolation and characterization. J. Cancer 2016, 7, 1002. [Google Scholar] [CrossRef]
- Harada, E.; Serada, S.; Fujimoto, M.; Takahashi, Y.; Takahashi, T.; Hara, H.; Nakatsuka, R.; Sugase, T.; Nishigaki, T.; Saito, Y.; et al. Glypican-1 targeted antibody-based therapy induces preclinical antitumor activity against esophageal squamous cell carcinoma. Oncotarget 2017, 8, 24741. [Google Scholar] [CrossRef] [PubMed]
- Russell, P.J.; Ow, K.T.; Tam, P.N.; Juarez, J.; Kingsley, E.A.; Qu, C.F.; Li, Y.; Cozzi, P.J.; Martiniello-Wilks, R. Immunohistochemical characterisation of the monoclonal antibody BLCA-38 for the detection of prostate cancer. Cancer Immunol. Immunother. 2004, 53, 995–1004. [Google Scholar] [CrossRef] [PubMed]
- Jen, Y.H.L.; Musacchio, M.; Lander, A.D. Glypican-1 controls brain size through regulation of fibroblast growth factor signaling in early neurogenesis. Neural Dev. 2009, 4, 33. [Google Scholar] [CrossRef] [PubMed]
- Walker, K.Z.; Russell, P.J.; Kingsley, E.A.; Philips, J.; Raghavan, D. Detection of malignant cells in voided urine from patients with bladder cancer, a novel monoclonal assay. J. Urol. 1989, 142, 1578–1583. [Google Scholar] [CrossRef]
- Campbell, D.; Sabanathan, D.; Gurney, H.; Gillatt, D.; Trifunovic, M.; Poursoultan, P.; Ho Shon, K.; Mackay, T.; Bailey, D.L.; Roach, P.; et al. Outcomes of the miltuximab first in human trial and proposed study design for a phase I trial 89Zr/177Lu theranostic trial. J. Clin. Oncol. 2019, 37, 261. [Google Scholar] [CrossRef]
- Boyle, C.C.; Paine, A.J.; Mather, S.J. The mechanism of hepatic uptake of a radiolabelled monoclonal antibody. Int. J. Cancer 1992, 50, 912–917. [Google Scholar] [CrossRef]
- Broman, T. Supravital analysis of disorders in the cerebral vascular permeability in man. Acta Med. Scand. 1944, 118, 79–83. [Google Scholar] [CrossRef]
- Moore, G.E.; Peyton, W.T.; French, L.A.; Walker, W.W. The clinical use of fluorescein in neurosurgery. J. Neurosurg. 1948. [Google Scholar] [CrossRef]
- Stummer, W.; Pichlmeier, U.; Meinel, T.; Wiestler, O.D.; Zanella, F.; Reulen, H.J. Fluorescence-guided surgery with 5-aminolevulinic acid for resection of malignant glioma: A randomised controlled multicentre phase III trial. Lancet Oncol. 2006, 7, 392–401. [Google Scholar] [CrossRef]
- Miyatake, S.I.; Kuroiwa, T.; Kajimoto, Y.; Miyashita, M.; Tanaka, H.; Tsuji, M. Fluorescence of non-neoplastic, magnetic resonance imaging-enhancing tissue by 5-aminolevulinic acid: Case report. Neurosurgery 2007, 61, E1101–E1104. [Google Scholar] [CrossRef]
- Minamikawa, T.; Matsuo, H.; Kato, Y.; Harada, Y.; Otsuji, E.; Yanagisawa, A.; Tanaka, H.; Takamatsu, T. Simplified and optimized multispectral imaging for 5-ALA-based fluorescence diagnosis of malignant lesions. Sci. Rep. 2016, 6, 25530. [Google Scholar] [CrossRef] [PubMed]
- Vahrmeijer, A.L.; Hutteman, M.; Van Der Vorst, J.R.; Van De Velde, C.J.H.; Frangioni, J.V. Image-guided cancer surgery using near-infrared fluorescence. Nat. Rev. Clin. Oncol. 2013, 10, 507. [Google Scholar] [CrossRef] [PubMed]
- Matsuzaki, S.; Serada, S.; Hiramatsu, K.; Nojima, S.; Matsuzaki, S.; Ueda, Y.; Ohkawara, T.; Mabuchi, S.; Fujimoto, M.; Morii, E.; et al. Anti-glypican-1 antibody-drug conjugate exhibits potent preclinical antitumor activity against glypican-1 positive uterine cervical cancer. Int. J. Cancer 2018, 142, 1056–1066. [Google Scholar] [CrossRef]
- Bhattacharyya, S.; Patel, N.L.; Wei, L.; Riffle, L.A.; Kalen, J.D.; Hill, G.C.; Jacobs, P.M.; Zinn, K.R.; Rosenthal, E. Synthesis and biological evaluation of panitumumab-IRDye800 conjugate as a fluorescence imaging probe for EGFR-expressing cancers. Medchemcomm 2014, 5, 1337–1346. [Google Scholar] [CrossRef] [PubMed]
- Huang, R.; Vider, J.; Kovar, J.L.; Olive, D.M.; Mellinghoff, I.K.; Mayer-Kuckuk, P.; Kircher, M.F.; Blasberg, R.G. Integrin αvβ3-targeted IRDye 800CW near-infrared imaging of glioblastoma. Clin. Cancer Res. 2012, 18, 5731–5740. [Google Scholar] [CrossRef]
- National Health, and Medical Research Council. Australian Code of Practice for the Care and Use of Animals for Scientific; National Health and Medical Research Council: Canberra, Australia, 2004; ISBN 1864962658.
- Oliveira, S.; Cohen, R.; van Walsum, M.S.; van Dongen, G.A.M.S.; Elias, S.G.; van Diest, P.J.; Mali, W.; van Paul, M.P.; Henegouwen, B. A novel method to quantify IRDye800CW fluorescent antibody probes ex vivo in tissue distribution studies. EJNMMI Res. 2012, 2, 50. [Google Scholar] [CrossRef]


© 2020 by the authors. Licensee MDPI, Basel, Switzerland. This article is an open access article distributed under the terms and conditions of the Creative Commons Attribution (CC BY) license (http://creativecommons.org/licenses/by/4.0/).
Share and Cite
Polikarpov, D.M.; Campbell, D.H.; McRobb, L.S.; Wu, J.; Lund, M.E.; Lu, Y.; Deyev, S.M.; Davidson, A.S.; Walsh, B.J.; Zvyagin, A.V.; et al. Near-Infrared Molecular Imaging of Glioblastoma by Miltuximab®-IRDye800CW as a Potential Tool for Fluorescence-Guided Surgery. Cancers 2020, 12, 984. https://doi.org/10.3390/cancers12040984
Polikarpov DM, Campbell DH, McRobb LS, Wu J, Lund ME, Lu Y, Deyev SM, Davidson AS, Walsh BJ, Zvyagin AV, et al. Near-Infrared Molecular Imaging of Glioblastoma by Miltuximab®-IRDye800CW as a Potential Tool for Fluorescence-Guided Surgery. Cancers. 2020; 12(4):984. https://doi.org/10.3390/cancers12040984
Chicago/Turabian StylePolikarpov, Dmitry M., Douglas H. Campbell, Lucinda S. McRobb, Jiehua Wu, Maria E. Lund, Yanling Lu, Sergey M. Deyev, Andrew S. Davidson, Bradley J. Walsh, Andrei V. Zvyagin, and et al. 2020. "Near-Infrared Molecular Imaging of Glioblastoma by Miltuximab®-IRDye800CW as a Potential Tool for Fluorescence-Guided Surgery" Cancers 12, no. 4: 984. https://doi.org/10.3390/cancers12040984
APA StylePolikarpov, D. M., Campbell, D. H., McRobb, L. S., Wu, J., Lund, M. E., Lu, Y., Deyev, S. M., Davidson, A. S., Walsh, B. J., Zvyagin, A. V., & Gillatt, D. A. (2020). Near-Infrared Molecular Imaging of Glioblastoma by Miltuximab®-IRDye800CW as a Potential Tool for Fluorescence-Guided Surgery. Cancers, 12(4), 984. https://doi.org/10.3390/cancers12040984