Utilizing Genome-Wide mRNA Profiling to Identify the Cytotoxic Chemotherapeutic Mechanism of Triazoloacridone C-1305 as Direct Microtubule Stabilization

 , , ,
, , ,  , , , , , and
Abstract
1. Introduction
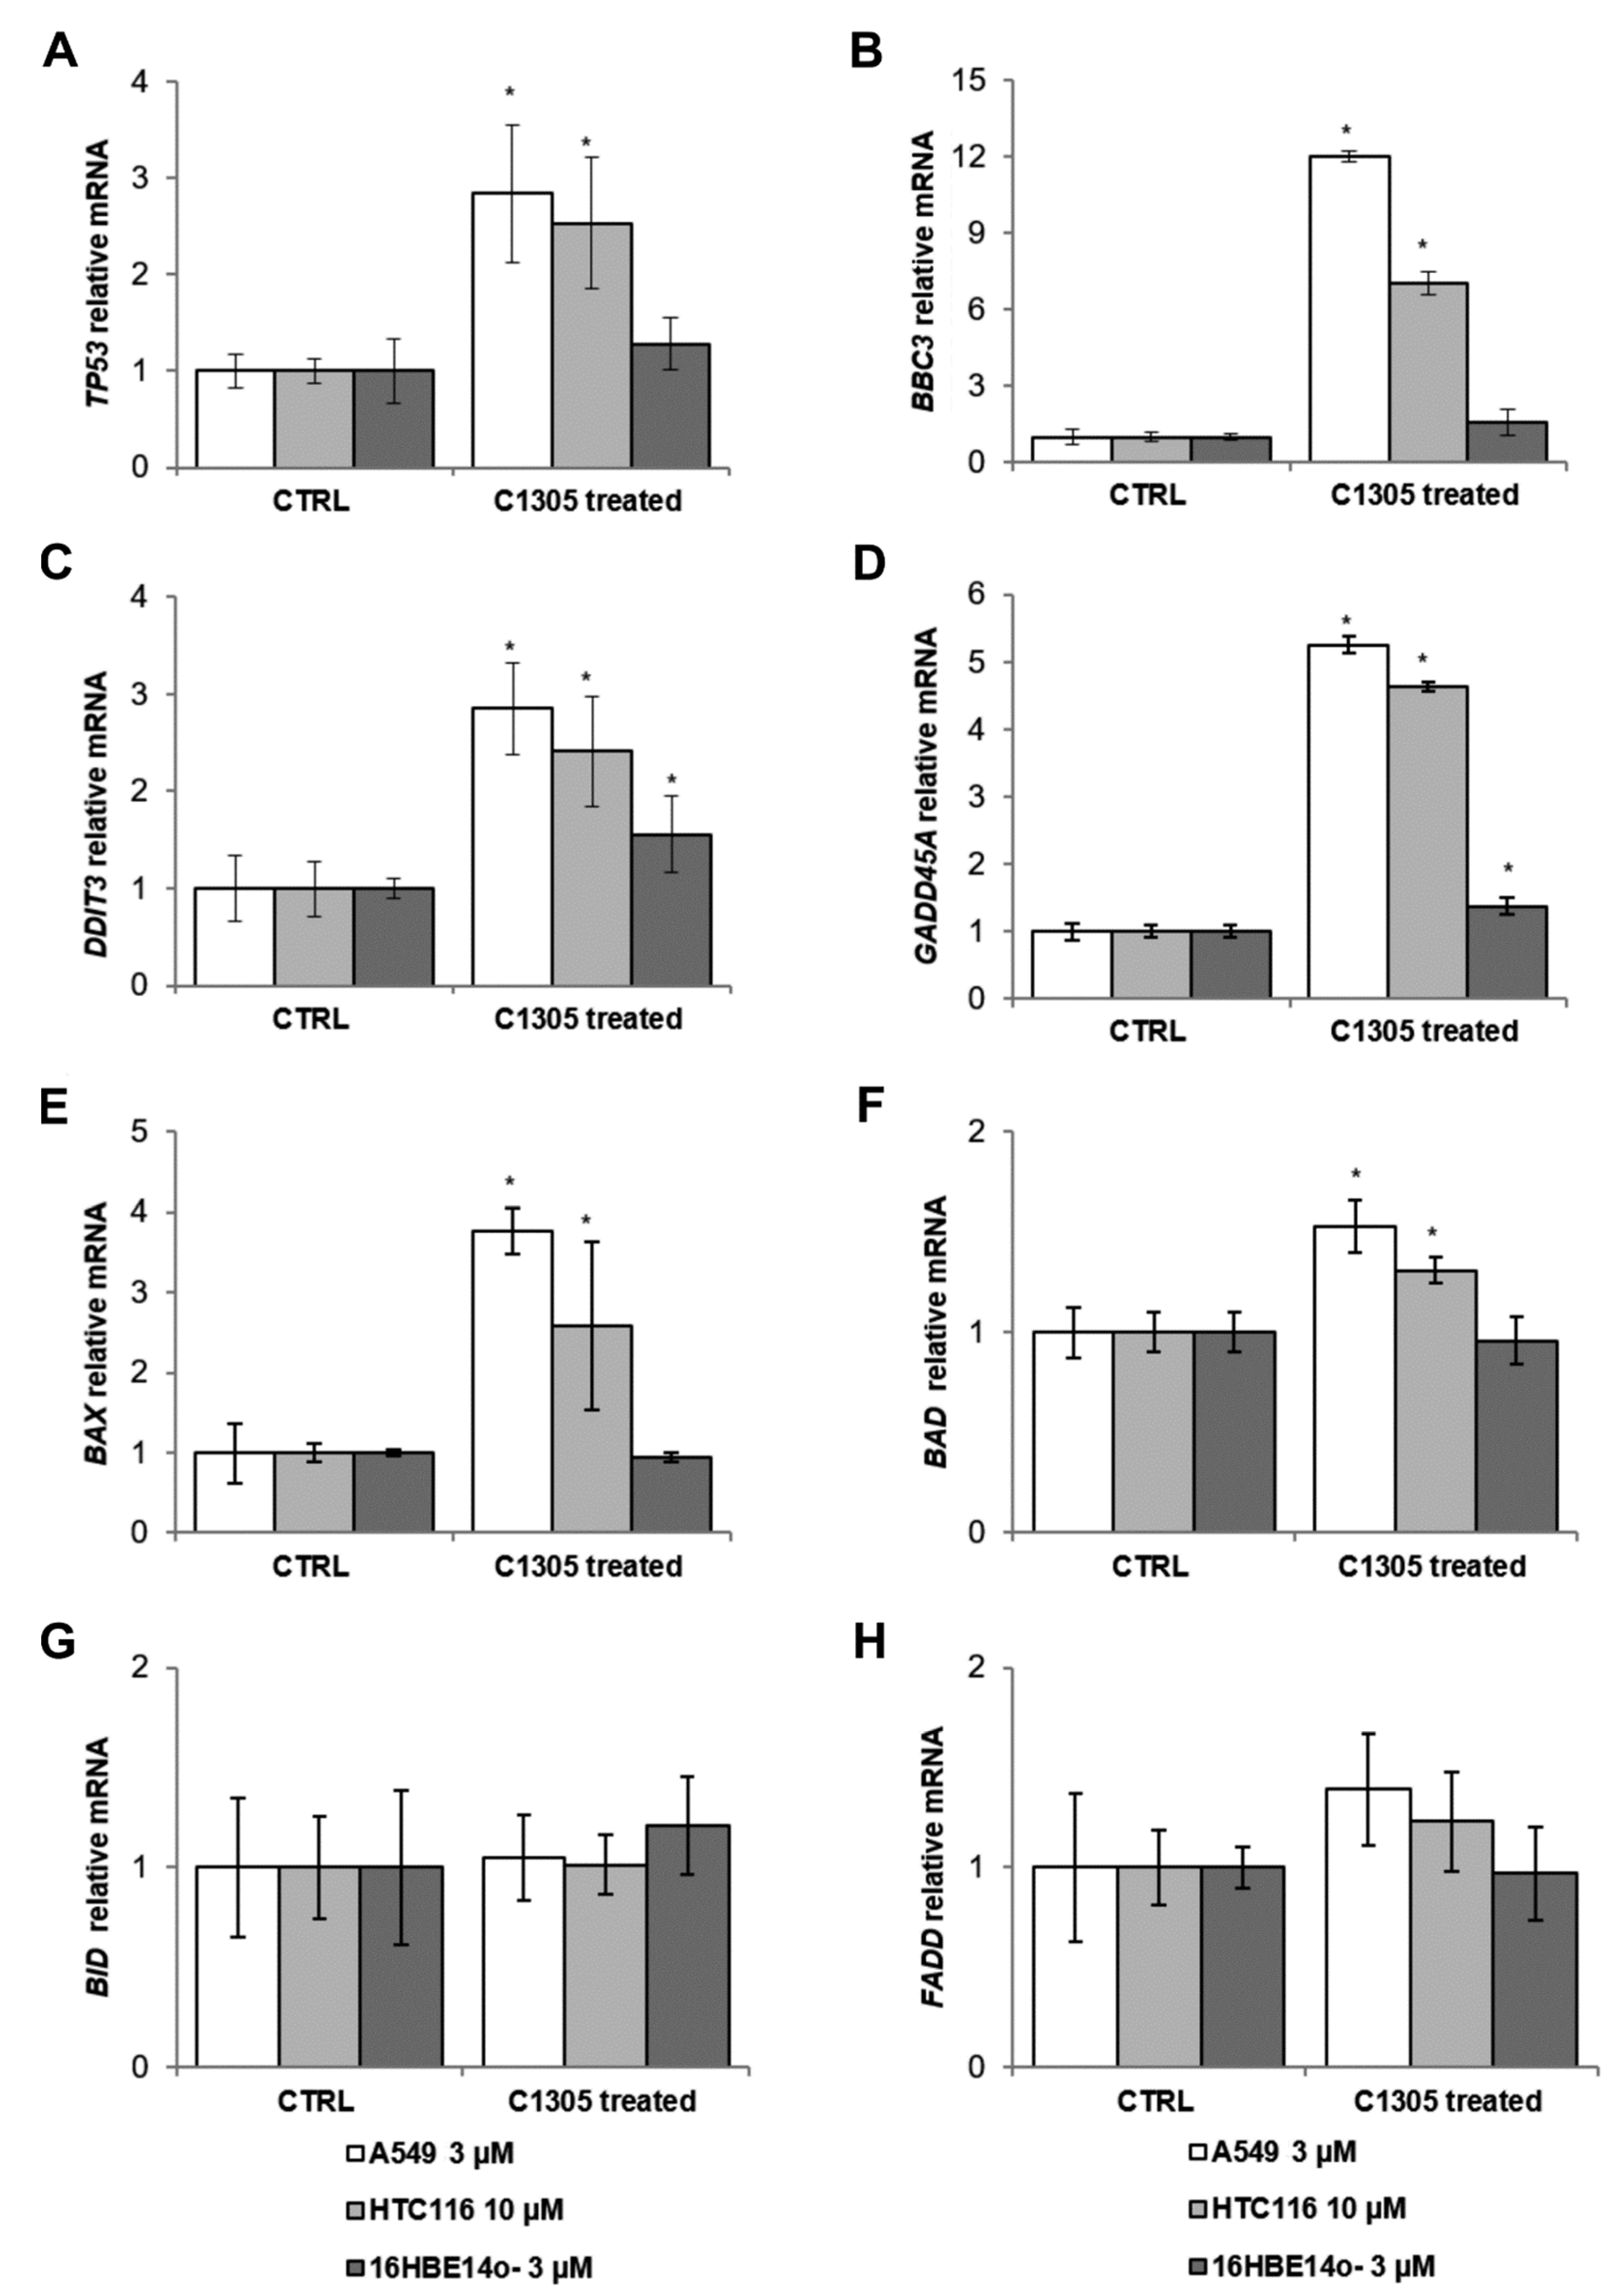
2. Results
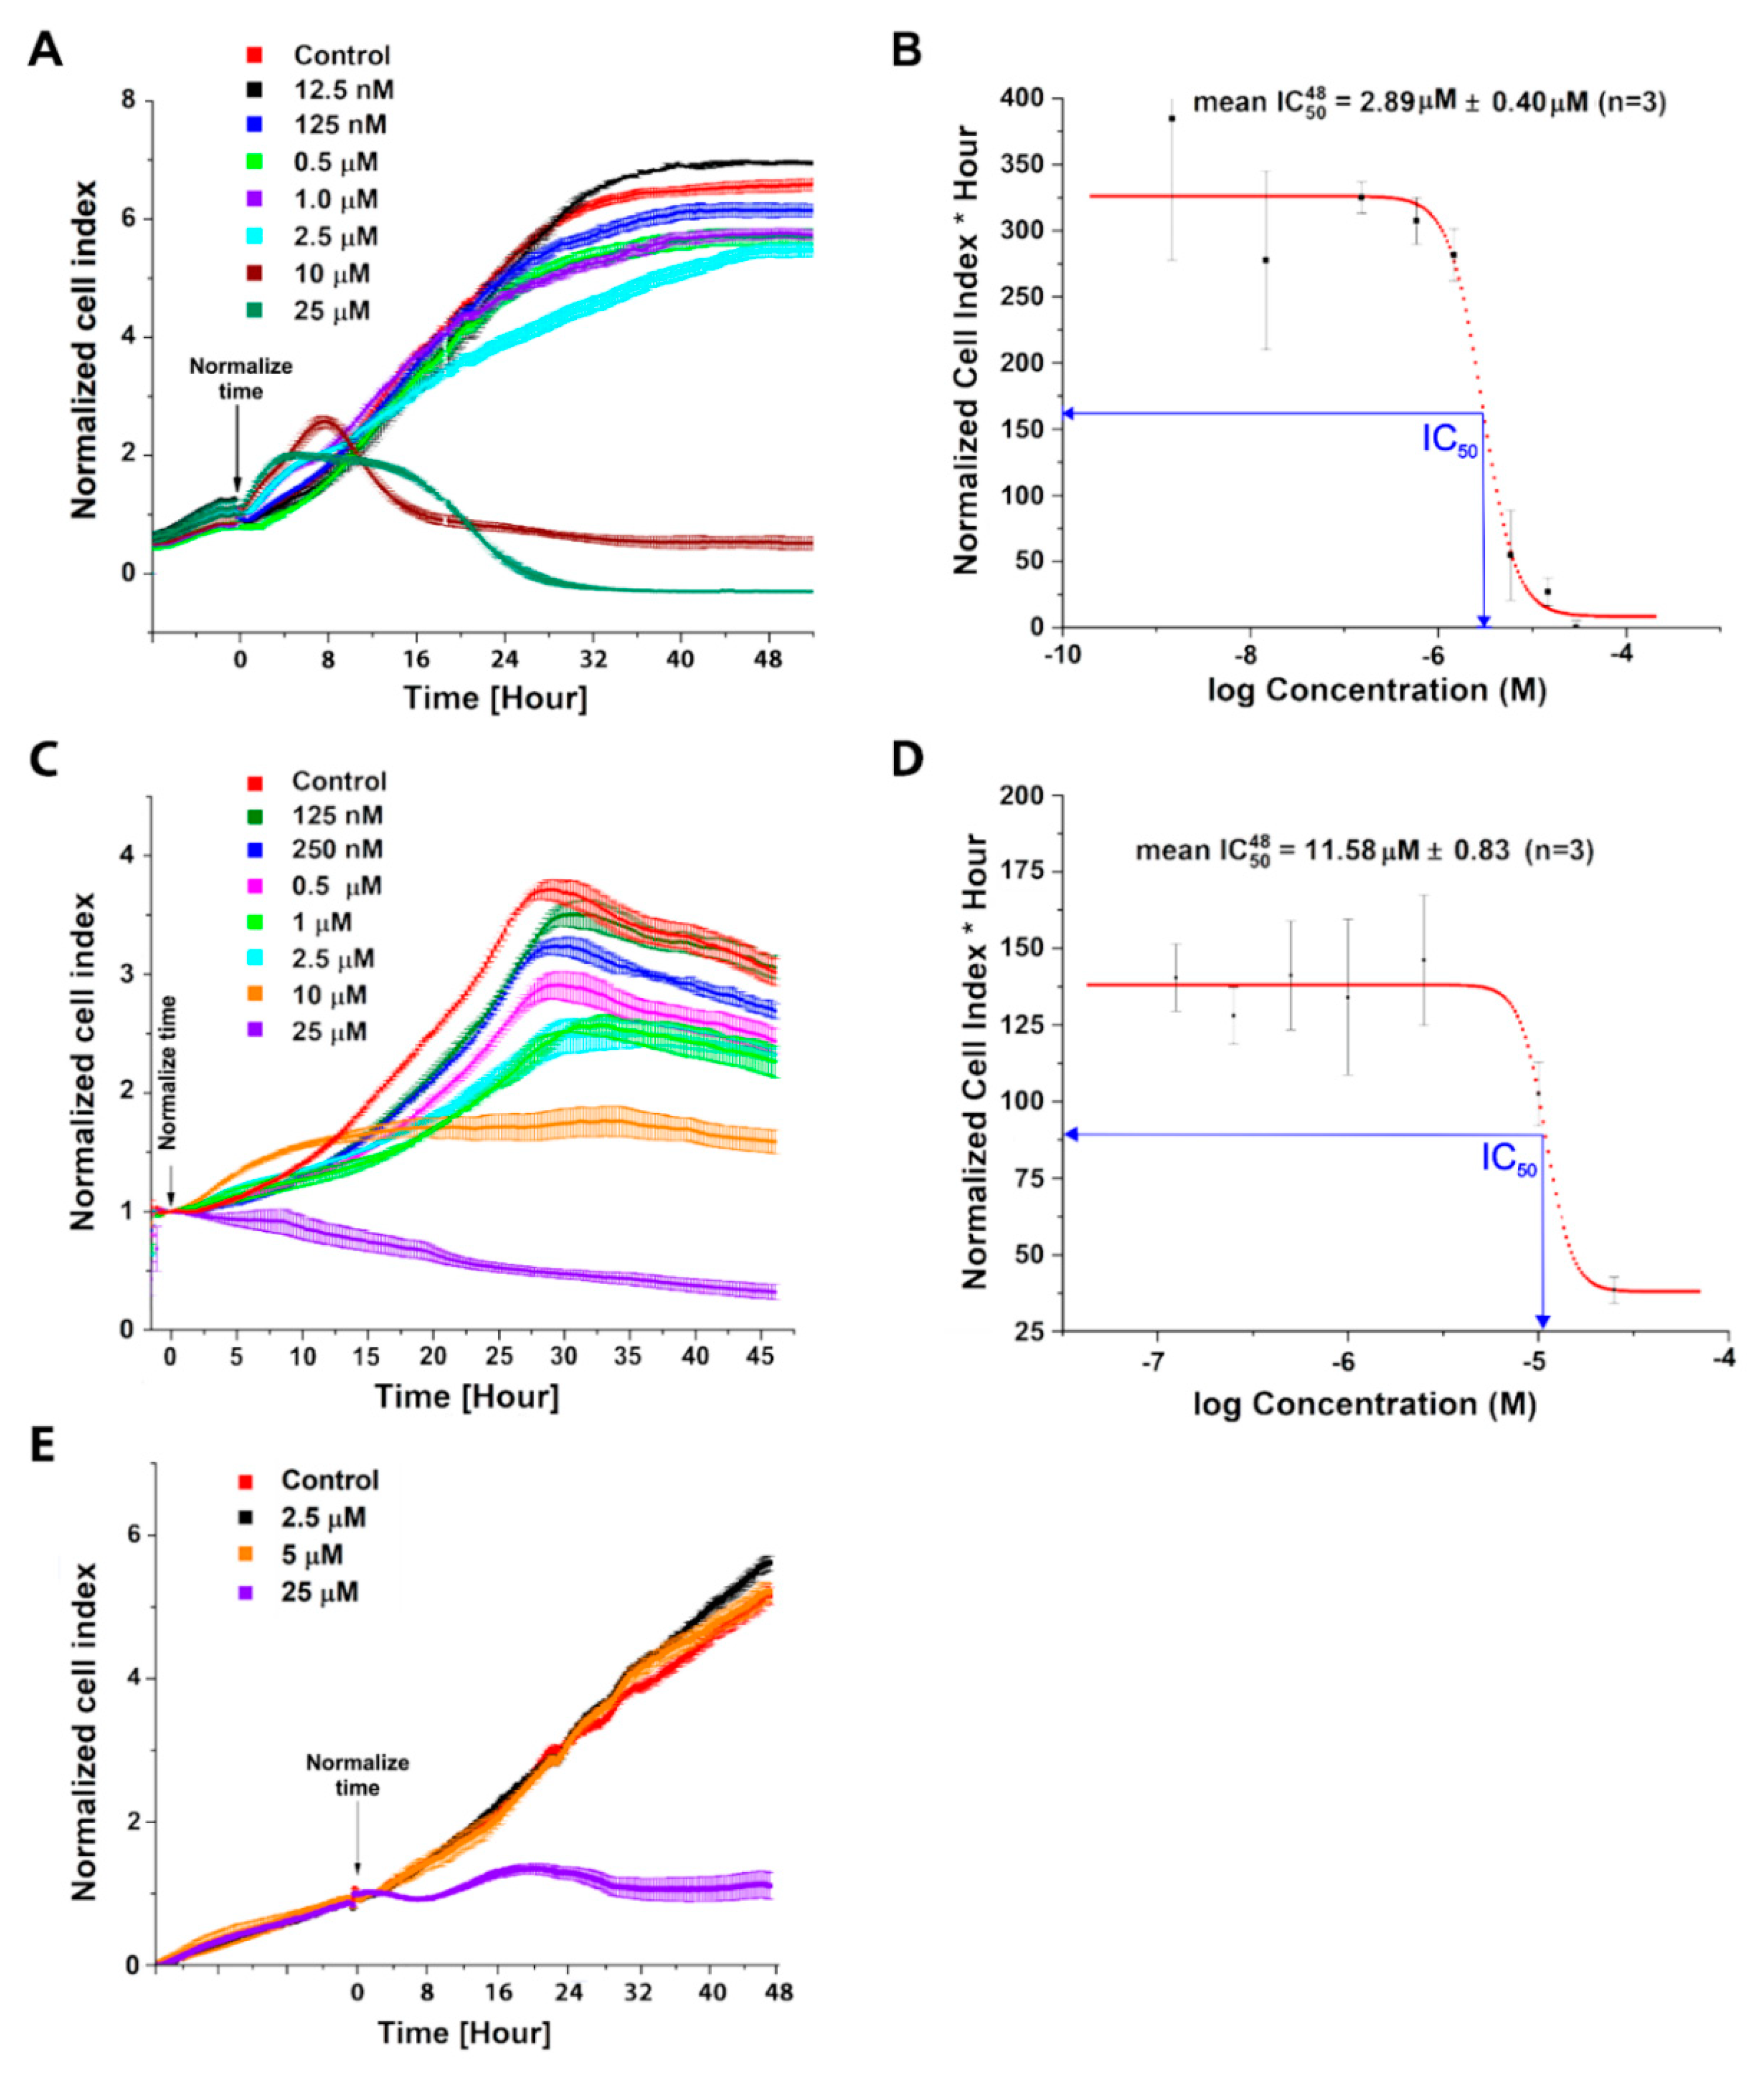
2.1. Evaluation of C-1305 Cytotoxicity Profile
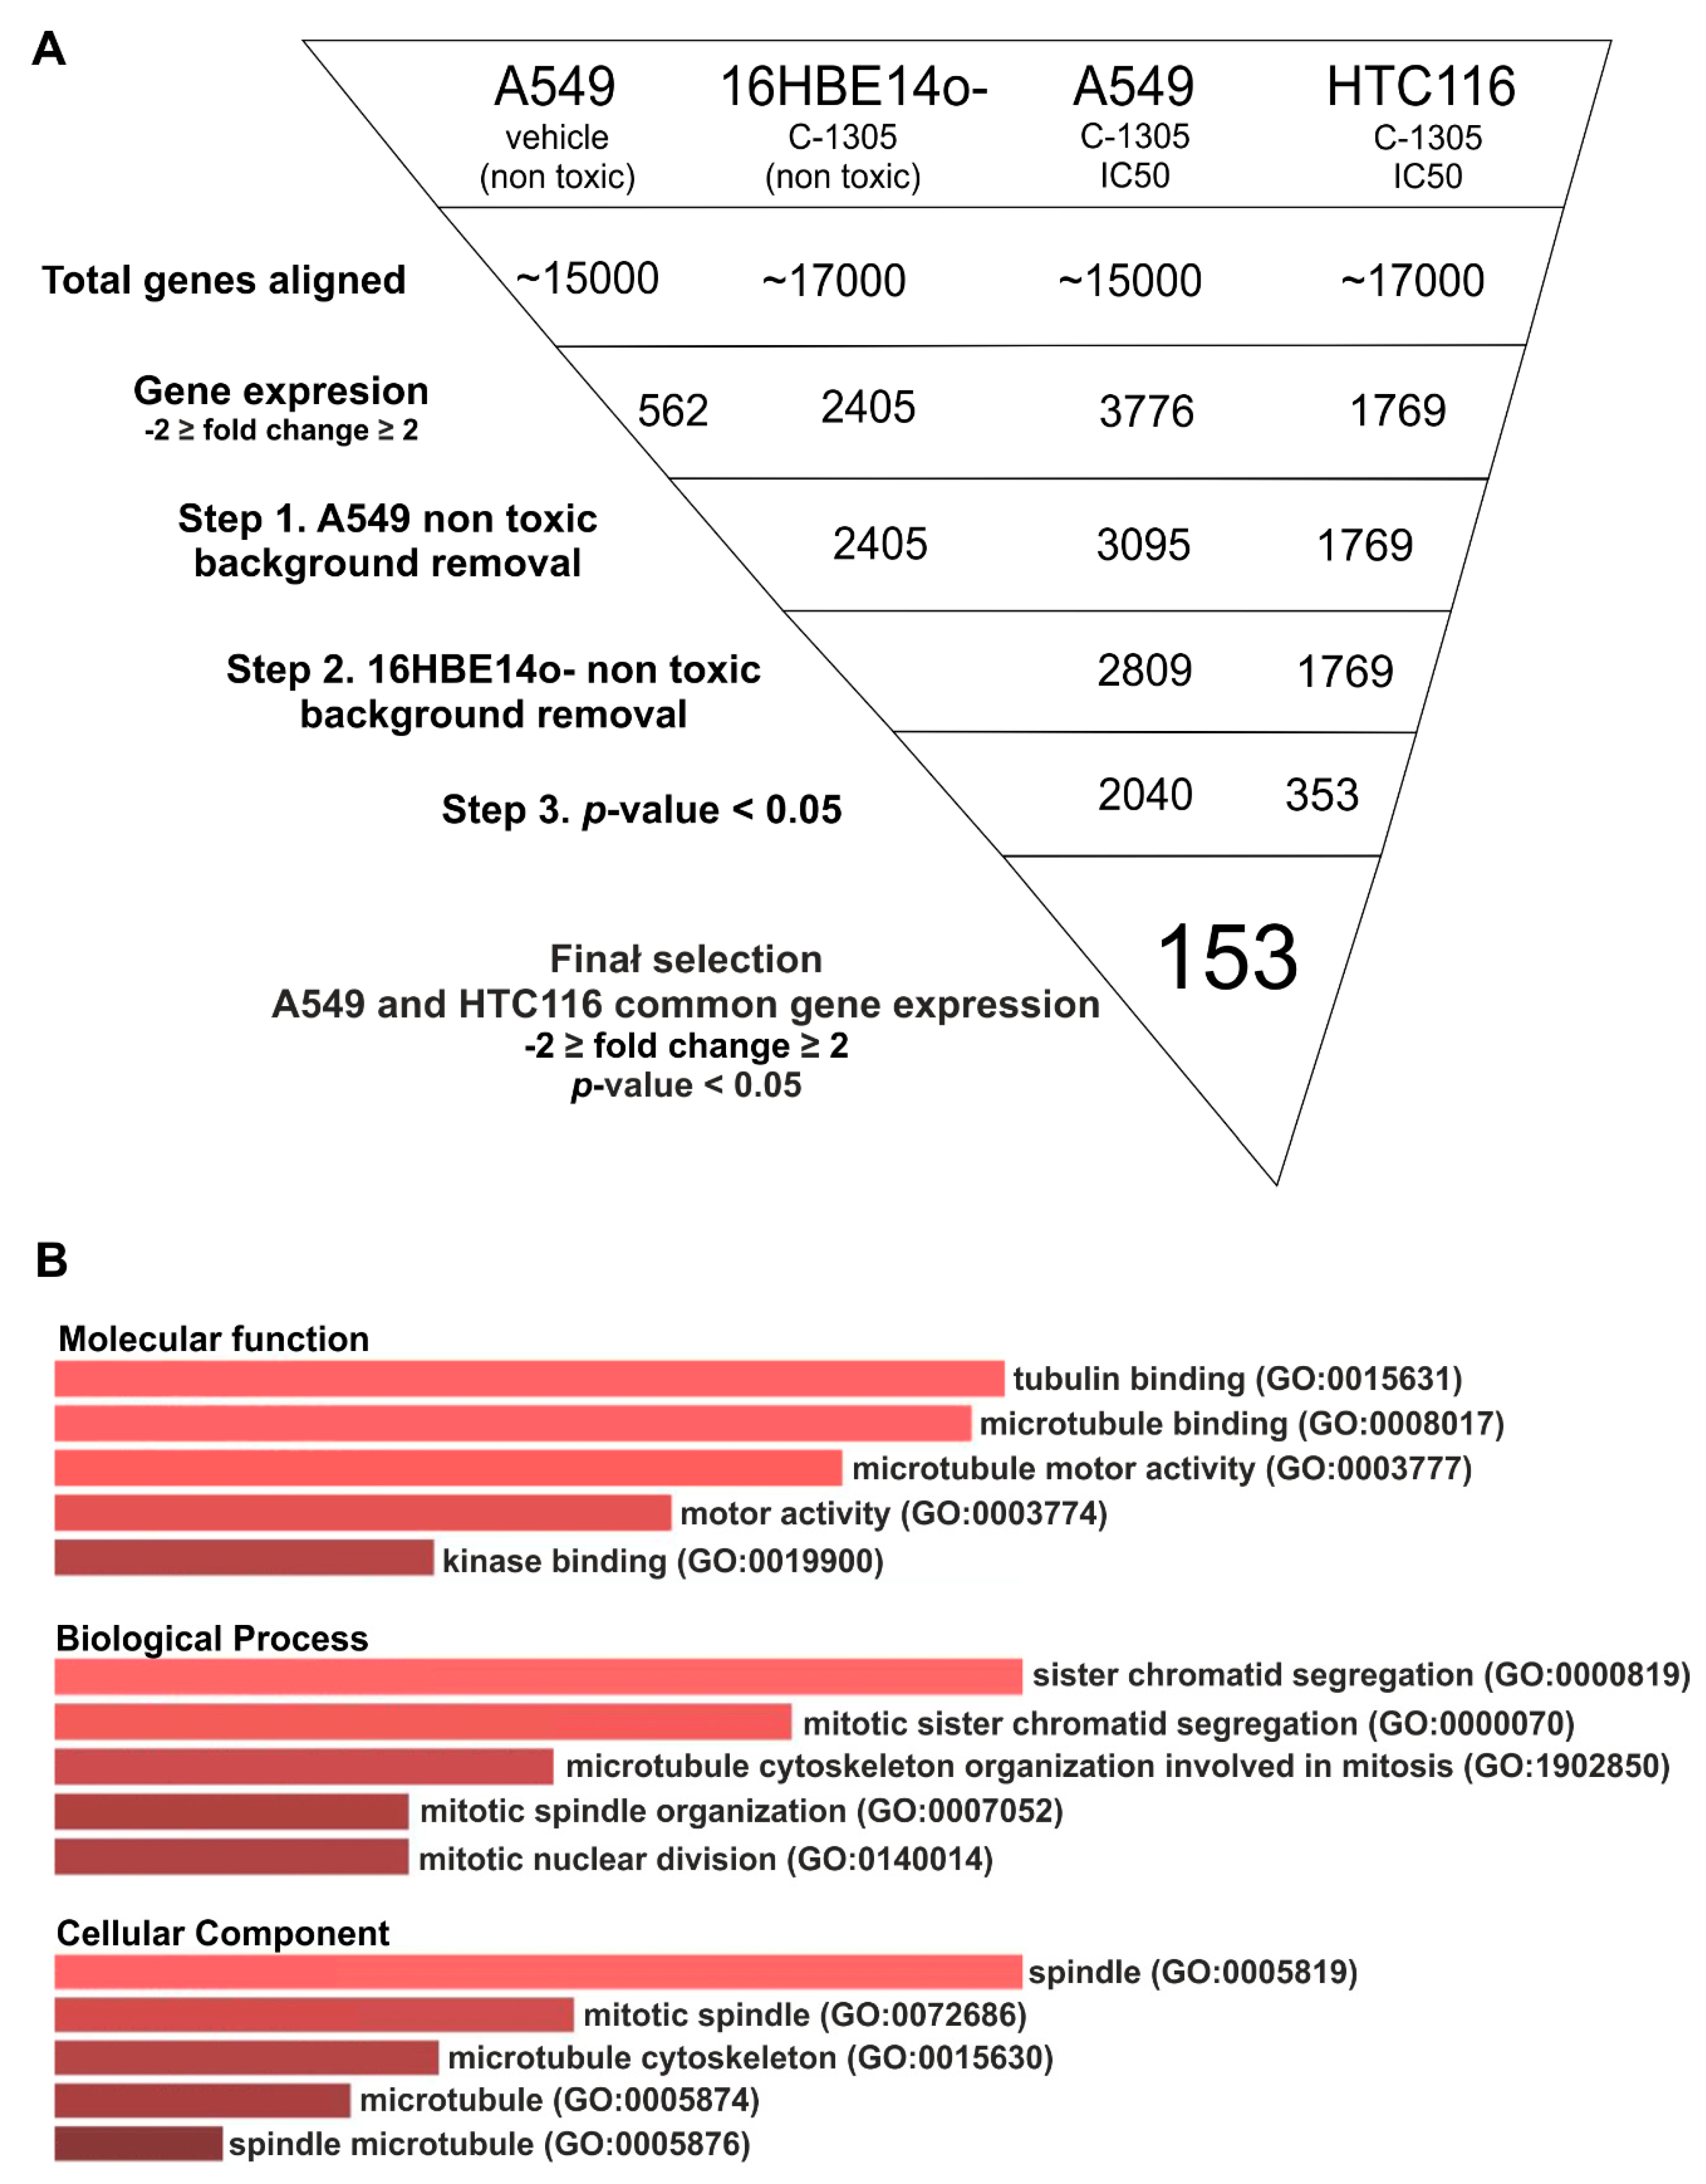
2.2. RNAseq Global Transcriptome Analysis
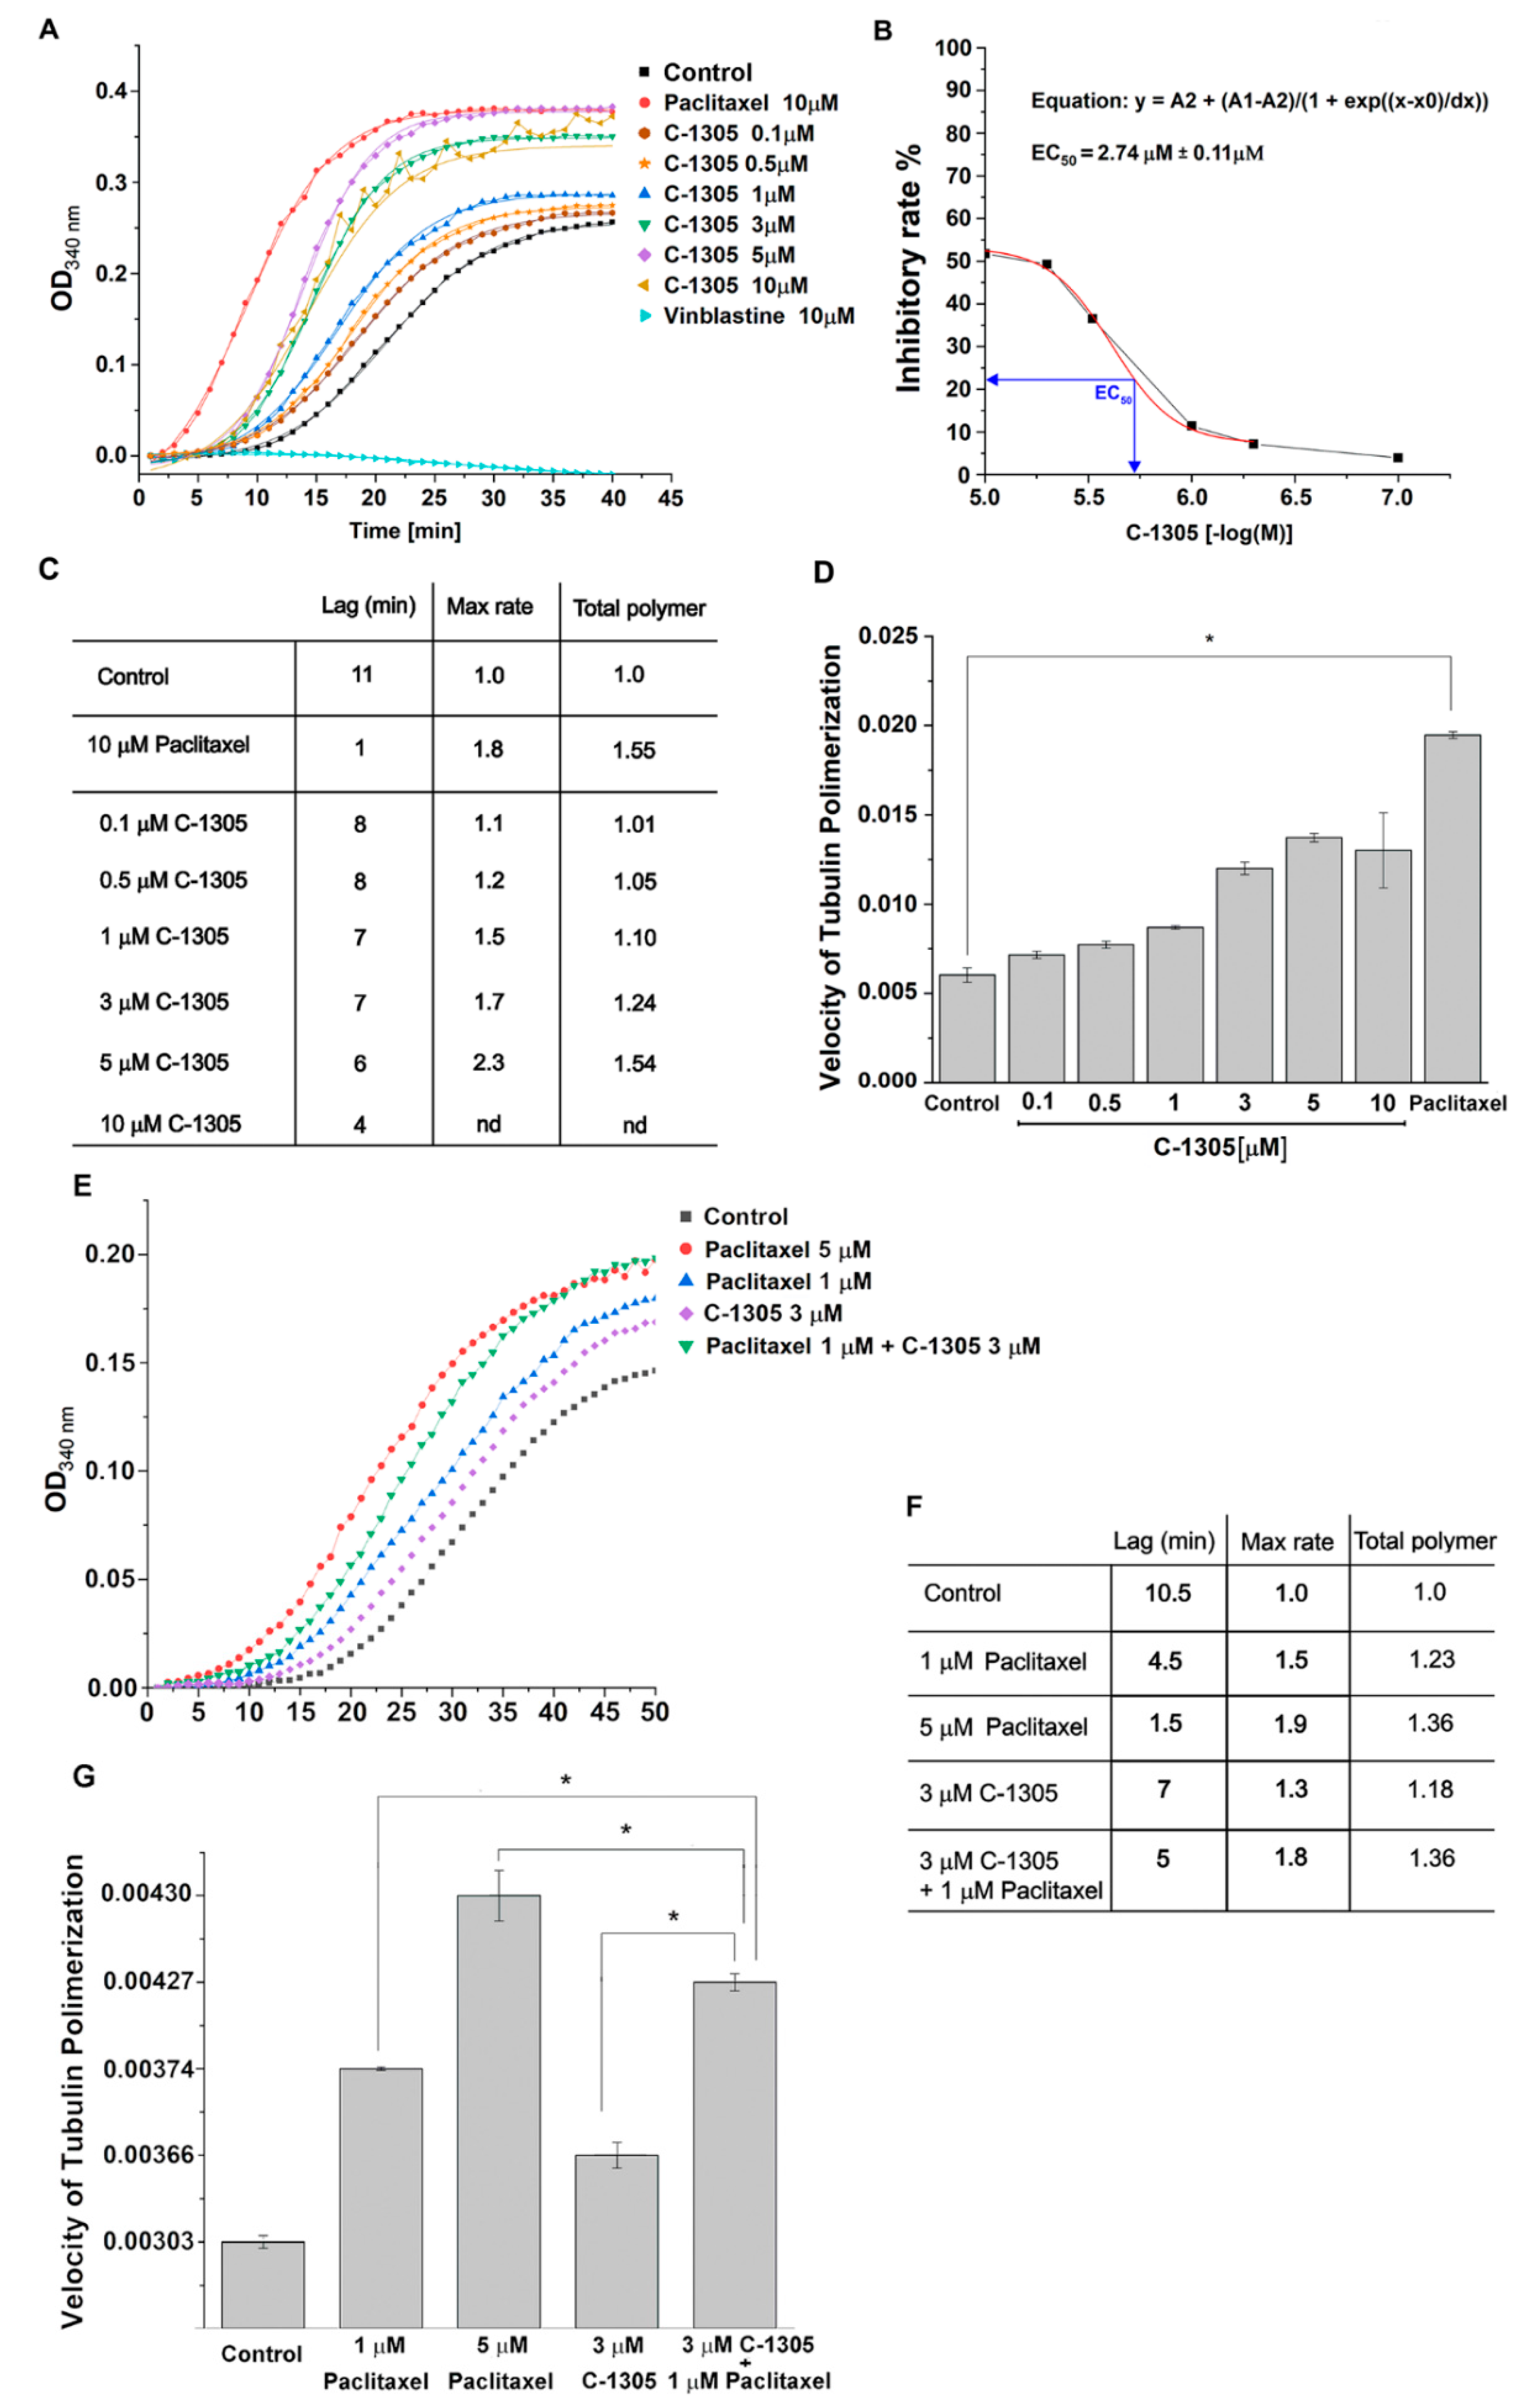
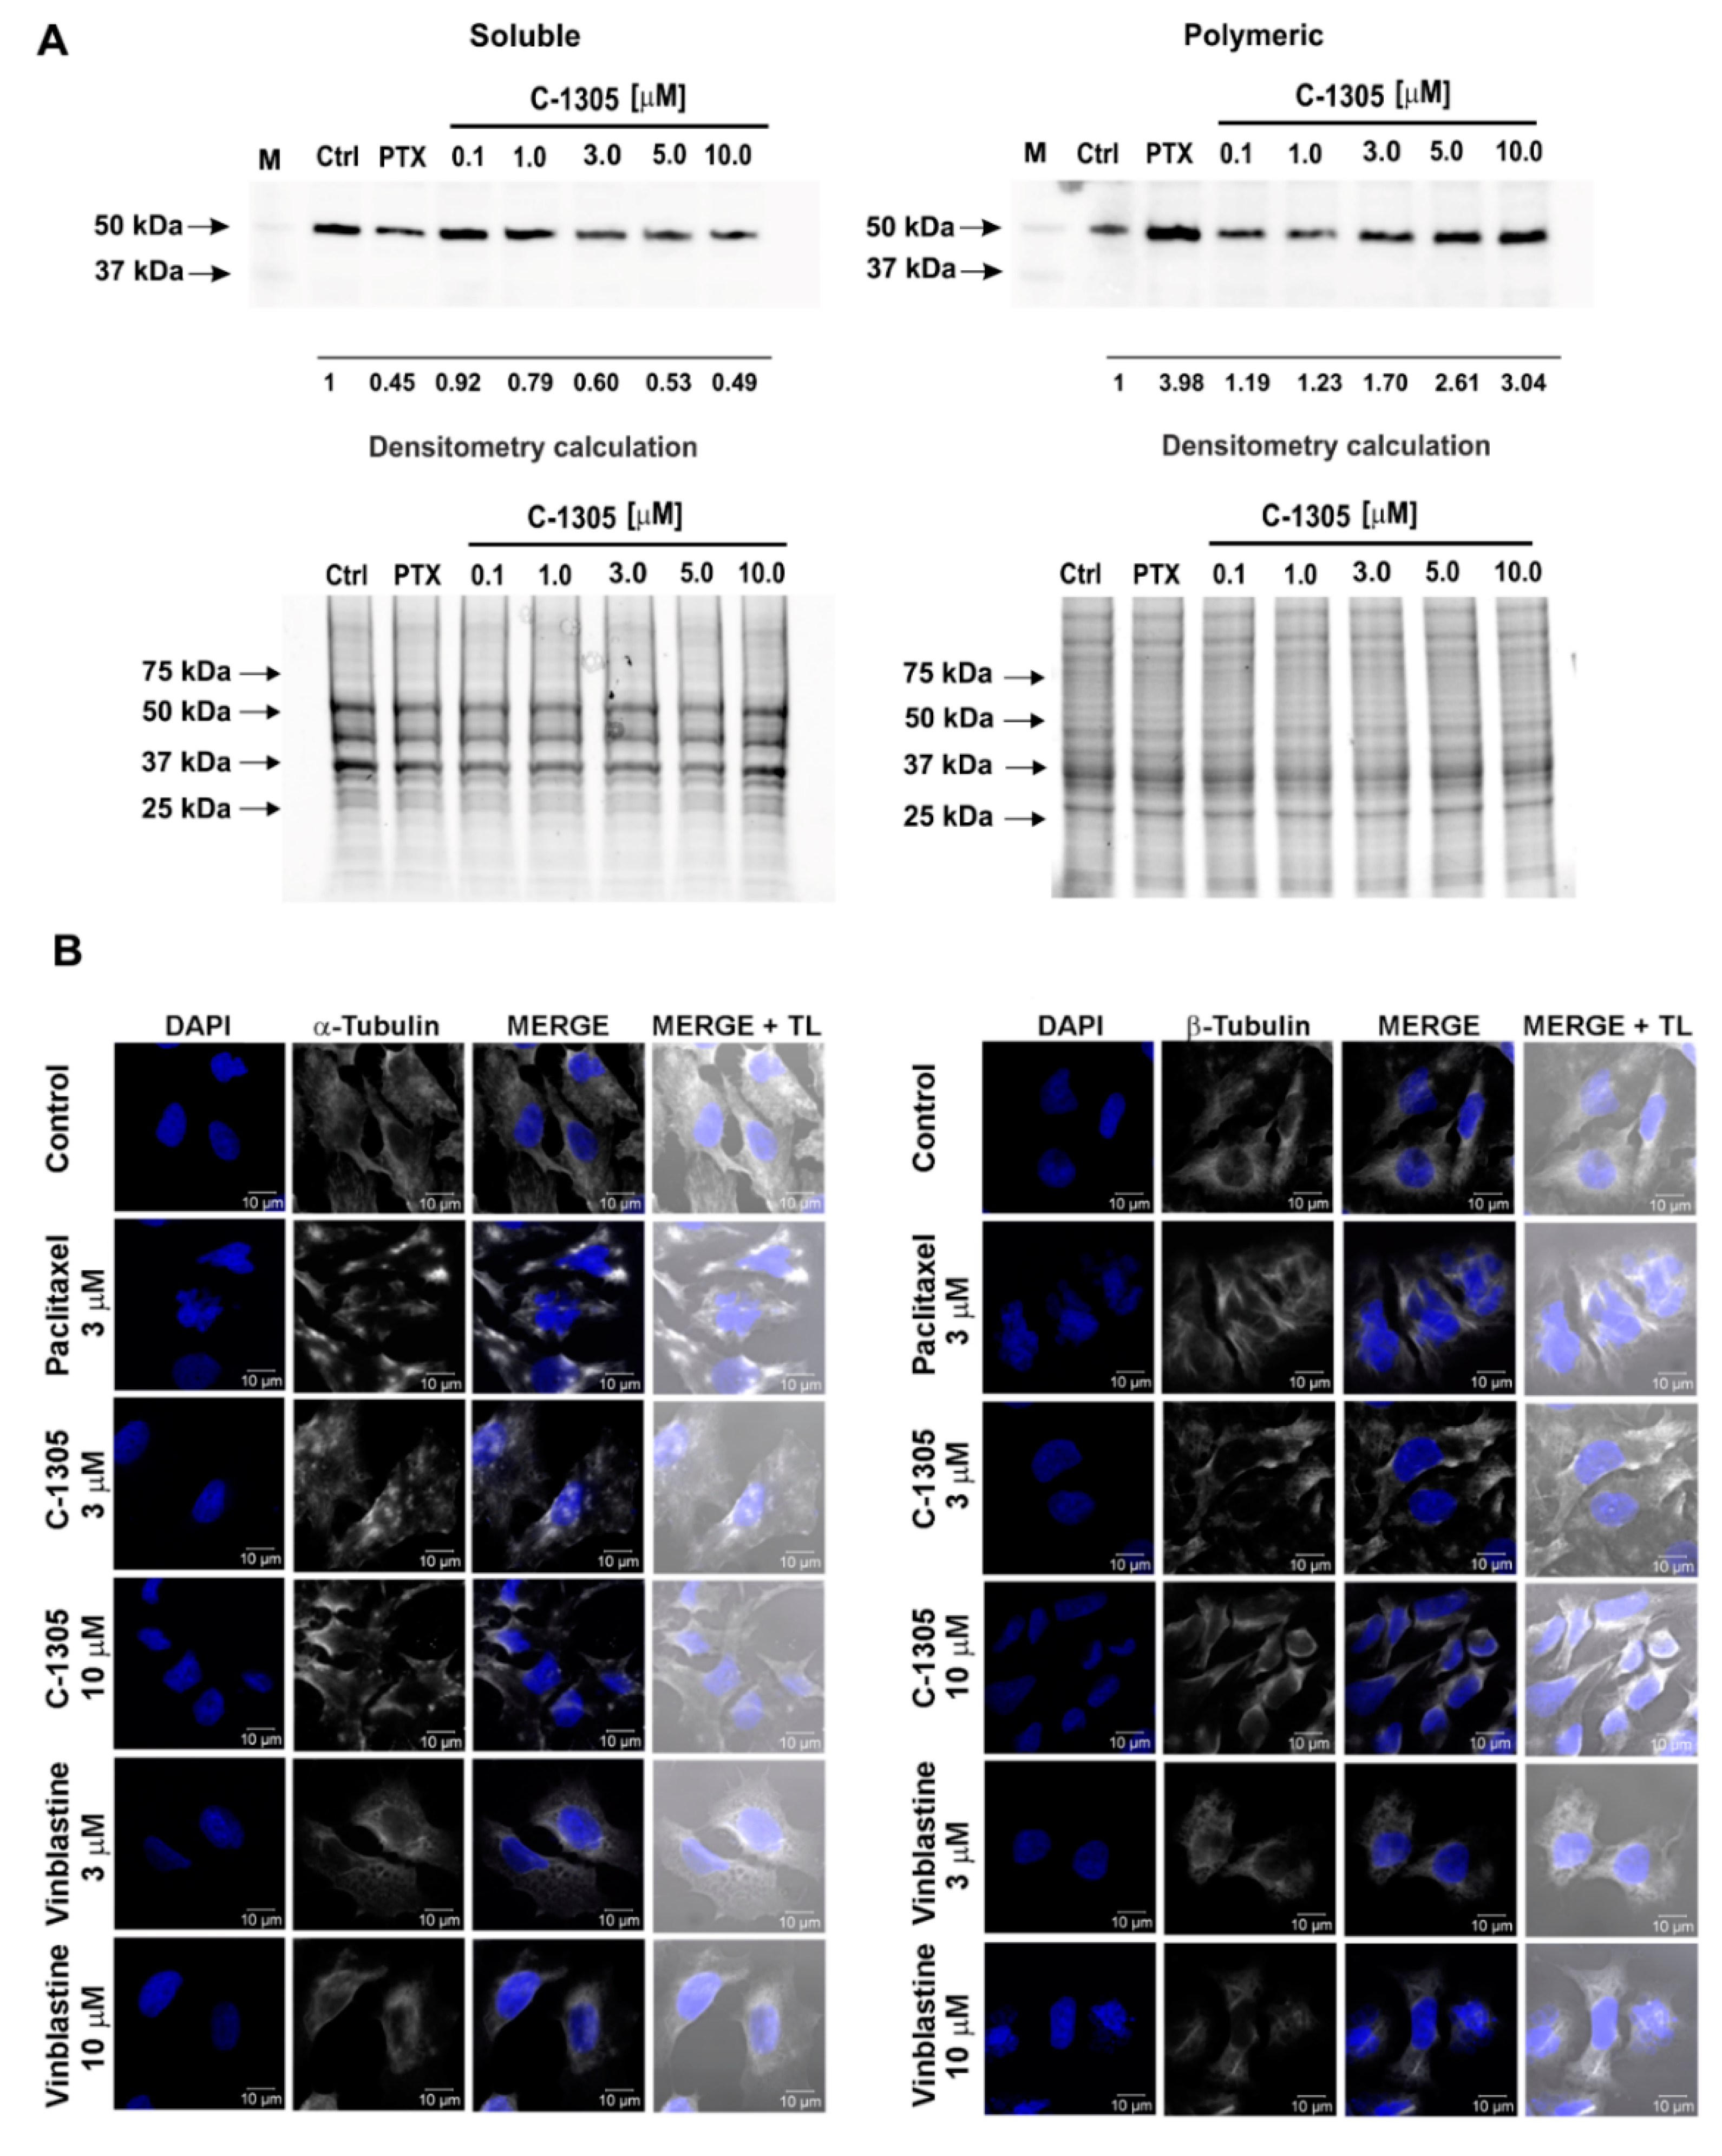
2.3. C-1305 Affects Microtubule Cytoskeleton Through the Induction of Tubulin Polymerization
3. Discussion
4. Materials and Methods
4.1. Cell lines and Culture Conditions
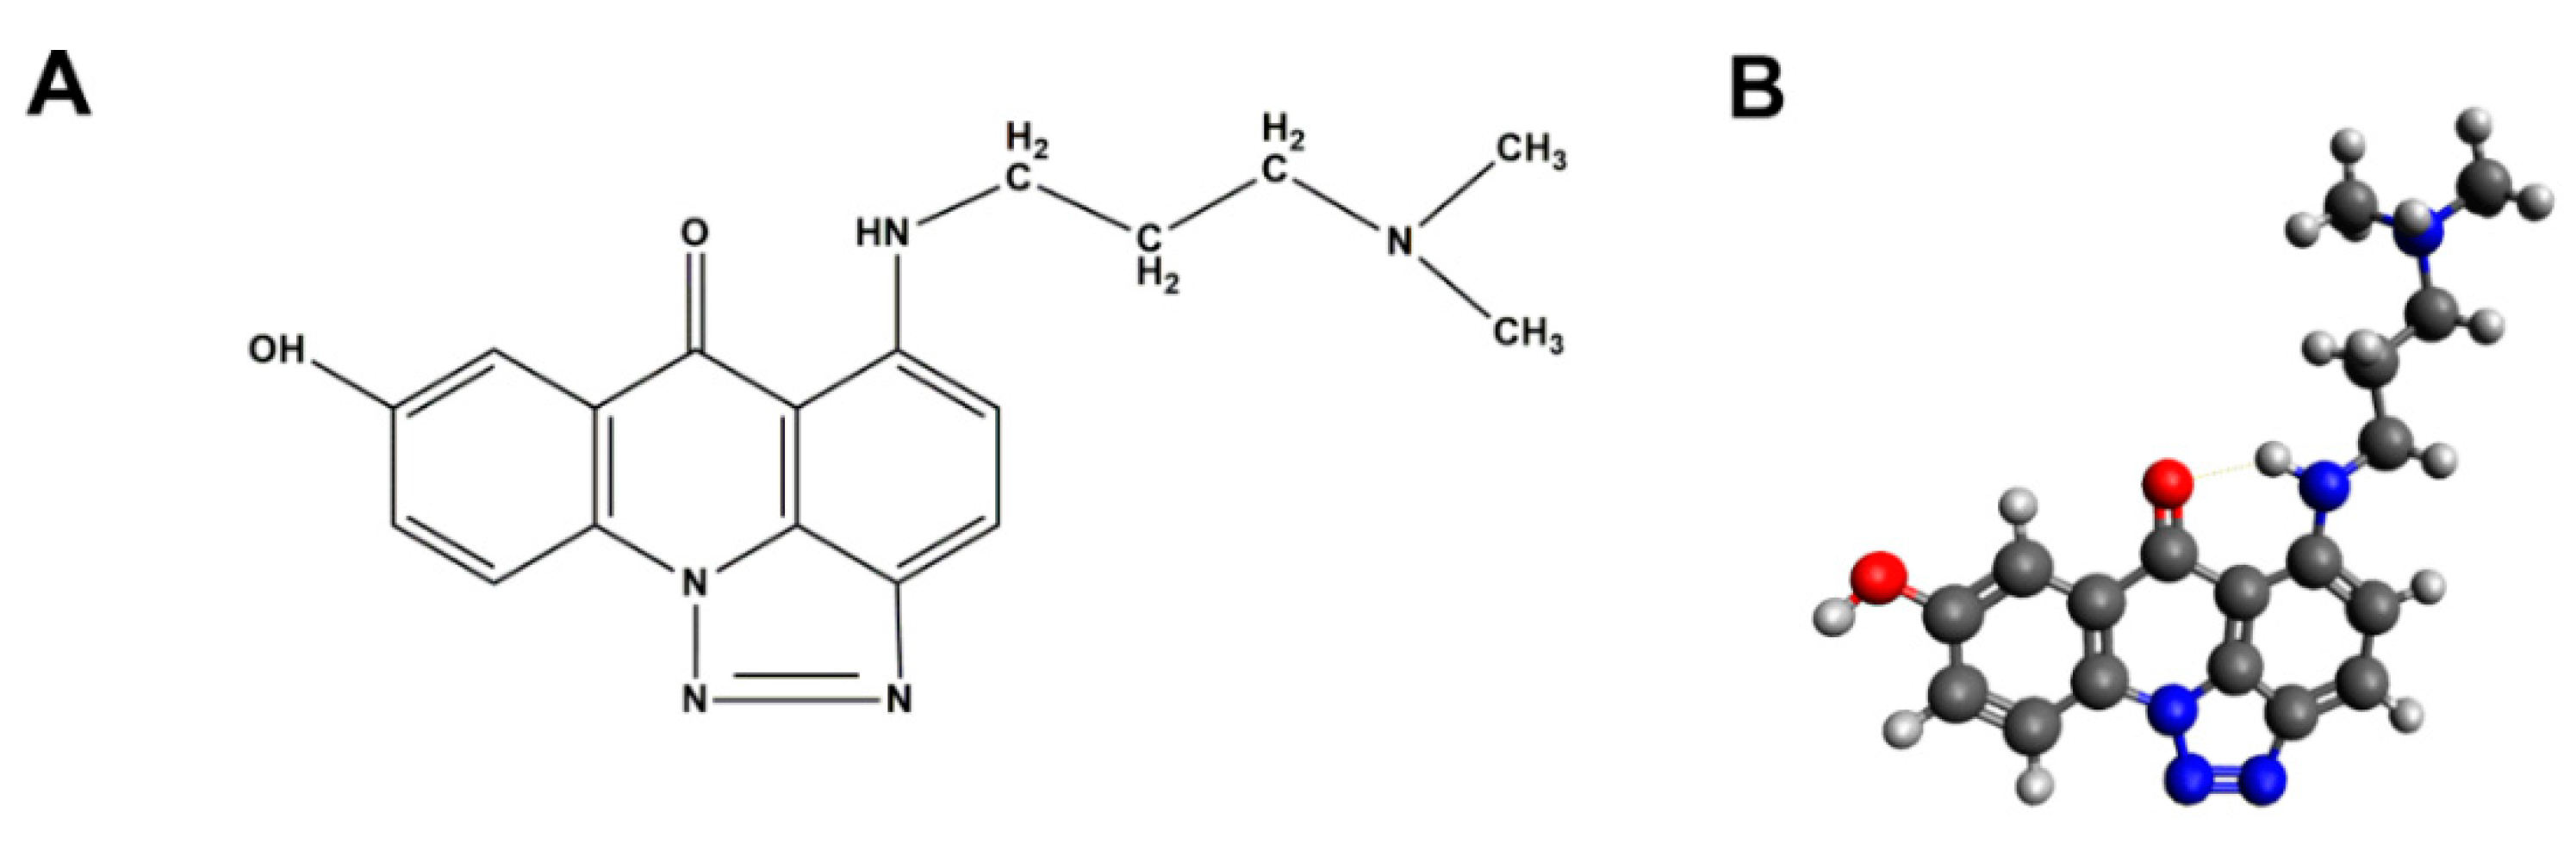
4.2. Chemicals
4.3. Isolation of RNA and Small ncRNA
4.4. Next Generation RNA Sequencing Analyses
4.5. Measurement of mRNA Levels Using Quantitative Real-Time PCR (qRT-PCR)
4.6. Cell Viability Assays
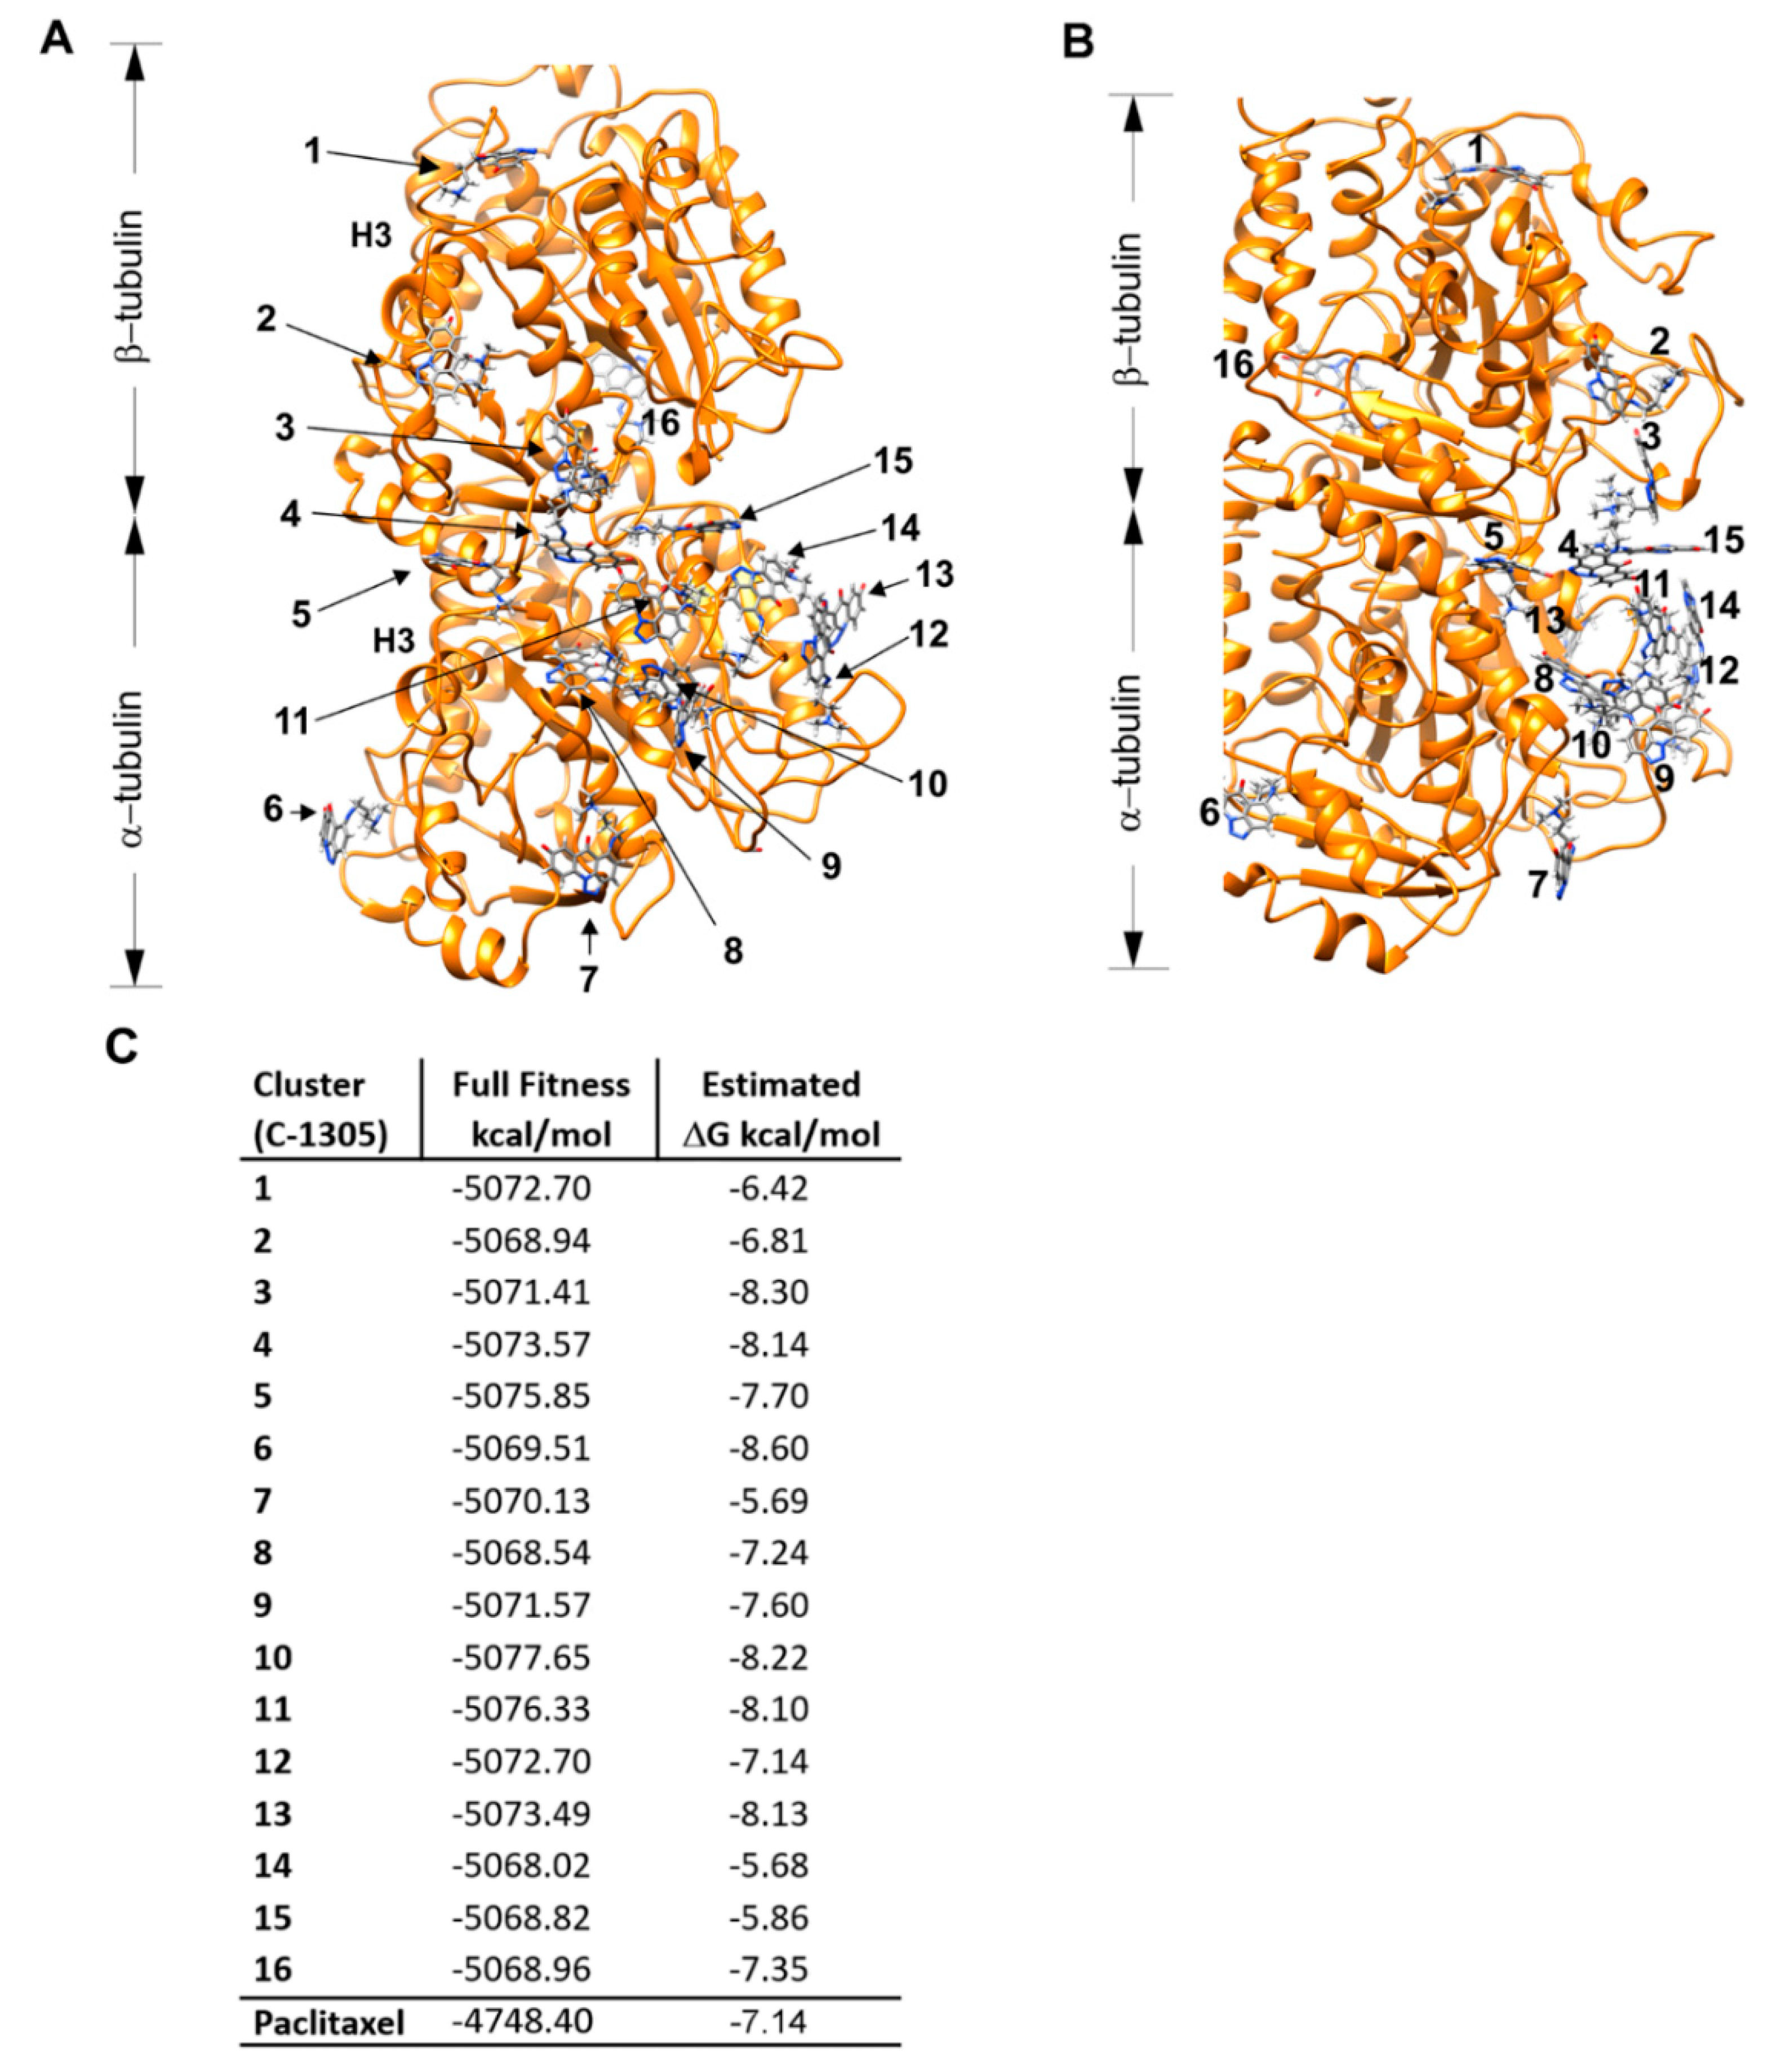
4.7. Molecular Docking
4.8. In Vitro Tubulin Polymerization Assays
4.9. Determination of the Monomeric and Polymeric Tubulin with Western Blot
4.10. Immunofluorescence Microscopy
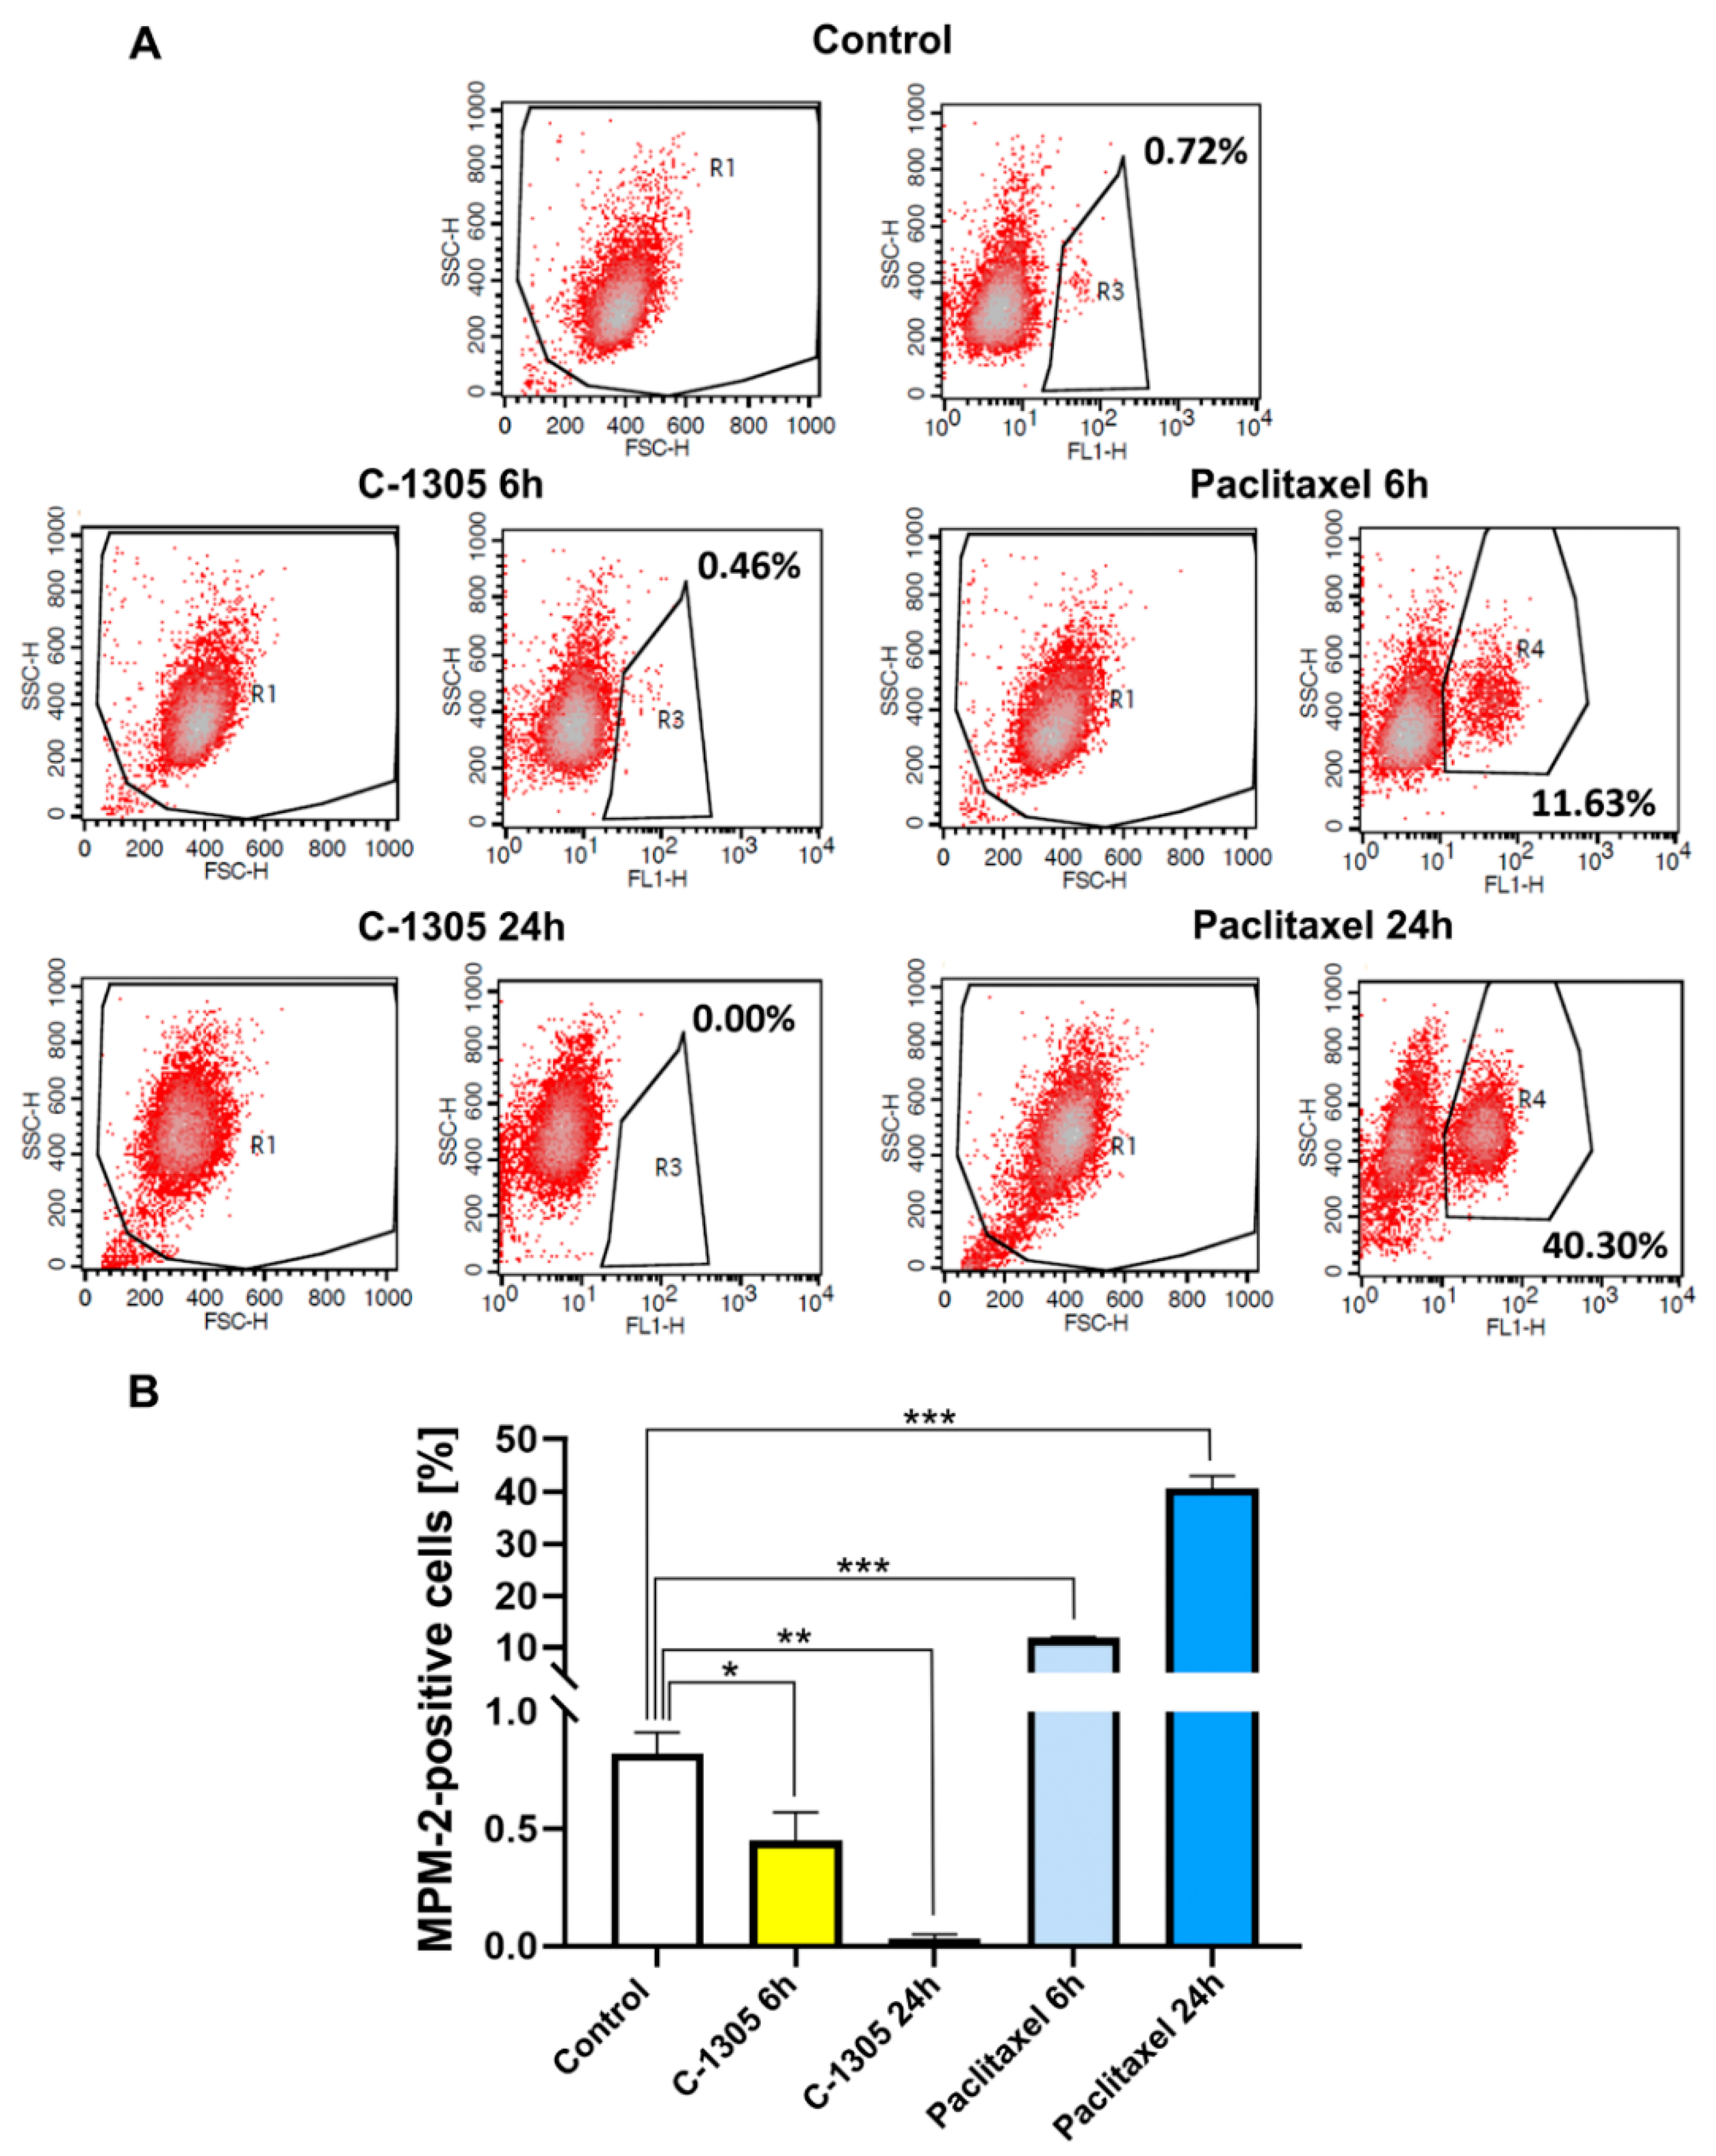
4.11. Mitotic Index
4.12. Statistical Analysis
4.13. Data Accessibility
5. Conclusions
Supplementary Materials
Author Contributions
Funding
Acknowledgments
Conflicts of Interest
References
- Bowes, J.; Brown, A.J.; Hamon, J.; Jarolimek, W.; Sridhar, A.; Waldron, G.; Whitebread, S. Reducing safety-related drug attrition: the use of in vitro pharmacological profiling. Nat. Rev. Drug Discov. 2012, 11, 909–922. [Google Scholar] [CrossRef] [PubMed]
- Bartoszewski, R.; Sikorski, A.F. Editorial focus: understanding off-target effects as the key to successful RNAi therapy. Cell. Mol. Biol. Lett. 2019, 24, 69. [Google Scholar] [CrossRef] [PubMed]
- Shapiro, E.; Biezuner, T.; Linnarsson, S. Single-cell sequencing-based technologies will revolutionize whole-organism science. Nat. Rev. Genet. 2013, 14, 618–630. [Google Scholar] [CrossRef] [PubMed]
- Wu, H.J.; Wang, C.; Wu, S.X. Single-Cell Sequencing for Drug Discovery and Drug Development. Curr. Top. Med. Chem. 2017, 17, 1769–1777. [Google Scholar] [CrossRef]
- Elmore, S. Apoptosis: A review of programmed cell death. Toxicol. Pathol. 2007, 35, 495–516. [Google Scholar] [CrossRef]
- Cholody, W.M.; Martelli, S.; Konopa, J. 8-Substituted 5-[(aminoalkyl)amino]-6H-v-triazolo[4,5,1-de]acridin-6-ones as potential antineoplastic agents. Synthesis and biological activity. J. Med. Chem. 1990, 33, 2852–2856. [Google Scholar] [CrossRef]
- Kusnierczyk, H.; Cholody, W.M.; Paradziej-Lukowicz, J.; Radzikowski, C.; Konopa, J. Experimental antitumor activity and toxicity of the selected triazolo- and imidazoacridinones. Arch. Immunol. Ther. Exp. (Warsz) 1994, 42, 415–423. [Google Scholar]
- Lemke, K.; Poindessous, V.; Skladanowski, A.; Larsen, A.K. The antitumor triazoloacridone C-1305 is a topoisomerase II poison with unusual properties. Mol. Pharmacol. 2004, 66, 1035–1042. [Google Scholar] [CrossRef]
- Bram, E.E.; Ifergan, I.; Grimberg, M.; Lemke, K.; Skladanowski, A.; Assaraf, Y.G. C421 allele-specific ABCG2 gene amplification confers resistance to the antitumor triazoloacridone C-1305 in human lung cancer cells. Biochem. Pharmacol. 2007, 74, 41–53. [Google Scholar] [CrossRef]
- Capps, D.B.; Dunbar, J.; Kesten, S.R.; Shillis, J.; Werbel, L.M.; Plowman, J.; Ward, D.L. 2-(aminoalkyl)-5-nitropyrazolo[3,4,5-kl]acridines, a new class of anticancer agents. J. Med. Chem. 1992, 35, 4770–4778. [Google Scholar] [CrossRef]
- Bartoszewski, R.; Gebert, M.; Janaszak-Jasiecka, A.; Cabaj, A.; Kroliczewski, J.; Bartoszewska, S.; Sobolewska, A.; Crossman, D.K.; Ochocka, R.; Kamysz, W.; et al. Genome-wide mRNA profiling identifies RCAN1 and GADD45A as regulators of the transitional switch from pro-survival to apoptosis during ER stress. FEBS J. 2019. [Google Scholar] [CrossRef]
- Bartoszewska, S.; Cabaj, A.; Dabrowski, M.; Collawn, J.F.; Bartoszewski, R. miR-34c-5p modulates X-box-binding protein 1 (XBP1) expression during the adaptive phase of the unfolded protein response. FASEB J. 2019, 33, 11541–11554. [Google Scholar] [CrossRef]
- Xi, B.A.; Wang, T.X.; Li, N.; Ouyang, W.; Zhang, W.; Wu, J.Y.; Xu, X.; Wang, X.B.; Abassi, Y.A. Functional Cardiotoxicity Profiling and Screening Using the xCELLigence RTCA Cardio System. Jala 2011, 16, 415–421. [Google Scholar] [CrossRef] [PubMed]
- Moniri, M.R.; Young, A.; Reinheimer, K.; Rayat, J.; Dai, L.J.; Warnock, G.L. Dynamic assessment of cell viability, proliferation and migration using real time cell analyzer system (RTCA). Cytotechnology 2015, 67, 379–386. [Google Scholar] [CrossRef] [PubMed]
- Wesierska-Gadek, J.; Schloffer, D.; Gueorguieva, M.; Uhl, M.; Skladanowski, A. Increased susceptibility of poly(ADP-ribose) polymerase-1 knockout cells to antitumor triazoloacridone C-1305 is associated with permanent G2 cell cycle arrest. Cancer Res. 2004, 64, 4487–4497. [Google Scholar] [CrossRef] [PubMed][Green Version]
- Gazdar, A.F.; Gao, B.N.; Minna, J.D. Lung cancer cell lines: Useless artifacts or invaluable tools for medical science? Lung Cancer 2010, 68, 309–318. [Google Scholar] [CrossRef]
- Ben-Ari Fuchs, S.; Lieder, I.; Stelzer, G.; Mazor, Y.; Buzhor, E.; Kaplan, S.; Bogoch, Y.; Plaschkes, I.; Shitrit, A.; Rappaport, N.; et al. GeneAnalytics: An Integrative Gene Set Analysis Tool for Next Generation Sequencing, RNAseq and Microarray Data. OMICS 2016, 20, 139–151. [Google Scholar] [CrossRef]
- Chen, E.Y.; Tan, C.M.; Kou, Y.; Duan, Q.; Wang, Z.; Meirelles, G.V.; Clark, N.R.; Ma’ayan, A. Enrichr: interactive and collaborative HTML5 gene list enrichment analysis tool. BMC Bioinform. 2013, 14, 128. [Google Scholar] [CrossRef]
- Liao, Y.; Wang, J.; Jaehnig, E.J.; Shi, Z.; Zhang, B. WebGestalt 2019: gene set analysis toolkit with revamped UIs and APIs. Nucleic Acids Res. 2019, 47, W199–W205. [Google Scholar] [CrossRef]
- Shibue, T.; Suzuki, S.; Okamoto, H.; Yoshida, H.; Ohba, Y.; Takaoka, A.; Taniguchi, T. Differential contribution of Puma and Noxa in dual regulation of p53-mediated apoptotic pathways. Embo J. 2006, 25, 4952–4962. [Google Scholar] [CrossRef]
- Marciniak, S.J.; Yun, C.Y.; Oyadomari, S.; Novoa, I.; Zhang, Y.H.; Jungreis, R.; Nagata, K.; Harding, H.P.; Ron, D. CHOP induces death by promoting protein synthesis and oxidation in the stressed endoplasmic reticulum. Genes Dev. 2004, 18, 3066–3077. [Google Scholar] [CrossRef] [PubMed]
- Jauhiainen, A.; Thomsen, C.; Strombom, L.; Grundevik, P.; Andersson, C.; Danielsson, A.; Andersson, M.K.; Nerman, O.; Rorkvist, L.; Stahlberg, A.; et al. Distinct cytoplasmic and nuclear functions of the stress induced protein DDIT3/CHOP/GADD153. PLoS ONE 2012, 7, e33208. [Google Scholar] [CrossRef] [PubMed]
- Chen, H.C.; Kanai, M.; Inoue-Yamauchi, A.; Tu, H.C.; Huang, Y.; Ren, D.; Kim, H.; Takeda, S.; Reyna, D.E.; Chan, P.M.; et al. An interconnected hierarchical model of cell death regulation by the BCL-2 family. Nat. Cell. Biol. 2015, 17, 1270–1281. [Google Scholar] [CrossRef] [PubMed]
- Salvador, J.M.; Brown-Clay, J.D.; Fornace, A.J. Gadd45 in Stress Signaling, Cell Cycle Control, and Apoptosis. Adv. Exp. Med. Biol. 2013, 793, 1–19. [Google Scholar] [CrossRef]
- Ren, D.; Tu, H.-C.; Kim, H.; Wang, G.X.; Bean, G.R.; Takeuchi, O.; Jeffers, J.R.; Zambetti, G.P.; Hsieh, J.J.D.; Cheng, E.H.Y. BID, BIM, and PUMA Are Essential for Activation of the BAX- and BAK-Dependent Cell Death Program. Science 2010, 330, 1390. [Google Scholar] [CrossRef]
- Scott, F.L.; Stec, B.; Pop, C.; Dobaczewska, M.K.; Lee, J.J.; Monosov, E.; Robinson, H.; Salvesen, G.S.; Schwarzenbacher, R.; Riedl, S.J. The Fas-FADD death domain complex structure unravels signalling by receptor clustering. Nature 2009, 457, 1019–1022. [Google Scholar] [CrossRef]
- Kuribayashi, K.; Finnberg, N.; Jeffers, J.R.; Zambetti, G.P.; El-Deiry, W.S. The relative contribution of pro-apoptotic p53-target genes in the triggering of apoptosis following DNA damage in vitro and in vivo. Cell Cycle 2011, 10, 2380–2389. [Google Scholar] [CrossRef]
- Shrestha, R.L.; Conti, D.; Tamura, N.; Braun, D.; Ramalingam, R.A.; Cieslinski, K.; Ries, J.; Draviam, V.M. Aurora-B kinase pathway controls the lateral to end-on conversion of kinetochore-microtubule attachments in human cells. Nat. Commun. 2017, 8, 150. [Google Scholar] [CrossRef]
- Pouwels, J.; Kukkonen, A.M.; Lan, W.; Daum, J.R.; Gorbsky, G.J.; Stukenberg, T.; Kallio, M.J. Shugoshin 1 plays a central role in kinetochore assembly and is required for kinetochore targeting of Plk1. Cell Cycle 2007, 6, 1579–1585. [Google Scholar] [CrossRef]
- Jackman, M.; Lindon, C.; Nigg, E.A.; Pines, J. Active cyclin B1-Cdk1 first appears on centrosomes in prophase. Nat. Cell. Biol. 2003, 5, 143–148. [Google Scholar] [CrossRef]
- Zhu, C.; Zhao, J.; Bibikova, M.; Leverson, J.D.; Bossy-Wetzel, E.; Fan, J.-B.; Abraham, R.T.; Jiang, W. Functional Analysis of Human Microtubule-based Motor Proteins, the Kinesins and Dyneins, in Mitosis/Cytokinesis Using RNA Interference. Mol. Biol. Cell 2005, 16, 3187–3199. [Google Scholar] [CrossRef] [PubMed]
- Rapley, J.; Nicolas, M.; Groen, A.; Regue, L.; Bertran, M.T.; Caelles, C.; Avruch, J.; Roig, J. The NIMA-family kinase Nek6 phosphorylates the kinesin Eg5 at a novel site necessary for mitotic spindle formation. J. Cell. Sci. 2008, 121, 3912–3921. [Google Scholar] [CrossRef] [PubMed]
- van Heesbeen, R.G.H.P.; Tanenbaum, M.E.; Medema, R.H. Balanced Activity of Three Mitotic Motors Is Required for Bipolar Spindle Assembly and Chromosome Segregation. Cell Rep. 2014, 8, 948–956. [Google Scholar] [CrossRef] [PubMed]
- Huang, Y.; Yao, Y.; Xu, H.Z.; Wang, Z.G.; Lu, L.; Dai, W. Defects in chromosome congression and mitotic progression in KIF18A-deficient cells are partly mediated through impaired functions of CENP-E. Cell Cycle 2009, 8, 2643–2649. [Google Scholar] [CrossRef]
- Tanenbaum, M.E.; Macurek, L.; van der Vaart, B.; Galli, M.; Akhmanova, A.; Medema, R.H. A Complex of Kif18b and MCAK Promotes Microtubule Depolymerization and Is Negatively Regulated by Aurora Kinases. Curr. Biol. 2011, 21, 1356–1365. [Google Scholar] [CrossRef]
- Tokai, N.; Fujimoto-Nishiyama, A.; Toyoshima, Y.; Yonemura, S.; Tsukita, S.; Inoue, J.; Yamamota, T. Kid, a novel kinesin-like DNA binding protein, is localized to chromosomes and the mitotic spindle. Embo J. 1996, 15, 457–467. [Google Scholar] [CrossRef]
- Bourhis, E.; Lingel, A.; Phung, Q.; Fairbrother, W.J.; Cochran, A.G. Phosphorylation of a borealin dimerization domain is required for proper chromosome segregation. Biochemistry 2009, 48, 6783–6793. [Google Scholar] [CrossRef]
- Vong, Q.P.; Cao, K.; Li, H.Y.; Iglesias, P.A.; Zheng, Y. Chromosome alignment and segregation regulated by ubiquitination of survivin. Science 2005, 310, 1499–1504. [Google Scholar] [CrossRef]
- Cheng, Y.-M.; Tsai, C.-C.; Hsu, Y.-C. Sulforaphane, a Dietary Isothiocyanate, Induces G2/M Arrest in Cervical Cancer Cells through CyclinB1 Downregulation and GADD45β/CDC2 Association. Int. J. Mol. Sci. 2016, 17, 1530. [Google Scholar] [CrossRef]
- Bellanger, S.; de Gramont, A.; Sobczak-Thepot, J. Cyclin B2 suppresses mitotic failure and DNA re-replication in human somatic cells knocked down for both cyclins B1 and B2. Oncogene 2007, 26, 7175–7184. [Google Scholar] [CrossRef]
- Kraft, C.; Herzog, F.; Gieffers, C.; Mechtler, K.; Hagting, A.; Pines, J.; Peters, J.M. Mitotic regulation of the human anaphase-promoting complex by phosphorylation. Embo J. 2003, 22, 6598–6609. [Google Scholar] [CrossRef] [PubMed]
- Lukasova, E.; Kovar ik, A.; Bac ikova, A.; Falk, M.; Kozubek, S. Loss of lamin B receptor is necessary to induce cellular senescence. Biochem. J. 2017, 474, 281–300. [Google Scholar] [CrossRef] [PubMed]
- Liao, H.; Winkfein, R.J.; Mack, G.; Rattner, J.B.; Yen, T.J. CENP-F is a protein of the nuclear matrix that assembles onto kinetochores at late G2 and is rapidly degraded after mitosis. J. Cell. Biol. 1995, 130, 507–518. [Google Scholar] [CrossRef] [PubMed]
- Hung, L.Y.; Chen, H.L.; Chang, C.W.; Li, B.R.; Tang, T.K. Identification of a novel microtubule-destabilizing motif in CPAP that binds to tubulin heterodimers and inhibits microtubule assembly. Mol. Biol. Cell. 2004, 15, 2697–2706. [Google Scholar] [CrossRef] [PubMed]
- Cheeseman, I.M.; Hori, T.; Fukagawa, T.; Desai, A. KNL1 and the CENP-H/I/K complex coordinately direct kinetochore assembly in vertebrates. Mol. Biol. Cell. 2008, 19, 587–594. [Google Scholar] [CrossRef] [PubMed]
- McKinley, K.L.; Sekulic, N.; Guo, L.Y.; Tsinman, T.; Black, B.E.; Cheeseman, I.M. The CENP-L-N Complex Forms a Critical Node in an Integrated Meshwork of Interactions at the Centromere-Kinetochore Interface. Mol. Cell. 2015, 60, 886–898. [Google Scholar] [CrossRef] [PubMed]
- Bancroft, J.; Auckland, P.; Samora, C.P.; McAinsh, A.D. Chromosome congression is promoted by CENP-Q- and CENP-E-dependent pathways. J. Cell. Sci. 2015, 128, 171–184. [Google Scholar] [CrossRef]
- Wang, Z.; Liu, Y.; Zhang, P.; Zhang, W.; Wang, W.; Curr, K.; Wei, G.; Mao, J.H. FAM83D promotes cell proliferation and motility by downregulating tumor suppressor gene FBXW7. Oncotarget 2013, 4, 2476–2486. [Google Scholar] [CrossRef]
- Pe’er, T.; Lahmi, R.; Sharaby, Y.; Chorni, E.; Noach, M.; Vecsler, M.; Zlotorynski, E.; Steen, H.; Steen, J.A.; Tzur, A. Gas2l3, a novel constriction site-associated protein whose regulation is mediated by the APC/C Cdh1 complex. PLoS ONE 2013, 8, e57532. [Google Scholar] [CrossRef]
- Li, C.; Zhang, Y.; Yang, Q.; Ye, F.; Sun, S.Y.; Chen, E.S.; Liou, Y.C. NuSAP modulates the dynamics of kinetochore microtubules by attenuating MCAK depolymerisation activity. Sci. Rep. 2016, 6, 18773. [Google Scholar] [CrossRef]
- Kellogg, E.H.; Howes, S.; Ti, S.C.; Ramirez-Aportela, E.; Kapoor, T.M.; Chacon, P.; Nogales, E. Near-atomic cryo-EM structure of PRC1 bound to the microtubule. Proc. Natl. Acad. Sci. USA 2016, 113, 9430–9439. [Google Scholar] [CrossRef] [PubMed]
- Welburn, J.P.; Grishchuk, E.L.; Backer, C.B.; Wilson-Kubalek, E.M.; Yates, J.R., 3rd; Cheeseman, I.M. The human kinetochore Ska1 complex facilitates microtubule depolymerization-coupled motility. Dev. Cell 2009, 16, 374–385. [Google Scholar] [CrossRef] [PubMed]
- Rubin, C.I.; Atweh, G.F. The role of stathmin in the regulation of the cell cycle. J. Cell. Biochem. 2004, 93, 242–250. [Google Scholar] [CrossRef] [PubMed]
- Polyak, K.; Xia, Y.; Zweier, J.L.; Kinzler, K.W.; Vogelstein, B. A model for p53-induced apoptosis. Nature 1997, 389, 300–305. [Google Scholar] [CrossRef]
- Seillier, M.; Peuget, S.; Gayet, O.; Gauthier, C.; N’Guessan, P.; Monte, M.; Carrier, A.; Iovanna, J.L.; Dusetti, N.J. TP53INP1, a tumor suppressor, interacts with LC3 and ATG8-family proteins through the LC3-interacting region (LIR) and promotes autophagy-dependent cell death. Cell Death Differ. 2012, 19, 1525–1535. [Google Scholar] [CrossRef] [PubMed]
- Hemavathy, K.; Guru, S.C.; Harris, J.; Chen, J.D.; Ip, Y.T. Human Slug is a repressor that localizes to sites of active transcription. Mol. Cell. Biol. 2000, 20, 5087–5095. [Google Scholar] [CrossRef]
- Khoury-Haddad, H.; Guttmann-Raviv, N.; Ipenberg, I.; Huggins, D.; Jeyasekharan, A.D.; Ayoub, N. PARP1-dependent recruitment of KDM4D histone demethylase to DNA damage sites promotes double-strand break repair. Proc. Natl. Acad. Sci. USA 2014, 111, E728–E737. [Google Scholar] [CrossRef]
- Zhu, L.; Chen, L. Progress in research on paclitaxel and tumor immunotherapy. Cell. Mol. Biol. Lett. 2019, 24, 40. [Google Scholar] [CrossRef]
- Snyder, J.P.; Nettles, J.H.; Cornett, B.; Downing, K.H.; Nogales, E. The binding conformation of Taxol in beta-tubulin: A model based on electron crystallographic density. Proc. Natl. Acad. Sci. USA 2001, 98, 5312–5316. [Google Scholar] [CrossRef]
- Farce, A.; Loge, C.; Gallet, S.; Lebegue, N.; Carato, P.; Chavatte, P.; Berthelot, P.; Lesieur, D. Docking study of ligands into the colchicine binding site of tubulin. J. Enzyme. Inhib. Med. Chem. 2004, 19, 541–547. [Google Scholar] [CrossRef]
- Pettersen, E.F.; Goddard, T.D.; Huang, C.C.; Couch, G.S.; Greenblatt, D.M.; Meng, E.C.; Ferrin, T.E. UCSF Chimera—A visualization system for exploratory research and analysis. J. Comput. Chem. 2004, 25, 1605–1612. [Google Scholar] [CrossRef] [PubMed]
- Nogales, E.; Wolf, S.G.; Downing, K.H. Structure of the alpha beta tubulin dimer by electron crystallography. Nature 1998, 391, 199–203. [Google Scholar] [CrossRef] [PubMed]
- Irwin, J.J.; Shoichet, B.K. ZINC—A free database of commercially available compounds for virtual screening. J. Chem. Inf. Model. 2005, 45, 177–182. [Google Scholar] [CrossRef] [PubMed]
- Shoffner, S.K.; Schnell, S. Estimation of the lag time in a subsequent monomer addition model for fibril elongation. Phys. Chem. Chem. Phys. 2016, 18, 21259–21268. [Google Scholar] [CrossRef] [PubMed]
- Martel-Frachet, V.; Keramidas, M.; Nurisso, A.; DeBonis, S.; Rome, C.; Coll, J.L.; Boumendjel, A.; Skoufias, D.A.; Ronot, X. IPP51, a chalcone acting as a microtubule inhibitor with in vivo antitumor activity against bladder carcinoma. Oncotarget 2015, 6, 14669–14686. [Google Scholar] [CrossRef] [PubMed]
- Risinger, A.L.; Li, J.; Bennett, M.J.; Rohena, C.C.; Peng, J.; Schriemer, D.C.; Mooberry, S.L. Taccalonolide binding to tubulin imparts microtubule stability and potent in vivo activity. Cancer Res. 2013, 73, 6780–6792. [Google Scholar] [CrossRef] [PubMed]
- Mu, Y.; Liu, Y.; Li, L.; Tian, C.; Zhou, H.; Zhang, Q.; Yan, B. The Novel Tubulin Polymerization Inhibitor MHPT Exhibits Selective Anti-Tumor Activity against Rhabdomyosarcoma In Vitro and In Vivo. PLOS ONE 2015, 10, e0121806. [Google Scholar] [CrossRef]
- Augustin, E.; Mos-Rompa, A.; Skwarska, A.; Witkowski, J.M.; Konopa, J. Induction of G2/M phase arrest and apoptosis of human leukemia cells by potent antitumor triazoloacridinone C-1305. Biochem. Pharmacol. 2006, 72, 1668–1679. [Google Scholar] [CrossRef]
- Wahl, A.F.; Donaldson, K.L.; Fairchild, C.; Lee, F.Y.; Foster, S.A.; Demers, G.W.; Galloway, D.A. Loss of normal p53 function confers sensitization to Taxol by increasing G2/M arrest and apoptosis. Nat. Med. 1996, 2, 72–79. [Google Scholar] [CrossRef]
- Horwitz, S.B. Taxol (paclitaxel): mechanisms of action. Ann. Oncol. 1994, 5 Suppl 6, S3-6. [Google Scholar]
- Bollag, D.M.; Mcqueney, P.A.; Zhu, J.; Hensens, O.; Koupal, L.; Liesch, J.; Goetz, M.; Lazarides, E.; Woods, C.M. Epothilones, a New Class of Microtubule-Stabilizing Agents with a Taxol-Like Mechanism of Action. Cancer Res. 1995, 55, 2325–2333. [Google Scholar] [PubMed]
- Blajeski, A.L.; Phan, V.A.; Kottke, T.J.; Kaufmann, S.H. G(1) and G(2) cell-cycle arrest following microtubule depolymerization in human breast cancer cells. J. Clin. Investig. 2002, 110, 91–99. [Google Scholar] [CrossRef] [PubMed]
- Lemke, K.; Wojciechowski, M.; Laine, W.; Bailly, C.; Colson, P.; Baginski, M.; Larsen, A.K.; Skladanowski, A. Induction of unique structural changes in guanine-rich DNA regions by the triazoloacridone C-1305, a topoisomerase II inhibitor with antitumor activities. Nucleic Acids Res. 2005, 33, 6034–6047. [Google Scholar] [CrossRef] [PubMed]
- Koba, M.; Konopa, J. Interactions of antitumor triazoloacridinones with DNA. Acta. Biochim. Pol. 2007, 54, 297–306. [Google Scholar] [CrossRef] [PubMed]
- Wang, J.C. Cellular roles of DNA topoisomerases: A molecular perspective. Nat. Rev. Mol. Cell. Biol. 2002, 3, 430–440. [Google Scholar] [CrossRef] [PubMed]
- Pawlowska, M.; Augustin, E.; Mazerska, Z. CYP3A4 overexpression enhances apoptosis induced by anticancer agent imidazoacridinone C-1311, but does not change the metabolism of C-1311 in CHO cells. Acta. Pharmacol. Sin. 2014, 35, 98–112. [Google Scholar] [CrossRef] [PubMed]
- Niemira, M.; Dastych, J.; Mazerska, Z. Pregnane X receptor dependent up-regulation of CYP2C9 and CYP3A4 in tumor cells by antitumor acridine agents, C-1748 and C-1305, selectively diminished under hypoxia. Biochem. Pharmacol. 2013, 86, 231–241. [Google Scholar] [CrossRef]
- Augustin, E.; Skwarska, A.; Weryszko, A.; Pelikant, I.; Sankowska, E.; Borowa-Mazgaj, B. The antitumor compound triazoloacridinone C-1305 inhibits FLT3 kinase activity and potentiates apoptosis in mutant FLT3-ITD leukemia cells. Acta Pharm. Sin. 2015, 36, 385–399. [Google Scholar] [CrossRef]
- Kanai, M.; Tong, W.M.; Sugihara, E.; Wang, Z.Q.; Fukasawa, K.; Miwa, M. Involvement of poly(ADP-Ribose) polymerase 1 and poly(ADP-Ribosyl)ation in regulation of centrosome function. Mol. Cell. Biol. 2003, 23, 2451–2462. [Google Scholar] [CrossRef]
- Giannakakou, P.; Sackett, D.L.; Ward, Y.; Webster, K.R.; Blagosklonny, M.V.; Fojo, T. p53 is associated with cellular microtubules and is transported to the nucleus by dynein. Nat. Cell Biol. 2000, 2, 709–717. [Google Scholar] [CrossRef]
- Contadini, C.; Monteonofrio, L.; Virdia, I.; Prodosmo, A.; Valente, D.; Chessa, L.; Musio, A.; Fava, L.L.; Rinaldo, C.; Di Rocco, G.; et al. p53 mitotic centrosome localization preserves centrosome integrity and works as sensor for the mitotic surveillance pathway. Cell. Death. Dis. 2019, 10. [Google Scholar] [CrossRef] [PubMed]
- Slade, D. Mitotic functions of poly(ADP-ribose) polymerases. Biochem. Pharmacol. 2019, 167, 33–43. [Google Scholar] [CrossRef] [PubMed]
- Galmarini, C.M.; Kamath, K.; Vanier-Viornery, A.; Hervieu, V.; Peiller, E.; Falette, N.; Puisieux, A.; Jordan, M.A.; Dumontet, C. Drug resistance associated with loss of p53 involves extensive alterations in microtubule composition and dynamics. Br. J. Cancer 2003, 88, 1793–1799. [Google Scholar] [CrossRef] [PubMed]
- Topcul, M.; Ceti, N.I.; Ozbas Turan, S.; Kolusayin Ozar, M.O. In vitro cytotoxic effect of PARP inhibitor alone and in combination with nabpaclitaxel on triplenegative and luminal A breast cancer cells. Oncol. Rep. 2018, 40, 527–535. [Google Scholar] [CrossRef]
- Lu, Y.; Liu, Y.; Pang, Y.; Pacak, K.; Yang, C. Double-barreled gun: Combination of PARP inhibitor with conventional chemotherapy. Pharmacol. Ther. 2018, 188, 168–175. [Google Scholar] [CrossRef]
- Solary, E.; Leteurtre, F.; Paull, K.D.; Scudiero, D.; Hamel, E.; Pommier, Y. Dual inhibition of topoisomerase II and tubulin polymerization by azatoxin, a novel cytotoxic agent. Biochem. Pharmacol. 1993, 45, 2449–2456. [Google Scholar] [CrossRef]
- Yi, J.M.; Zhang, X.F.; Huan, X.J.; Song, S.S.; Wang, W.; Tian, Q.T.; Sun, Y.M.; Chen, Y.; Ding, J.; Wang, Y.Q.; et al. Dual targeting of microtubule and topoisomerase II by alpha-carboline derivative YCH337 for tumor proliferation and growth inhibition. Oncotarget 2015, 6, 8960–8973. [Google Scholar] [CrossRef]
- Hevener, K.; Verstak, T.A.; Lutat, K.E.; Riggsbee, D.L.; Mooney, J.W. Recent developments in topoisomerase-targeted cancer chemotherapy. Acta Pharm. Sin. B 2018, 8, 844–861. [Google Scholar] [CrossRef]
- Cozens, A.L.; Yezzi, M.J.; Kunzelmann, K.; Ohrui, T.; Chin, L.; Eng, K.; Finkbeiner, W.E.; Widdicombe, J.H.; Gruenert, D.C. CFTR expression and chloride secretion in polarized immortal human bronchial epithelial cells. Am. J. Respir. Cell. Mol. Biol. 1994, 10, 38–47. [Google Scholar] [CrossRef]
- Dobin, A.; Davis, C.A.; Schlesinger, F.; Drenkow, J.; Zaleski, C.; Jha, S.; Batut, P.; Chaisson, M.; Gingeras, T.R. STAR: ultrafast universal RNA-seq aligner. Bioinformatics 2013, 29, 15–21. [Google Scholar] [CrossRef]
- Trapnell, C.; Williams, B.A.; Pertea, G.; Mortazavi, A.; Kwan, G.; van Baren, M.J.; Salzberg, S.L.; Wold, B.J.; Pachter, L. Transcript assembly and quantification by RNA-Seq reveals unannotated transcripts and isoform switching during cell differentiation. Nat. Biotechnol. 2010, 28, 511. [Google Scholar] [CrossRef] [PubMed]
- Anders, S.; Pyl, P.T.; Huber, W. HTSeq—A Python framework to work with high-throughput sequencing data. Bioinformatics 2015, 31, 166–169. [Google Scholar] [CrossRef] [PubMed]
- Love, M.I.; Huber, W.; Anders, S. Moderated estimation of fold change and dispersion for RNA-seq data with DESeq2. Genome Biol. 2014, 15, 550. [Google Scholar] [CrossRef] [PubMed]
- Larionov, A.; Krause, A.; Miller, W. A standard curve based method for relative real time PCR data processing. BMC Bioinform. 2005, 6, 62. [Google Scholar] [CrossRef]
- Bartoszewski, R.; Hering, A.; Marszall, M.; Stefanowicz Hajduk, J.; Bartoszewska, S.; Kapoor, N.; Kochan, K.; Ochocka, R. Mangiferin has an additive effect on the apoptotic properties of hesperidin in Cyclopia sp. tea extracts. PLoS ONE 2014, 9, e92128. [Google Scholar] [CrossRef]
- SwissDock. Available online: www.swissdock.ch/docking# (accessed on 25 March 2020).
- Grosdidier, A.; Zoete, V.; Michielin, O. EADock: docking of small molecules into protein active sites with a multiobjective evolutionary optimization. Proteins 2007, 67, 1010–1025. [Google Scholar] [CrossRef]
- Hanwell, M.D.; Curtis, D.E.; Lonie, D.C.; Vandermeersch, T.; Zurek, E.; Hutchison, G.R. Avogadro: an advanced semantic chemical editor, visualization, and analysis platform. J. Cheminform. 2012, 4, 17. [Google Scholar] [CrossRef]
- Prota, A.E.; Danel, F.; Bachmann, F.; Bargsten, K.; Buey, R.M.; Pohlmann, J.; Reinelt, S.; Lane, H.; Steinmetz, M.O. The novel microtubule-destabilizing drug BAL27862 binds to the colchicine site of tubulin with distinct effects on microtubule organization. J. Mol. Biol. 2014, 426, 1848–1860. [Google Scholar] [CrossRef]
- Shelanski, M.L.; Gaskin, F.; Cantor, C.R. Microtubule assembly in the absence of added nucleotides. Proc. Natl. Acad. Sci. USA 1973, 70, 765–768. [Google Scholar] [CrossRef]
- Kavallaris, M.; Tait, A.S.; Walsh, B.J.; He, L.; Horwitz, S.B.; Norris, M.D.; Haber, M. Multiple microtubule alterations are associated with Vinca alkaloid resistance in human leukemia cells. Cancer Res. 2001, 61, 5803–5809. [Google Scholar]
- Kruskal, W.H.; Wallis, W.A. Use of Ranks in One-Criterion Variance Analysis. J. Am. Stat. Assoc. 1952, 47, 583–621. [Google Scholar] [CrossRef]
- Dunn, O.J. Multiple Comparisons Using Rank Sums. Technometrics 1964, 6, 241. [Google Scholar] [CrossRef]
- Gene Expression Omnibus (GEO). Available online: www.ncbi.nlm.nih.gov/geo/query/acc.cgi?acc=GSE143649 (accessed on 25 March 2020).


| Gene | Function | Reference |
|---|---|---|
| BBC3 | Mediator of p53/TP53-dependent/independent apoptosis | [20] |
| DDIT3 | Multifunctional transcription factor in the response to cell stresses; induces cell cycle arrest and apoptosis in response to endoplasmic reticulum (ER) stress | [21,22] |
| BAX | Regulator of the mitochondrial apoptotic process | [23] |
| BAD | Promotes cell death | [23] |
| GADD45A | ER stress dependent/apoptotic | [24] |
| BID | Pro-apoptotic member of the B-cell lymphoma-2 (Bcl-2) protein family | [25] |
| FADD | Apoptotic adaptor molecule that recruits caspases to the activated Fas or TNFR-1 receptors. | [26] |
| TP53 | Tumor suppressor in many tumor types; induces growth arrest or apoptosis | [27] |
| AURKB | Regulator of mitosis involved in the bipolar attachment of spindle microtubules to kinetochores | [28] |
| PLK1 | Kinetochore assembly | [29] |
| CDK1 | Regulate mitotic entry, centrosome separation and spindle assembly | [30] |
| KIFC1 | Regulate chromosome congression and alignment and bipolar spindle formation | [31] |
| KIF11 | Establishing a bipolar spindle during mitosis | [32] |
| KIF14 | Regulate chromosome congression and alignment | [31] |
| KIF15 | Involved in mitotic spindle assembly | [33] |
| KIF18A | Regulate chromosome congression and alignment | [34] |
| KIF18B | Microtubule movement and depolymerization | [35] |
| KIF20A | Cytokinesis | [31] |
| KIF22 | Spindle formation and the movements of chromosomes during mitosis | [36] |
| KIF23 | Cytokinesis | [31] |
| KIF4A | Anaphase spindle dynamics and cytokinesis | [31] |
| CDCA8 | Mitosis regulation, microtubule stabilization and spindle assembly | [37] |
| BIRC5 | Chromosome alignment and segregation during mitosis and cytokinesis | [38] |
| CCNB1 | Control of the cell cycle at the G2/M (mitosis) transition | [39] |
| CCNB2 | Control of the cell cycle at the G2/M (mitosis) transition | [40] |
| CDC20 | Mitotic regulation of the human anaphase | [41] |
| LMNB1 | Interact with chromatin and promote senescence | [42] |
| CENPF | Regulate kinetochore function and chromosome segregation in mitosis | [43] |
| CENPJ | Inhibits cell proliferation and induces apoptosis after G2/M arrest | [44] |
| CENPK | Assembly of kinetochore proteins, mitotic progression and chromosome segregation | [45] |
| CENPN | Assembly of kinetochore proteins, mitotic progression and chromosome segregation | [46] |
| CENPQ | Assembly of kinetochore proteins, mitotic progression and chromosome segregation | [47] |
| FAM83D | Cell proliferation, growth, and migration | [48] |
| GAS2L3 | Cytokinesis/Stabilize the formation of the actin and microtubule network | [49] |
| NUSAP1 | Promote the organization of mitotic spindle microtubules | [50] |
| PRC1 | Cytokinesis and microtubule assembly | [51] |
| SKA1 | Chromosome segregation and microtubule depolymerization | [52] |
| STMN1 | Regulation of the microtubule filament system by destabilizing microtubules | [53] |
| TP53I3 | Generation of reactive oxygen species (ROS)/Apoptosis | [54] |
| TP53INP1 | Proapoptotic protein and regulator of transcription and autophagy | [55] |
| SNAI2 | Transcriptional repressor | [56] |
| PARP | Mediates poly-ADP-ribosylation of proteins/DNA repair | [57] |
© 2020 by the authors. Licensee MDPI, Basel, Switzerland. This article is an open access article distributed under the terms and conditions of the Creative Commons Attribution (CC BY) license (http://creativecommons.org/licenses/by/4.0/).
Share and Cite
Króliczewski, J.; Bartoszewska, S.; Dudkowska, M.; Janiszewska, D.; Biernatowska, A.; Crossman, D.K.; Krzymiński, K.; Wysocka, M.; Romanowska, A.; Baginski, M.; et al. Utilizing Genome-Wide mRNA Profiling to Identify the Cytotoxic Chemotherapeutic Mechanism of Triazoloacridone C-1305 as Direct Microtubule Stabilization. Cancers 2020, 12, 864. https://doi.org/10.3390/cancers12040864
Króliczewski J, Bartoszewska S, Dudkowska M, Janiszewska D, Biernatowska A, Crossman DK, Krzymiński K, Wysocka M, Romanowska A, Baginski M, et al. Utilizing Genome-Wide mRNA Profiling to Identify the Cytotoxic Chemotherapeutic Mechanism of Triazoloacridone C-1305 as Direct Microtubule Stabilization. Cancers. 2020; 12(4):864. https://doi.org/10.3390/cancers12040864
Chicago/Turabian StyleKróliczewski, Jarosław, Sylwia Bartoszewska, Magdalena Dudkowska, Dorota Janiszewska, Agnieszka Biernatowska, David K. Crossman, Karol Krzymiński, Małgorzata Wysocka, Anna Romanowska, Maciej Baginski, and et al. 2020. "Utilizing Genome-Wide mRNA Profiling to Identify the Cytotoxic Chemotherapeutic Mechanism of Triazoloacridone C-1305 as Direct Microtubule Stabilization" Cancers 12, no. 4: 864. https://doi.org/10.3390/cancers12040864
APA StyleKróliczewski, J., Bartoszewska, S., Dudkowska, M., Janiszewska, D., Biernatowska, A., Crossman, D. K., Krzymiński, K., Wysocka, M., Romanowska, A., Baginski, M., Markuszewski, M., Ochocka, R. J., Collawn, J. F., Sikorski, A. F., Sikora, E., & Bartoszewski, R. (2020). Utilizing Genome-Wide mRNA Profiling to Identify the Cytotoxic Chemotherapeutic Mechanism of Triazoloacridone C-1305 as Direct Microtubule Stabilization. Cancers, 12(4), 864. https://doi.org/10.3390/cancers12040864