Article

A Novel Role for the Tumor Suppressor Gene ITF2 in Tumorigenesis and Chemotherapy Response

by
Olga Pernía
1,2,†,
Ana Sastre-Perona
1,2,3,†,
Carlos Rodriguez-Antolín
1,2,
Alvaro García-Guede
1,2,
María Palomares-Bralo
4,5,
Rocío Rosas
1,2,
Darío Sanchez-Cabrero
2,
Patricia Cruz
2,
Carmen Rodriguez
1,2,
MDolores Diestro
6,
Rubén Martín-Arenas
4,5,
Verónica Pulido
1,2,
Pilar Santisteban
3,7,
Javier de Castro
2,
Olga Vera
8,* and
Inmaculada Ibáñez de Cáceres
1,2,*
1
Epigenetics Laboratory, INGEMM, Hospital La PAZ. 28046 Madrid, Spain
2
Experimental Therapies and novel biomarkers in cancer IdiPAZ. 28046 Madrid, Spain
3
Instituto de Investigaciones Biomedicas CSIC/UAM. 28029 Madrid, Spain
4
Ciber de Enfermedades Raras (CIBERER). Instituto de Salud Carlos III (ISCIII), 28029 Madrid, Spain
5
Laboratorio de Genómica Estructural y Funcional, INGEMM. IdiPAZ. 28046 Madrid, Spain
6
Gynaecologic Oncology Unit, La Paz University Hospital, 28046 Madrid, Spain
7
Ciber de Cáncer (CIBERONC) Instituto de Salud Carlos III (ISCIII), 28029 Madrid, Spain
8
Department of Molecular Oncology, H. Lee Moffitt Cancer Center and Research Institute, Tampa, FL 33612, USA
*
Authors to whom correspondence should be addressed.
Both authors contributed equally to this work.
Cancers 2020, 12(4), 786; https://doi.org/10.3390/cancers12040786
Submission received: 27 February 2020 / Revised: 22 March 2020 / Accepted: 24 March 2020 / Published: 26 March 2020
(This article belongs to the Special Issue Non-small Cell Lung Cancer--Tumor Biology)

Abstract

:
Despite often leading to platinum resistance, platinum-based chemotherapy continues to be the standard treatment for many epithelial tumors. In this study we analyzed and validated the cytogenetic alterations that arise after treatment in four lung and ovarian paired cisplatin-sensitive/resistant cell lines by 1-million microarray-based comparative genomic hybridization (array-CGH) and qRT-PCR methodologies. RNA-sequencing, functional transfection assays, and gene-pathway activity analysis were used to identify genes with a potential role in the development of this malignancy. The results were further explored in 55 lung and ovarian primary tumors and control samples, and in two extensive in silico databases. Long-term cell exposure to platinum induces the frequent deletion of ITF2 gene. Its expression re-sensitized tumor cells to platinum and recovered the levels of Wnt/β-catenin transcriptional activity. ITF2 expression was also frequently downregulated in epithelial tumors, predicting a worse overall survival. We also identified an inverse correlation between ITF2 and HOXD9 expression, revealing that Non-small cell lung cancer (NSCLC) patients with lower expression of HOXD9 had a better overall survival rate. We defined the implication of ITF2 as a molecular mechanism behind the development of cisplatin resistance probably through the activation of the Wnt-signaling pathway. This data highlights the possible role of ITF2 and HOXD9 as novel therapeutic targets for platinum resistant tumors.

1. Introduction

Although platinum-based chemotherapy still plays an important role in the treatment of many solid tumors, the disease progresses to a platinum-resistant state in a high percentage of the diagnosed cases of non-small cell lung cancer (NSCLC) and ovarian cancer [1,2] which are two of the most deadly cancers plaguing our society, the former accounting for more than 80% of primary lung cancer cases and the latter boasting the highest mortality of the gynecological malignancies worldwide [3]. Cisplatin (CDDP) is a platinum compound widely used in the treatment of solid tumors. It induces apoptosis in cancer cells by binding to the guanine base of DNA, at the number 7 nitrogen (N7) atom of the purine ring and crosslinking DNA [4,5]. However, CDDP also leads to cytogenetic alterations, such as deletions or amplifications of genes involved in tumor progression, metastasis, and drug response [6], which contribute to the development of CDDP-resistance [7,8,9].
In this study, we performed a high-resolution million feature array-comparative genomic hybridization (aCGH) with four NSCLC and ovarian cancer sensitive/resistant paired cell lines, previously reported by our group [10], to explore the chromosomic deletions that differ in the resistant subtypes. We found a common deletion that includes transcription factor 4, TCF4 (hereafter called ITF2). ITF2 is a downstream target gene of the Wnt/β-catenin pathway that negatively regulates its activity [11,12]. Wnt signaling has been identified as one of the key signaling pathways in cancer, and more recently, also to be involved in drug resistance of primary tumors such as colon or ovarian cancer [13,14]. However, its role driving platinum resistance in NSCLC has not been defined yet, and very little is known about how ITF2 is involved in tumorigenesis. Therefore, further studying the role of ITF2 in tumor response to chemotherapy may provide new ways to fight the resistance to this popular treatment.
Here we report the frequent downregulation of ITF2 in NSCLC patients and cisplatin-resistant cancer cells. Furthermore, we present potential molecular mechanisms, including the Wnt-signaling pathway behind the development of resistance through the action of ITF2 and affecting the expression of specific genes that might also be used as potential therapeutic targets.

2. Results

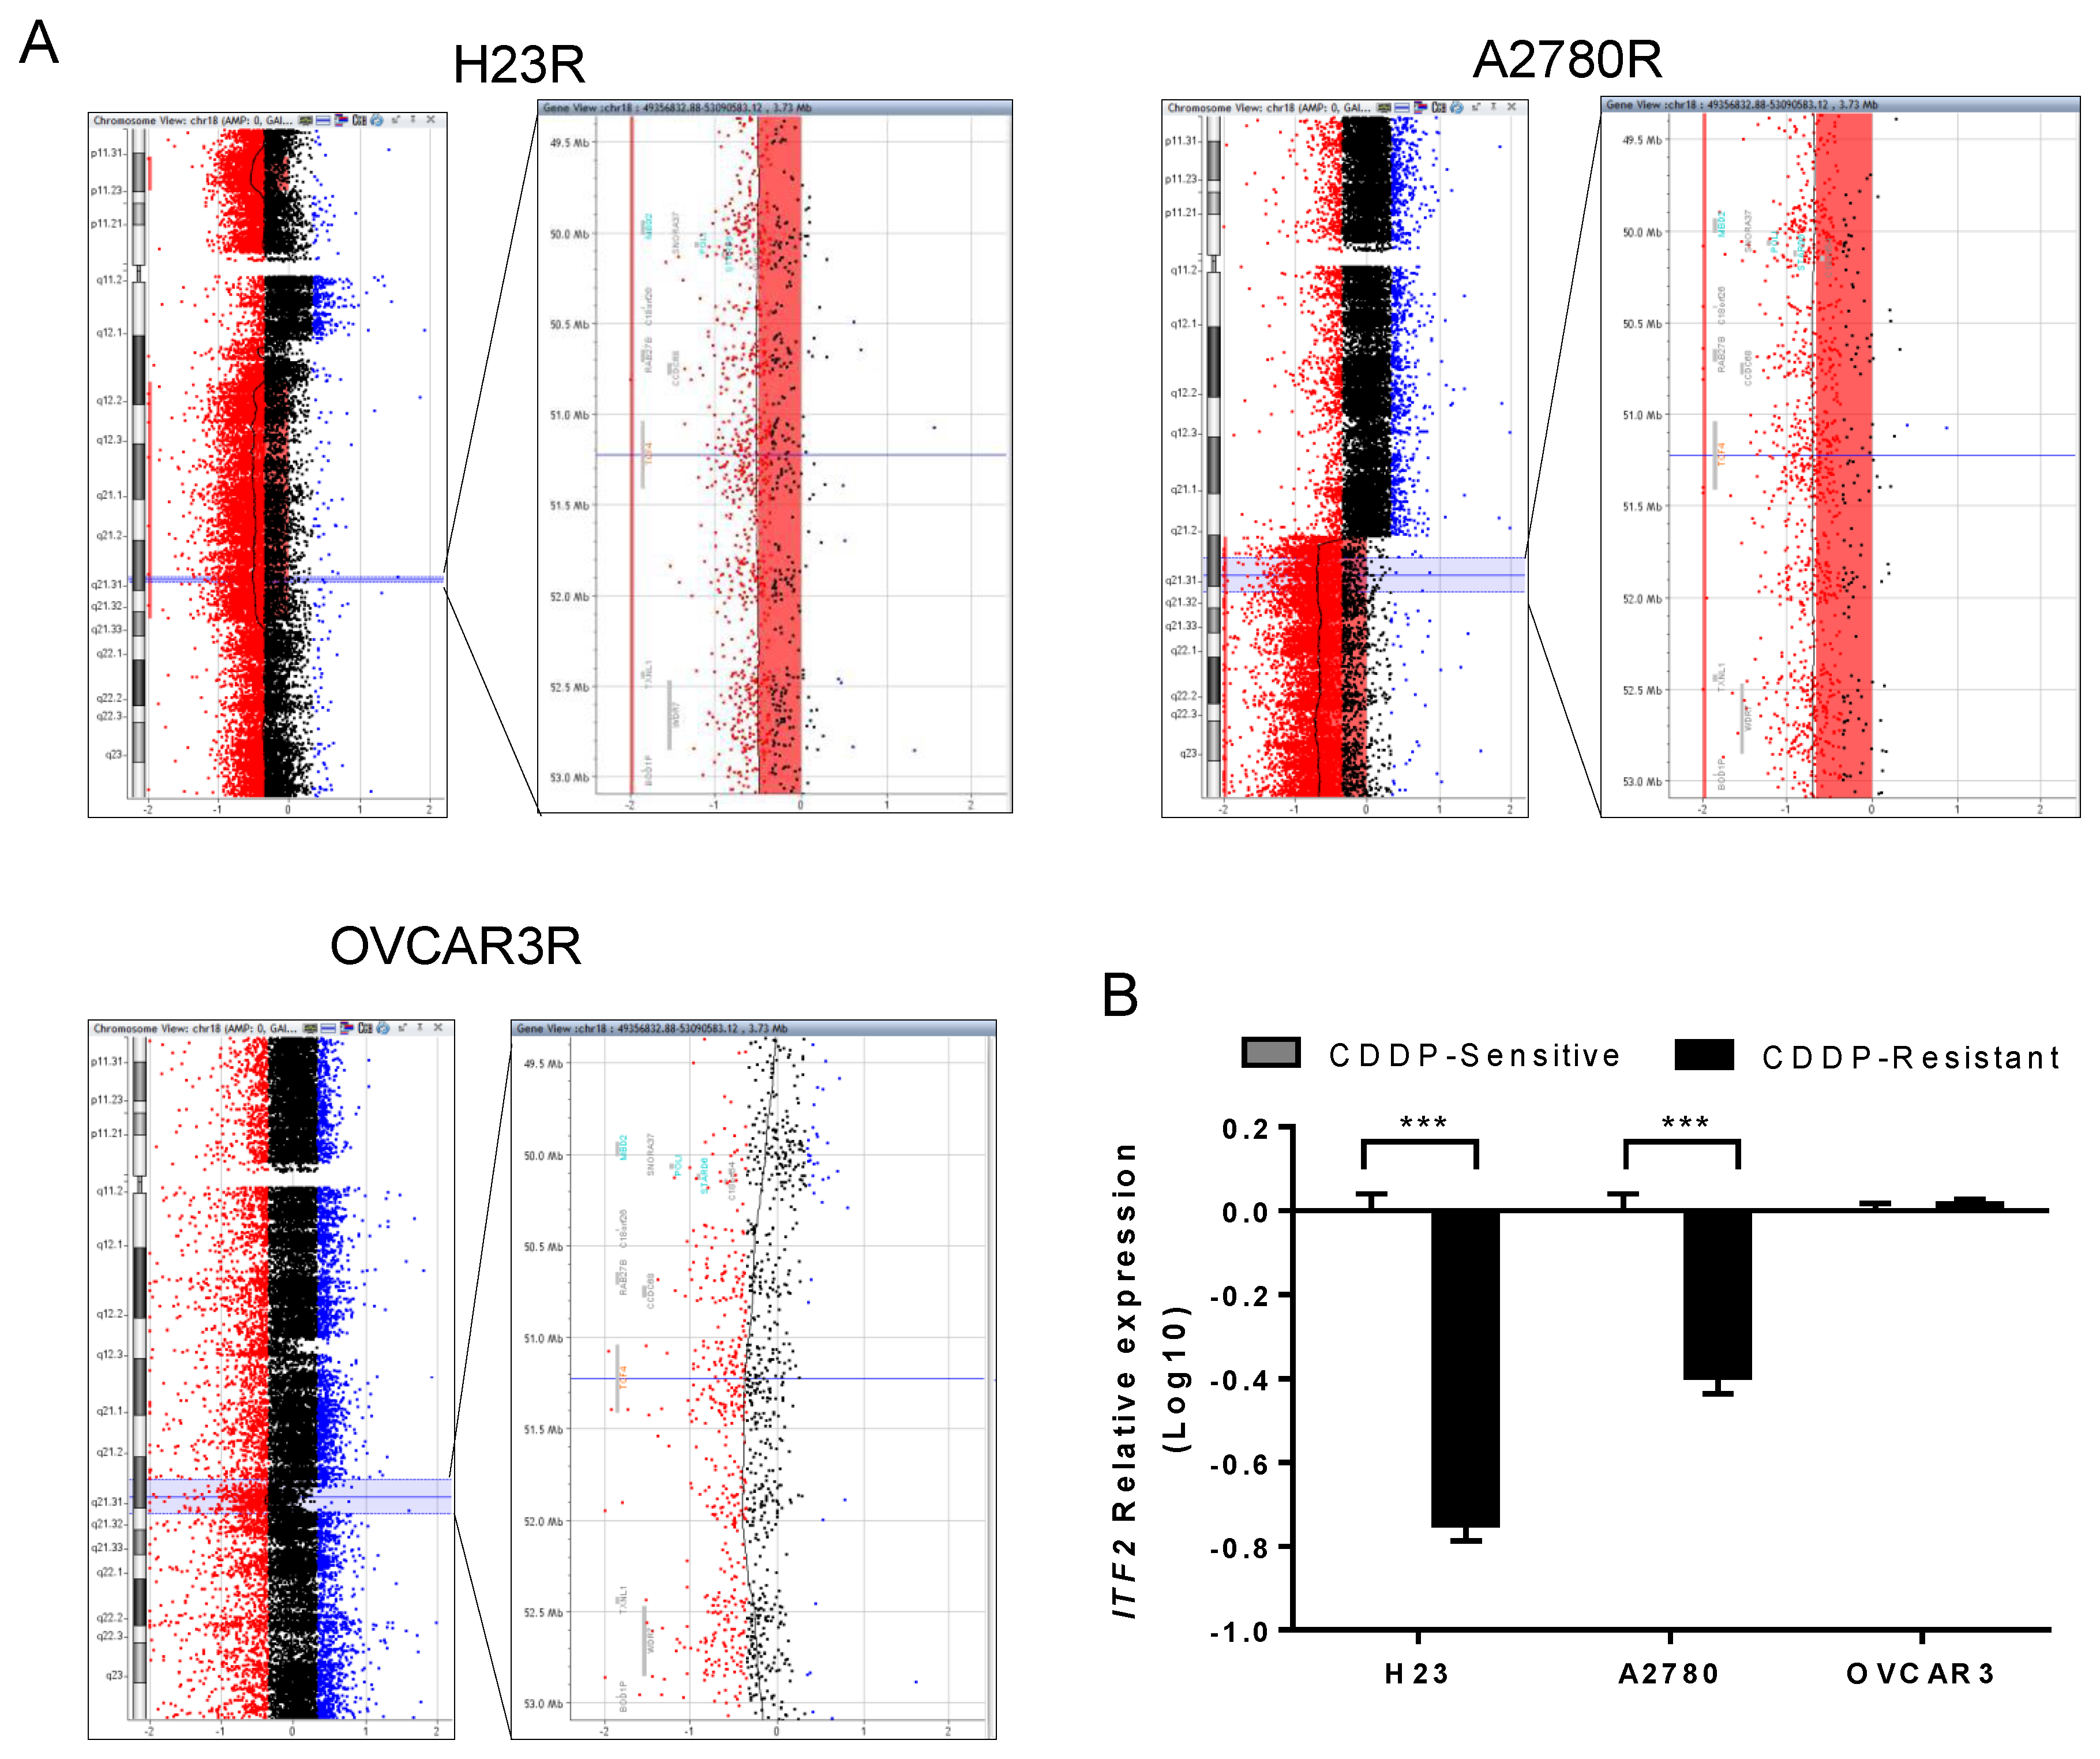
2.1. ITF2 is Frequently Downregulated by Chromosomal Deletion after CDDP Cell Exposure

We used CDDP sensitive and resistant clones from NSCLC (H23 and H460) and ovarian cancer (A2780 and OVCAR3) cell lines, previously generated by our group, to perform CGH arrays and uncover deletions or amplifications that could explain the Cisplatin-resistant phenotype. Our cytogenetic study showed different genomic alterations in the CDDP resistant subtypes, using the sensitive parental cell lines as a reference genome. We found two deleted regions shared by both tumor types in three out of the four cell lines H23R, A2780R, and OVCAR3R, but not in H460 cells, located on 18q21.2–18q21.31 and 18q21.32, affecting the genes RAB27B, CCDC68, TCF4, TXNL1, WDR7, and BOD1P; and genes ZNF532, SEC11C, GRP, respectively (Figure 1 and Figure S1A). We also observed a common deleted region on 2q22.1 that included the gene LRP1B in the NSCLC cell lines and an additional common region only shared by the ovarian cancer cell lines on 9q22.33 that included part of the gene TMOD (Table S1).
We selected LRP1B and TCF4 (ITF2) genes that were completely deleted in the same tumor type or at least three of the four cell lines, respectively (Figure 1A and Figure S1A,B). The deletion of ITF2 in H23R and A2780R cell lines resulted in a significant loss of ITF2 expression compared to the sensitive subtypes, validating the results obtained in the arrays CGH (Figure 1B). No changes were observed in OVCAR3 cells for ITF2 expression or in H23 and H460 cells for LRPB1 (Figure 1B and Figure S1C).

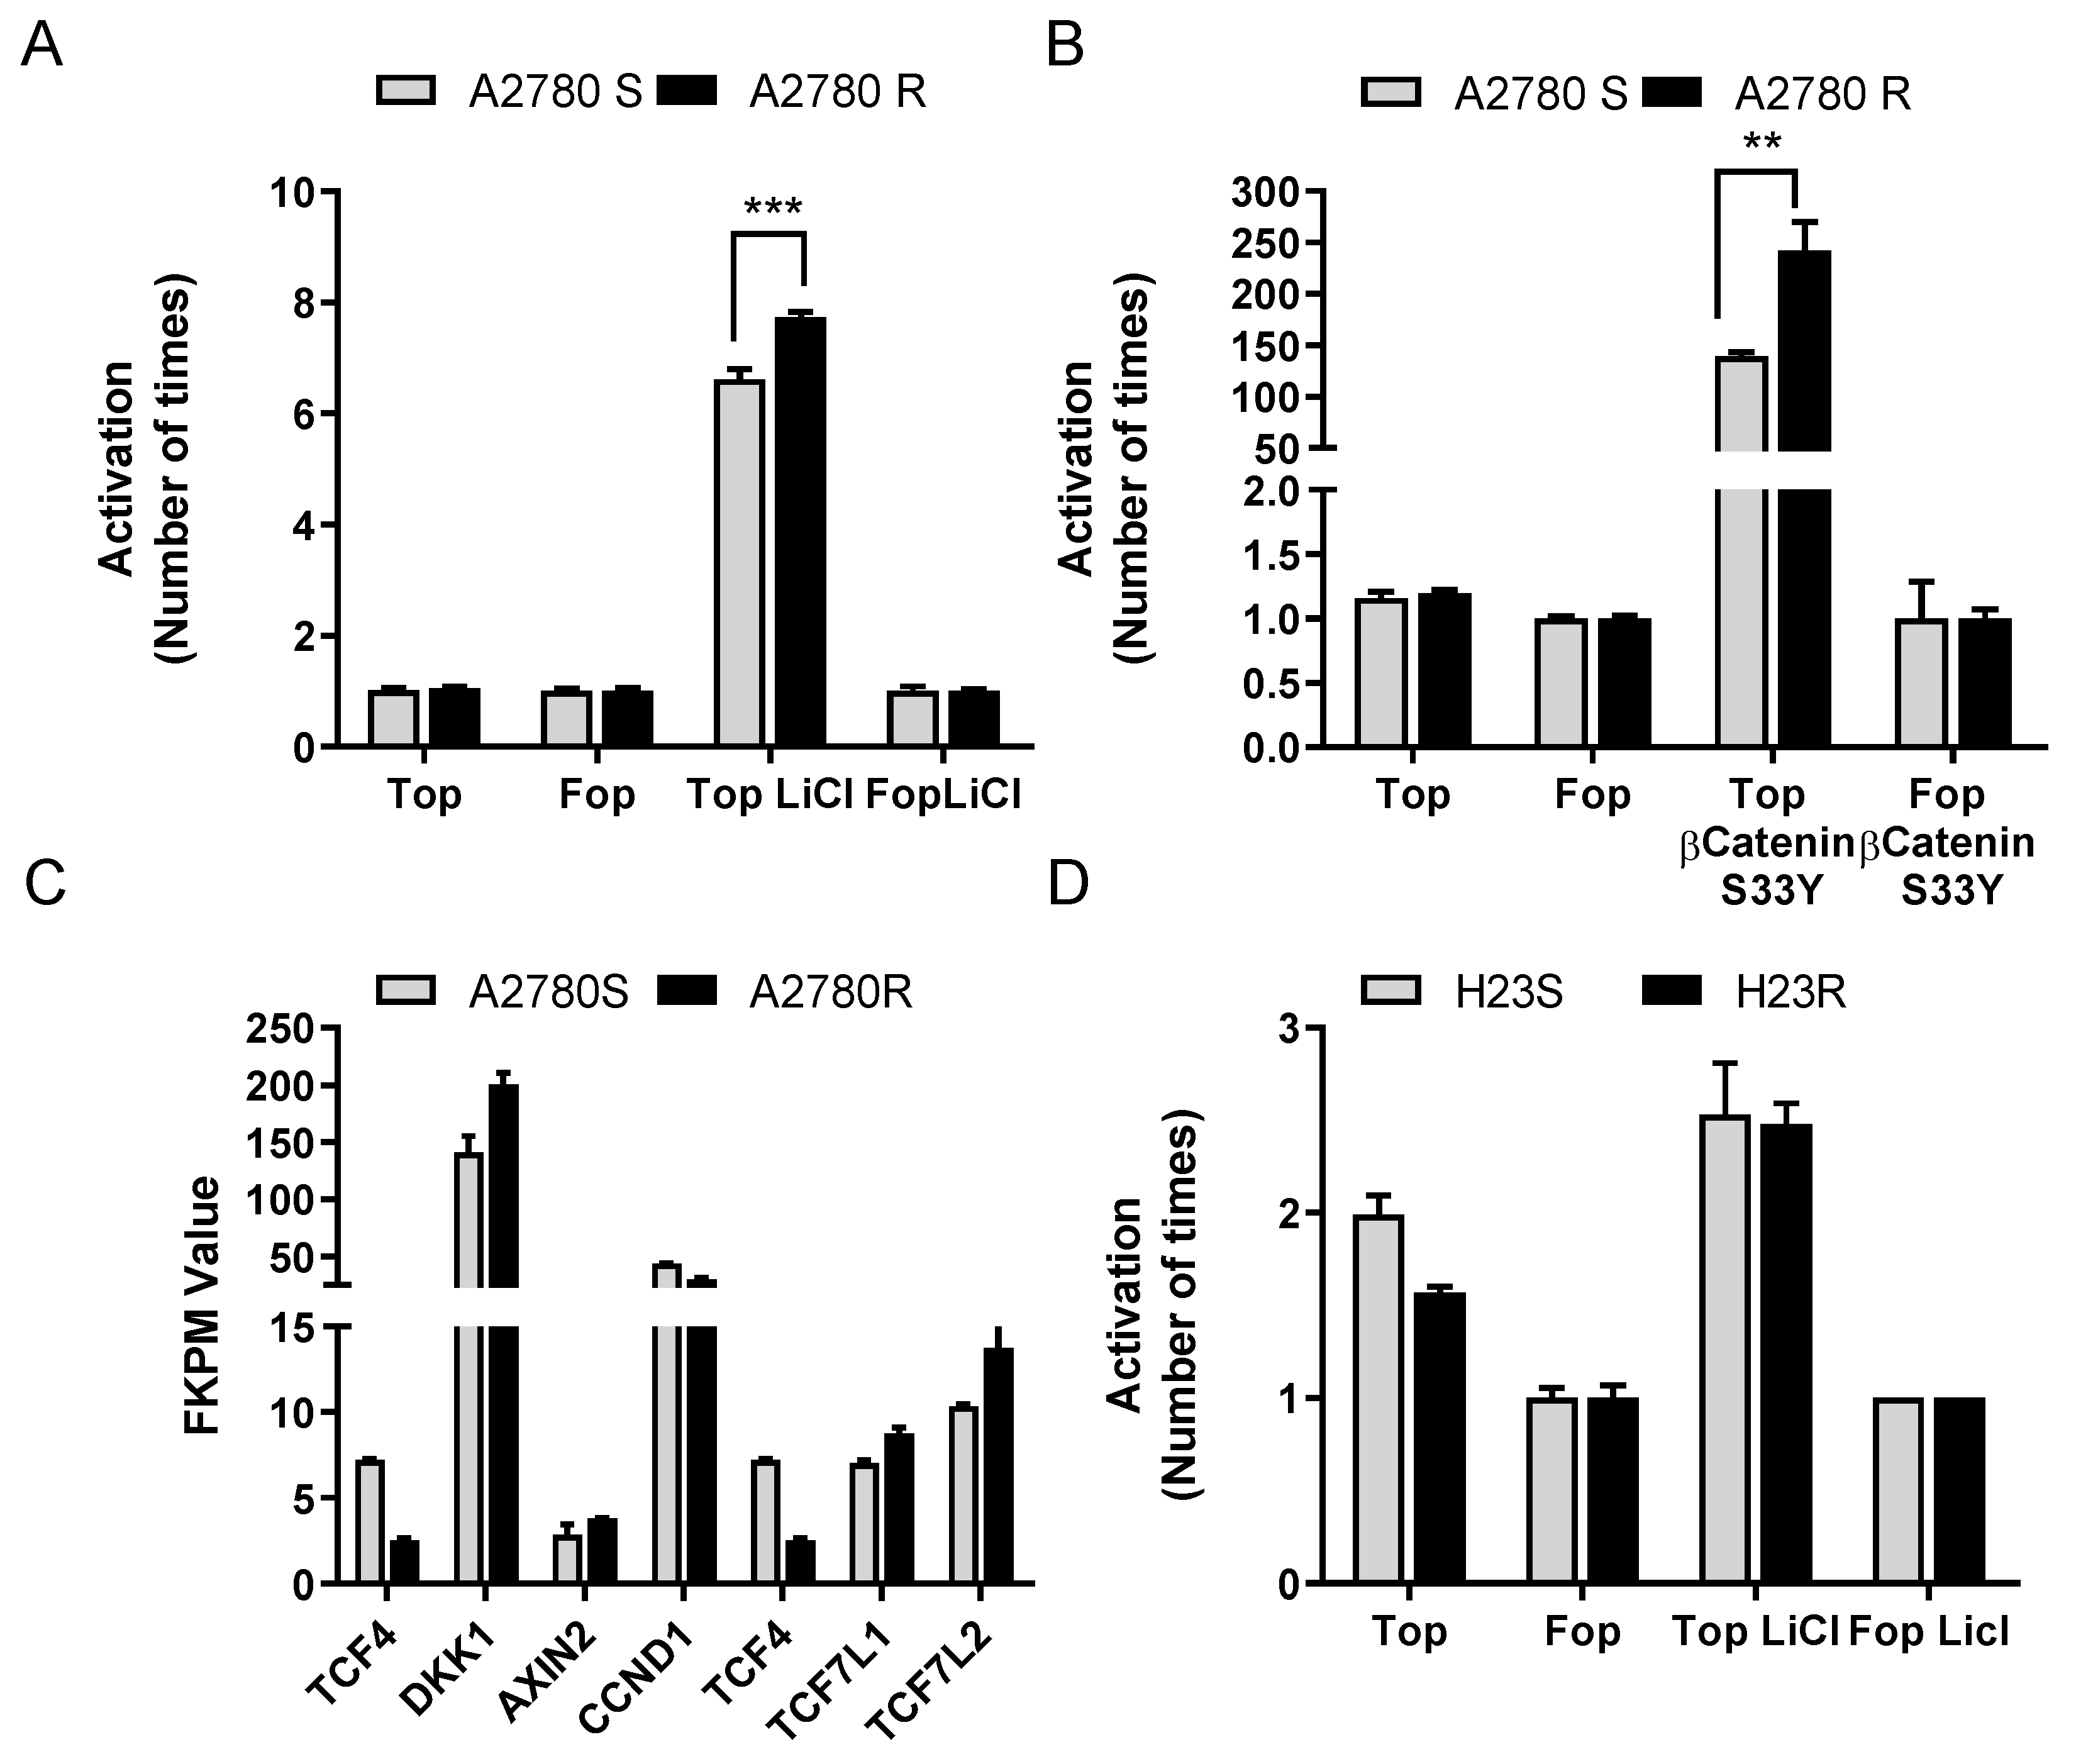
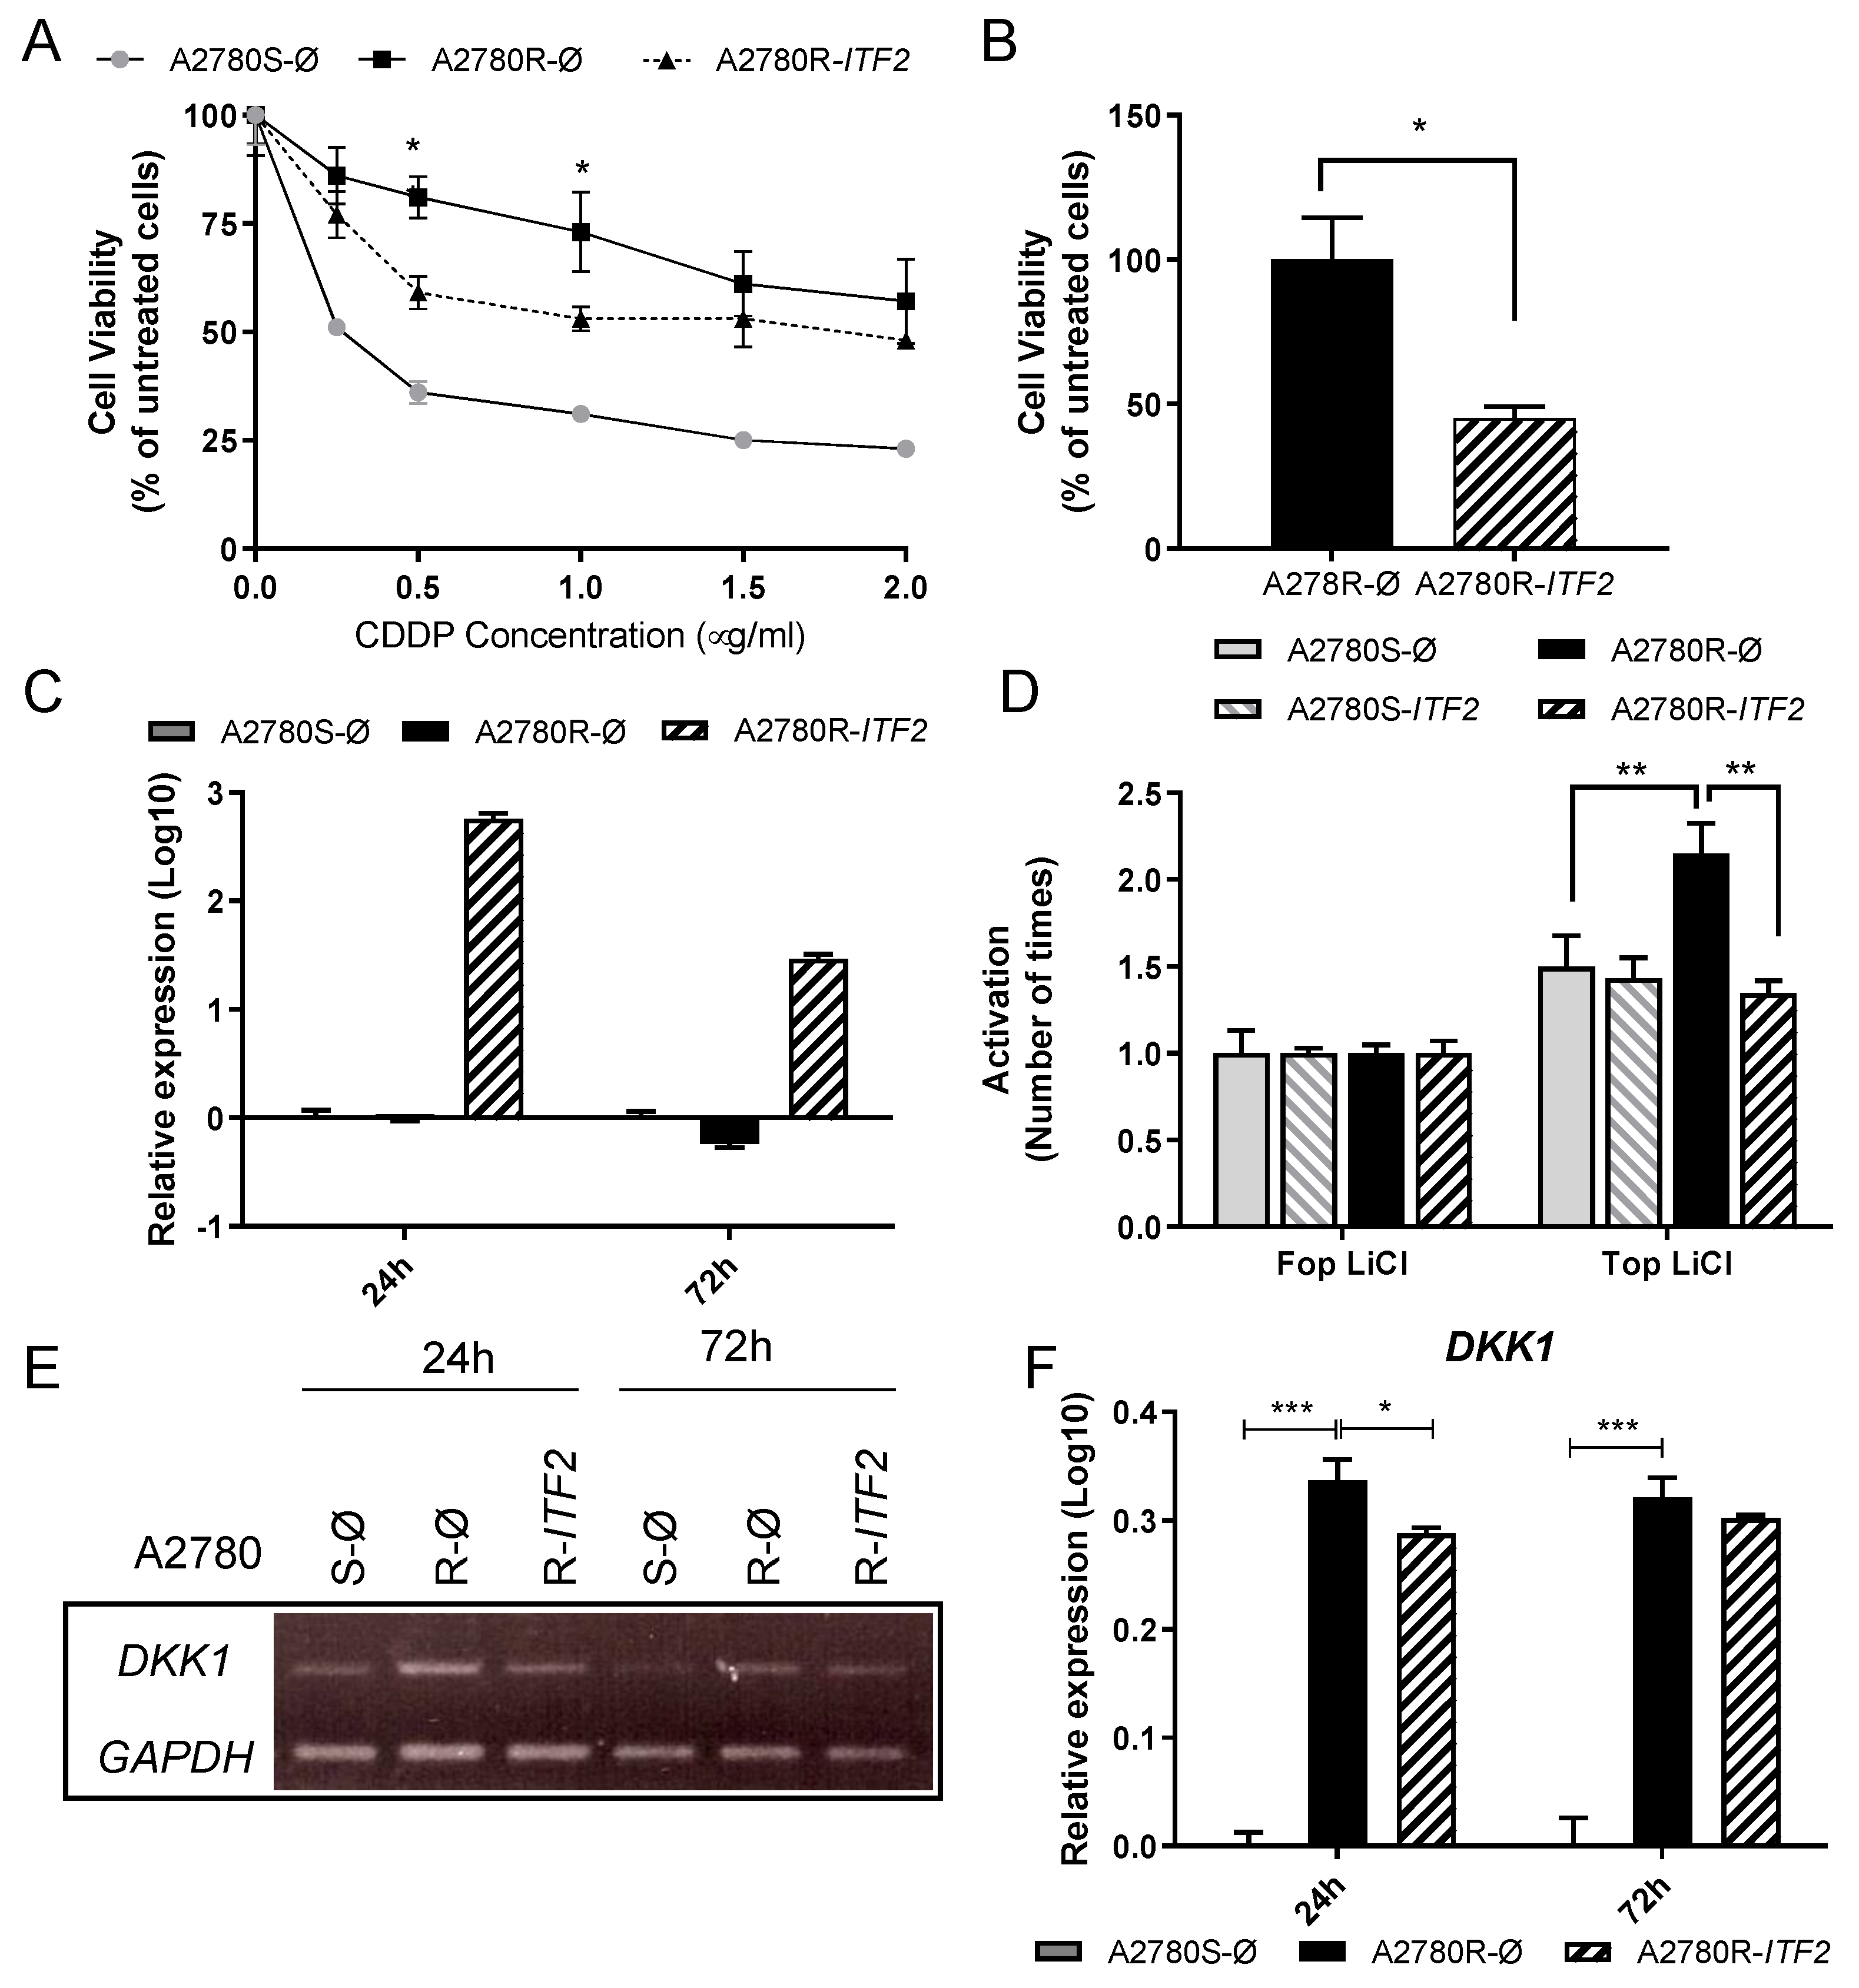
2.2. Restoration of ITF2 Increases the Sensitivity to CDDP and Decreases β-catenin/TCF Transcriptional Activity

Due to the association of ITF2 with the Wnt/ß-catenin/TCF pathway, we studied the transcriptional activity of the Wnt pathway in H23S/R and A2780S/R cells, in which the cisplatin-resistant phenotypes harbor the ITF2 deletion. We transfected cells with the Wnt reporters (Super8xTop-Fop vectors) and induced the ß-catenin/TCF4 activity either by LiCl treatment, which inhibits GSK3-ß or by cotransfection with the constitutively stable ß-catenin-S33Y mutant. We observed higher luciferase activity in A2780R cells compared with the parental sensitive ones, indicating increased transcriptional activity of ß-catenin/TCF in response to both pharmacological (Figure 2A) and functional activation of the pathway (Figure 2B). We also analyzed the RNA-seq normalized FPKM values in paired cell lines, confirming the significant decrease of ITF2 expression in the resistant phenotype and observing an increase in the expression levels of several downstream effectors genes of this pathway such as DKK1 (p = 0.041), TCF7L1 (p = 0.027), and TCF7L2 (ns) (Figure 2C), being DKK1 the most evident in terms of FKPM values. These effects were not observed in H23S/R paired cell lines (Figure 2D).
In order to test the role of ITF2 in cisplatin resistance through the Wnt pathway, we transiently overexpressed ITF2 cDNA in A2780 and H23 cells. Cell sensitivity to cisplatin was unmodified after ITF2 overexpression in H23 cells as expected, probably due to the constitutive activity of the Wnt pathway already described in this cell line (Figure S2). However, our previous results indicated that A2780 cells seemed to be a reliable cellular model to evaluate changes in the transcriptional activity of the Wnt pathway. In fact, we observed that the overexpression of ITF2 in A2780R resulted in a significant increase in sensitivity to cisplatin from the dose of 0.5 ug/mL (p < 0.01), showing an intermediate phenotype between the resistant and sensitive subtypes (Figure 3A). In addition, ITF2 restoration induced a dramatic decrease in cell viability (p < 0.05) 24 h after transfection compared with the parental resistant cells transfected with the empty vector (Figure 3B). ITF2 overexpression at 24 and 72 h after transfection was confirmed by qRT-PCR (Figure 3C). Moreover, ITF2 overexpression recovered the levels of ß-catenin/TCF transcriptional activity observed in sensitive cells (Figure 3D). We also determined DKK1 expression levels after ITF2 overexpression as it was the downstream effector gene showing the highest increased expression in the resistant A2780R cells. In fact, its expression was restored in part at 24 h (p < 0.05) after ITF2 overexpression (R-ITF2). Decreased levels of DKK1 were also observed at 72 h in both, semi-quantitative and quantitative assays, without associated significance, probably due to the transient transfection (Figure 3E,F).

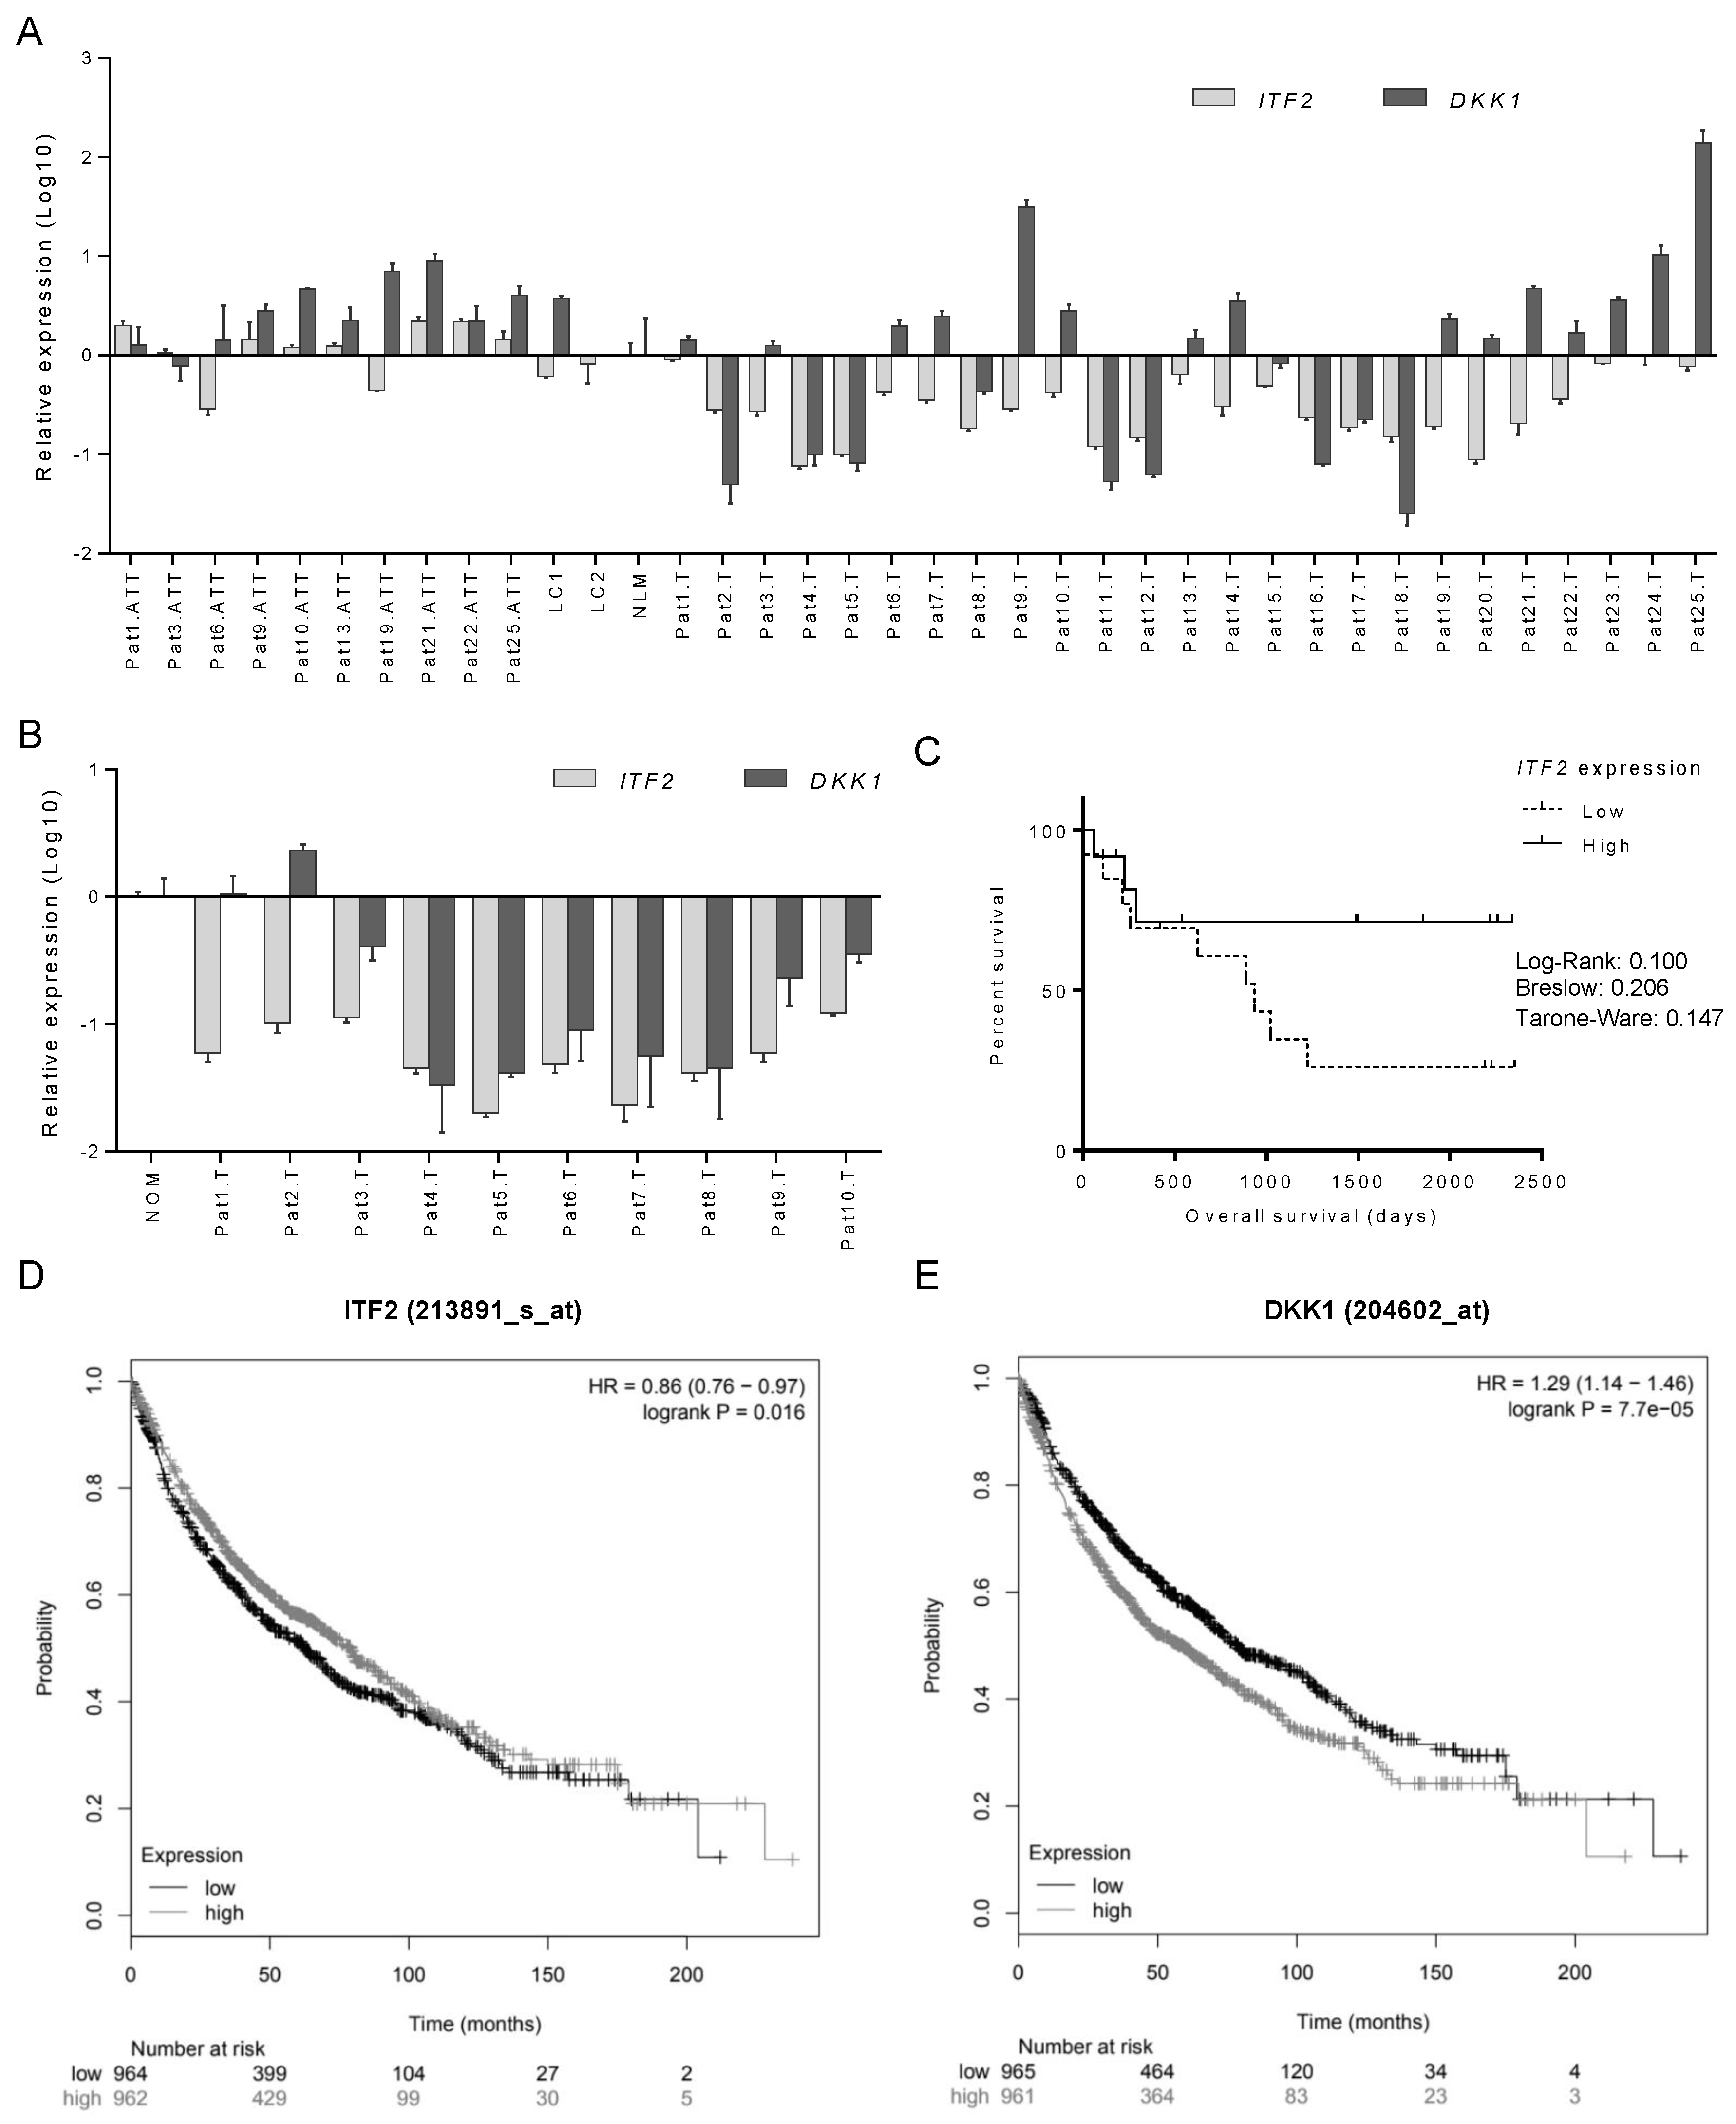
2.3. The Expression of ITF2 is Frequently Downregulated in NSCLC, Ovarian and Other Epithelial Tumors

To validate our in vitro results, we determined the clinical implication of ITF2 and DKK1 expression in NSCLC and ovarian cancer patients. The relative expression of both genes was measured in two cohorts of fresh frozen tumor samples (T), adjacent tissue (ATT) from NSCLC (Table 1), and ovarian cancer patients (Table S2).
We observed that ITF2 expression was frequently downregulated in NSCLC and ovarian tumor samples (Figure 4), validating our in vitro data. Fifteen out of 25 tumor samples of NSCLC patients had lower expression of ITF2 compared to the normal lungs mean (NLM) (Figure 4A). Furthermore, as reported in our experimental data, we observed the opposite expression profile between ITF2 and DKK1 in 60% of NSCLC samples. However, this situation was found only in approximately 10% (1 out of 9) of the ovarian cancer samples (Figure 4B). We did not observe differences between ATT and normal lung samples (LC) for ITF2 (p = 0.177) and DKK1 (p = 0.693) in the NSCLC cohort (Figure 4A).
The Kaplan–Meier curves, analyzing the overall survival (OS) according to the median of ITF2 and DKK1 expressions, showed that only ITF2 high expression levels had a trend towards better overall survival in NSCLC patients with high ITF2 expression levels after 250 days of following up (p = 0.1) (Figure 4C and Figure S3A). However, the statistical significance of both genes in predicting overall survival was confirmed by analyzing an extended cohort of 1926 lung cancer patients using the Kaplan–Meier plotter online tool, revealing that those patients with high expression of ITF2 (Figure 4D) and low expression of DKK1 (Figure 4E) had a significantly better overall survival rate (p = 0.016 and p < 0.001, respectively). This was validated using the TCGA data set of 487 lung carcinoma (Figure S3B). In addition, ITF2 was found deleted or downregulated in other epithelial tumors, such as esophageal adenocarcinoma (186 patients) or head and neck Squamous cell carcinoma SCC (522 patients), where ITF2 loss also predicted a worse overall survival (Figure S3C,D).

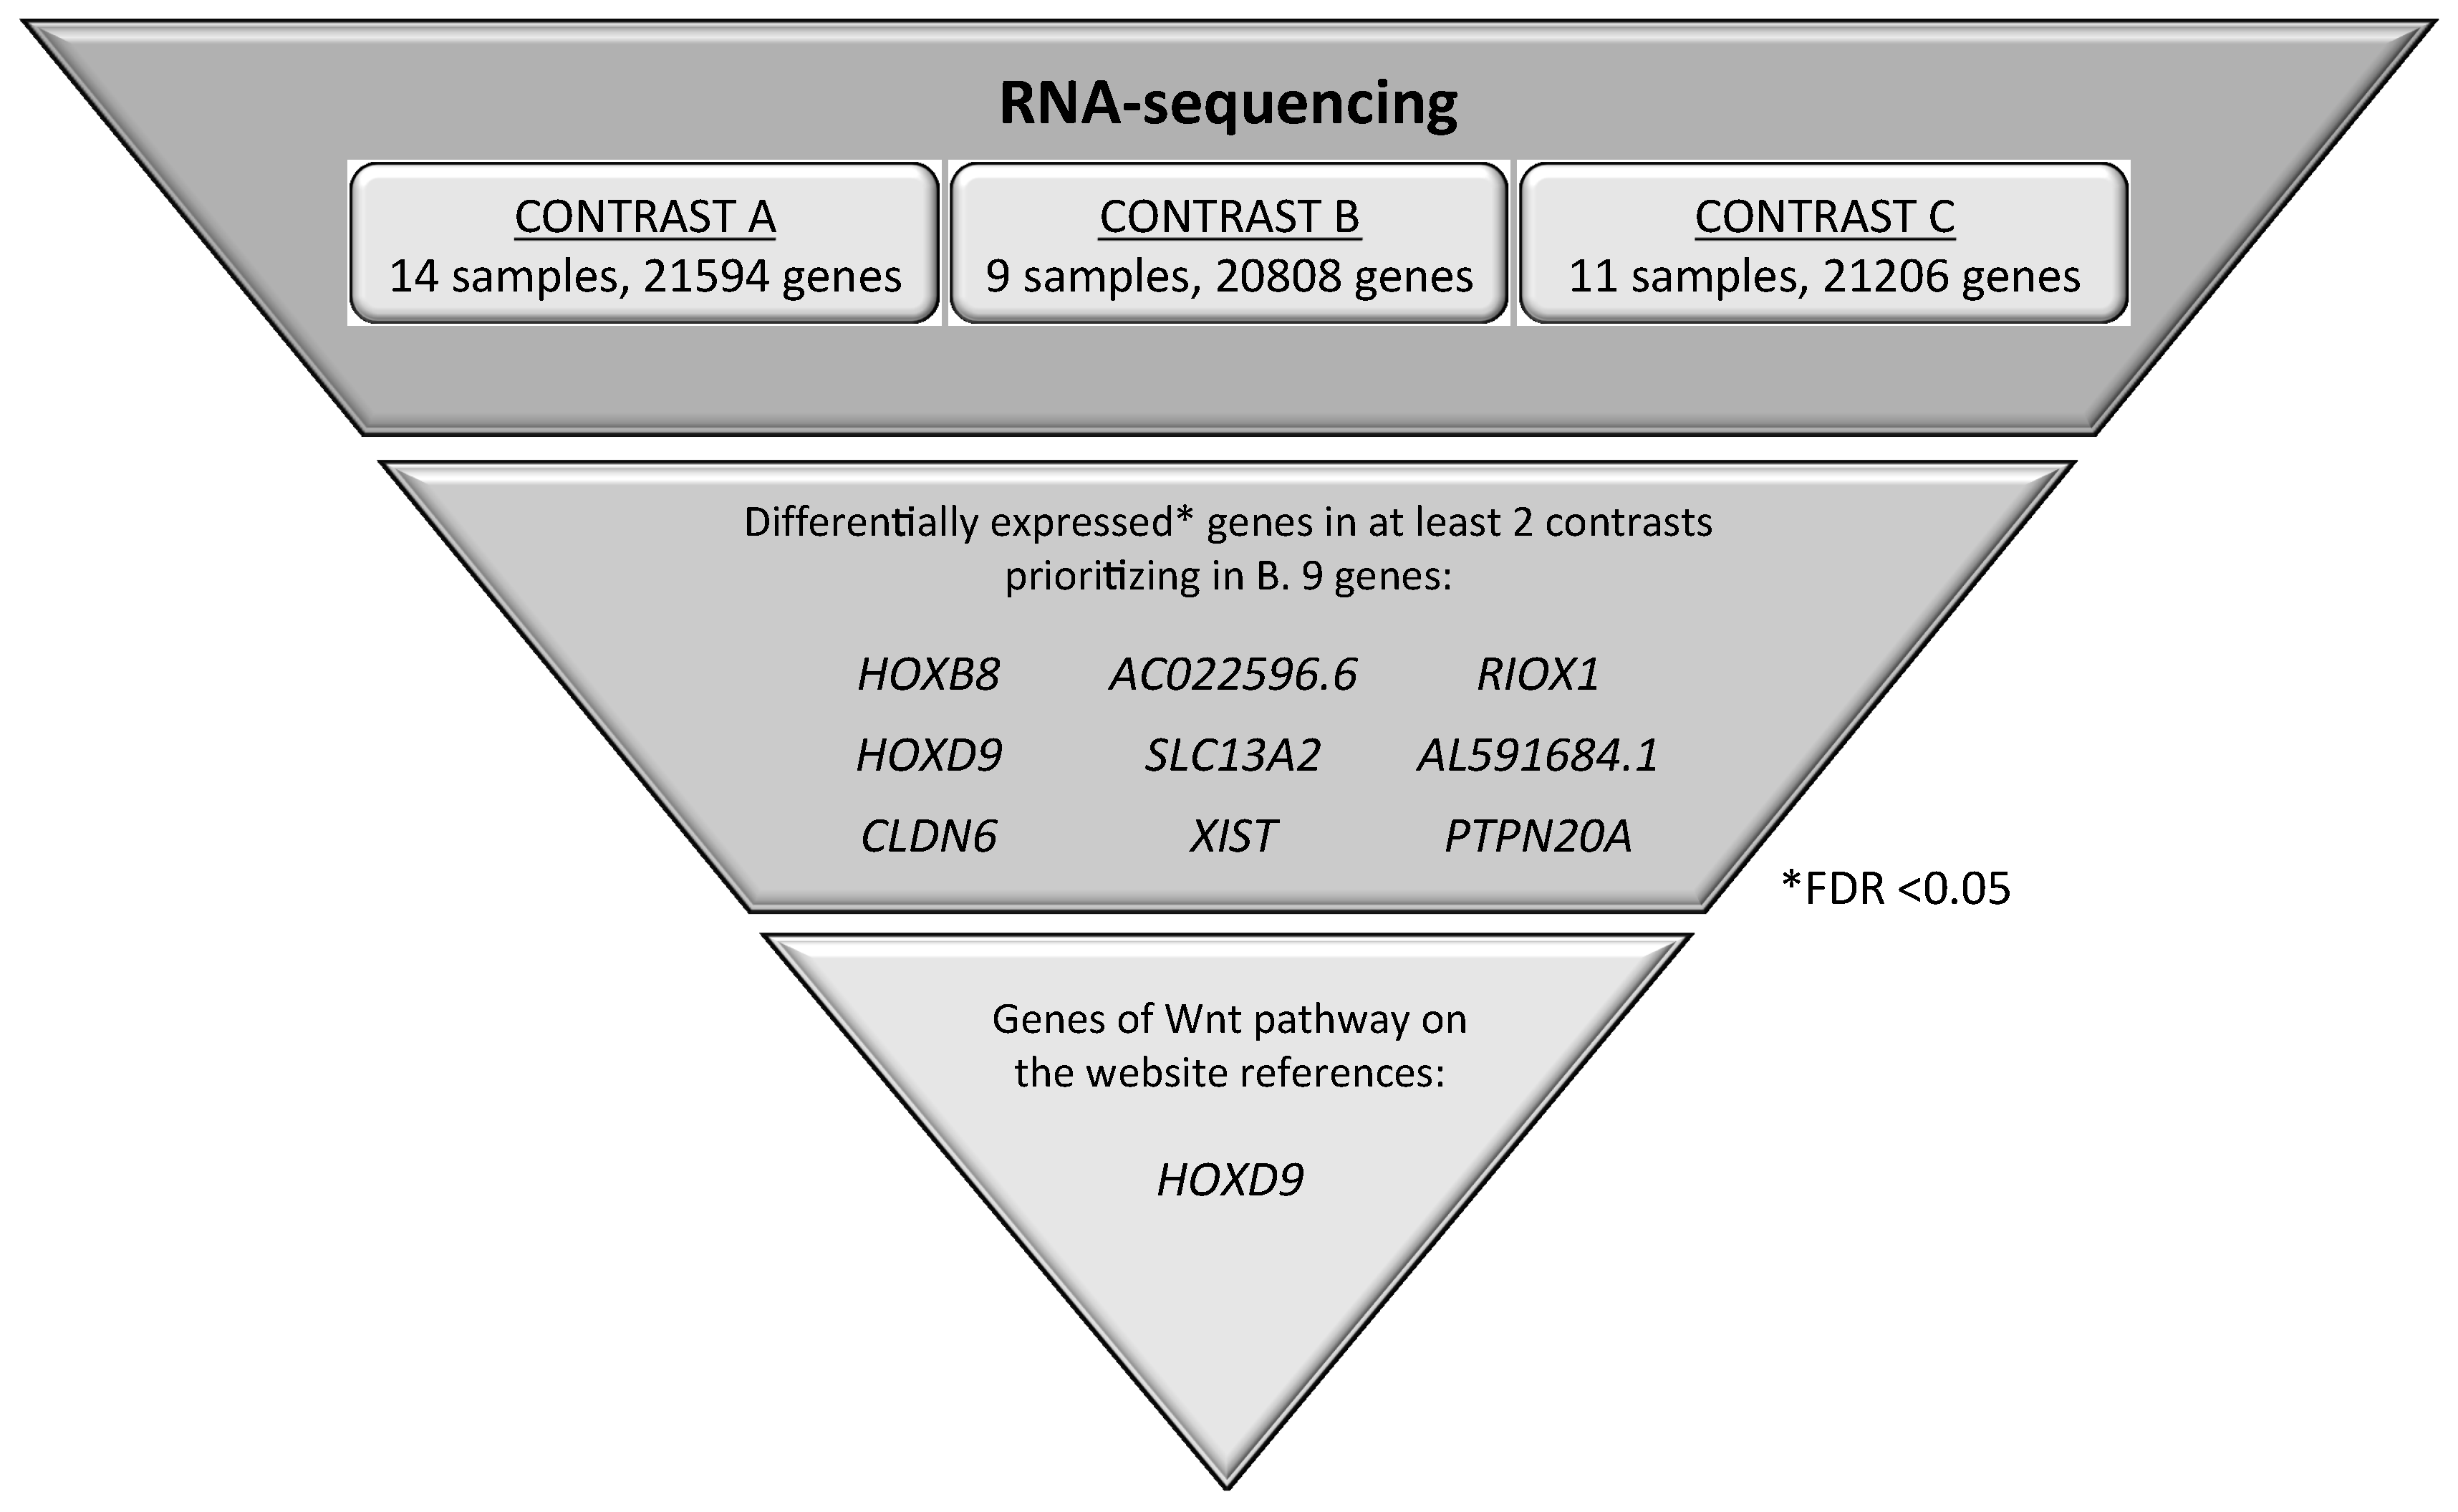
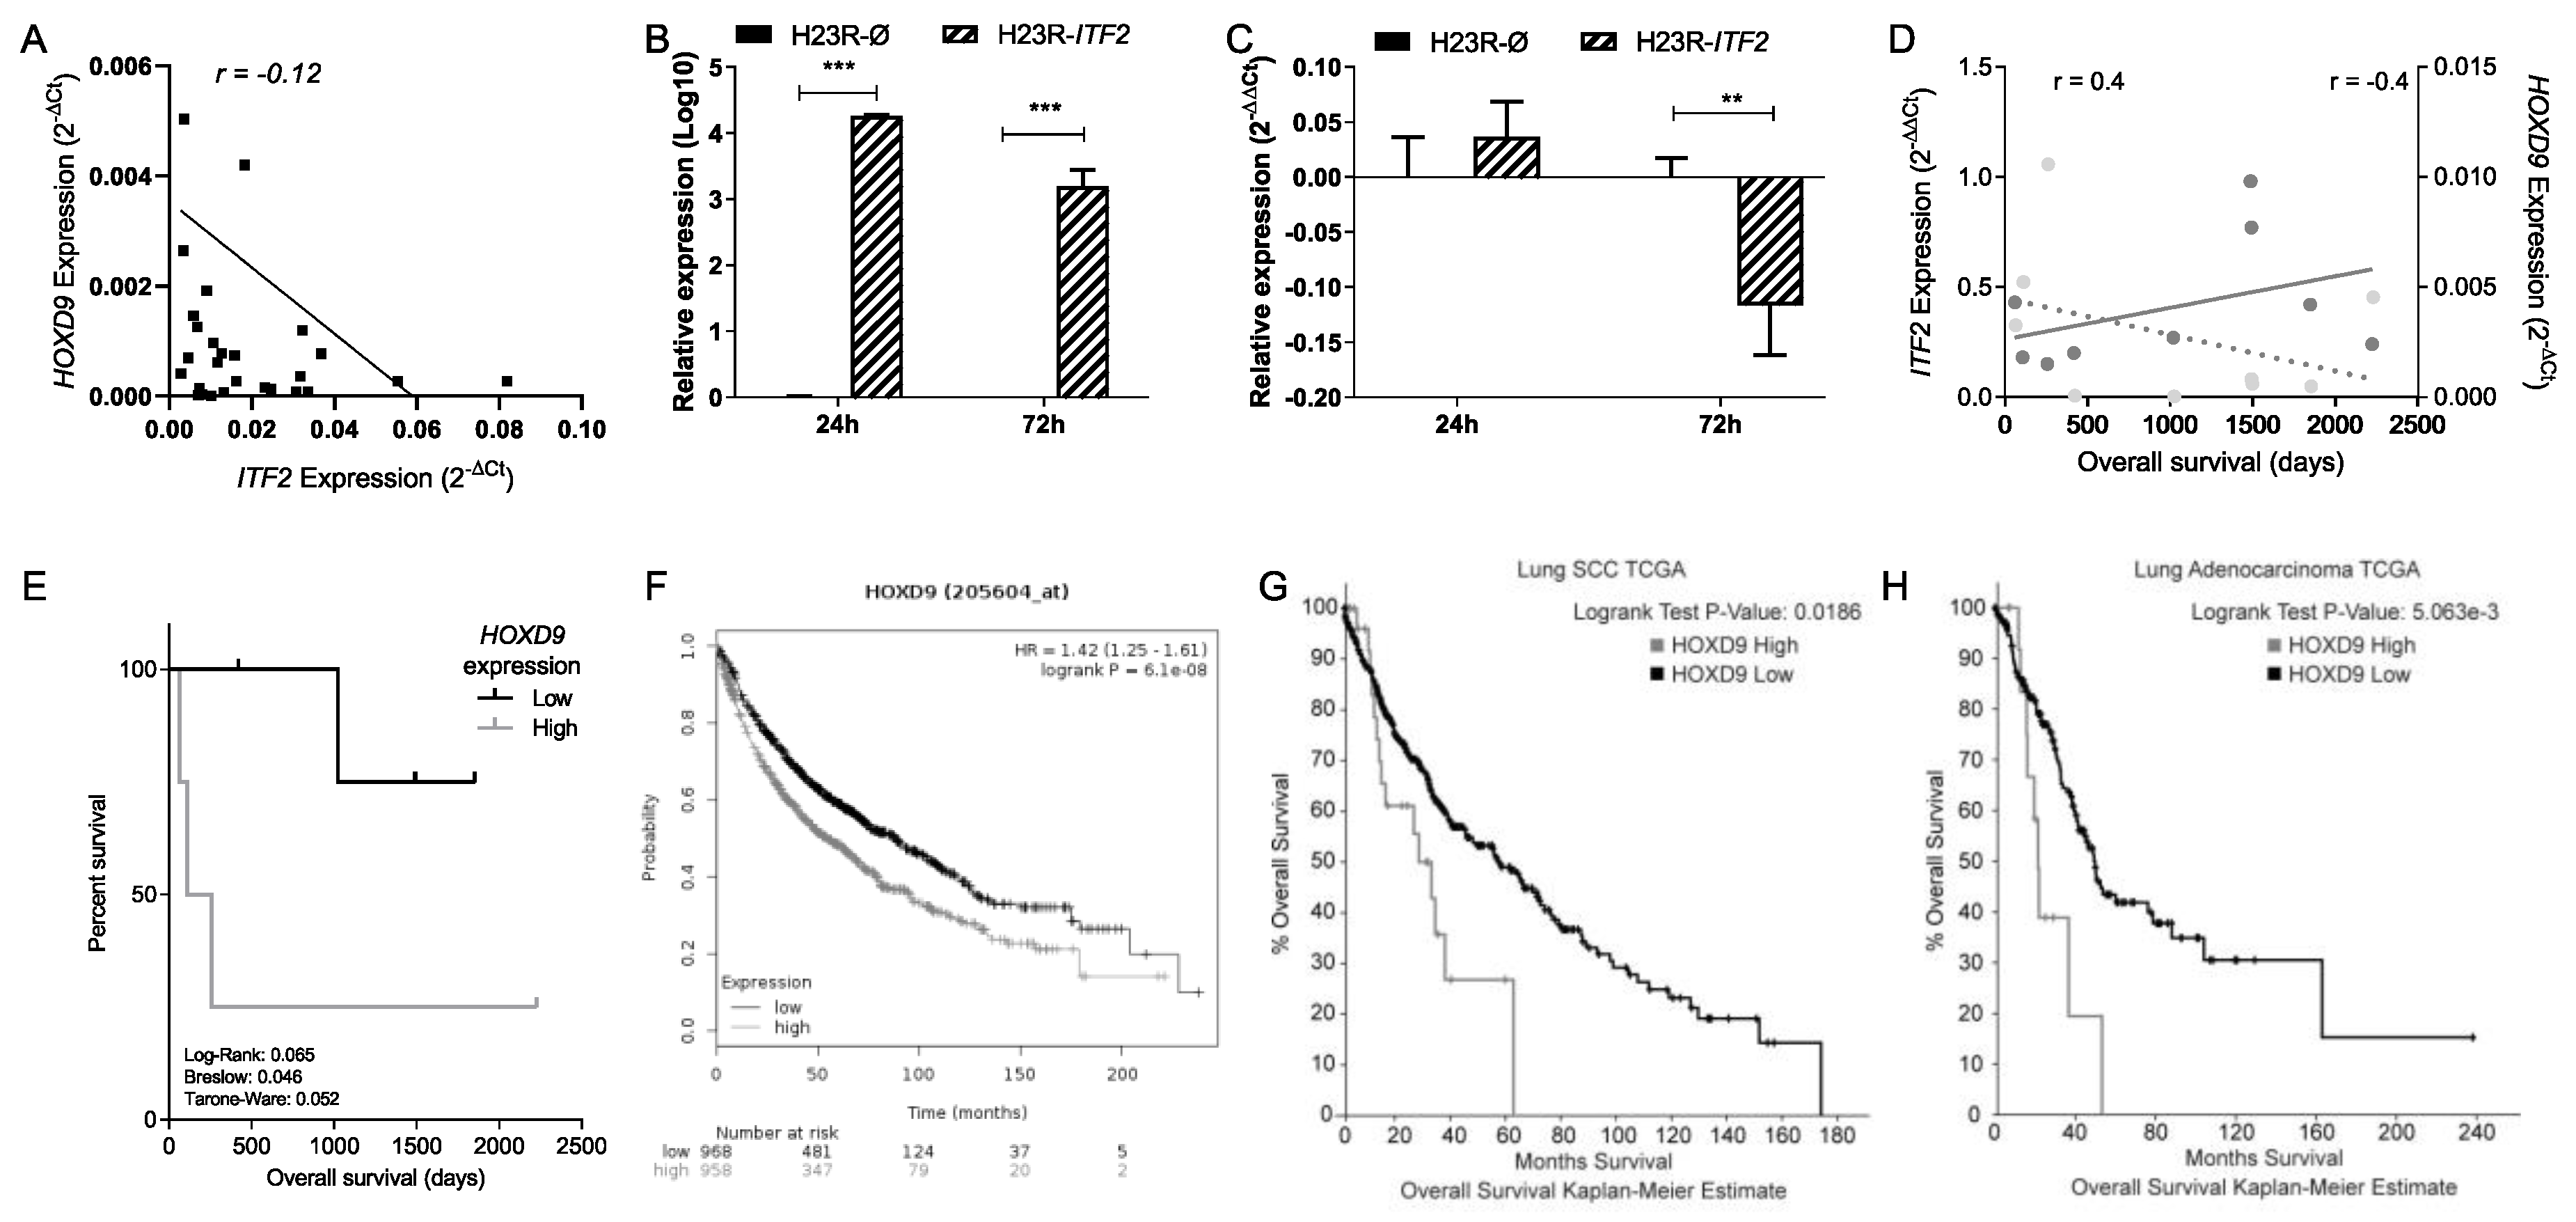
2.4. Identification of Candidate Genes Involved in the Wnt Signaling Pathway through the Analysis of RNA-seq in NSCLC Patients

To further explore the role of the Wnt-signaling pathway in lung cancer tumorigenesis, we performed a whole transcriptome analysis performing RNA-seq on 14 samples, including nine NSCLC samples, six of them with an inverse expression profile between ITF2 and DKK1, Patient 3 (Pat3), Patient 6 (Pat6), Patient 10 (Pat10), Patient 22 (Pat22), Patient 25 (Pat25), and Patient 26 (Pat26); and three with the same expression profile, Patient 8 (Pat8), Patient 16 (Pat16), and Patient 18 (Pat18) (Table S3). Three ATT (Pat9, Pat21, and Pat25) and two lung control (LC) samples (LC1 and LC2) were used as controls for comparisons (Figure S4). Because ITF2 was mainly downregulated in NSCLC patients, while DKK1 showed a more heterogeneous expression pattern, we considered DKK1 as the best parameter to decide the bioinformatics analysis of the RNA-seq. The bioinformatic contrasts focused on three differential gene expression analyses: contrast A, tumor versus control; contrast B, comparison between tumors with high and low expression of DKK1; and contrast C, comparison between tumor samples with high expression of DKK1 and controls (Figure 5). We selected the genes that showed significant expression differences (FDR < 0.05) in at least two of the three contrasts, prioritizing contrast B (Table S4). The bioinformatics analysis also focused on all annotated genes related to the Wnt-pathway.
We analyzed the expression of nine candidates, but only four of them were confirmed by qPCR-PCR, three coding genes, HOXD9, RIOX1, and CLDN6 and one long noncoding RNA, XIST. An accurate correlation with the RNA-sequencing data was found for HOXD9, CLDN6, and XIST genes (r = 0.83, r = 0.97 and r = 0.97, respectively) (Figure S5), while for RIOX1 the correlation coefficient was less marked, probably because of the sample size (r = 0.58) (Figure S5). From all four candidate genes, only HOXD9 expression showed a correlation with ITF2 expression (Pearson = −0.24) (Figure 6A). In order to gain insight into the role of ITF2 regulating the expression of HOXD9 in NSCLC, we overexpressed ITF2 in H23 resistant lung cancer cells. Transfection efficiency was confirmed by qRT-PCR at 24 and 72 h after transfection (Figure 6B). As expected from the primary tumors results, the overexpression of ITF2 induced a significant decrease of HOXD9 (p = 0.017) (Figure 6C). Having identified HOXD9 as potential Wnt pathway candidate genes regulated by ITF2, we studied its clinical translational application in the cohort of NSCLC patients used for the RNA-seq analysis and in the public databases TCGA and KMplotter.
A negative correlation for HOXD9 was found in terms of patients’ overall survival (Figure 6D). In addition, the survival analysis performed after stratifying patients according to the median of HOXD9 gene expression showed that patients with lower expression of HOXD9 presented a significantly better overall survival rate (p = 0.046) (Figure 6E). These results were confirmed when analyzing the expression levels of 1,926 lung cancer patients by using the Kaplan–Meier plotter online tool and the TCGA data sets, revealing that those patients with lower expression of HOXD9 had a significantly better overall survival rate that was independently associated with the tumor histology (p < 0.001) (Figure 6F–H).

3. Discussion

Wnt signaling has recently been reported to be involved in driving platinum resistance of several tumor types [13,15]. However, the molecular mechanisms implicated are not clear, especially in NSCLC. In the present work, we have studied the involvement of the Wnt signaling pathway in tumorigenesis through a combined experimental approach by using both CGH arrays and RNA-sequencing. We have found that long term exposure to platinum induces a frequent deletion of ITF2 that is involved, at least in part, in the activation of the Wnt pathway.
First, we identified a common deletion in H23, OVCAR3, and A2780 cells induced by cisplatin treatment in chromosome 18, including two completely deleted genes, LRP1B, and ITF2. A similar deletion was identified in a previous study analyzing cisplatin response in ovarian cancer samples, which supports our results [16]. However, there is another study analyzing the cytogenetic alterations of CDDP-resistant A2780R cells, which shows different genomic alterations, probably due to the specificity of the CGH-array used and the experimental design that included less representative number of probes and was performed in only one cell line [8]. We were not able to validate the LRP1B expression changes by using an alternative technique, an issue that has been previously reported [17]. In our case, it could be due to the mosaicism observed in this region that occurs in less than 20% of the resistant cells. The level of mosaicism that can be detected is dependent on the sensitivity and spatial resolution of the clones and rearrangements present [18]. Nevertheless, LRP1B could still play a role in tumor progression as several studies link its downregulation through deletion and carcinogenesis [19,20,21]. ITF2 expression changes were confirmed in H23R and A2780R but not in OVCAR3R cells, also probably due to the level of mosaicism (36%) observed in these cells. Our results indicate that low levels of mosaicism would make the validations of expression changes by another quantitative technique difficult, probably because the alterations at expression levels are not significant enough to be detected.
The fact that ITF2 is deleted and downregulated after platinum treatment provides us with new insight regarding its importance in resistance to platinum chemotherapy in lung and ovarian cancer. In line with our results, a previous study, using targeted sequencing in a PDX-based modeling of breast cancer chemoresistance, identified a genomic variant of ITF2 that depicted a link between its altered expression and breast cancer chemoresistance, although no detailed mechanism was provided to connect ITF2 function to chemoresistance [22].
ITF2 is a transcription factor belonging to the basic helix loop helix (bHLH) family, which can act as a transcriptional activator or repressor [23,24], but much about its regulation remains unknown. It is important to distinguish ITF2, whose official name is TCF4, from the T-Cell Factor 4 (TCF7L2), also known as TCF4, which is the ß-catenin transcriptional partner [25]. In fact, ITF2 expression is induced by the ß-catenin/TCF complex, but at the same time, it acts as a repressor of this complex by interfering with the binding of ß-catenin to TCF4; this causes a decrease in the expression of Wnt target genes, leading to the repression of cell proliferation [12]. Consistent with these studies, we have observed that the resistant A2780 cells have increased activity of the ß-catenin/TCF transcription, which is concomitant with the increased expression of the downstream effector gene DKK1, probably due to the absence of ITF2. In contrast, we did not observe differences in H23 cells. However, a constitutive activity of ß-catenin/TCF was observed, a circumstance that was in agreement with previous reports which described that the H23 cells had an increased expression of Wnt2, which caused Wnt/bcat activation in an autocrine manner [26], and therefore, exogenous activation may not show a difference. Moreover, we have observed that the overexpression of ITF2 in A2780R cells leads to a decrease in cell viability, rescuing the sensitive phenotype potentially through the inhibition of the excessive proliferation and the activity levels of the ß-catenin /TCF transcription. In fact, our results indicate that resistant cells respond better to the activation of the Wnt pathway, an effect that was restored after the re-expression of ITF2. Therefore, ITF2 plays an important role in the resistance to cisplatin probably through the regulation of the Wnt signaling pathway.
Our translational analysis based on the expression levels of ITF2 and DKK1 genes in two different cohorts of patients was aimed to elucidate the role of this pathway in tumor progression and chemotherapy response. ITF2 expression was frequently downregulated in the NSCLC and ovarian tumor samples, validating our in vitro data. The expression levels of DKK1, however, showed a more heterogeneous pattern in the NSCLC tumor samples, while no differences were observed in the ovarian tumors, suggesting an aberrant activation of the Wnt signaling pathway in lung cancer. In fact, our in silico analysis of 1926 NSCLC patients indicates a significantly increased overall survival associated with high expression levels of ITF2 and low expression of DKK1. The same findings, without statistical significance, were observed from our “in house” cohorts, probably due to the sample size. However, one of the strengths of our cohort was that it was comprised of fresh frozen samples, enabling us to perform high-quality RNA-sequencing in a group of NSCLC patients in order to determine the involvement of the Wnt-pathway components in lung cancer development. The differential expression of DKK1 within the tumor samples allowed us to perform three different bioinformatics contrasts in order to explore all the possibilities regarding tumor development and the Wnt signaling pathway. Contrast A identified genes with a possible involvement in lung cancer development by comparing differential expression in tumors versus the control samples. Contrast B identified alterations in the Wnt pathway in NSCLC tumors and those that could be used as potential therapeutic targets. Finally, contrast C identified genes regulated by the Wnt pathway and others involved in NSCLC development. Using this approach, we were able to identify coding genes, noncoding genes, and transcripts that had not been functionally characterized previously [27,28]. Indeed, in this study, we have identified three coding genes, HOXD9, CLDN6, and RIOX1, and one noncoding gene, XIST, which could be involved in NSCLC progression through the Wnt signaling pathway. Our data was validated by two alternative methodologies (quantitative real-time and NGS), both showing strong positive correlations. From these candidates, we observed a negative correlation between HOXD9 and ITF2 expression levels. HOXD9 was significantly downregulated in tumors with high expression levels of DKK1 and upregulated in tumors compared to controls, indicating that it could be involved in tumor progression through aberrant activation of the Wnt signaling pathway. We also observed that the tumor samples had higher expression levels of HOXD9 than the controls, as it has been previously reported [29]. In addition, patients with lower levels of HOXD9 had better overall survival than those with upregulated expression of this gene. These results are consistent with previous studies linking a high expression of HOXD9 with glioblastoma and hepatocarcinoma [30,31].
Additional functional analysis showed that ITF2 overexpression in lung cancer cells H23R decreased the expression of HOXD9. Taking into account the basal activation of the Wnt pathway in this cell line, we believe that an alternative regulatory mechanism affected by ITF2 is modulating the expression of HOXD9. Reinforcing this hypothesis, HOXD9 expression has been shown also to be regulated by epigenetic mechanisms such as the long noncoding RNA HOTAIR [32,33], which has been linked to cisplatin-resistance [34].

4. Materials and Methods

4.1. Cell Culture and Cell-Viability Assays

The NSCLC and ovarian cancer cell lines H23, H460, OVCAR3, and A2780 were purchased from the ATCC (Manassas, Virginia, USA) and ECACC (Sigma–Aldrich, Madrid, Spain) and cultured as recommended. Their CDDP-resistant variants H23R, H460R, OVCAR3R, and A2780R, were previously established in our laboratory [10,35]. Cisplatin (Farma Ferrer, Barcelona, Spain) was used for CDDP-viability assays. Cells were seeded in 24-well dishes at 40,000 cells/well, treated with increasing doses of CDDP (0, 0.5, 1, 1.5, 2, and 3 µg/mL) for an additional 72 or 48 h and stained as described [36]. Cell viability comparing sensitive vs. resistant cell lines was estimated relative to the density recorded over the same experimental group without drug exposure at the same period of time. Cell authentication is included in Table S5.

4.2. Clinical Sample and Data Collection

We selected a representative number of fresh frozen surgical specimens from University Hospital La Paz (HULP)-Hospital Biobank, totaling 25 NSCLC and 10 ovarian cancer samples, belonging to previously reported cohorts of patients [10]. Ten adjacent normal tissue (ATT) samples from NSCLC patients, two additional lung tissue samples of non-neoplastic origin from autopsies and ten more normal ovarian samples obtained from sex reassignment surgery or tubal ligation were used as negative controls (NC). All tumor patients had both a perioperative PET-CT scan showing localized disease and pathological confirmation of stages after having undergone a complete resection for a histologically confirmed tumor. The samples were processed following the standard operating procedures with the appropriate approval of the Human Research Ethics Committee at IdiPAZ (Ethic code: PI-3508), including informed consent within the context of research. Clinical follow-up was conducted according to the criteria of the medical oncology division, pathological, and therapeutic data were recorded by an independent observer, and a blind statistical analysis was performed on these data.

4.3. DNA Extraction and Array of Comparative Genome Hybridization

DNA from cell lines was isolated as previously described [37] and used to analyze copy number variations by the Array-CGH SurePrint G3 human CGH microarray 1 × 1 M (Agilent, Santa Clara, California, USA). Array experiments were performed as recommended by the manufacturer, described in detail in the GEO repository number GSE129692. The aberration detection method 2 (ADM-2) quality weighted interval score algorithm identified aberrant intervals in samples that had consistently high or low log-ratios based on their statistical score. The score represents the deviation of the weighted average of the normalized log-ratios from its expected value of zero calculated with the derivative Log2 ratio standard deviation algorithm. A fuzzy zero algorithm was applied to incorporate quality information about each probe measurement. Our threshold settings for the CGH analytics software to make a positive call were 6.0 for sensitivity, 0.45 for minimum absolute average log ratio per region, and 5 consecutive probes with the same polarity were required for the minimum number of probes per region.

4.4. RNA Extraction, RT-PCR, qRT-PCR

Total RNA from human cancer cell lines and surgical samples was isolated, reverse transcribed, and quantitative RT-PCR analysis was performed as previously described [10]. For RT-PCR, 2 µL of the RT product (diluted 1:5) was used for semi-quantitative PCR or qPCR reactions with Promega PCR Mix (Promega, Madison, Wisconsin, USA) and SYBR Green PCR Mix (Applied Biosystems, Waltham, Massachusetts, USA), respectively. RT-PCR was performed under the following conditions: (a) 1 cycle of 95 °C for 2 min; (b) 30–40 cycles of 95 °C for 1 min, 56–60 °C for 1 min, 72 °C for 1 min; (c) an extension of 5 min at 72 °C. qRT-PCR absolute quantification was calculated according to the 2−∆Ct method using GAPDH as endogenous control, whereas relative quantification was calculated with the 2−∆∆Ct using GAPDH as endogenous control and the sensitive-parental cell line as a calibrator. Samples were analyzed in triplicate using the HT7900 real-time PCR system (Applied Biosystems, USA). Primers and probes for qRT-PCR expression analysis were purchased from Applied Biosystems (TCF4, Hs00162613_m1; LRP1B, Hs01069120_m1; DKK1, Hs00183740_m1; GADPH, Hs03929097_g1). Primers for DKK1, HOXD9, CLDN6, XIST, and RIOX1 for RT-PCR assays were designed, when possible, to analyze the specific transcript that showed significant changes in the RNA-seq; all primers and specific amplification conditions are listed in Table S6.

4.5. NGS (RNA-seq) and Wnt Signaling Pathways Analysis

Total RNA from nine tumor tissues, three lung-adjacent normal tissue (ATT) from NSCLC samples and two tissue samples of non-neoplastic origin from autopsies were sent to Sistemas Genómicos Company (Valencia, Spain) for RNA-sequencing. Library samples were prepared and sequenced as recommended by the manufacturer (Illumina, San Diego, California, USA) described in detail in the GEO repository number GSE127559. The bioinformatics analysis was performed in the HULP. Reads were analyzed to quantify genes and isoforms through the RSEM-v1.2.3 methodology (RNA-seq by expectation maximization) [38] and using the hg19 versions as reference for annotation. The differential expression was carried out with edgeR, which estimates the common and individual dispersion (CMN and TGW, respectively) to obtain the variability of the data [39]. P-values and FDR statistical analyses were performed by Cmn and Twg models and the statistical cut-off point was set as FDR < 0.05. Normalization was performed by the TMM method (trimmed mean of M-values) [40]. The bioinformatics analysis included an efficiency analysis for every sample, considering the total efficiency as the percentage of reads annotated belonging to a transcript regarding the total fragments initially read. When using principal component analysis (PCA), no differences were observed between samples from non-neoplastic autopsies and adjacent normal tissue (ATT) from NSCLC patients in terms of transcriptomic profile, therefore both types of samples were considered as reference groups for the differential expression analysis (Figure S3). Three different bioinformatics contrasts are described in detail in the results section.

4.6. Transfection Assays: Top-fop, B-cat and TCF4 Overexpression

A Myc-DDK-tagged ORF clone of TCF4 and the negative control pCMV6 were used for in transient transfection (RC224345; OriGene, Rockville, MD, USA) using previously described methodology [10]. Cells were plated onto 60 mm dishes at 600,000 cells/dish and transfected with a negative control or TCF4 vectors, using jet-PEI DNA transfection reagent (PolyPlus Transfection, Illkirch, France). For the Wnt reporter, assay cells were plated at a concentration of 600,000 cells/well in 6 MW plates. Cells were serum-starved overnight and cotransfected with 0.2 μg of either Super8xTopFlash (containing 7 copies of the TCF/LEF binding site) or Super8xFopFlash (containing 6 mutates copies of the TCF/LEF binding sites) expression plasmids, and 0.1 μg pRL-TK (Renilla-TK-luciferase vector, Promega, Madison, WI, USA) as a control, using lipofectamine 2000. Cells were subsequently treated with LiCl 10 mM or cotransfected with S33Y ß-catenin for 48 h prior to luciferase activities being measured using a Glomax 96 Microplate Luminometer (Turner Biosystems Instrument, Sunnyvale, CA, USA). Firefly luciferase activity was calculated as light units normalized with the Renilla activity generated by the pRL-CMV vector. ß-catenin/TCF activity was calculated by obtaining the ratio of the Top/Fop promoter activities and expressed in relative terms as the fold change of the untreated cells activation levels (=1).

4.7. In Silico Databases: The Cancer Genome Atlas and Kaplan–Meier Plotter

The Cancer Genome Atlas (TCGA) data: We selected samples from the TCGA data sets containing RNA sequencing information: 230 lung adenocarcinoma, 487 lung SCC, 186 esophageal adenocarcinoma and 522 head and neck SCC tumors, to analyze the expression of ITF2 and HOXD9 genes. We obtained overall survival Kaplan–Meier estimations selecting groups of patients with high and low expression of ITF2/HOXD9 (mRNA expression Z-score threshold = 1). Samples with ITF2 deletion and low expression were included in the ITF2 low group.
Kaplan–Meier Plotter: We obtained the survival analysis of 1926 patients from the Kaplan–Meier Plotter online tool [41] for the Affymetrix ID probes 213891_s_at for ITF2, 204602_at for DKK1 and 206604_at for HOXD9. Groups were separated according to the median in high and low expression.

4.8. Statistical Analysis

Data were compared using the chi-squared test or Fisher’s exact test for qualitative variables, and Student’s t-test or the Wilcoxon–Mann–Whitney test for quantitative variables. The correlation of quantitative variables was analyzed by Pearson’s test. Overall survival was estimated according to the Kaplan–Meier method and compared between groups by means of the log-rank test. All the p-values were two-sided, and the type I error was set at 5 percent. Statistical analyses were performed using SPSS_20 software (IBM, Armonk, NY, USA).

5. Conclusions

In essence, we have identified ITF2 as a frequently downregulated gene in cisplatin-resistant cancer cells as well as in NSCLC and ovarian cancer patients. We have also observed a statistically significant relationship with a better response to platinum treatment not only in the lung but also in other epithelial tumors, suggesting that ITF2 could be used as a general epithelial tumor platinum-predictive marker. Moreover, we have defined its implication as a molecular mechanism behind the development of cisplatin resistance in cancer cells probably through the activation of the Wnt-signaling pathway and, several of its downstream effector genes, providing novel insights into the molecular biology and the cellular mechanisms involved in the acquired resistance to the most widely-used chemotherapy agent, cisplatin. Finally, we have suggested two potential therapeutic targets for further study, ITF2 and HOXD9.

Supplementary Materials

The following are available online at https://www.mdpi.com/2072-6694/12/4/786/s1, Figure S1. (A) Picture extracted from the Agilent Cytogenomics 3.0.1.1 software showing the absence of ITF2 deletion in the H460R cells. (B) Picture extracted from the Agilent Cytogenomics 3.0.1.1 software showing the LRP1B deletion in chromosome 2 in H23R and H460R cell lines. (C) Relative mRNA expression levels of LRP1B measured by qRT-PCR. The results show the mean fold induction compared to the sensitive cells. Gene expression was normalized to GAPDH. Data represent the relative expression levels obtained from the combination of two independent experiments measured in triplicate ± SD. ns, not significant, Figure S2. (A) Kaplan–Meier analysis in a cohort of 25 NSCLC patients from Hospital La Paz for DKK1 expression. LogRank, Breslow, and Tarone–Ware tests were used for comparisons, and p <0.05 was considered a significant change in OS. (BD) Kaplan–Meier analysis on TCGA datasets from lung SCC (n = 230; High n = 48, Low/Del n = 33), (B) esophageal adenocarcinoma (n = 186; High n = 25, Low/Del n = 41) (C) and head and neck SCC (n = 522; High n = 66, Low/Del n = 74). (D) comparing tumors with deletion or low expression of TCF4 compared with tumors with increased TCF4 expression, Figure S3. Plot samples on a two-dimensional scatterplot. In this plot, distances are based on the biological coefficient of variation (BCV, square root of the common dispersion). A set of the 500 most differentially expressed genes with the largest biological variation among the libraries was chosen for the analysis. Samples P386 (LC1) and P385 (LC2) are lung tissue samples of non-neoplastic origin from autopsies. Samples P298 (Pat9), P323 (Pat21), and P416 (Pat25) are adjacent normal tissue (ATT) from NSCLC patients, Figure S4. Expression levels of candidate target genes measured by RNAseq and qRT-PCR in tumor and nontumor samples from NSCLC paDents. (AD) correla5on between RNA-seq and qRT-PCR expression levels performed in a selec5on of 14 samples in (A) HOXD9, (B) XIST, (C) CLDN6 and (D) RIOX1. Bars represent the relative expression of each gene measured by qRT-PCR in triplicate and represented as 2-ΔCt, and lines represent the count per million obtained from the RNA-seq analysis, Figure S5. Expression levels of candidate target genes measured by RNA-seq and qRT-PCR in tumor and non-tumor samples from NSCLC patients. (A–D) correlation between RNA-seq and qRT-PCR expression levels performed in a selection of 14 samples in HOXD9 (A), XIST (B), CLDN6 (C) and RIOX1 (D). Bars represent the relative expression of each gene measured by qRT-PCR in triplicate and represented as 2-ΔCt and lines represent the count per million obtained from the RNA-seq analysis, Table S1. Summary of the common deleted regions and genes in resistant cells. bp, base pairs, Table S2. Clinicopathological and experimental data obtained from patients with ovarian cancer from La Paz University Hospital, Table S3. Clinicopathological and experimental data of ITF2, DKK1, CDLN6, and XIST for the NSLC patients that were used for RNAseq, Table S4. Selected genes potentially involved in the Wnt signaling pathway identified through a global transcriptomic analysis on 14 samples of NSCLC patients, Table S5. Cell authentication. Genomics Core Facility. IIBm CSIC-UAM, Table S5. Cell Authentication. Genomics Core Facility. IIBm CSIC-UAM, Table S6: List of designed primers used for RT-PCR and the amplification characteristics.

Author Contributions

IIC, Conception design and draft, funding acquisition; O.P., A.S.-P., A.G.-G., M.P.-B., C.R., R.M.-A., V.P., and O.V., development of methodology; O.P., A.S.-P., C.R.-A., A.G.-G., R.R., D.S.-C., C.R., J.d.C., and I.I.d.C., acquisition of data; O.P., A.S.-P., A.G.-G., R.R., D.S.-C., C.R., P.S., J.d.-C., O.V.P., and I.I.d.C., analysis and interpretation of data; C.R.-A. and M.P.-B., bioinformatics analysis and interpretation of bioinformatics data; O.V., I.I.d.C., and A.S.-P. wrote the manuscript; All authors reviewed and/or revised the manuscript. I.I.d.C. and O.V. approved the final version; I.I.d.C. and O.V., agreed to be accountable for all aspects of the work in ensuring that questions related to the accuracy or integrity of any part of the work are appropriately investigated and resolved. All authors have read and agreed to the published version of the manuscript.

Funding

This research was funded by the Fondo de Investigación Sanitaria-Instituto de Salud Carlos III, PI15/00186 and PI18/00050, CP19/00063, and CM19/00100 for HR and by MINECO, RTC-2016-5314-1 to I.I.C; by the MINECO, SAF2016-75531-R, by the CAM B2017/BMD-3724 and by the AECC GCB14142311CRES to P.S; and the European Regional Development Fund/European Social Fund FIS (FEDER/FSE, Una Manera de Hacer Europa).

Acknowledgments

The authors thank Hayley Pickett for the English language correction. The authors also acknowledge HULP Biobank for sample processing.

Conflicts of Interest

All the authors have read the journal’s authorship statement and declare no potential conflicts of interest.

References

  1. Lee, S.Y.; Jung, D.K.; Choi, J.E.; Jin, C.C.; Hong, M.J.; Do, S.K.; Kang, H.G.; Lee, W.K.; Seok, Y.; Lee, E.B.; et al. Pd-L1 Polymorphism Can Predict Clinical Outcomes of Non-Small Cell Lung Cancer Patients Treated with First-Line Paclitaxel-Cisplatin Chemotherapy. Sci. Rep. 2016, 6, 25952. [Google Scholar] [CrossRef] [PubMed] [Green Version]
  2. French, J.D.; Johnatty, S.E.; Lu, Y.; Beesley, J.; Gao, B.; Kalimutho, M.; Henderson, M.J.; Russell, A.J.; Kar, S.; Chen, X.; et al. Germline Polymorphisms in an Enhancer of Psip1 Are Associated with Progression-Free Survival in Epithelial Ovarian Cancer. Oncotarget 2016, 7, 6353–6368. [Google Scholar] [CrossRef] [PubMed] [Green Version]
  3. Jemal, A.; Bray, F.; Center, M.M.; Ferlay, J.; Ward, E.; Forman, D. Global Cancer Statistics. CA Cancer J. Clin. 2011, 61, 69–90. [Google Scholar] [CrossRef] [PubMed] [Green Version]
  4. Haslehurst, A.M.; Koti, M.; Dharsee, M.; Nuin, P.; Evans, K.; Geraci, J.; Childs, T.; Chen, J.; Li, J.; Weberpals, J.; et al. Emt Transcription Factors Snail and Slug Directly Contribute to Cisplatin Resistance in Ovarian Cancer. BMC Cancer 2012, 12, 91. [Google Scholar] [CrossRef] [PubMed] [Green Version]
  5. Karaca, B.; Atmaca, H.; Bozkurt, E.; Kisim, A.; Uzunoglu, S.; Karabulut, B.; Sezgin, C.; Sanli, U.A.; Uslu, R. Combination of at-101/Cisplatin Overcomes Chemoresistance by Inducing Apoptosis and Modulating Epigenetics in Human Ovarian Cancer Cells. Mol. Biol. Rep. 2013, 40, 3925–3933. [Google Scholar] [CrossRef] [PubMed]
  6. Akervall, J.; Guo, X.; Qian, C.N.; Schoumans, J.; Leeser, B.; Kort, E.; Cole, A.; Resau, J.; Bradford, C.; Carey, T.; et al. Genetic and Expression Profiles of Squamous Cell Carcinoma of the Head and Neck Correlate with Cisplatin Sensitivity and Resistance in Cell Lines and Patients. Clin. Cancer Res. 2004, 10, 8204–8213. [Google Scholar]
  7. Hiorns, L.R.; Seckl, M.J.; Paradinas, F.; Sharp, S.Y.; Skelton, L.A.; Brunstrom, G.; Newlands, E.S.; Kelland, L.R.; Leyland-Jones, B. A Molecular Cytogenetic Approach to Studying Platinum Resistance. J. Inorg. Biochem. 1999, 77, 95–104. [Google Scholar] [CrossRef]
  8. Leyland-Jones, B.; Kelland, L.R.; Harrap, K.R.; Hiorns, L.R. Genomic Imbalances Associated with Acquired Resistance to Platinum Analogues. Am. J. Pathol. 1999, 155, 77–84. [Google Scholar] [CrossRef] [Green Version]
  9. Yasui, K.; Mihara, S.; Zhao, C.; Okamoto, H.; Saito-Ohara, F.; Tomida, A.; Funato, T.; Yokomizo, A.; Naito, S.; Imoto, I.; et al. Alteration in Copy Numbers of Genes as a Mechanism for Acquired Drug Resistance. Cancer Res. 2004, 64, 1403–1410. [Google Scholar] [CrossRef] [Green Version]
  10. Vera, O.; Jimenez, J.; Pernia, O.; Rodriguez-Antolin, C.; Rodriguez, C.; Sanchez Cabo, F.; Soto, J.; Rosas, R.; Lopez-Magallon, S.; Esteban Rodriguez, I.; et al. DNA Methylation of Mir-7 Is a Mechanism Involved in Platinum Response through Mafg Overexpression in Cancer Cells. Theranostics 2017, 7, 4118–4134. [Google Scholar] [CrossRef]
  11. Kolligs, F.T.; Nieman, M.T.; Winer, I.; Hu, G.; Van Mater, D.; Feng, Y.; Smith, I.M.; Wu, R.; Zhai, Y.; Cho, K.R.; et al. Itf-2, a Downstream Target of the Wnt/Tcf Pathway, Is Activated in Human Cancers with Beta-Catenin Defects and Promotes Neoplastic Transformation. Cancer Cell 2002, 1, 145–155. [Google Scholar]
  12. Shin, H.W.; Choi, H.; So, D.; Kim, Y.I.; Cho, K.; Chung, H.J.; Lee, K.H.; Chun, Y.S.; Cho, C.H.; Kang, G.H.; et al. Itf2 Prevents Activation of the Beta-Catenin-Tcf4 Complex in Colon Cancer Cells and Levels Decrease with Tumor Progression. Gastroenterology 2014, 147, 430–442. [Google Scholar] [CrossRef] [PubMed]
  13. Chikazawa, N.; Tanaka, H.; Tasaka, T.; Nakamura, M.; Tanaka, M.; Onishi, H.; Katano, M. Inhibition of Wnt Signaling Pathway Decreases Chemotherapy-Resistant Side-Population Colon Cancer Cells. Anticancer Res. 2010, 30, 2041–2048. [Google Scholar] [PubMed]
  14. Nagaraj, A.B.; Joseph, P.; Kovalenko, O.; Singh, S.; Armstrong, A.; Redline, R.; Resnick, K.; Zanotti, K.; Waggoner, S.; DiFeo, A. Critical Role of Wnt/Beta-Catenin Signaling in Driving Epithelial Ovarian Cancer Platinum Resistance. Oncotarget 2015, 6, 23720–23734. [Google Scholar] [CrossRef] [Green Version]
  15. Zhang, Q.; Meng, X.K.; Wang, W.X.; Zhang, R.M.; Zhang, T.; Ren, J.J. The Wnt/Beta-Catenin Signaling Pathway Mechanism for Pancreatic Cancer Chemoresistance in a Three-Dimensional Cancer Microenvironment. Am. J. Transl. Res. 2016, 8, 4490–4498. [Google Scholar]
  16. Bosquet, J.G.; Marchion, D.C.; Chon, H.; Lancaster, J.M.; Chanock, S. Analysis of Chemotherapeutic Response in Ovarian Cancers Using Publicly Available High-Throughput Data. Cancer Res. 2014, 74, 3902–3912. [Google Scholar] [CrossRef] [Green Version]
  17. Kohno, T.; Otsuka, A.; Girard, L.; Sato, M.; Iwakawa, R.; Ogiwara, H.; Sanchez-Cespedes, M.; Minna, J.D.; Yokota, J. A Catalog of Genes Homozygously Deleted in Human Lung Cancer and the Candidacy of Ptprd as a Tumor Suppressor Gene. Genes Chromosom. Cancer 2010, 49, 342–352. [Google Scholar]
  18. Cho, E.K. Array-Based Comparative Genomic Hybridization and Its Application to Cancer Genomes and Human Genetics. J. Lung Cancer 2011, 10, 77–86. [Google Scholar] [CrossRef] [Green Version]
  19. Brown, J.; Bothma, H.; Veale, R.; Willem, P. Genomic Imbalances in Esophageal Carcinoma Cell Lines Involve Wnt Pathway Genes. World J. Gastroenterol. 2011, 17, 2909–2923. [Google Scholar] [CrossRef]
  20. Ni, S.; Hu, J.; Duan, Y.; Shi, S.; Li, R.; Wu, H.; Qu, Y.; Li, Y. Down Expression of Lrp1b Promotes Cell Migration Via Rhoa/Cdc42 Pathway and Actin Cytoskeleton Remodeling in Renal Cell Cancer. Cancer Sci. 2013, 104, 817–825. [Google Scholar] [CrossRef]
  21. Liu, C.X.; Musco, S.; Lisitsina, N.M.; Forgacs, E.; Minna, J.D.; Lisitsyn, N.A. Lrp-Dit, a Putative Endocytic Receptor Gene, Is Frequently Inactivated in Non-Small Cell Lung Cancer Cell Lines. Cancer Res. 2000, 60, 1961–1967. [Google Scholar] [PubMed]
  22. Ruiz de Garibay, G.; Mateo, F.; Stradella, A.; Valdes-Mas, R.; Palomero, L.; Serra-Musach, J.; Puente, D.A.; Diaz-Navarro, A.; Vargas-Parra, G.; Tornero, E.; et al. Tumor Xenograft Modeling Identifies an Association between Tcf4 Loss and Breast Cancer Chemoresistance. Dis. Model. Mech. 2018, 11. [Google Scholar] [CrossRef] [PubMed] [Green Version]
  23. Murre, C. Helix-Loop-Helix Proteins and Lymphocyte Development. Nat. Immunol. 2005, 6, 1079–1086. [Google Scholar] [CrossRef] [PubMed]
  24. Sepp, M.; Kannike, K.; Eesmaa, A.; Urb, M.; Timmusk, T. Functional Diversity of Human Basic Helix-Loop-Helix Transcription Factor Tcf4 Isoforms Generated by Alternative 5’ Exon Usage and Splicing. PLoS ONE 2011, 7, e22138. [Google Scholar] [CrossRef] [PubMed] [Green Version]
  25. Navarrete, K.; Pedroso, I.; De Jong, S.; Stefansson, H.; Steinberg, S.; Stefansson, K.; Ophoff, R.A.; Schalkwyk, L.C.; Collier, D.A. Tcf4 (E2-2; Itf2): A Schizophrenia-Associated Gene with Pleiotropic Effects on Human Disease. Am. J. Med. Genet. B Neuropsychiatr. Genet. 2013, 162B, 1–16. [Google Scholar] [CrossRef] [PubMed]
  26. Akiri, G.; Cherian, M.M.; Vijayakumar, S.; Liu, G.; Bafico, A.; Aaronson, S.A. Wnt Pathway Aberrations Including Autocrine Wnt Activation Occur at High Frequency in Human Non-Small-Cell Lung Carcinoma. Oncogene 2009, 28, 2163–2172. [Google Scholar] [CrossRef] [PubMed] [Green Version]
  27. Wang, Z.; Gerstein, M.; Snyder, M. Rna-Seq: A Revolutionary Tool for Transcriptomics. Nat. Rev. Genet. 2009, 10, 57–63. [Google Scholar] [CrossRef] [PubMed]
  28. Katz, Y.; Wang, E.T.; Airoldi, E.M.; Burge, C.B. Analysis and Design of Rna Sequencing Experiments for Identifying Isoform Regulation. Nat. Methods 2010, 7, 1009–1015. [Google Scholar] [CrossRef]
  29. Plowright, L.; Harrington, K.J.; Pandha, H.S.; Morgan, R. Hox Transcription Factors Are Potential Therapeutic Targets in Non-Small-Cell Lung Cancer (Targeting Hox Genes in Lung Cancer). Br. J. Cancer 2009, 100, 470–475. [Google Scholar] [CrossRef]
  30. Tabuse, M.; Ohta, S.; Ohashi, Y.; Fukaya, R.; Misawa, A.; Yoshida, K.; Kawase, T.; Saya, H.; Thirant, C.; Chneiweiss, H.; et al. Functional Analysis of Hoxd9 in Human Gliomas and Glioma Cancer Stem Cells. Mol. Cancer 2011, 10, 60. [Google Scholar] [CrossRef] [Green Version]
  31. Lv, X.; Li, L.; Lv, L.; Qu, X.; Jin, S.; Li, K.; Deng, X.; Cheng, L.; He, H.; Dong, L. Hoxd9 Promotes Epithelial-Mesenchymal Transition and Cancer Metastasis by Zeb1 Regulation in Hepatocellular Carcinoma. J. Exp. Clin. Cancer Res. 2015, 34, 133. [Google Scholar] [CrossRef] [PubMed] [Green Version]
  32. Rinn, J.L.; Kertesz, M.; Wang, J.K.; Squazzo, S.L.; Xu, X.; Brugmann, S.A.; Goodnough, L.H.; Helms, J.A.; Farnham, P.J.; Segal, E.; et al. Functional Demarcation of Active and Silent Chromatin Domains in Human Hox Loci by Noncoding Rnas. Cell 2007, 129, 1311–1323. [Google Scholar] [CrossRef] [PubMed] [Green Version]
  33. Woo, C.J.; Kingston, R.E. Hotair Lifts Noncoding Rnas to New Levels. Cell 2007, 129, 1257–1279. [Google Scholar] [CrossRef] [Green Version]
  34. Liu, Z.; Sun, M.; Lu, K.; Liu, J.; Zhang, M.; Wu, W.; De, W.; Wang, Z.; Wang, R. The Long Noncoding Rna Hotair Contributes to Cisplatin Resistance of Human Lung Adenocarcinoma Cells Via Downregualtion of P21(Waf1/Cip1) Expression. PLoS ONE 2013, 8, e77293. [Google Scholar]
  35. Ibanez de Caceres, I.; Cortes-Sempere, M.; Moratilla, C.; Machado-Pinilla, R.; Rodriguez-Fanjul, V.; Manguan-Garcia, C.; Cejas, P.; Lopez-Rios, F.; Paz-Ares, L.; de CastroCarpeno, J.; et al. Igfbp-3 Hypermethylation-Derived Deficiency Mediates Cisplatin Resistance in Non-Small-Cell Lung Cancer. Oncogene 2010, 29, 1681–1690. [Google Scholar] [CrossRef] [PubMed] [Green Version]
  36. Chattopadhyay, S.; Machado-Pinilla, R.; Manguan-Garcia, C.; Belda-Iniesta, C.; Moratilla, C.; Cejas, P.; Fresno-Vara, J.A.; de Castro-Carpeno, J.; Casado, E.; Nistal, M.; et al. Mkp1/Cl100 Controls Tumor Growth and Sensitivity to Cisplatin in Non-Small-Cell Lung Cancer. Oncogene 2006, 25, 3335–3345. [Google Scholar] [CrossRef] [PubMed]
  37. Ibanez de Caceres, I.; Dulaimi, E.; Hoffman, A.M.; Al-Saleem, T.; Uzzo, R.G.; Cairns, P. Identification of Novel Target Genes by an Epigenetic Reactivation Screen of Renal Cancer. Cancer Res. 2006, 66, 5021–5028. [Google Scholar] [CrossRef] [PubMed] [Green Version]
  38. Li, B.; Dewey, C.N. Rsem: Accurate Transcript Quantification from Rna-Seq Data with or without a Reference Genome. BMC Bioinform. 2011, 12, 323. [Google Scholar] [CrossRef] [Green Version]
  39. Robinson, M.D.; McCarthy, D.J.; Smyth, G.K. Edger: A Bioconductor Package for Differential Expression Analysis of Digital Gene Expression Data. Bioinformatics 2010, 26, 139–140. [Google Scholar] [CrossRef] [Green Version]
  40. Robinson, M.D.; Oshlack, A. A Scaling Normalization Method for Differential Expression Analysis of Rna-Seq Data. Genome Biol. 2010, 11, R25. [Google Scholar] [CrossRef] [Green Version]
  41. Gyorffy, B.; Surowiak, P.; Budczies, J.; Lanczky, A. Online Survival Analysis Software to Assess the Prognostic Value of Biomarkers Using Transcriptomic Data in Non-Small-Cell Lung Cancer. PLoS ONE 2013, 8, e82241. [Google Scholar] [CrossRef] [PubMed] [Green Version]
Figure 1. Identification of a common deletion in chromosome 18 in cisplatin-resistant cancer cell lines. (A) Picture extracted from the Agilent cytogenomics 3.0.1.1 software showing the ITF2 deletion in chromosome 18 in H23R, A2780R, and OVCAR3R cell lines. (B) Relative mRNA expression levels of ITF2 measured by qRT-PCR. The results show the mean fold induction compared to the sensitive cells. Gene expression was normalized to GAPDH. S, sensitive; R, resistant; data represents the relative expression levels obtained from the combination of two independent experiments measured in triplicate ± SD. *** p < 0.001; (Students t-test).
Cancers 12 00786 g001
Figure 2. The basal status of the Wnt signaling pathway in A2780 and H23 cell lines. (AB) Pharmacological activation (A) and functional activation (B) of β-catenin transcriptional activity in A2780 cells. (C) The expression levels of downstream genes regulated by ITF2 involved in Wnt signaling pathway in A2780S and A2780R cells measured by RNAseq in terms of “fragments per kilobase of transcript per million mapped reads” or FPKM values. (D) Pharmacological activation of β-catenin transcriptional activity in H23 cells. β-catenin transcriptional activity was measure in A2780 and H23 cells after treatment with LiCl (10 mM) 24 h or transfection of bcat-S33Y, transfecting with Super8xTopFlash (Top) or Super8xFopFlash (Fop). The results show the fold induction of the Top/Fop ratio with respect to untreated cells (= 1). Values represent the mean of three independent experiments measured by triplicate ± SD. *** p < 0.001; ** p < 0.01, *p < 0.05 (Students t-test) ns, non significant.
Cancers 12 00786 g002
Figure 3. The effect of ITF2 on cisplatin resistance, cell viability, and Wnt pathway. (A) Viability curves of A2780 cell lines transfected with pCMV6 (S-Ø and R-Ø) and with the overexpression vector (R-ITF2). Each experimental group was exposed to six different CDDP concentrations for 48 h. Data were normalized to each untreated control, set to 100%. The data represent the mean ± SD of at least three independent experiments performed in quadruplicate at each drug concentration for each cell line analyzed. (B) Viability of A2780 cell lines transfected with pCMV6 (R-Ø) and with the overexpression vectors (R-ITF2). (C) Relative expression levels of ITF2 measured by quantitative RT-PCR represented in Log10 scale; in each experimental group, the sensitive cell line transfected with pCMV6 plasmid was used as a calibrator. Each bar represents the combined relative expression of two independent experiments measured in triplicate. (D) β-catenin transcriptional activity was measured in A2780 cells after ITF2 overexpression and treatment with LiCl (10 mM) for 24 h, transfected with Super8xTopFlash (Top) or Super8xFopFlash (Fop). The results show the fold induction of the Top/Fop ratio with respect to untreated cells (=1). Values represent the mean of three independent experiments measured by triplicate ± SD. (E) Expression analysis of the downstream gene DKK1 regulated by ITF2 in A2780 cell line transfected with pCMV6 (S-Ø and R-Ø) and with the overexpression vector (R-ITF2) for 24 and 72 h. Representative images of DKK1 and GAPDH measured by RT-PCR. (F) Expression levels of DKK1 measured by qRT-PCR. Each assay was performed at least three times to confirm the results. *** p < 0.001; * p < 0.05 (Students t-test).
Cancers 12 00786 g003
Figure 4. The expression profile of ITF2 and DKK1 in patients with NSCLC and ovarian cancer. (A,B) Assessment of ITF2 and DKK1 expression levels measured by qRT-PCR in 55 fresh samples from nontumor samples, and two cohort NSCLC (A) and ovarian cancer patients. (B) For all the analyses, data represents expression levels in 2−∆ΔCt using the mean of normal lungs (NLM) or ovarian (NOM) as calibrator. (C) Survival analysis in 25 NSCLC samples according to the mean of ITF2 expression. LogRank, Breslow, and Tarone–Ware tests were used for comparisons, and p < 0.05 was considered a significant change in OS. NSCLC, non-small cell lung cancer; ATT, adjacent tumor tissue; T, tumor; LC1/LC2, Lung Control; NLM, normal lung mean; NOM, normal ovarian mean. (D,E) Survival analysis in 1926 patients from the Kaplan–Meier online tool for ITF2 (D) and DKK1 (E) in terms of overall survival.
Cancers 12 00786 g004
Figure 5. Selected genes potentially involved in the Wnt signaling pathway. Genes were identified through a global transcriptomic analysis of 14 NSCLC patient samples combining the information with all annotated genes related to the Wnt-pathway in gene sets of the molecular signatures database (MSigDB, Broad Institute).
Cancers 12 00786 g005
Figure 6. Analysis and clinical significance of ITF2 and HOXD9 in NSCLC samples. (A) Correlation between ITF2 expression and HOXD9 in tumor and nontumor samples from the complete cohort of 25 NSCLC patients. The Pearson coefficient was used for the linear correlation of the quantitative variables. (B,C) Effect of ITF2 overexpression on HOXD9 levels (B) Validation of the transfection efficiency of ITF2 at mRNA levels. Relative expression levels of ITF2 measured by qRT-PCR, in the cell line H23R, at 24 and 72 h after transfection represented in Log10 the 2−ΔΔCt. (C) Relative expression levels of HOXD9 measured by quantitative RT-PCR after ITF2 overexpression. For both (B) and (C) the resistant cell line transfected with pCMV6 plasmid was used as a calibrator (R-Ø). H23R cells were also transfected with ITF2 cDNA (R-ITF2). Each bar represents the combined relative expression of two independent experiments measured in triplicate. *** p < 0.001; ** p < 0.01 (Students t-test). (D) Correlation between ITF2 and HOXD9 expression levels with the overall survival analyzed in NSCLC patients selected form the RNA-seq analysis. The left Y axis represents the quantitative expression levels of ITF2 (grey circles) measured by qRT-PCR as 2−∆∆Ct and its correlation with overall survival in days (grey line, r = 0.4). The right Y axis indicates the quantitative expression levels of HOXD9 (black triangles) measured by qRT-PCR as 2−∆Ct and its correlation with overall survival in days (black dotted-line, r = −0.4). (E) Survival analysis in NSCLC samples according to the mean of HOXD9. LogRank, Breslow, and Tarone–Ware tests were used for comparisons and p < 0.05 was considered as a significant change in overall survival (OS). (FH) Survival analysis in 1926 patients from the Kaplan–Meier online tool, (F) and the TCGA data sets of lung adenocarcinoma, (G) high = 23; no change = 203; and SCC, (H) high = 28; no change = 441 for HOXD9.
Cancers 12 00786 g006
Table 1. Clinicopathological and experimental data obtained from patients with NSCLC from La Paz University Hospital.
PatientHistologySexStageChemotherapyRelapseStatusOS (days)PFS (days)TCF4DKK1HOXD9RIOX1
(2−ΔCt)(2−ΔCt)(2−ΔCt)(2−ΔCt)
Pat1.TAdenocarcinomaFemaleIANo YesAlive222014900.033640.000890.000080.00872
Pat2.TAdenocarcinomaMale NANo YesAlive235218600.010410.000030.042770.01605
Pat3.TEpidermoidMaleIBNo YesExitus10228250.010120.000750.000010.00114
Pat4.TAdenocarcinomaMaleIBNo NoExitus330.002860.000060.000410.00624
Pat5.TAdenocarcinomaMale NANo NoExitus6266260.003650.000050.005030.00932
Pat6.TLarge cellMaleIIBNo NoExitus62620.015840.001190.000740.00216
Pat7.TAdenocarcinomaMaleIIIAOtroYesExitus2281380.012780.001500.000780.12070
Pat8.TEpidermoidFemaleIIIBCDDP + OthersNoExitus1091090.006750.000260.001260.00196
Pat9.TAdenocarcinomaFemaleIIACDDP + OthersYesAlive226022600.010700.018260.000970.04697
Pat10.TEpidermoidMaleIBNo NoAlive185318530.016260.001620.000270.00723
Pat11.TAdenocarcinomaMaleIANo NoExitus2162160.004560.000030.000700.01399
Pat12.TAdenocarcinomaFemaleIIIACBDCA + OthersYesAlive219221920.005800.000040.001460.01059
Pat13.TEpidermoidMaleIBCDDP + OthersNoAlive234123410.024660.000900.000130.14752
Pat14.TEpidermoidMaleIIANo NDExitus2892890.011790.002060.000610.02547
Pat15.TEpidermoidMaleIIANo NDND1091090.018330.013700.004200.07619
Pat16.TAdenocarcinomaFemaleIIIACDDP + OthersNDAlive222822280.009070.000050.001910.00814
Pat17.TAdenocarcinomaMaleIIBOtroYesExitus8884430.007040.000140.000020.00833
Pat18.TEpidermoidMaleIIBCBDCA + OthersNoExitus2592590.005630.00001 0.01455
Pat19.TAdenocarcinomaFemaleIBCDDP + OthersYesExitus9364280.007380.001370.000140.01572
Pat20.TEpidermoidMaleIIBCDDP + OthersYesExitus12246370.003460.000890.002640.00422
Pat21.TAdenocarcinomaMaleIIIACDDP + OthersNoND4214210.007920.002790.000030.00509
Pat22.TAdenocarcinomaFemaleIIBCDDP + OthersNDND1841840.013190.001010.000070.01480
Pat23.TEpidermoidMaleIIIACDDP + OthersNDND5425420.032210.002140.001200.01741
Pat24.TAdenocarcinomaMaleIIACBDCA + OthersNoAlive149114910.036800.006140.000770.01088
Pat25.TAdenocarcinomaMaleIIACDDP + OthersNoAlive14961496 0.000080.00872
Note: OS, Overall Survival; PFS, progression free survival; CDDP, cisplatin; CBDCA, carboplatin; NA, not available.

