Article

Identification of Potential Serum Protein Biomarkers and Pathways for Pancreatic Cancer Cachexia Using an Aptamer-Based Discovery Platform

by
Ashok Narasimhan
1,
Safi Shahda
2,3,†,
Joshua K. Kays
1,
Susan M. Perkins
3,4,
Lijun Cheng
4,‡,
Katheryn N. H. Schloss
1,
Daniel E. I. Schloss
1,
Leonidas G. Koniaris
1,5 and
Teresa A. Zimmers
1,3,5,6,7,8,*
1
Department of Surgery, Indiana University School of Medicine, Indianapolis, IN 46202, USA
2
Department of Medicine, Indiana University School of Medicine, Indianapolis, IN 46202, USA
3
Simon and Bren Comprehensive Cancer Center, Indiana University, Indianapolis, IN 46202, USA
4
Department of Biostatistics, Indiana University School of Medicine, Indianapolis, IN 46202, USA
5
Indiana Center for Musculoskeletal Health, Indianapolis, IN 46202, USA
6
Department of Otolaryngology—Head & Neck Surgery, Indiana University School of Medicine, Indianapolis, IN 46202, USA
7
Department of Biochemistry and Molecular Biology, Indiana University School of Medicine, Indianapolis, IN 46202, USA
8
Richard L. Roudebush Veterans Administration Medical Center, Indianapolis, IN 46202, USA
*
Author to whom correspondence should be addressed.
Current affiliation: Eli Lilly, Co., Indianapolis, IN 46225, USA.
Current affiliation: Department of Biomedical Informatics, The Ohio State University College of Medicine, Columbus, OH 43210, USA.
Cancers 2020, 12(12), 3787; https://doi.org/10.3390/cancers12123787
Submission received: 3 July 2020 / Revised: 20 November 2020 / Accepted: 11 December 2020 / Published: 15 December 2020
(This article belongs to the Special Issue The Role of Aptamers in Cancer Diagnostics and Therapy)

Abstract

:

Simple Summary

Patients with pancreatic cancer and other advanced cancers suffer from progressive weight loss that reduces treatment response and quality of life and increases treatment toxicity and mortality. Effective interventions to prevent such weight loss, known as cachexia, require molecular markers to diagnose, stage, and monitor cachexia. No such markers are currently validated or in clinical use. This study used a discovery platform to measure changes in plasma proteins in patients with pancreatic cancer compared with normal controls. We found proteins specific to pancreatic cancer and cancer stage, as well as proteins that correlate with cachexia. These include some previously known proteins along with novel ones and implicates both well-known and new molecular mechanisms. Thus, this study provides novel insights into the molecular processes underpinning cancer and cachexia and affords a basis for future validation studies in larger numbers of patients with pancreatic cancer and cachexia.

Abstract

Patients with pancreatic ductal adenocarcinoma (PDAC) suffer debilitating and deadly weight loss, known as cachexia. Development of therapies requires biomarkers to diagnose, and monitor cachexia; however, no such markers are in use. Via Somascan, we measured ~1300 plasma proteins in 30 patients with PDAC vs. 11 controls. We found 60 proteins specific to local PDAC, 46 to metastatic, and 67 to presence of >5% cancer weight loss (FC ≥ |1.5|, p ≤ 0.05). Six were common for cancer stage (Up: GDF15, TIMP1, IL1RL1; Down: CCL22, APP, CLEC1B). Four were common for local/cachexia (C1R, PRKCG, ELANE, SOST: all oppositely regulated) and four for metastatic/cachexia (SERPINA6, PDGFRA, PRSS2, PRSS1: all consistently changed), suggesting that stage and cachexia status might be molecularly separable. We found 71 proteins that correlated with cachexia severity via weight loss grade, weight loss, skeletal muscle index and radiodensity (r ≥ |0.50|, p ≤ 0.05), including some known cachexia mediators/markers (LEP, MSTN, ALB) as well as novel proteins (e.g., LYVE1, C7, F2). Pathway, correlation, and upstream regulator analyses identified known (e.g., IL6, proteosome, mitochondrial dysfunction) and novel (e.g., Wnt signaling, NK cells) mechanisms. Overall, this study affords a basis for validation and provides insights into the processes underpinning cancer cachexia.

Graphical Abstract

1. Introduction

Cancer cachexia is a multifactorial paraneoplastic syndrome characterized by severe loss of muscle and fat, leading to overall weight loss [1,2,3]. Up to 85% of patients with pancreatic ductal adenocarcinoma (PDAC) are affected by this debilitating condition and up to 70% of newly diagnosed cases of pancreatic cancer present with weight loss, low muscle mass or clinically defined cachexia [4,5,6]. Cachexia is a powerful predictor of mortality in pancreatic cancer. Patients with cachexia exhibit shorter overall survival after surgery for PDAC [7] and after neoadjuvant chemotherapy [8]. As well, among patients treated with folfirinox for PDAC, cachexia phenotype associates with reduced survival among patients with PDAC, even when controlling for demographics, cancer site, stage, and treatment response [9]. Persistent weight loss and muscle depletion also associate with mortality in chemoradiation [10]. Moreover, cachexia (often conflated with malnutrition) per se is a considerable health burden. Unintentional weight loss associates with poor patient psychosocial well-being, self-esteem and relationships with others [11], and malnutrition/cachexia is a chief cause of hospitalization among U.S. patients with pancreatic cancer, with a 12-month cumulative hospitalization incidence of 23.0% [12]. This was the second greatest indication for non-tumor/pancreas related hospitalization after cytopenia (30.1%) and far greater than chemotherapy-related toxicity (0.7%). Related and contributing to cachexia, problems of nausea/vomiting and gastrointestinal motility comprised 20.8% of hospitalizations. Thus, cachexia contributes greatly to morbidity and mortality in pancreatic cancer.
While reduced food intake and absorption is a recognized contributor to cachexia in patients with pancreatic cancer, cachexia is an active, catabolic process characterized by ongoing inflammation [13]. Feeding of adequate calories does not maintain weight and weight loss often proceeds more rapidly than in conditions of starvation [14]. Moreover, pre-clinical models demonstrate that weight loss results from disordered metabolism due to host-tumor interactions, and not merely from reduced caloric intake [15,16,17,18,19,20]. While there is evidence for efficacy of specific molecular interventions in pre-clinical models e.g., [16,17,21,22,23,24,25], currently there are no FDA-approved, effective therapies for cancer cachexia [26]. This great unmet clinical need is due in part to lack of robust drug development tools, including biomarkers, as well as lack of consensus on appropriate clinical trial inclusion criteria and endpoints.
The consensus definition of cancer cachexia is weight loss greater than 5%, or weight loss greater than 2% in individuals with body-mass index [BMI] < 20 kg/m2 or with low skeletal muscle mass (sarcopenia) [1]. This definition has accelerated research in cachexia, but it is retrospective, relies upon prior knowledge of body weight or patient self-reporting, and does not discriminate stages/severity of cachexia. Other frameworks for identifying patients with cachexia include BMI, percentage weight loss, cachexia weight loss grade—a combination of BMI and history of weight loss, skeletal muscle index, and skeletal muscle quality or myosteatosis, often measured by radiodensity [3,27]. These metrics generally relate to toxicities and mortality in cancer and have been useful for stratifying risk.
Currently there are no validated cellular or molecular biomarkers of cancer cachexia, including no prognostic biomarkers to predict which patients will suffer from cachexia. If predictive biomarkers were established, cachexia risk might be detected during the pre-cachectic period when patients have not yet developed overt weight loss or tissue wasting. Intervention at this early stage might alter cachexia progression. Moreover, there are no validated biomarkers to stage cachexia severity at presentation or during progression of disease, hindering quantitative assessment of interventions. Finally, there are no prognostic markers of cachexia that might reveal patients who are likely to respond to therapy. With appropriate biomarkers, we would have the opportunity to identify, stratify, treat, and monitor patients earlier and more precisely than in current clinical trials, optimizing the potential for therapeutic benefit.
Identification of biomarkers also furthers understanding of mechanisms of cachexia. Preclinical models demonstrate that cachexia is driven by multiple biological pathways, particularly inflammatory cytokines and chemokines, but also growth factors, neuropeptides, lipids, miRNAs, and exosomes. All these pathways ultimately signal on multiple organ systems, including the central nervous system, hematopoietic system, liver, gut, heart and tumor, to produce changes in behavior, appetite, energy expenditure, absorption, metabolism, immunity and inflammation that ultimately produce adipose lipolysis and skeletal muscle catabolism [22]. Discovering how these interactions are mediated requires discovery approaches in patients.
To address both discovery of potential biomarkers and discovery of molecular mechanisms, we carried out an aptamer-based proteomics analysis of plasma from patients with pancreatic ductal adenocarcinoma, a tumor type associated with high rates and severity of cachexia. Here we identify (i) differentially expressed proteins based on cancer stage (local or metastatic) vs. controls, (ii) serum proteins that correlate with cachexia-related variables, as determined by the consensus definition [1], cancer weight loss grade [3], percentage weight loss and skeletal muscle index, (iii) the ontological functions, canonical pathways and upstream regulators associated with the cachexia-associated proteins, and (iv) protein co-expression networks that uncover novel pathways in PDAC cachexia. This approach demonstrates little overlap between cancer-associated and cachexia-associated proteins and identified several known cachexia-associated proteins and pathways as well as many new ones. Overall, our data provide candidate proteins and pathways for further validation and functional analysis in PDAC cachexia.

2. Results

2.1. Patient Demographics/Clinical Characteristics and SOMAscan Quality Control Results

We studied plasma from 30 patients with confirmed pancreatic ductal adenocarcinoma (PDAC) and 11 controls. Age was significantly different between PDAC (67.1 ± 11.4 years) and controls (49.2 ± 14.7). PDAC patients were nearly evenly split for sex, while controls were eight females and three males. Given these imbalances between groups, values were statistically adjusted for age and sex for all cachexia-related comparisons. Markers of wasting or cachexia were evident in the PDAC group vs. controls. Body mass index (BMI), weight loss, cancer weight loss grade (CWLG) [3], skeletal muscle index (SMI), and sarcopenia status [27] were all significantly different between PDAC patients and controls, although skeletal muscle radio-density (SMD) and total adipose index (TAI) were not. Overall, among patients with PDAC there were no differences between sexes except that men had greater TAI (p = 0.0033). Average weight loss among patients with PDAC was 11.9 ± 8.1%; this is considerably more severe than the clinical definition of cachexia (>5% weight loss) and more than the 8% cutoff associated with low survival in patients presenting with lung or gastrointestinal cancers [27]. Mean skeletal muscle index for women with PDAC was 39.6 ± 4.2 cm2/m2, also considerably lower than the threshold of 41 cm2/m2 associated with low survival in women [27]. Average skeletal muscle density was at or below thresholds associated with mortality (less than 41 for males and 33 for females) for both controls and patients with PDAC. The clinical characteristics are described in Table 1.

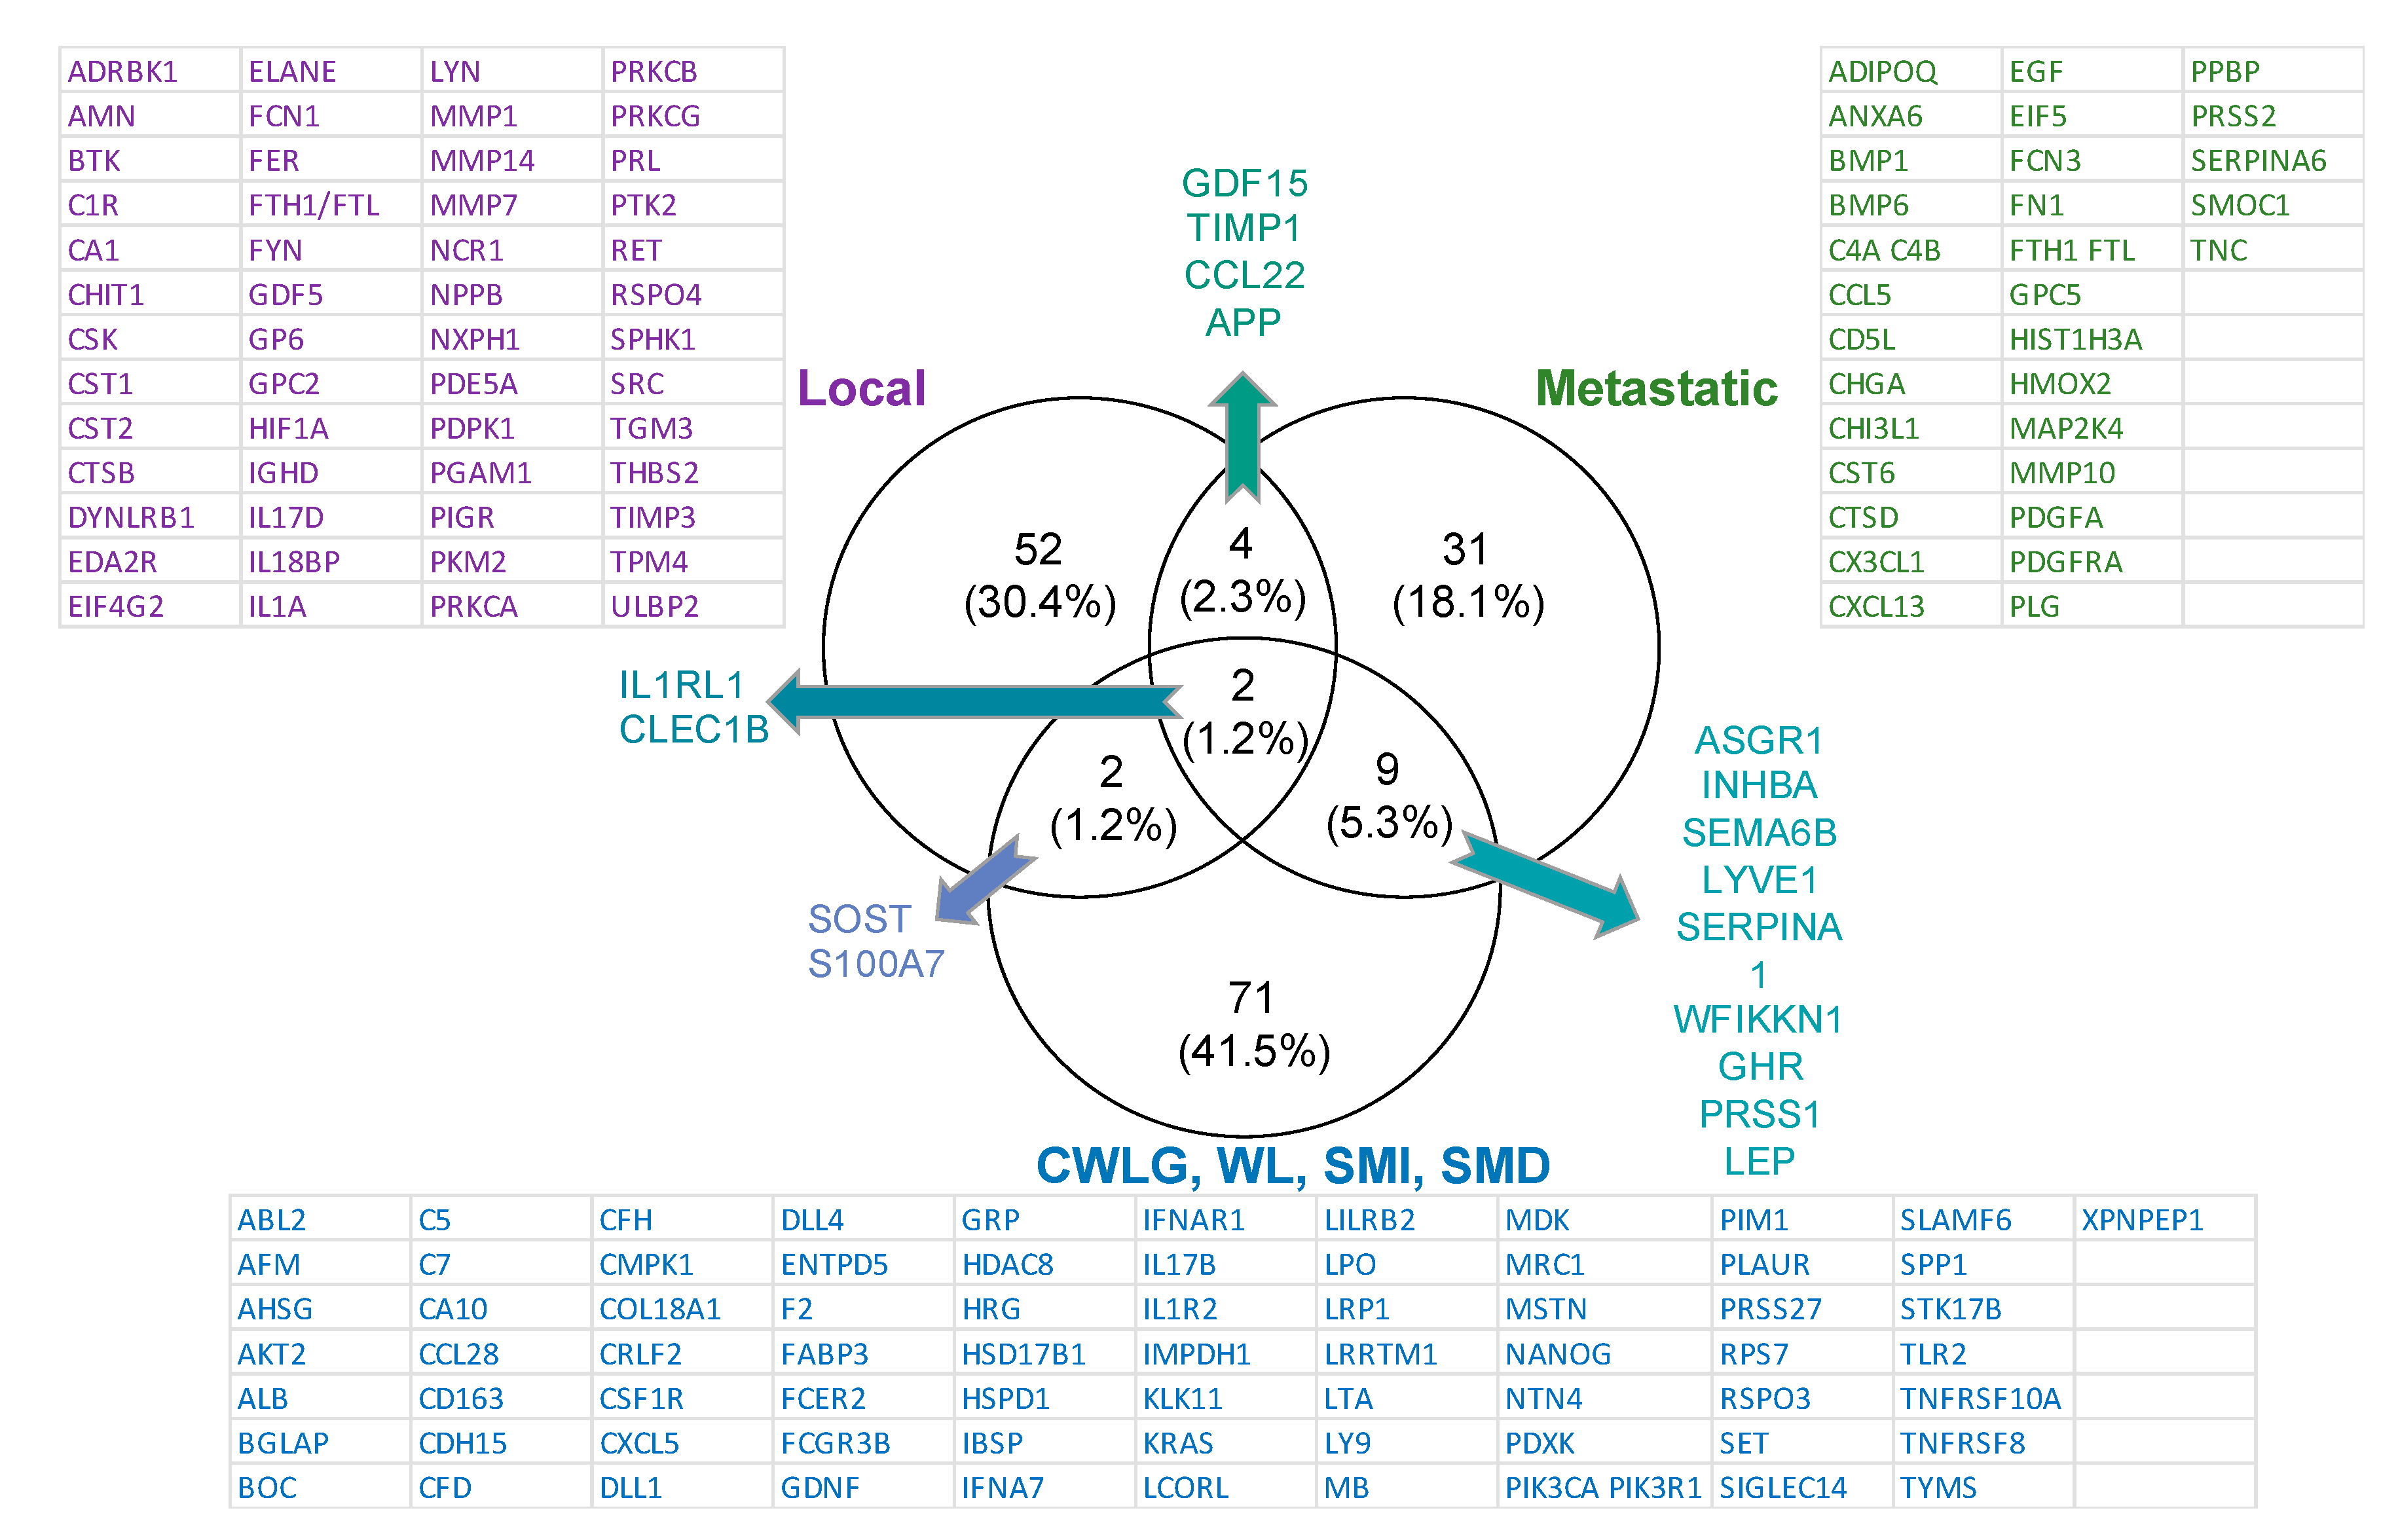
2.2. SOMAscan Quality Control and Results by Cancer Stage

SOMAscan is an aptamer-based assay that can measure 1310 proteins with high specificity and sensitivity [28]. After quality control and other pre-processing steps, 16 proteins did not satisfy the threshold values. Thus, 1294 proteins were subjected to quantile normalization and used for downstream analysis. We compared cancer patients to non-cancer controls by cancer stage—local and metastatic—and report all differences with fold change (FC) ≥ |1.5|, p < 0.05 (Figure 1). In all, 60 proteins were differentially present in patients with local/locally advanced PDAC vs. controls (Table S1), and 46 proteins in patients with metastatic PDAC vs. controls (Table S2). Among the proteins differentially present in cancer vs. control were six common to both local and metastatic PDAC: Up—GDF15, TIMP1, and IL1RL1; Down—CCL22, APP, and CLEC1B (Figure 2).
Ingenuity pathway analysis of proteins differentially present in local PDAC vs. control (Z-score ≥ |2.0|) identified the canonical pathways IL-15 Production, Insulin Secretion Signaling, PI3K Signaling in B Lymphocytes, PDGF Signaling, and Reelin Signaling in Neurons and the upstream regulators SP1 (Z = −2.214, p = 1.38 × 10⁻¹¹) and STAT3 (Z = 2.182, p = 2.99 × 10⁻⁵). Disease and biological functions analysis returned annotations related to increased cellular and organismal death and decreased proliferation and movement of blood and tumor cells. In the comparison of metastatic PDAC vs. control, there were no canonical pathways with Z-score ≥ |2.0|, although there were many p-value significant pathways. Upstream regulators of these proteins were predicted to include HIF1a (−2.000, p = 1.94 × 10⁻⁶), EGF (2.052, p = 9.61 × 10⁻⁷), EGFR (2.102, p = 4.35 × 10⁻⁴), EZH2 (2.200, p = 2.76 × 10⁻⁷). Disease and biofunctional pathways generally related to inhibition of cell signaling and movement of blood and tumor cells. These generally non-overlapping results suggest that mechanisms and manifestations of cancer in peripheral blood could be quite different by cancer stage. The complete lists of pathways are available in Tables S3 and S4.

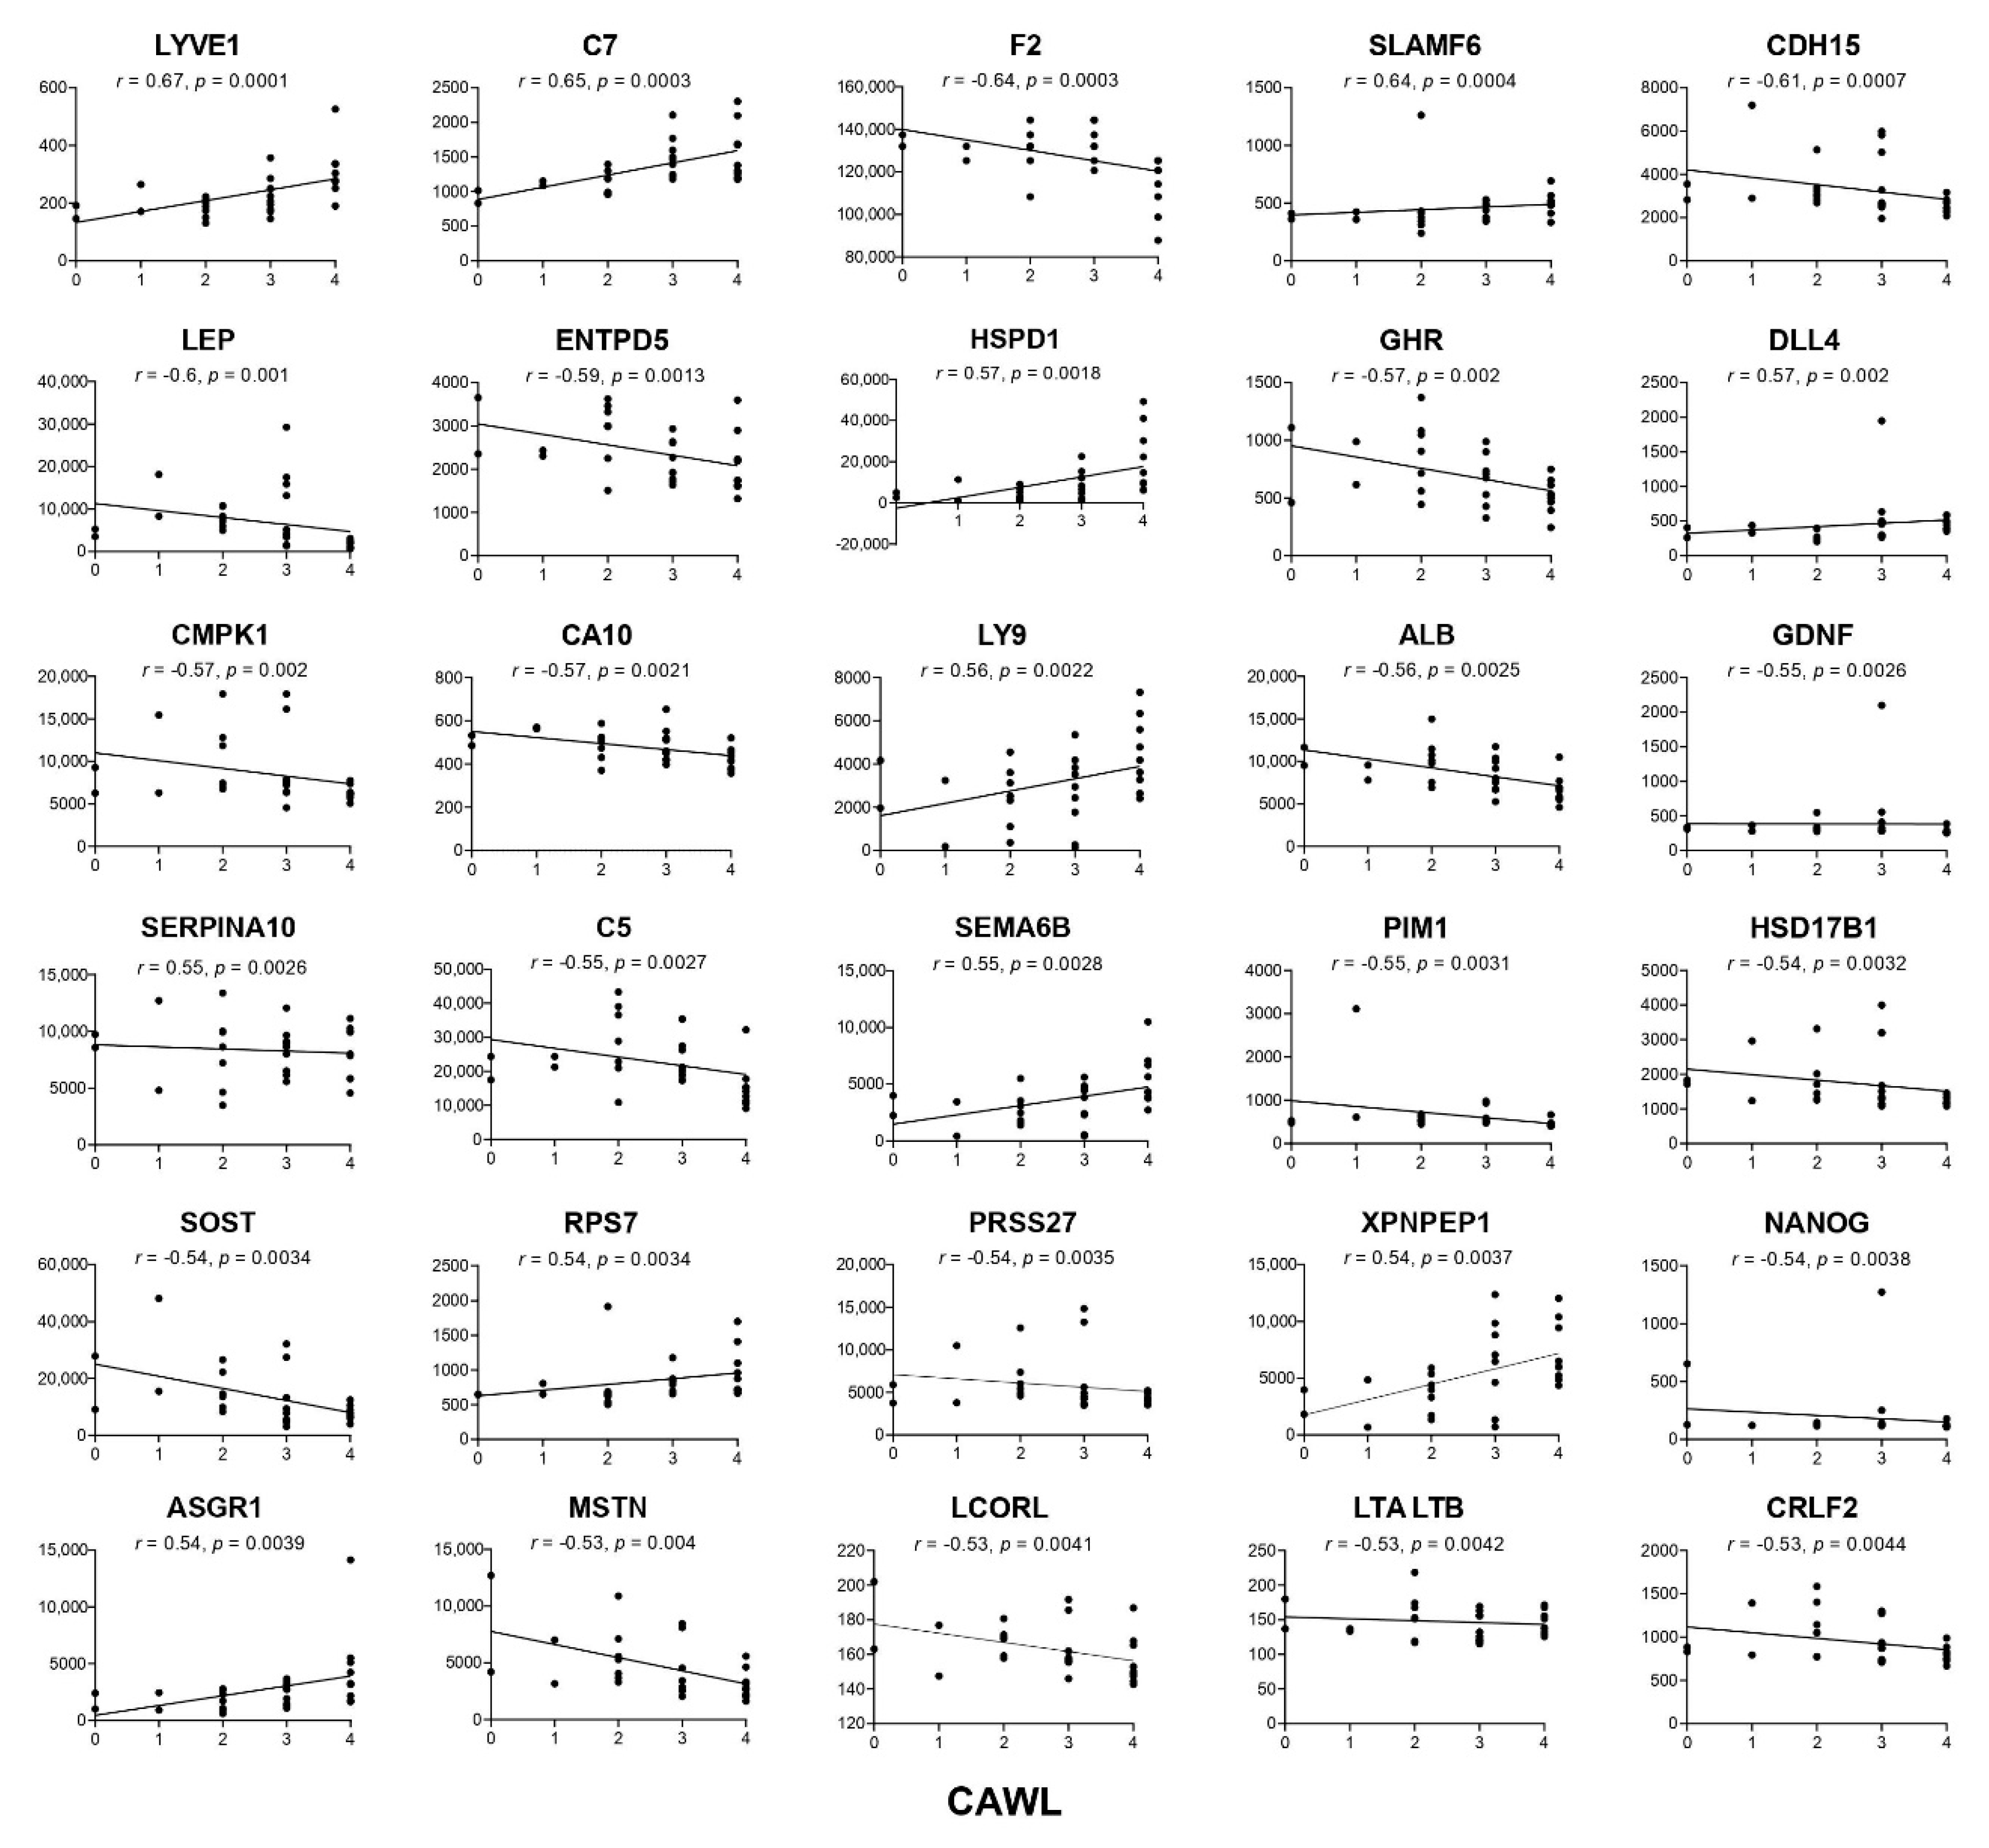
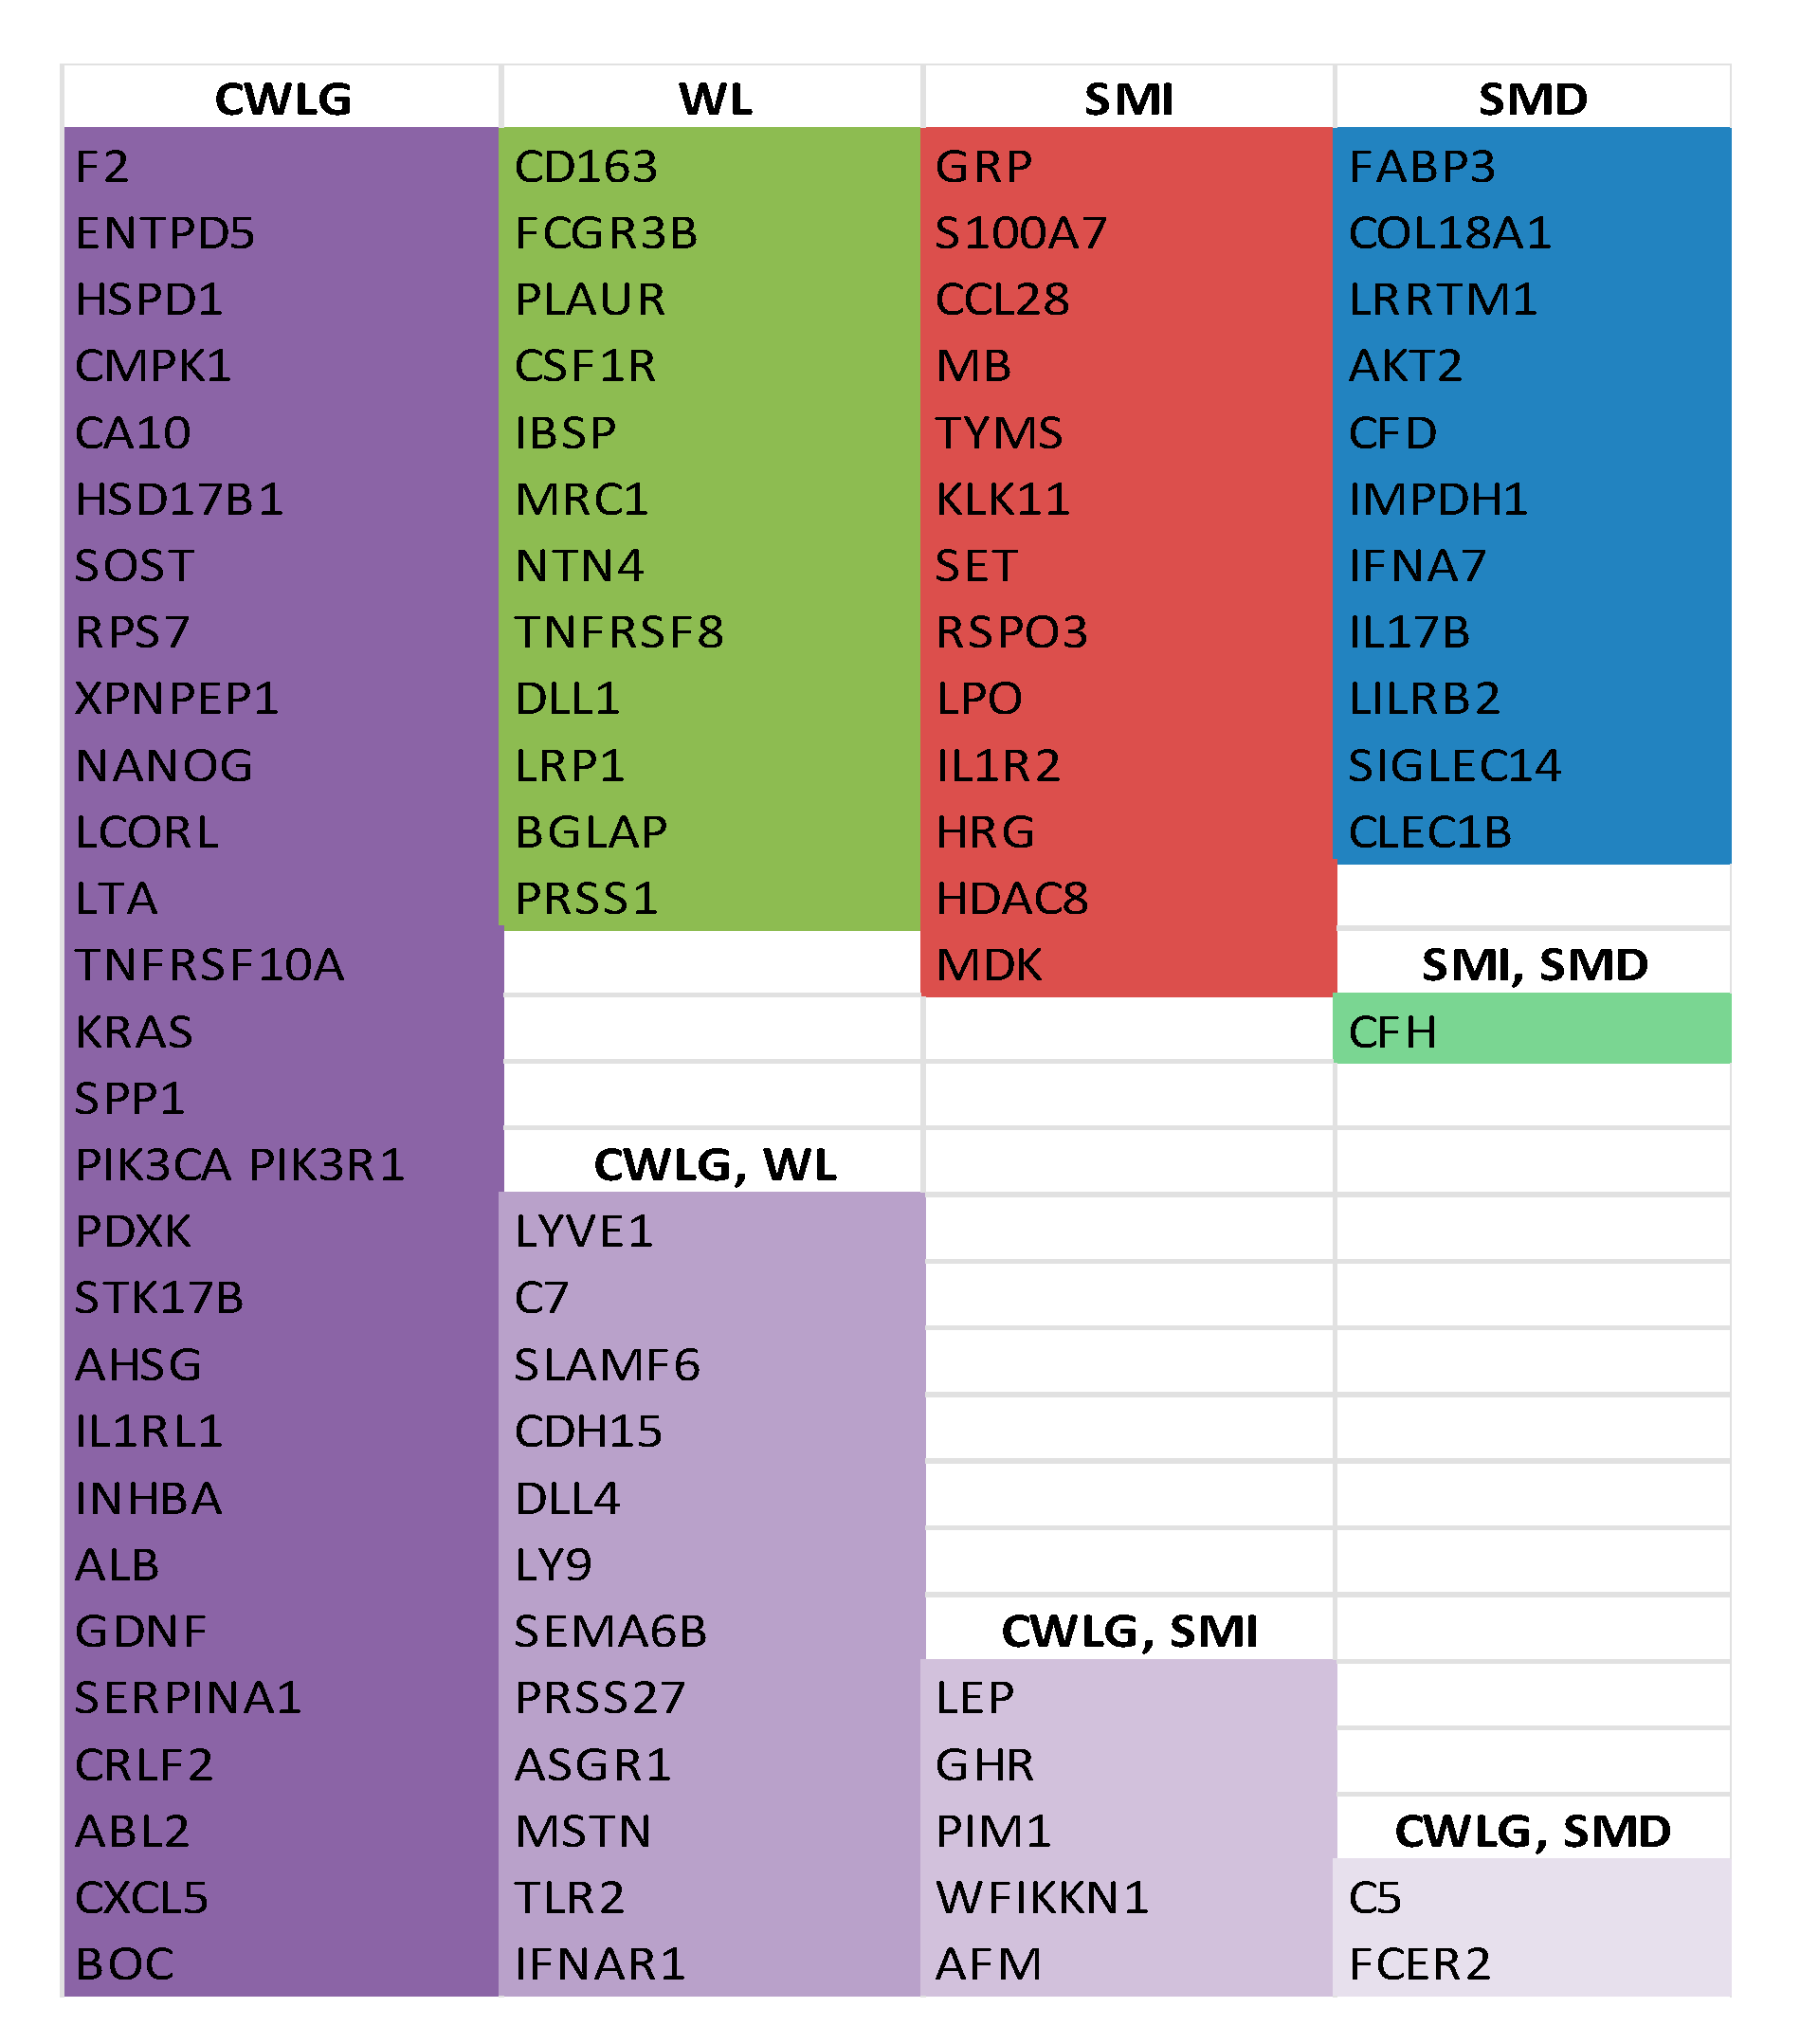
Proteins Associated with Clinical Variables of Cachexia

To identify markers of cachexia, we restricted our analysis to patients with PDAC and compared those meeting a general definition of cachexia, i.e., weight loss of at least 5% during the prior 6 months (n = 23) to those with less than 5% or no weight loss (n = 6). In this analysis, 67 proteins were differentially present with FC ≥ |1.5|, and unadjusted p ≤ 0.05 (Table S5). Comparing this list of cachexia-specific proteins to stage-specific proteins only four were also found to be present in local PDAC—C1R, PRKCG, ELANE, and SOST—and all were oppositely regulated between conditions. In contrast, the 4 proteins common between metastatic PDAC and cachexia, SERPINA6, PDGFRA, PRSS2, and PRSS1, were all changed in the same direction (Figure 1). These data indicate that while cachexia typically associates to the more advanced stage, here cancer stage and cachexia status appear to be largely separable at a molecular level.
Given the disproportionately small number of no-cachexia controls in our dataset (and given that weight loss of even <5% could be both clinically meaningful and indicative of cachexia onset), we next compared blood proteins in cancer patients to cachexia-relevant variables that have been shown to correlate with cancer mortality. These include cancer weight loss grade (CWLG), percentage weight loss, skeletal muscle index (SMI), and skeletal muscle density (SMD). Proteins with correlation values r ≥ |0.5| and unadjusted p ≤ 0.05 were considered for interpretation [29].
Of the 47 proteins associated with CWLG, 28 were negatively correlated and 19 proteins were positively correlated (the top 30 are shown in Figure 3 and the entire list in Table 2). LYVE1, a homolog of CD44, was identified as the top correlated protein with CWLG. Other inflammation-related proteins such as C7, lymphocyte surface antigen LY9, IFNAR1, and IL1RL1 also correlated positively with CWLG, while C5 and F2 correlated negatively. Proteins implicated as mediators or biomarkers of cachexia, including MSTN, INHBA and ALB, were also identified. PH related protein CA10 and stem cell marker NANOG were negatively correlated with CWLG.
Among the 24 proteins correlated with percentage weight loss, there were 12 which overlapped with CWLG (Figure 4). 19 proteins rose with increasing weight loss, while five fell with weight loss. Complement C7 showed the tightest relationship (r = 0.84, p = 2.99 × 10⁻⁸), rising steeply with weight loss. Other pro-inflammatory markers included CD163 (r = 0.67, p = 0.0001) and CSF1R (r = 0.53, p = 0.0041), indicating inflammation. Interestingly, IBSP (r = 0.53, p = 0.0047), an important structural protein in bone matrix and BGLAP (r = −0.54, p = 0.0039), a bone remodeling protein, correlated with percent weight change. Evidence from animal studies suggest that, along with muscle and fat loss, bone loss and reduced bone strength was also observed in cachexia [30].
We also determined proteins correlated with body composition, including skeletal muscle index (SMI), skeletal muscle density (SMD), and total adipose index (TAI). Low skeletal muscle index (myopenia) is correlated with cancer mortality. The top correlated protein with SMI was gastrin releasing peptide, GRP. Other proteins correlated with SMI include acetylation proteins SET (r = 0.56, p = 0.0028) and HDAC8 (r = 0.51, p = 0.0076), inflammatory proteins CFH (r = 0.60, p = 0.0012) and IL1R2 (r = 0.53, p = 0.0054) and calcium binding protein S100A7 (r = 0.62, p = 0.0007). The list of proteins correlated with SMI is presented in Table 3.
For skeletal muscle density (SMD), the largest correlation was for FABP3, a fatty acid binding protein involved in fatty acid transport, which increased with decreasing density, likely a reflection of increasing myosteatosis. Proteins associated with inflammation such as CFH (r = −0.58, p = 0.0018), C5 (r = −0.56, p = 0.0031), IFNA7 (r = −0.55, p = 0.0034), IL17B (r = 0.53, p = 0.0051) and FCER2 (r = −0.51, p = 0.0073) were also associated with SMD. The complete list of proteins correlated with SMD is reported in Table 4. The list of unique and common proteins identified across the cachexia indices is given in Figure 5.
Total adipose index (TAI) has not been shown to be predictive of mortality in cancer and the role of adipose in cachexia is unclear. Nevertheless, we correlated blood proteins vs. TAI. Leptin (LEP, r = 0.85, p = 3.13 × 10⁻⁸), an important molecule in energy homeostasis [31] was the top molecule positively associated with TAI. SFRP1 (r = −0.53, p = 0.006), a protein associated with increased adiposity, and lipid-associated proteins APOE (r = 0.5, p = 0.009) and FABP3 (r = 0.67, p = 0.0002) were also positively associated with TAI. Other proteins include C5 (r = 0.69, p = 0.0001), C1S (r = 0.65, p = 0.0003), F9 (r = 0.53, p = 0.006), CCL28 (r = −0.68, p = 0.0002), PTN (r = −0.52, p = 0.007). The complete list of proteins correlated with TAI is presented in Table 5.
Given that our primary goal was to identify cachexia-related biomarkers and not tumor markers per se, we compared proteins differentially present by cancer presence and cancer stage with all those that correlated with the cachexia-relevant variables of CWLG, percentage weight loss, SMI or SMD (Figure 2). This approach enabled identification of markers that might be common to cancer stage and cachexia, as well as markers unique to each condition. Two proteins were common among all comparisons, IL1RL1 and CLEC1B. Two others, SOST and S100A7 were common between local PDAC and cachexia-relevant measures. Metastatic PDAC and cachexia-relevant measures shared 9 unique proteins, ASGR1, INHBA, SEMA6, LYVE1, SERPINA1, WFIKKN1, GHR, PRSS1 and LEP. Given that cachexia severity and frequency increases in advanced disease, such common markers could relate to either metastasis or cachexia or both.

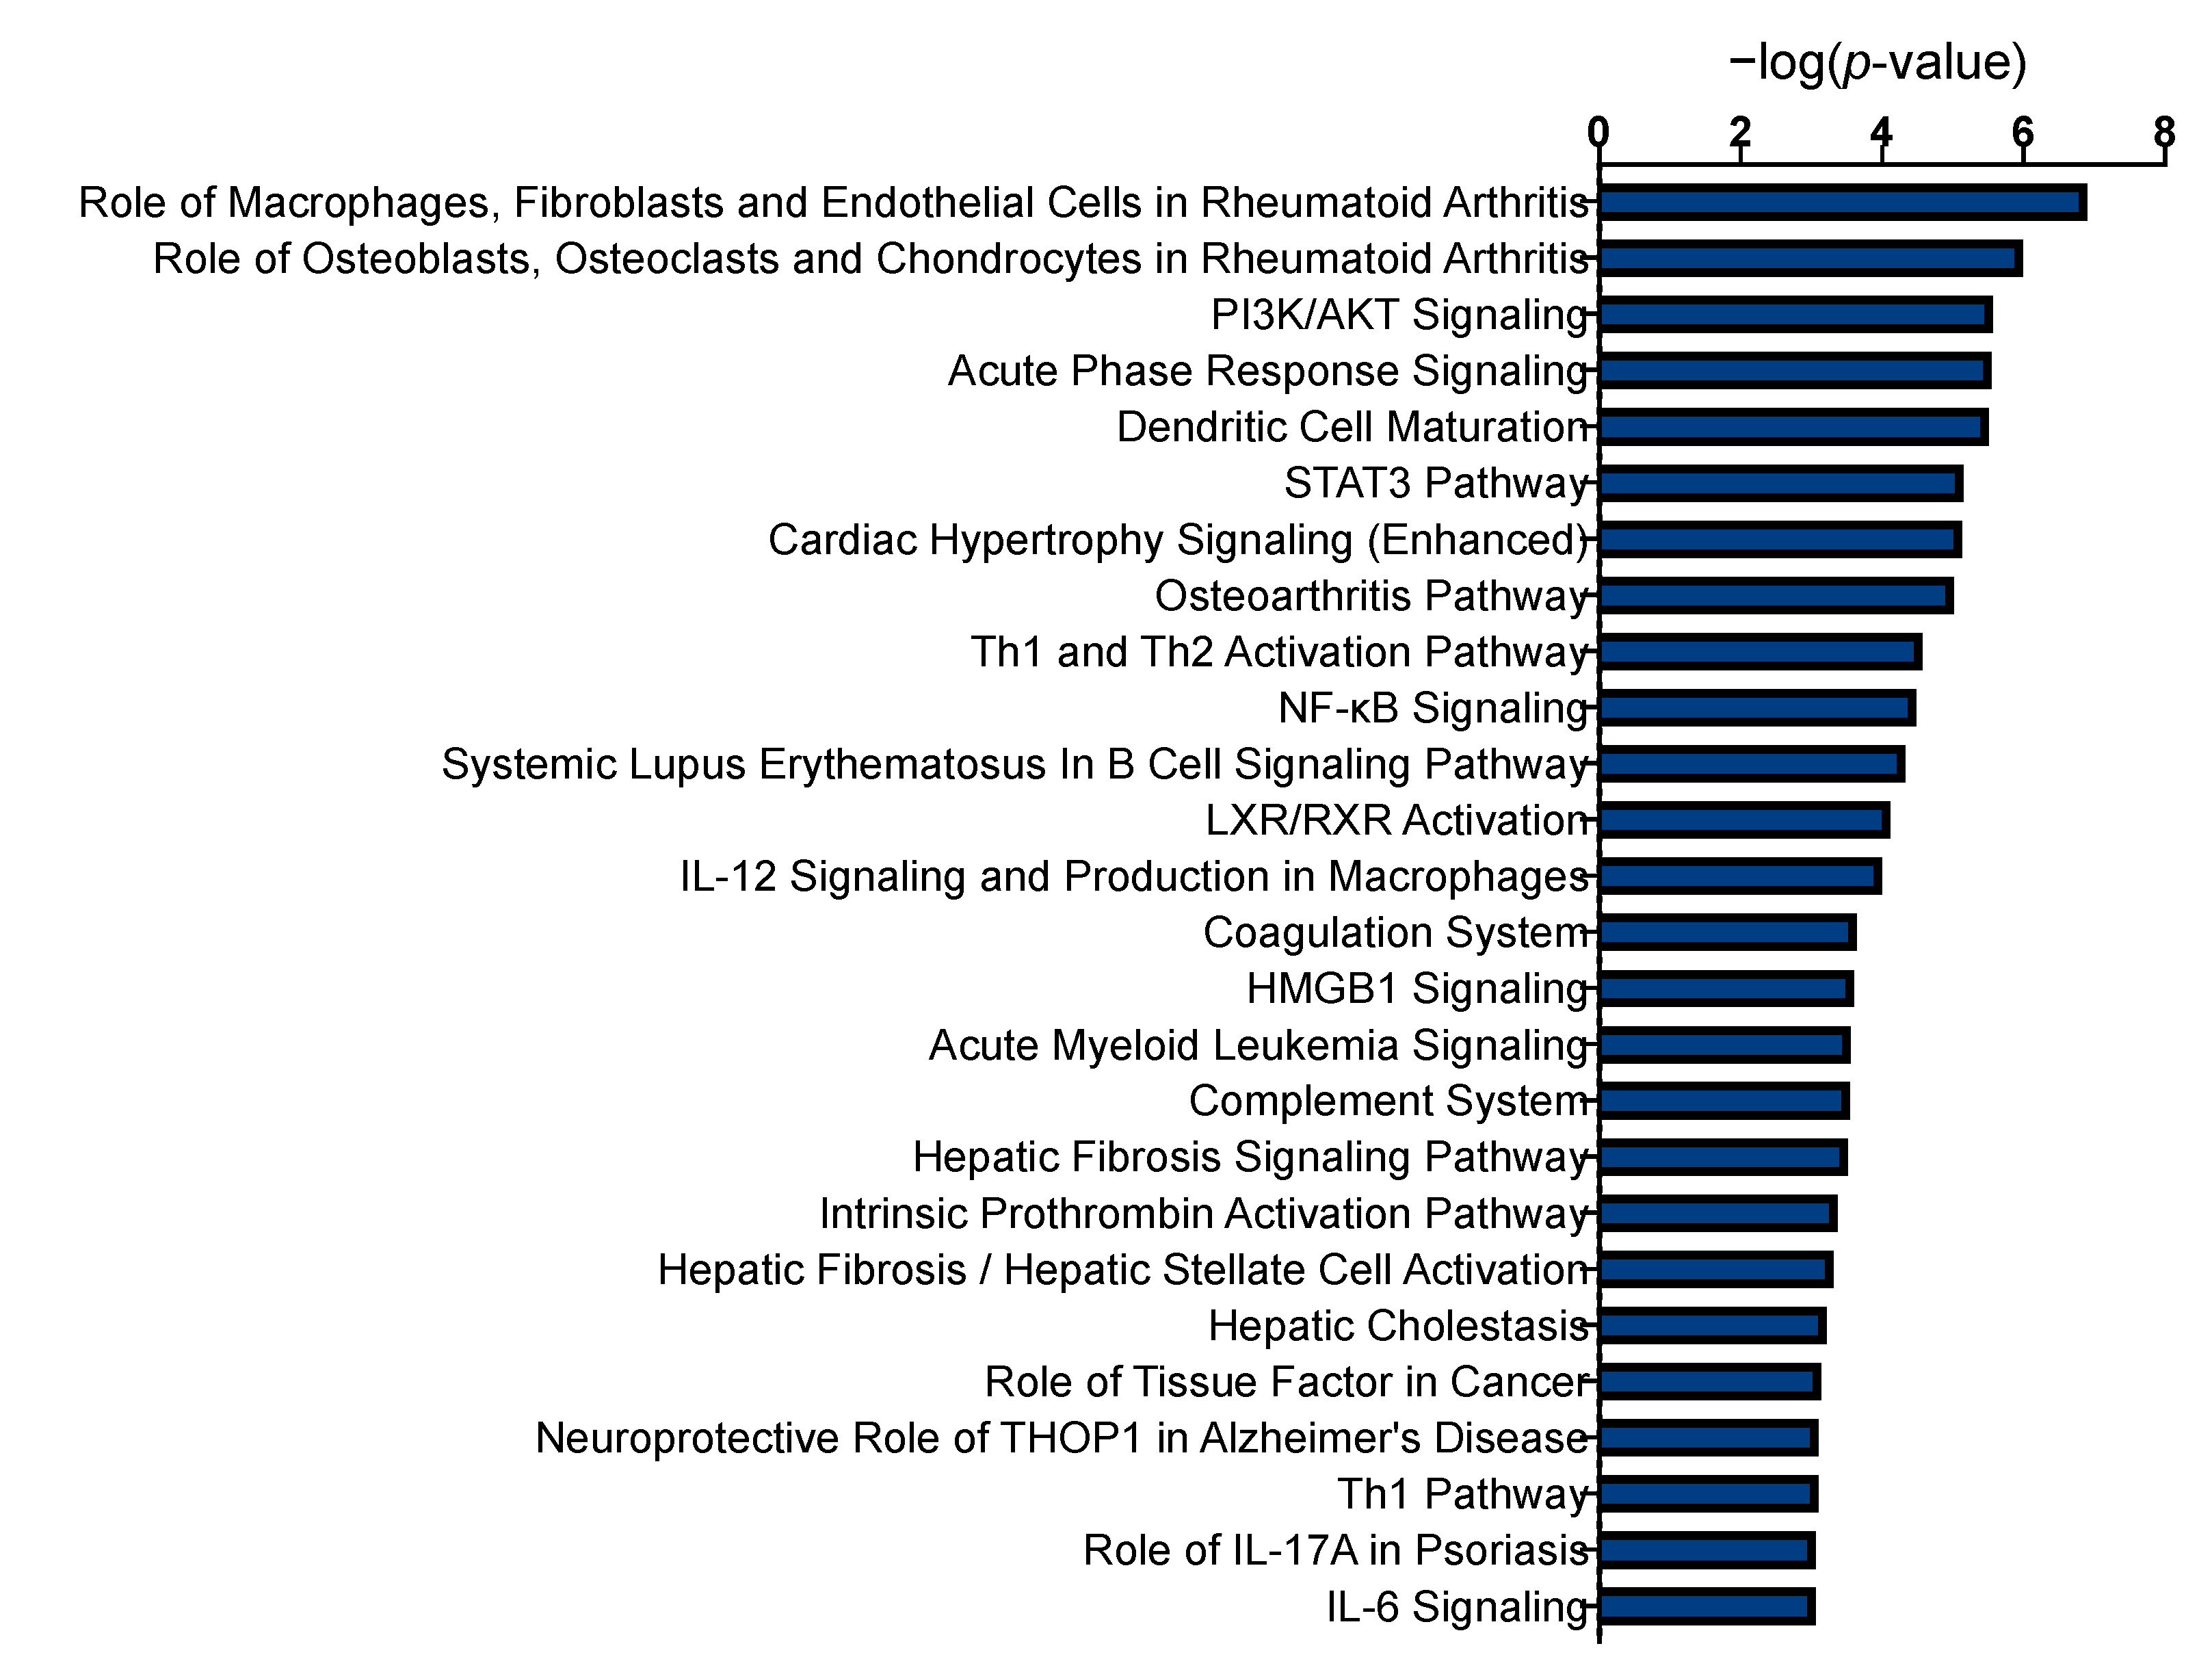
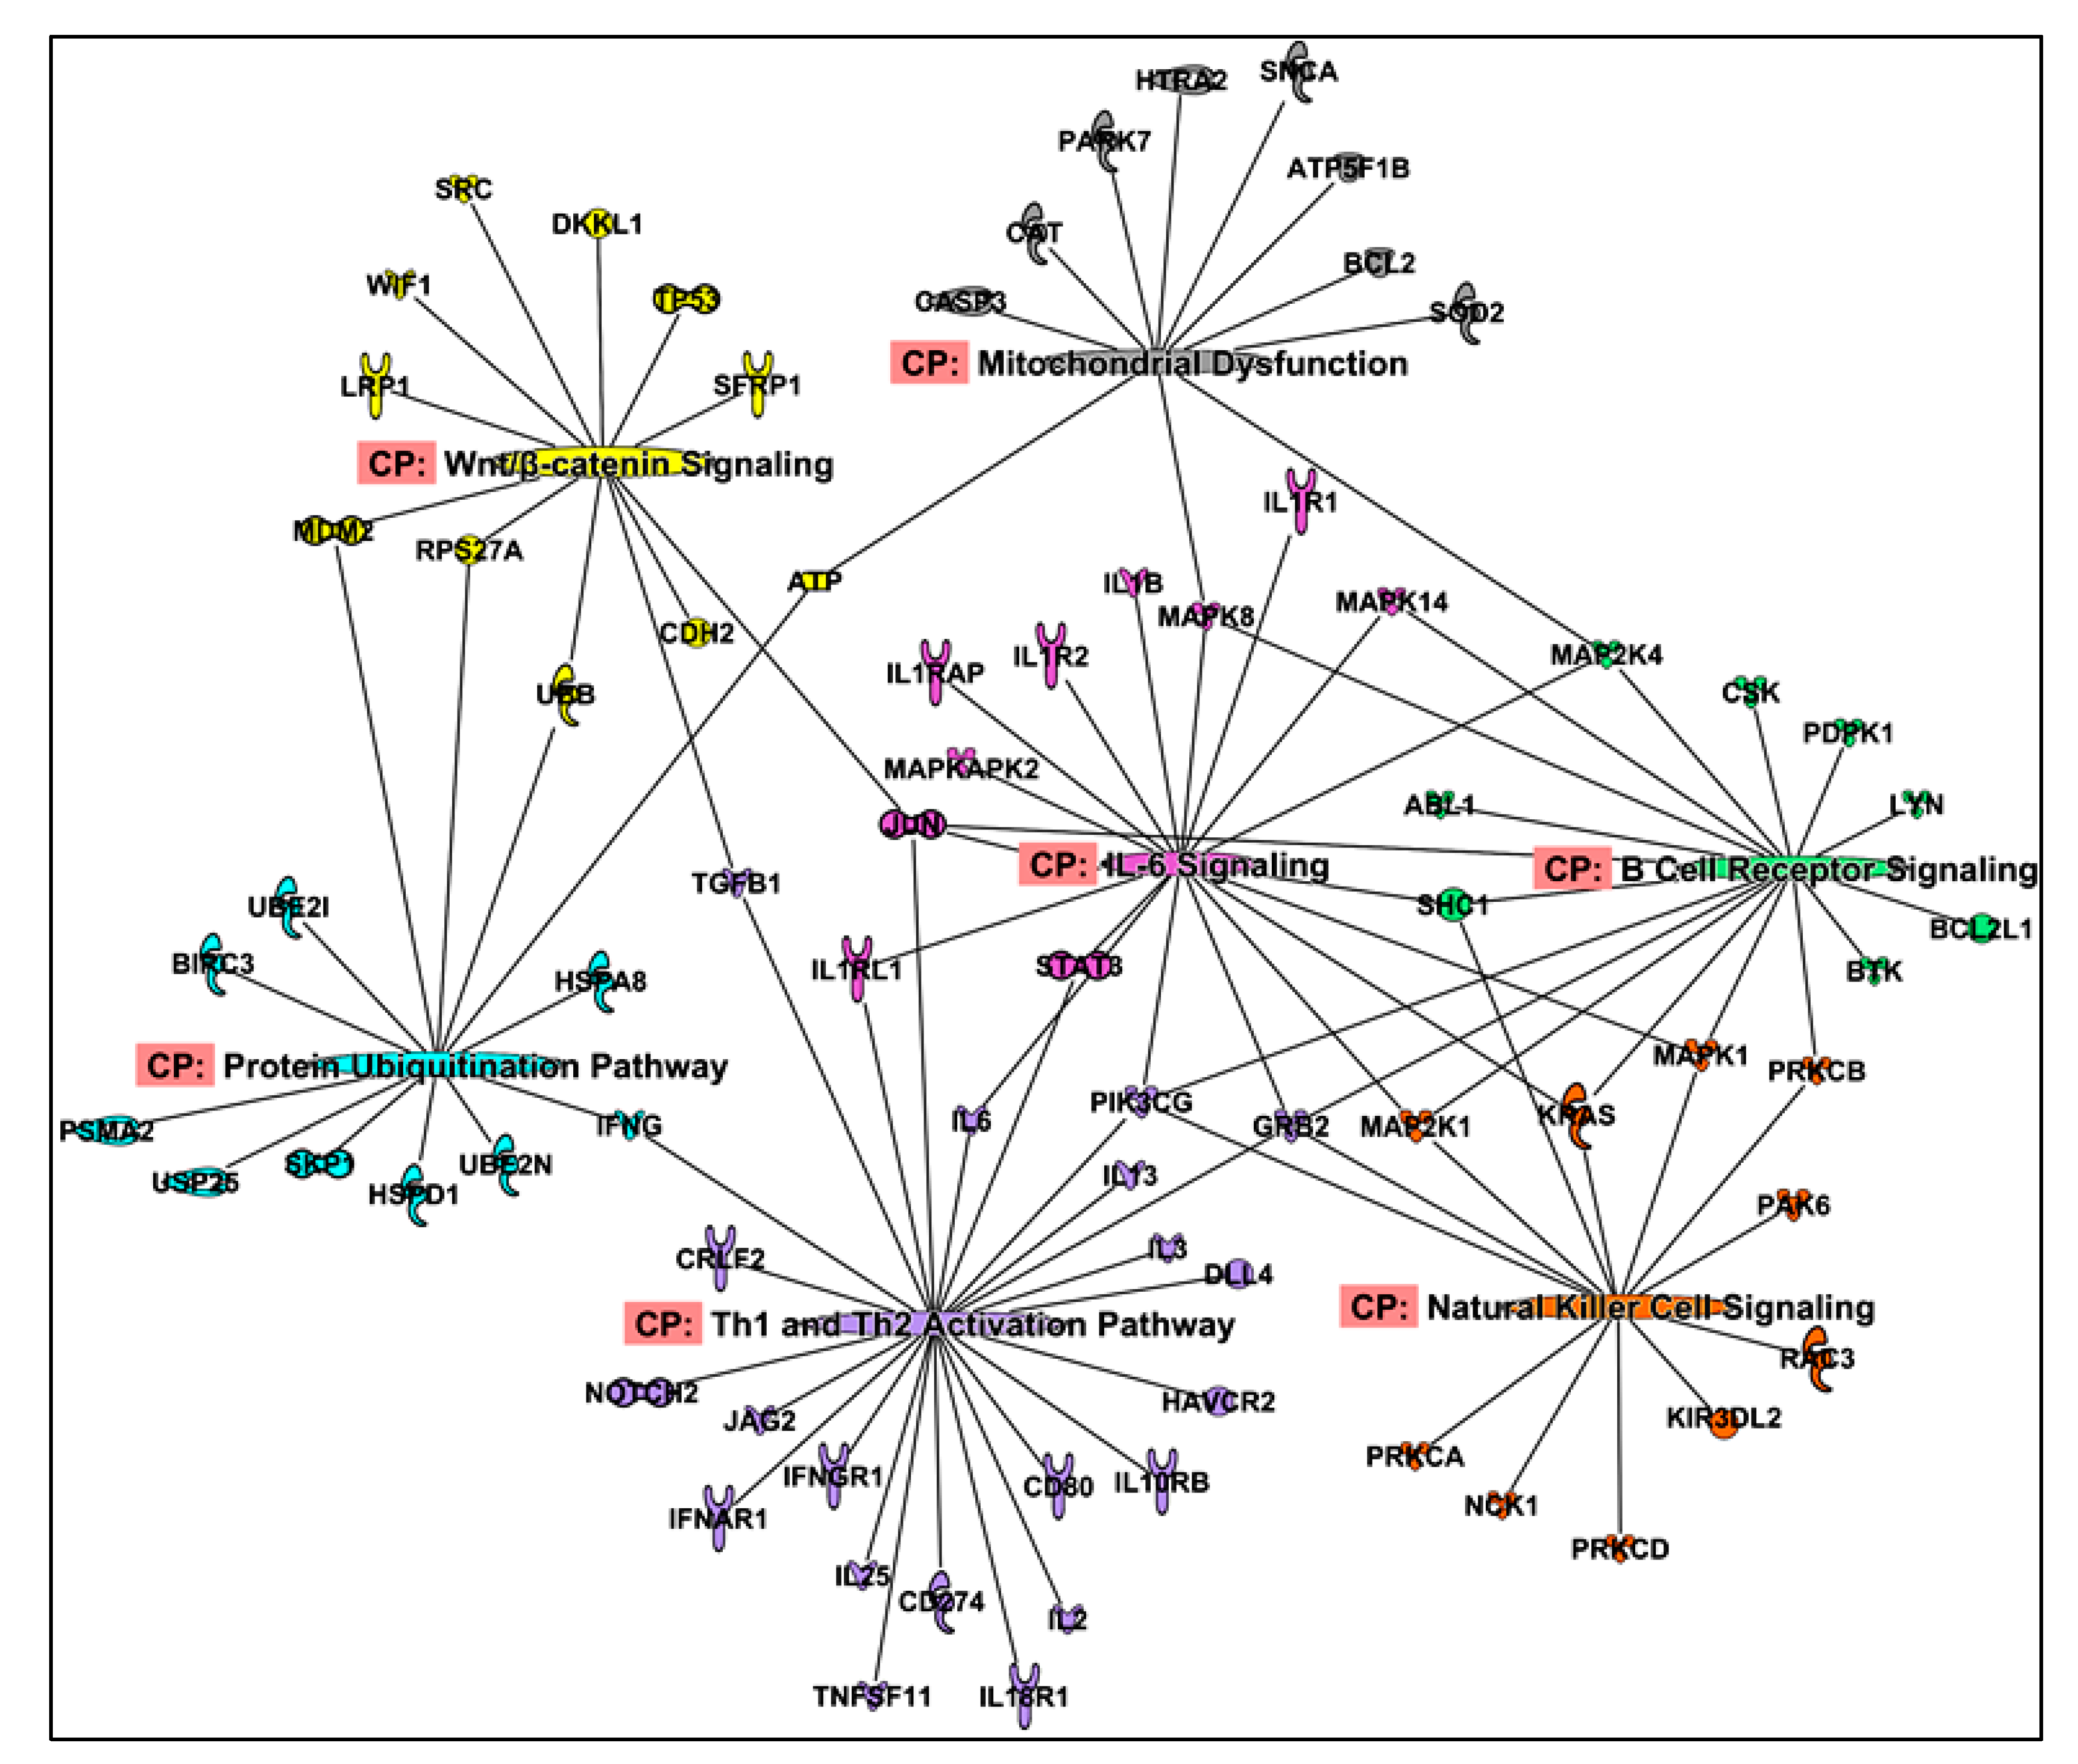
2.3. Functional Enrichment of Proteins

Functional enrichment analysis was performed on the proteins that correlated with CWLG, weight loss, SMI, SMD. Ingenuity pathway analysis identified inflammatory pathways in arthritis along with classic cachexia pathways, including PI3K/Akt signaling, acute phase response signaling, STAT3 pathway, NF-kB signaling, coagulation and complement system, and IL-6 signaling pathways (Figure 6). Pathways related to dendritic cell maturation, cardiac hypertrophy and osteoarthritis were also revealed.

2.4. Upstream Regulators

Upstream regulators were predicted from all proteins that correlated with CWLG, weight loss, SMI, and SMD. Predicted regulators include transforming growth factor-beta family members TGF-b, Myostatin, and GDF-11, cytokines including Interleukins (IL) IL-1alpha, IL-1beta, IL-2, IL-4, IL-6, IL-10, IL-13, and leukemia inhibitory factor (LIF), interferon-gamma, tumor necrosis factor (TNF), CSF2, EGF, FGF2, and the endogenous hormones tretinoin, hydrocortisone (cortisol), and beta-estradiol (Figure 7). Several of these upstream regulators such as IL-1 alpha, IL4, IL6, LIF, TNF have known causal roles in cachexia validated using experimental models [13,32,33,34]. The complete list of upstream regulators is given in Table S6.

2.5. Protein Co-Expression Analysis

To identify novel pathways that could potentially be associated with cachexia, we performed a protein co-expression analysis. All 1294 proteins were correlated against each other using Spearman’s correlations. Correlation pairs with r value of >0.6 and p < 0.05 were considered for the analysis. As CWLG had the highest number of proteins and some proteins associated with SMI, SMD and TAI were also found in CWLG, all the CWLG proteins and their correlated pairs were considered to identify the pathways involved in PDAC cachexia. We identified 1498 correlated pairs for CWLG associated proteins. The non-redundant protein list was imported to IPA and the filters used in IPA were: in prediction category, “experimentally validated and highly predicted pathways” were selected; in the tissue selections, we used “immune cells, skeletal muscle and adipose tissue” to identify canonical pathways. Pathways with p < 0.05 included several previously implicated in cachexia including IL-6 signaling, protein ubiquitination, and mitochondrial dysfunction, along with others less explored in cachexia, including B cell receptor signaling, Th1 and Th2 activation pathway, natural killer cell signaling, Wnt/β- catenin signaling, and PTEN signaling (Figure 8). Other pathways including acute phase response, glucocorticoid receptor, STAT3, and BMP signaling pathways were also identified. The complete list of significant canonical pathways is given in Table S7.

3. Discussion

Using SOMAscan, an aptamer-based assay, we identified potential circulating protein biomarkers for PDAC cancer stages and cachexia. While studies have identified circulating biomarkers for either pancreatic cancer or cachexia independently, it has never been done simultaneously, a strength of this study. Other strengths of the study include the unbiased discovery approach, the comparison of cancer patients vs. controls, the use of both the canonical, categorical definition of cachexia and also ordinal and continuous measures of CWLG, body weight loss, SMI, and SMD. Weaknesses include a lack of validation cohort and modest sample size, which are appropriate for discovery studies but insufficient for establishing predictive value of any one protein or group of proteins for predicting cachexia status. Despite these limitations, our study revealed that proteins differentially present for local PDAC and metastatic PDAC vs. controls were predominantly non-overlapping indicating that distinct mechanisms may be involved in disease progression. Ultimately such distinctions in circulation may aid in developing stage specific markers.
Although the primary motivation for our study was to find cachexia-specific proteins, we also found proteins present in all conditions and many exclusive to cancer stage. Among the proteins found in all conditions were IL1RL1 and CLEC1B. IL1RL1, also known as IL-33R/ST2, has been linked to tumor growth and progression in mouse models of pancreatic cancer [35]. As well, IL-33 and the decoy receptor soluble IL1RL1/ST2 as measured by ELISA associates with poor survival in patients with advanced PDAC undergoing chemotherapy [36]. CLEC1B has been identified as a potential biomarker of hepatocellular carcinoma [37,38], but to date there are no data in PDAC. Four additional proteins were present in PDAC but did not associate to cachexia status, including GDF15, TIMP1, CCL22, and APP. GDF15 is known to regulate nausea and vomiting and its inhibition slows cachexia in preclinical cancer models [21,25,39]. However, in our small study GDF15 associated with PDAC but not with any metric of cachexia. TIMP1 is reported to be elevated in patients with PDAC [40], but a prior study of TIMP1 measured by ELISA revealed only a modest Spearman correlation with weight loss (r = 0.304, p = 0.017) [41] consistent with our data. CCL22 correlates with a systemic inflammation response index that predicts survival of patients with PDAC [42], and APP has been linked to tumor growth in experimental cancers, including PDAC [43]. Our confirmatory findings suggest further analysis of these and other cancer stage-specific proteins.
We chose two methods of identifying cachexia-related proteins—the dichotomous approach of <5% vs. >5% weight loss, which resulted in a small group of “no cachexia” patients who might have early cachexia, and correlation analysis with the ordinal or continuous variables of CWLG, weight loss, SMI and SMD. We felt the latter approach to be more discriminating even given our relatively small sample size and thus limit our pathway analysis and discussion to these proteins. Many proteins correlated with CWLG were also correlated with SMI, SMD and TAI. This is expected because both muscle and fat generally decline with increasing CWLG.
Two proteins were common between local PDAC and cachexia, SOST and S100A7. To our knowledge, this is the first report of an association between the WNT inhibitor SOST, or sclerostin, and pancreatic cancer. SOST reduces osteoblastic bone formation and SOST inhibitors are approved for use in women with high risk of osteoporotic fracture. SOST levels by Somascan associate strongly with age [44,45], however in our findings SOST levels declined with increased weight loss severity CWLG (r = −0.54, p = 0.034), even after adjusting for age. Further investigation of SOST might be warranted. S100A7 or psoriasin was increased in local PDAC but correlated positively with SMI; thus, despite some evidence of association with cancer severity, S100A7 appears uninformative in this context.
Among the nine common proteins between the metastatic PDAC and cachexia-associated discoveries are several with reported roles in both PDAC progression and cachexia. These include INHBA (Activin A) and WFIKKN, an activin inhibitor also known as GASP-2. Activin A associates with PDAC stage and cachexia severity in other studies using different methods and Activin inhibition slows muscle wasting and lengthens survival in experimental models of PDAC [16,46], while GASP-2 over-expression results in hypermuscularity [47]. The anti-activin receptor antibody bimagrumab (BYM 338) has been tested in advanced lung and pancreatic cancer (clinicaltrials.gov identifier NCT01433263), although results have not been published in the literature. Here we observed positive association of INHBA with CWLG (r = 0.50, p = 0.0077), and negative association of WFIKKN (r = −0.52, p = 0.0068, consistent with increased Activin activity as a mechanism of cachexia. LYVE1 is reported to be elevated in urine of patients with PDAC, enough to be one of three biomarkers to stratify cancer risk [48], with no data on cachexia. PRSS1 aka trypsin/trypsinogen mutations increase risk of chronic pancreatitis and pancreatic cancer [49] and its pathological activation promotes neoplasia [50]. The ratio of PRSS1 and its inhibitor SERPINA1 or alpha-1-antitrypsin is elevated in patients with PDAC [51], and SERPINA1 deficiency is associated with pancreatitis and cachexia phenotypes [52]. The 3.664 reduction in LEP observed in patients with metastatic PDAC, its negative association with CWLG (r = −0.59, p = 0.0010) and its positive association with TAI (r = 0.85, p = 3.13 × 10⁻⁸) all suggest that LEP tracks with adiposity in PDAC and cachexia. Studies are lacking for the remaining two common proteins, SEMA6B and GHR, in PDAC and cachexia. Given the high relevance of the other identified proteins, however, perhaps they require a careful look.
Among the remainder of cachexia-associated proteins, we find some consistencies with the literature, including a negative association of ALB with CWLG (r = −0.56, p = 0.0025), consistent with inflammation and albumin as a negative acute phase response protein, and a negative association of MSTN (r = −0.53, p = 0.0040) potentially tracking with muscle loss (but not SMI), as observed for LEP and adiposity [46,53,54]. Pertinently, the MSTN neutralizing antibody LY2495655 did not improve survival in a Phase 2 trial of 125 patients with stage 2–4 pancreatic cancer, and indeed treatment trended poorer survival [55]. While IL-6, another often implicated biomarker in cachexia was not differentially present, upstream regulator prediction and protein co-expression network analysis both identified IL-6 with high significance [56,57]. IL-6 and STAT3 were also positively correlated with CWLG in our study, although below the threshold of 0.50 correlation coefficient set for significance. These consistencies provide confidence in the relevance of novel proteins identified here.
Proteins identified in circulation such as FABP3, MB were also identified in skeletal muscle proteome studies [58,59]. Other highly correlated proteins included coagulation factors C7, F2, and C5, the lymphocyte surface antigen LY9, and IL1RL1, suggesting inflammation. As well, we identified several proinflammatory cytokines such as IL-1 alpha, IL4, IL6, LIF, TNF which have been implicated in cancer cachexia [13,32,33,34].
Our findings suggest that inflammation is a key driver of PDAC cachexia. Functional enrichment and co-expression analysis identified B cell receptor signaling, Th1, Th2 activation pathways and natural killer cell signaling pathways, which are novel cachexia associated pathways identified from the aptamer assay. Other pathways which were previously reported in cachexia such as IL-6 signaling [60], STAT3 signaling [60,61], protein ubiquitination pathway [62] and mitochondrial dysfunction [63] were also identified.
With cachexia being a manifestation of complex host-tumor interaction leading to muscle wasting and impairing muscle regeneration [64], it is recognized that along with myogenic factors, immune cells have a crucial role in remodeling and regenerating skeletal muscle [65]. The presence of immune cells in healthy skeletal muscle is rare. However, in an injured muscle, the concentration of immune cells increases many fold [66]. T cells were shown to be involved in skeletal muscle regeneration after injury [67]. While Th1 has a proinflammatory effect in recruiting neutrophils and monocytes to the damaged site, Th2 cells promote anti-inflammatory response and myoblast fusion [68]. Therefore, balance between Th1 and Th2 signaling may be crucial for proper muscle regeneration. As the inflammatory status in cancer cachexia is shifted more towards proinflammatory than anti-inflammatory [69], it remains to be studied if the same mechanism is observed in Th1 and Th2. Alongside, we identified two coagulation proteins F2 and F9 to be correlated with CWLG. Coagulation imbalance leading to excessive thrombosis is one of the complications seen in patients with advanced PDAC [70]. In C26 mouse model of cancer cachexia, hypercoagulation was observed due to partially elevated inflammatory cytokine levels, including IL-6 [71]. In our study, we found F2 to be negatively correlated with CWLG and F9 to be positively correlated with TAI.
One of the common links between Th1, Th2 pathways and the coagulation proteins F2 and F9 is IL-6. IL-6 is one of the well-studied biomarkers in cancer cachexia [72,73]. IL-6 signaling is one of the significant pathways identified in this study and has extensively been studied for its role in PDAC cachexia, and as a target for cancer therapy [74]. From our pathway network analysis (Figure 8), IL-6 was shown to be involved in Th1 and Th2 activation pathway, and can simultaneously inhibit Th1 polarization and promote Th2 differentiation [75]. Increased levels of IL-6 also causes muscle and fat wasting in mouse models of cachexia [76]. These inferences suggest the diverse and critical role of IL-6 in cachexia. Therefore, anti-IL-6 therapy would be an interesting option to target and see if it can attenuate tumor mass, thereby reducing muscle and fat wasting.
This is the first report on the expression of serum protein biomarkers for myosteatosis. Presence of myosteatosis in patients with cancer severely impacts survival [77]. However, the mechanism through which fat infiltrates muscle in cancer remains to be elucidated. It remains to be seen if FABP3, a fatty acid transport protein correlated here with SMD may potentially be involved in this process. Additional known inflammatory mediators (ALB, TLR2), and signaling molecules of cachexia (INHBA, MSTN, LEP) were identified in our study. In concordance with what has previously been reported, myostatin and albumin are negatively correlated with CWLG in our study [46,78]. Many of the pathways identified from skeletal muscle in earlier studies using experimental models of cachexia have been confirmed in our study using serum samples. This approach could allow us to bridge the gap in understanding the pathophysiology of human PDAC cachexia and accelerate drug development for this devastating condition.
Of note, our upstream analysis identified several TGF-beta superfamily of proteins such as MSTN, GDF11, GDF15, TGF-β suggesting their important roles in cancer and in cachexia, offering a window for therapeutic interventions [79]. Similar to targeting the activin pathway, it would be interesting to explore these common proteins as therapeutic targets to understand if they can reduce tumor burden and also cachexia.
The study identified novel pathways and upstream regulators that requires further investigation in the context of cachexia. Aberrant Wnt/β-catenin signaling causes a shift in muscle fiber type through the interaction of Wnt3a with FOXO1 in chronic heart failure in mice [80]. While FOXO1 activation has a causal role in muscle atrophy [32], it would be interesting to study the effects of targeting Wnt signaling in muscle atrophy. The novel upstream regulators include FGF2 and CSF2 and drugs such as tretinoin, ascorbic acid and beta-estradiol. While FGF2 promotes satellite cell proliferation [81] and beta estradiol deficiency causes muscle weakness in female [82], the role of FGF2 and beta estradiol along with CSF2 and other drugs identified as upstream regulators needs further investigation.
To understand the disease trajectory of cachexia, collecting serial biopsies at different time points would enable us to better understand the change in muscle microenvironment, however, obtaining skeletal muscle biopsies from cancer patients is an invasive procedure and has, to date been difficult to perform. The barriers such as access to muscle samples, the advanced stage of patients with cancer, the focus on cancer therapy and its toxicity have contributed to the slow progress in understanding human cachexia. Alternatively, future studies should aim at collecting liquid biopsies at different time points which may aid in stratifying biomarkers based on the severity of the cancer and cachexia. Further, there are studies to suggest that many of the molecules involved in gene expression, post-transcriptional gene regulatory mechanisms (microRNA and other small non-coding RNA) can be captured using plasma and serum from cancer patients [83,84]. This remains relatively unexplored for cancer cachexia. These observations suggest that liquid biopsies could prove to be a powerful source for biomarker discovery and to understand the human biology of cachexia. Hence, identifying pathways that are enriched in humans, followed by validating in suitable model systems which can capture the heterogeneity of cachexia to an extent could prove to be a powerful strategy for bench to bedside approach.

4. Materials and Methods

4.1. Recruitment of Study Participants

This was a prospective, observational study that was approved by the Indiana University Institutional Review Board (IRB) (protocol number 1312105608). The study participants diagnosed with either local PDAC or metastatic were recruited from Indiana University Hospital between the years 2015 and 2017. Written informed consent was obtained from patients for blood and clinical data collections. Patients had to be >18 years of age, provide informed consent, had confirmed PDAC—classified as either advanced group or local PDAC (surgical group). Study procedures including collecting blood samples and clinical data were coordinated to meet the standard of care procedures per the treating physician’s discretion. Patients were excluded if they had known HIV or other active malignancies other than PDAC. The collected blood was stored in −80 °C until further use. A total of 30 patients with PDAC, including 19 localized PDAC and 11 with metastatic disease were included in this study. All experiments were performed in accordance with the IRB protocol.

4.2. Assessment of Clinical Variables for Cachexia

Weight loss information over the preceding 6 months was collected using the Patient-Generated Subjective Global Assessment. Cancer weight loss grade (CWLG), an ordinal classification of history of percent weight loss and BMI across five grades, was determined for all patients using the Martin et al. classification [3]. The five grades of BMI and percent weight loss are <20.0, 20.0 to 21.9, 22.0 to 24.9, 25.0 to 27.9, and ≥28.0 kg/m2 and −2.5% to −5.9%, −6.0% to −10.9%, −11.0% to −14.9%, ≥−15.0%, and weight stable respectively [3].
CT scans obtained as part of standard of care follow up and in intervals of every 8–12 weeks were retrieved for body composition analysis utilizing SliceOMatic software according to the method of Baracos; the third lumbar vertebrae were used as a standard landmark to measure the skeletal muscle and total adipose components [3,27]. Skeletal muscle index (SMI) and total adipose index (TAI) were calculated by normalizing the skeletal muscle and adipose tissue area to their stature (cm2/m2) [3,27,85]. Skeletal muscle density was measured as average Hounsfield units across. Sarcopenia status of these patients was calculated based on Martin et al. classification [27].
One participant could not be scored for cancer weight loss grade (CWLG) and two participants did not have CT scans from which to determine SMI, SMD and TAI. Therefore, 29 subjects were used for CWLG correlation analysis and 28 subjects for body composition correlation analysis.

4.3. Protein Measurements Using SOMAscan

Serum samples were subjected to SOMAscan proteomic assay [28]. In brief, SOMAscan is an aptamer-based technology that utilizes single-stranded DNA aptamers chemically modified to enhance the binding to protein epitope with high specificity. Each of the 1310 proteins measured in serum by the version of the SOMAscan assay performed in this study has its own targeted SOMAmer reagent, which is used as an affinity binding reagent and quantified on a custom hybridization chip. Cases associated with local PDAC and metastatic group were randomly assigned to plates within each assay run along with a set of calibration and normalization samples. No identifying information was available to the laboratory technicians operating the assay. Intrarun normalization and interrun calibration was performed according to SOMAscan assay data quality-control procedures as defined in the SomaLogic good laboratory practice quality system.
Among the 1310 proteins assayed, several proteins had more than one probe. 6 proteins did not pass QC, leaving 1294 proteins for analysis. The output for every protein from the array is given as relative fluorescence units (RFU), which is proportional to the amount of target protein present in the sample. Hybridization normalization was performed to reduce the technical variation. The data was then median normalized to remove any variation between samples and to account for any variation in the assay. After the preprocessing steps, quantile normalization was performed across all samples for proteins for downstream analyses. The raw data and normalized data are submitted to GEO (ncbi.nlm.nih.gov/geo/; Accession number: GSE119483).

4.4. Statistical Analyses

Proteins were tested for normality by group (No cancer/Metastatic/Local PDAC) via Kolmogorov-Smirnov test (p-value < 0.05 indicating non-normality). Even after taking the natural log, many proteins were non-normal (18% for controls, 36% for Local PDAC, and 23% for Metastatic); thus, non-parametric approaches were utilized in analyses. Groups comparisons were made using Wilcoxon Mann-Whitney U-tests. Proteins with >1.5-fold change and p < 0.05 were considered for downstream analysis. For cachexia comparisons among cancer patients, partial Spearman’s correlations adjusted for age and sex were computed to correlate protein expression with CWLG (treated as an ordinal variable), SMI, SMD and TAI (treated as continuous variables). GraphPad Prism 7 (GraphPad Software, Inc., La Jolla, CA, USA) and R statistical program (R Core Team, Vienna, Austria) were used for statistical analyses and visualization.

4.5. Identification of Upstream Regulators of Proteins Associated with Cachexia

Proteins correlated with CWLG, SMI, and SMD with effect size ≥0.5 and p < 0.05 were used for prediction of upstream regulators using Ingenuity Pathway Analysis (IPA, Version 2.3, November 2018, Qiagen, Redwood City, CA, USA).

4.6. Protein Co-Expression Analysis to Identify Novel Pathways Associated with Cachexia

To identify novel pathways that can potentially be associated with PDAC cachexia, in-silico protein co-expression analysis was performed using Spearman correlation. All 1294 protein values in patients with PDAC were correlated against each other and interactions with strong correlation value of 0.6 (r-value) and p < 0.05 were further considered for interpretation. Pathways of the co-expression network were identified using Ingenuity Pathway Analysis.

5. Conclusions

We have identified novel circulating protein biomarkers associated with human PDAC and PDAC cachexia. We have also identified previously reported markers along with novel biomarkers. Our data suggest that cancer stage and cachexia stage are molecularly different. We report inflammatory and signaling pathways that were not previously described in cachexia. It would also be of great interest to explore whether these biomarkers are disease specific by evaluating them in other malignancies associated cachexia.

Supplementary Materials

The following are available online at https://www.mdpi.com/2072-6694/12/12/3787/s1, Table S1: List of differentially expressed proteins between local PDAC vs. control patients. Table S2: List of differentially expressed proteins between metastatic PDAC vs. control patients. Table S3: Canonical pathways for local PDAC vs. control. Table S4: Canonical pathways for metastatic PDAC vs. control. Table S5: List of differentially expressed proteins between cancer patients with cachexia vs. no cachexia. Table S6: Predicted upstream regulators of proteins correlated to markers of cancer cachexia. Table S7: Canonical pathways for protein co-expression analysis.

Author Contributions

Conceptualization, S.S., L.G.K. and T.A.Z.; methodology, S.S., A.N., J.K.K., S.M.P. and L.C.; formal analysis, S.S., A.N. and T.A.Z.; resources, L.G.K. and T.A.Z.; data curation, K.N.H.S. and D.E.I.S.; writing—original draft preparation, A.N., S.S. and T.A.Z.; writing—review and editing, S.S., A.N., J.K.K., S.M.P., L.C., K.N.H.S., D.E.I.S., L.G.K. and T.A.Z.; supervision, L.G.K. and T.A.Z.; project administration, T.A.Z.; funding acquisition, S.S., L.G.K. and T.A.Z. All authors have read and agreed to the published version of the manuscript.

Funding

This work was funded in part by grants to S.S. from the Heroes Foundation, to T.A.Z. from the National Institutes of Health (grants R01-CA122596 and R01-CA194593), the Lustgarten Foundation, and the IUPUI Signature Center for Pancreatic Cancer Research, and to L.G.K. from NIH (R01-DK096167) and the Lilly Endowment, Inc. This work also used the Biostatistics & Data Management Core of the IU Simon Cancer Center, supported by the National Cancer Institute (P30-CA082709).

Conflicts of Interest

The authors declare no conflict of interest.

References

  1. Fearon, K.; Strasser, F.; Anker, S.D.; Bosaeus, I.; Bruera, E.; Fainsinger, R.L.; Jatoi, A.; Loprinzi, C.; MacDonald, N.; Mantovani, G.; et al. Definition and classification of cancer cachexia: An international consensus. Lancet Oncol. 2011, 12, 489–495. [Google Scholar] [CrossRef]
  2. Baracos, V.E.; Martin, L.; Korc, M.; Guttridge, D.C.; Fearon, K.C.H. Cancer-associated cachexia. Nat. Rev. Dis. Primers 2018, 4, 17105. [Google Scholar] [CrossRef] [PubMed]
  3. Martin, L.; Senesse, P.; Gioulbasanis, I.; Antoun, S.; Bozzetti, F.; Deans, C.; Strasser, F.; Thoresen, L.; Jagoe, R.T.; Chasen, M.; et al. Diagnostic criteria for the classification of cancer-associated weight loss. J. Clin. Oncol. 2015, 33, 90–99. [Google Scholar] [CrossRef] [PubMed]
  4. Nemer, L.; Krishna, S.G.; Shah, Z.K.; Conwell, D.L.; Cruz-Monserrate, Z.; Dillhoff, M.; Guttridge, D.C.; Hinton, A.; Manilchuk, A.; Pawlik, T.M.; et al. Predictors of Pancreatic Cancer-Associated Weight Loss and Nutritional Interventions. Pancreas 2017, 46, 1152–1157. [Google Scholar] [CrossRef] [PubMed]
  5. Hendifar, A.E.; Chang, J.I.; Huang, B.Z.; Tuli, R.; Wu, B.U. Cachexia, and not obesity, prior to pancreatic cancer diagnosis worsens survival and is negated by chemotherapy. J. Gastrointest. Oncol. 2018, 9, 17–23. [Google Scholar] [CrossRef] [Green Version]
  6. Bieliuniene, E.; Brondum Frokjaer, J.; Pockevicius, A.; Kemesiene, J.; Lukosevicius, S.; Basevicius, A.; Atstupenaite, V.; Barauskas, G.; Ignatavicius, P.; Gulbinas, A.; et al. CT- and MRI-Based Assessment of Body Composition and Pancreatic Fibrosis Reveals High Incidence of Clinically Significant Metabolic Changes That Affect the Quality of Life and Treatment Outcomes of Patients with Chronic Pancreatitis and Pancreatic Cancer. Medicina 2019, 55, 649. [Google Scholar] [CrossRef] [Green Version]
  7. Naumann, P.; Eberlein, J.; Farnia, B.; Hackert, T.; Debus, J.; Combs, S.E. Continued Weight Loss and Sarcopenia Predict Poor Outcomes in Locally Advanced Pancreatic Cancer Treated with Chemoradiation. Cancers 2019, 11, 709. [Google Scholar] [CrossRef] [Green Version]
  8. Griffin, O.M.; Duggan, S.N.; Ryan, R.; McDermott, R.; Geoghegan, J.; Conlon, K.C. Characterising the impact of body composition change during neoadjuvant chemotherapy for pancreatic cancer. Pancreatology 2019, 19, 850–857. [Google Scholar] [CrossRef]
  9. Kays, J.K.; Shahda, S.; Stanley, M.; Bell, T.M.; O’Neill, B.H.; Kohli, M.D.; Couch, M.E.; Koniaris, L.G.; Zimmers, T.A. Three cachexia phenotypes and the impact of fat-only loss on survival in FOLFIRINOX therapy for pancreatic cancer. J. Cachexia Sarcopenia Muscle 2018, 9, 673–684. [Google Scholar] [CrossRef]
  10. Naumann, P.; Eberlein, J.; Farnia, B.; Liermann, J.; Hackert, T.; Debus, J.; Combs, S.E. Cachectic Body Composition and Inflammatory Markers Portend a Poor Prognosis in Patients with Locally Advanced Pancreatic Cancer Treated with Chemoradiation. Cancers 2019, 11, 1655. [Google Scholar] [CrossRef] [Green Version]
  11. Yuen, E.Y.N.; Zaleta, A.K.; McManus, S.; Buzaglo, J.S.; LeBlanc, T.W.; Hamilton, K.; Stein, K. Unintentional weight loss, its associated burden, and perceived weight status in people with cancer. Support. Care Cancer 2020, 28, 329–339. [Google Scholar] [CrossRef] [PubMed]
  12. Sarkar, R.R.; Fero, K.E.; Seible, D.M.; Panjwani, N.; Matsuno, R.K.; Murphy, J.D. A Population-Based Study of Morbidity After Pancreatic Cancer Diagnosis. J. Natl. Compr. Canc. Netw. 2019, 17, 432–440. [Google Scholar] [CrossRef] [PubMed]
  13. Zimmers, T.A.; Fishel, M.L.; Bonetto, A. STAT3 in the systemic inflammation of cancer cachexia. Semin. Cell Dev. Biol. 2016, 54, 28–41. [Google Scholar] [CrossRef] [PubMed] [Green Version]
  14. Roeland, E.J.; Bohlke, K.; Baracos, V.E.; Bruera, E.; Del Fabbro, E.; Dixon, S.; Fallon, M.; Herrstedt, J.; Lau, H.; Platek, M.; et al. Management of Cancer Cachexia: ASCO Guideline. J. Clin. Oncol. 2020, 38, 2438–2453. [Google Scholar] [CrossRef] [PubMed]
  15. Bonetto, A.; Rupert, J.E.; Barreto, R.; Zimmers, T.A. The Colon-26 Carcinoma Tumor-bearing Mouse as a Model for the Study of Cancer Cachexia. J. Vis. Exp. 2016. [Google Scholar] [CrossRef] [Green Version]
  16. Zhong, X.; Pons, M.; Poirier, C.; Jiang, Y.; Liu, J.; Sandusky, G.E.; Shahda, S.; Nakeeb, A.; Schmidt, C.M.; House, M.G.; et al. The systemic activin response to pancreatic cancer: Implications for effective cancer cachexia therapy. J. Cachexia Sarcopenia Muscle 2019, 10, 1083–1101. [Google Scholar] [CrossRef] [Green Version]
  17. Michaelis, K.A.; Norgard, M.A.; Zhu, X.; Levasseur, P.R.; Sivagnanam, S.; Liudahl, S.M.; Burfeind, K.G.; Olson, B.; Pelz, K.R.; Angeles Ramos, D.M.; et al. The TLR7/8 agonist R848 remodels tumor and host responses to promote survival in pancreatic cancer. Nat. Commun. 2019, 10, 4682. [Google Scholar] [CrossRef] [Green Version]
  18. Shukla, S.K.; Markov, S.D.; Attri, K.S.; Vernucci, E.; King, R.J.; Dasgupta, A.; Grandgenett, P.M.; Hollingsworth, M.A.; Singh, P.K.; Yu, F.; et al. Macrophages potentiate STAT3 signaling in skeletal muscles and regulate pancreatic cancer cachexia. Cancer Lett. 2020, 484, 29–39. [Google Scholar] [CrossRef]
  19. Burfeind, K.G.; Zhu, X.; Norgard, M.A.; Levasseur, P.R.; Huisman, C.; Buenafe, A.C.; Olson, B.; Michaelis, K.A.; Torres, E.R.; Jeng, S.; et al. Circulating myeloid cells invade the central nervous system to mediate cachexia during pancreatic cancer. eLife 2020, 9. [Google Scholar] [CrossRef]
  20. Talbert, E.E.; Cuitino, M.C.; Ladner, K.J.; Rajasekerea, P.V.; Siebert, M.; Shakya, R.; Leone, G.W.; Ostrowski, M.C.; Paleo, B.; Weisleder, N.; et al. Modeling Human Cancer-induced Cachexia. Cell Rep. 2019, 28, 1612–1622. [Google Scholar] [CrossRef] [Green Version]
  21. Lerner, L.; Tao, J.; Liu, Q.; Nicoletti, R.; Feng, B.; Krieger, B.; Mazsa, E.; Siddiquee, Z.; Wang, R.; Huang, L.; et al. MAP3K11/GDF15 axis is a critical driver of cancer cachexia. J. Cachexia Sarcopenia Muscle 2016, 7, 467–482. [Google Scholar] [CrossRef] [PubMed]
  22. Au, E.D.; Desai, A.P.; Koniaris, L.G.; Zimmers, T.A. The MEK-Inhibitor Selumetinib Attenuates Tumor Growth and Reduces IL-6 Expression but Does Not Protect against Muscle Wasting in Lewis Lung Cancer Cachexia. Front. Physiol. 2016, 7, 682. [Google Scholar] [CrossRef] [PubMed] [Green Version]
  23. Benny Klimek, M.E.; Aydogdu, T.; Link, M.J.; Pons, M.; Koniaris, L.G.; Zimmers, T.A. Acute inhibition of myostatin-family proteins preserves skeletal muscle in mouse models of cancer cachexia. Biochem. Biophys. Res. Commun. 2010, 391, 1548–1554. [Google Scholar] [CrossRef] [PubMed]
  24. Huot, J.R.; Pin, F.; Narasimhan, A.; Novinger, L.J.; Keith, A.S.; Zimmers, T.A.; Willis, M.S.; Bonetto, A. ACVR2B antagonism as a countermeasure to multi-organ perturbations in metastatic colorectal cancer cachexia. J. Cachexia Sarcopenia Muscle 2020. [Google Scholar] [CrossRef] [PubMed]
  25. Suriben, R.; Chen, M.; Higbee, J.; Oeffinger, J.; Ventura, R.; Li, B.; Mondal, K.; Gao, Z.; Ayupova, D.; Taskar, P.; et al. Antibody-mediated inhibition of GDF15-GFRAL activity reverses cancer cachexia in mice. Nat. Med. 2020, 26, 1264–1270. [Google Scholar] [CrossRef]
  26. Miller, J.; Skipworth, R.J.E. Novel molecular targets of muscle wasting in cancer patients. Curr. Opin. Clin. Nutr. Metab. Care 2019, 22, 196–204. [Google Scholar] [CrossRef]
  27. Martin, L.; Birdsell, L.; Macdonald, N.; Reiman, T.; Clandinin, M.T.; McCargar, L.J.; Murphy, R.; Ghosh, S.; Sawyer, M.B.; Baracos, V.E. Cancer cachexia in the age of obesity: Skeletal muscle depletion is a powerful prognostic factor, independent of body mass index. J. Clin. Oncol. 2013, 31, 1539–1547. [Google Scholar] [CrossRef]
  28. Rohloff, J.C.; Gelinas, A.D.; Jarvis, T.C.; Ochsner, U.A.; Schneider, D.J.; Gold, L.; Janjic, N. Nucleic Acid Ligands With Protein-like Side Chains: Modified Aptamers and Their Use as Diagnostic and Therapeutic Agents. Mol. Ther. Nucleic Acids 2014, 3, e201. [Google Scholar] [CrossRef]
  29. Sullivan, G.M.; Feinn, R. Using Effect Size—Or Why the P Value Is Not Enough. J. Grad. Med. Educ. 2012, 4, 279–282. [Google Scholar] [CrossRef] [Green Version]
  30. Bonetto, A.; Kays, J.K.; Parker, V.A.; Matthews, R.R.; Barreto, R.; Puppa, M.J.; Kang, K.S.; Carson, J.A.; Guise, T.A.; Mohammad, K.S.; et al. Differential Bone Loss in Mouse Models of Colon Cancer Cachexia. Front. Physiol. 2016, 7, 679. [Google Scholar] [CrossRef] [Green Version]
  31. Park, H.K.; Ahima, R.S. Physiology of leptin: Energy homeostasis, neuroendocrine function and metabolism. Metabolism 2015, 64, 24–34. [Google Scholar] [CrossRef] [Green Version]
  32. Argiles, J.M.; Busquets, S.; Stemmler, B.; Lopez-Soriano, F.J. Cancer cachexia: Understanding the molecular basis. Nat. Rev. Cancer 2014, 14, 754–762. [Google Scholar] [CrossRef] [PubMed]
  33. Costamagna, D.; Duelen, R.; Penna, F.; Neumann, D.; Costelli, P.; Sampaolesi, M. Interleukin-4 administration improves muscle function, adult myogenesis, and lifespan of colon carcinoma-bearing mice. J. Cachexia Sarcopenia Muscle 2020, 11, 783–801. [Google Scholar] [CrossRef] [PubMed] [Green Version]
  34. Kandarian, S.C.; Nosacka, R.L.; Delitto, A.E.; Judge, A.R.; Judge, S.M.; Ganey, J.D.; Moreira, J.D.; Jackman, R.W. Tumour-derived leukaemia inhibitory factor is a major driver of cancer cachexia and morbidity in C26 tumour-bearing mice. J. Cachexia Sarcopenia Muscle 2018, 9, 1109–1120. [Google Scholar] [CrossRef] [PubMed]
  35. Takenaga, K.; Akimoto, M.; Koshikawa, N.; Nagase, H. Cancer cell-derived interleukin-33 decoy receptor sST2 enhances orthotopic tumor growth in a murine pancreatic cancer model. PLoS ONE 2020, 15, e0232230. [Google Scholar] [CrossRef] [PubMed]
  36. Kieler, M.; Unseld, M.; Wojta, J.; Kaider, A.; Bianconi, D.; Demyanets, S.; Prager, G.W. Plasma levels of interleukin-33 and soluble suppression of tumorigenicity 2 in patients with advanced pancreatic ductal adenocarcinoma undergoing systemic chemotherapy. Med. Oncol. 2018, 36, 1. [Google Scholar] [CrossRef] [PubMed] [Green Version]
  37. Kaur, H.; Dhall, A.; Kumar, R.; Raghava, G.P.S. Identification of Platform-Independent Diagnostic Biomarker Panel for Hepatocellular Carcinoma Using Large-Scale Transcriptomics Data. Front. Genet. 2019, 10, 1306. [Google Scholar] [CrossRef]
  38. Hu, K.; Wang, Z.M.; Li, J.N.; Zhang, S.; Xiao, Z.F.; Tao, Y.M. CLEC1B Expression and PD-L1 Expression Predict Clinical Outcome in Hepatocellular Carcinoma with Tumor Hemorrhage. Transl. Oncol. 2018, 11, 552–558. [Google Scholar] [CrossRef]
  39. Li, C.; Wang, J.; Kong, J.; Tang, J.; Wu, Y.; Xu, E.; Zhang, H.; Lai, M. GDF15 promotes EMT and metastasis in colorectal cancer. Oncotarget 2016, 7, 860–872. [Google Scholar] [CrossRef]
  40. Peng, H.; Pan, S.; Yan, Y.; Brand, R.E.; Petersen, G.M.; Chari, S.T.; Lai, L.A.; Eng, J.K.; Brentnall, T.A.; Chen, R. Systemic Proteome Alterations Linked to Early Stage Pancreatic Cancer in Diabetic Patients. Cancers 2020, 12, 1534. [Google Scholar] [CrossRef]
  41. Prokopchuk, O.; Grunwald, B.; Nitsche, U.; Jager, C.; Prokopchuk, O.L.; Schubert, E.C.; Friess, H.; Martignoni, M.E.; Kruger, A. Elevated systemic levels of the matrix metalloproteinase inhibitor TIMP-1 correlate with clinical markers of cachexia in patients with chronic pancreatitis and pancreatic cancer. BMC Cancer 2018, 18, 128. [Google Scholar] [CrossRef] [PubMed] [Green Version]
  42. Qi, Q.; Zhuang, L.; Shen, Y.; Geng, Y.; Yu, S.; Chen, H.; Liu, L.; Meng, Z.; Wang, P.; Chen, Z. A novel systemic inflammation response index (SIRI) for predicting the survival of patients with pancreatic cancer after chemotherapy. Cancer 2016, 122, 2158–2167. [Google Scholar] [CrossRef] [PubMed] [Green Version]
  43. Hansel, D.E.; Rahman, A.; Wehner, S.; Herzog, V.; Yeo, C.J.; Maitra, A. Increased expression and processing of the Alzheimer amyloid precursor protein in pancreatic cancer may influence cellular proliferation. Cancer Res. 2003, 63, 7032–7037. [Google Scholar] [PubMed]
  44. Tanaka, T.; Biancotto, A.; Moaddel, R.; Moore, A.Z.; Gonzalez-Freire, M.; Aon, M.A.; Candia, J.; Zhang, P.; Cheung, F.; Fantoni, G.; et al. Plasma proteomic signature of age in healthy humans. Aging Cell 2018, 17, e12799. [Google Scholar] [CrossRef] [Green Version]
  45. Lehallier, B.; Gate, D.; Schaum, N.; Nanasi, T.; Lee, S.E.; Yousef, H.; Moran Losada, P.; Berdnik, D.; Keller, A.; Verghese, J.; et al. Undulating changes in human plasma proteome profiles across the lifespan. Nat. Med. 2019, 25, 1843–1850. [Google Scholar] [CrossRef]
  46. Loumaye, A.; de Barsy, M.; Nachit, M.; Lause, P.; Frateur, L.; van Maanen, A.; Trefois, P.; Gruson, D.; Thissen, J.P. Role of Activin A and myostatin in human cancer cachexia. J. Clin. Endocrinol. Metab. 2015, 100, 2030–2038. [Google Scholar] [CrossRef] [Green Version]
  47. Parente, A.; Boukredine, A.; Baraige, F.; Duprat, N.; Gondran-Tellier, V.; Magnol, L.; Blanquet, V. GASP-2 overexpressing mice exhibit a hypermuscular phenotype with contrasting molecular effects compared to GASP-1 transgenics. FASEB J. 2020, 34, 4026–4040. [Google Scholar] [CrossRef] [Green Version]
  48. Blyuss, O.; Zaikin, A.; Cherepanova, V.; Munblit, D.; Kiseleva, E.M.; Prytomanova, O.M.; Duffy, S.W.; Crnogorac-Jurcevic, T. Development of PancRISK, a urine biomarker-based risk score for stratified screening of pancreatic cancer patients. Br. J. Cancer 2020, 122, 692–696. [Google Scholar] [CrossRef]
  49. Sikdar, N.; Saha, G.; Dutta, A.; Ghosh, S.; Shrikhande, S.V.; Banerjee, S. Genetic Alterations of Periampullary and Pancreatic Ductal Adenocarcinoma: An Overview. Curr. Genom. 2018, 19, 444–463. [Google Scholar] [CrossRef]
  50. Soreide, K.; Roalso, M.; Aunan, J.R. Is There a Trojan Horse to Aggressive Pancreatic Cancer Biology? A Review of the Trypsin-PAR2 Axis to Proliferation, Early Invasion, and Metastasis. J. Pancreat. Cancer 2020, 6, 12–20. [Google Scholar] [CrossRef] [Green Version]
  51. Yi, Q.; Dong, F.; Lin, L.; Liu, Q.; Chen, S.; Gao, F.; He, Q. PRSS1 mutations and the proteinase/antiproteinase imbalance in the pathogenesis of pancreatic cancer. Tumor Biol. 2016, 37, 5805–5810. [Google Scholar] [CrossRef] [PubMed]
  52. Nakanishi, T.; Forgetta, V.; Handa, T.; Hirai, T.; Mooser, V.; Lathrop, M.G.; Cookson, W.; Richards, J.B. The Undiagnosed Disease Burden Associated with Alpha-1 Antitrypsin Deficiency Genotypes. Eur. Respir. J. 2020. [Google Scholar] [CrossRef] [PubMed]
  53. Schwarz, S.; Prokopchuk, O.; Esefeld, K.; Groschel, S.; Bachmann, J.; Lorenzen, S.; Friess, H.; Halle, M.; Martignoni, M.E. The clinical picture of cachexia: A mosaic of different parameters (experience of 503 patients). BMC Cancer 2017, 17, 130. [Google Scholar] [CrossRef] [PubMed] [Green Version]
  54. Kim, E.Y.; Kim, Y.S.; Seo, J.Y.; Park, I.; Ahn, H.K.; Jeong, Y.M.; Kim, J.H.; Kim, N. The Relationship between Sarcopenia and Systemic Inflammatory Response for Cancer Cachexia in Small Cell Lung Cancer. PLoS ONE 2016, 11, e0161125. [Google Scholar] [CrossRef]
  55. Golan, T.; Geva, R.; Richards, D.; Madhusudan, S.; Lin, B.K.; Wang, H.T.; Walgren, R.A.; Stemmer, S.M. LY2495655, an antimyostatin antibody, in pancreatic cancer: A randomized, phase 2 trial. J. Cachexia Sarcopenia Muscle 2018, 9, 871–879. [Google Scholar] [CrossRef] [Green Version]
  56. Fujiwara, Y.; Kobayashi, T.; Chayahara, N.; Imamura, Y.; Toyoda, M.; Kiyota, N.; Mukohara, T.; Nishiumi, S.; Azuma, T.; Yoshida, M.; et al. Metabolomics evaluation of serum markers for cachexia and their intra-day variation in patients with advanced pancreatic cancer. PLoS ONE 2014, 9, e113259. [Google Scholar] [CrossRef] [Green Version]
  57. Kuroda, K.; Nakashima, J.; Kanao, K.; Kikuchi, E.; Miyajima, A.; Horiguchi, Y.; Nakagawa, K.; Oya, M.; Ohigashi, T.; Murai, M. Interleukin 6 is associated with cachexia in patients with prostate cancer. Urology 2007, 69, 113–117. [Google Scholar] [CrossRef]
  58. Gonzalez-Freire, M.; Semba, R.D.; Ubaida-Mohien, C.; Fabbri, E.; Scalzo, P.; Hojlund, K.; Dufresne, C.; Lyashkov, A.; Ferrucci, L. The Human Skeletal Muscle Proteome Project: A reappraisal of the current literature. J. Cachexia Sarcopenia Muscle 2017, 8, 5–18. [Google Scholar] [CrossRef]
  59. Shum, A.M.Y.; Poljak, A.; Bentley, N.L.; Turner, N.; Tan, T.C.; Polly, P. Proteomic profiling of skeletal and cardiac muscle in cancer cachexia: Alterations in sarcomeric and mitochondrial protein expression. Oncotarget 2018, 9, 22001–22022. [Google Scholar] [CrossRef] [Green Version]
  60. Miller, A.; McLeod, L.; Alhayyani, S.; Szczepny, A.; Watkins, D.N.; Chen, W.; Enriori, P.; Ferlin, W.; Ruwanpura, S.; Jenkins, B.J. Blockade of the IL-6 trans-signalling/STAT3 axis suppresses cachexia in Kras-induced lung adenocarcinoma. Oncogene 2017, 36, 3059–3066. [Google Scholar] [CrossRef]
  61. Bonetto, A.; Aydogdu, T.; Jin, X.; Zhang, Z.; Zhan, R.; Puzis, L.; Koniaris, L.G.; Zimmers, T.A. JAK/STAT3 pathway inhibition blocks skeletal muscle wasting downstream of IL-6 and in experimental cancer cachexia. Am. J. Physiol. Endocrinol. Metab. 2012, 303, E410–E421. [Google Scholar] [CrossRef] [Green Version]
  62. Attaix, D.; Ventadour, S.; Codran, A.; Bechet, D.; Taillandier, D.; Combaret, L. The ubiquitin-proteasome system and skeletal muscle wasting. Essays Biochem. 2005, 41, 173–186. [Google Scholar] [CrossRef] [PubMed]
  63. Brown, J.L.; Rosa-Caldwell, M.E.; Lee, D.E.; Blackwell, T.A.; Brown, L.A.; Perry, R.A.; Haynie, W.S.; Hardee, J.P.; Carson, J.A.; Wiggs, M.P.; et al. Mitochondrial degeneration precedes the development of muscle atrophy in progression of cancer cachexia in tumour-bearing mice. J. Cachexia Sarcopenia Muscle 2017, 8, 926–938. [Google Scholar] [CrossRef] [PubMed]
  64. Skipworth, R.J.; Stewart, G.D.; Dejong, C.H.; Preston, T.; Fearon, K.C. Pathophysiology of cancer cachexia: Much more than host-tumour interaction? Clin. Nutr. 2007, 26, 667–676. [Google Scholar] [CrossRef] [PubMed]
  65. Tidball, J.G. Regulation of muscle growth and regeneration by the immune system. Nat. Rev. Immunol. 2017, 17, 165–178. [Google Scholar] [CrossRef] [PubMed]
  66. Wehling, M.; Spencer, M.J.; Tidball, J.G. A nitric oxide synthase transgene ameliorates muscular dystrophy in mdx mice. J. Cell. Biol. 2001, 155, 123–131. [Google Scholar] [CrossRef]
  67. Castiglioni, A.; Corna, G.; Rigamonti, E.; Basso, V.; Vezzoli, M.; Monno, A.; Almada, A.E.; Mondino, A.; Wagers, A.J.; Manfredi, A.A.; et al. FOXP3+ T Cells Recruited to Sites of Sterile Skeletal Muscle Injury Regulate the Fate of Satellite Cells and Guide Effective Tissue Regeneration. PLoS ONE 2015, 10, e0128094. [Google Scholar] [CrossRef]
  68. Sciorati, C.; Rigamonti, E.; Manfredi, A.A.; Rovere-Querini, P. Cell death, clearance and immunity in the skeletal muscle. Cell Death Differ. 2016, 23, 927–937. [Google Scholar] [CrossRef] [Green Version]
  69. Argiles, J.M.; Busquets, S.; Toledo, M.; Lopez-Soriano, F.J. The role of cytokines in cancer cachexia. Curr. Opin. Support. Palliat. Care 2009, 3, 263–268. [Google Scholar] [CrossRef]
  70. Mattila, N.; Seppanen, H.; Mustonen, H.; Przybyla, B.; Haglund, C.; Lassila, R. Preoperative Biomarker Panel, Including Fibrinogen and FVIII, Improves Diagnostic Accuracy for Pancreatic Ductal Adenocarcinoma. Clin. Appl. Thromb. Hemost. 2018, 24, 1267–1275. [Google Scholar] [CrossRef] [Green Version]
  71. Reddel, C.J.; Allen, J.D.; Ehteda, A.; Taylor, R.; Chen, V.M.; Curnow, J.L.; Kritharides, L.; Robertson, G. Increased thrombin generation in a mouse model of cancer cachexia is partially interleukin-6 dependent. J. Thromb. Haemost. 2017, 15, 477–486. [Google Scholar] [CrossRef] [PubMed] [Green Version]
  72. Lerner, L.; Hayes, T.G.; Tao, N.; Krieger, B.; Feng, B.; Wu, Z.; Nicoletti, R.; Chiu, M.I.; Gyuris, J.; Garcia, J.M. Plasma growth differentiation factor 15 is associated with weight loss and mortality in cancer patients. J. Cachexia Sarcopenia Muscle 2015, 6, 317–324. [Google Scholar] [CrossRef] [PubMed]
  73. Penafuerte, C.A.; Gagnon, B.; Sirois, J.; Murphy, J.; MacDonald, N.; Tremblay, M.L. Identification of neutrophil-derived proteases and angiotensin II as biomarkers of cancer cachexia. Br. J. Cancer 2016, 114, 680–687. [Google Scholar] [CrossRef] [PubMed] [Green Version]
  74. Narsale, A.A.; Carson, J.A. Role of interleukin-6 in cachexia: Therapeutic implications. Curr. Opin. Support. Palliat. Care 2014, 8, 321–327. [Google Scholar] [CrossRef] [Green Version]
  75. Diehl, S.; Rincon, M. The two faces of IL-6 on Th1/Th2 differentiation. Mol. Immunol. 2002, 39, 531–536. [Google Scholar] [CrossRef]
  76. Carson, J.A.; Baltgalvis, K.A. Interleukin 6 as a key regulator of muscle mass during cachexia. Exerc. Sport Sci. Rev. 2010, 38, 168–176. [Google Scholar] [CrossRef]
  77. Esfandiari, N.; Ghosh, S.; Prado, C.M.; Martin, L.; Mazurak, V.; Baracos, V.E. Age, Obesity, Sarcopenia, and Proximity to Death Explain Reduced Mean Muscle Attenuation in Patients with Advanced Cancer. J. Frailty Aging 2014, 3, 3–8. [Google Scholar] [CrossRef]
  78. Kemik, O.; Sumer, A.; Kemik, A.S.; Hasirci, I.; Purisa, S.; Dulger, A.C.; Demiriz, B.; Tuzun, S. The relationship among acute-phase response proteins, cytokines and hormones in cachectic patients with colon cancer. World J. Surg. Oncol. 2010, 8, 85. [Google Scholar] [CrossRef] [Green Version]
  79. Sheen, Y.Y.; Kim, M.J.; Park, S.A.; Park, S.Y.; Nam, J.S. Targeting the Transforming Growth Factor-beta Signaling in Cancer Therapy. Biomol. Ther. 2013, 21, 323–331. [Google Scholar] [CrossRef] [Green Version]
  80. Okada, K.; Naito, A.T.; Higo, T.; Nakagawa, A.; Shibamoto, M.; Sakai, T.; Hashimoto, A.; Kuramoto, Y.; Sumida, T.; Nomura, S.; et al. Wnt/beta-Catenin Signaling Contributes to Skeletal Myopathy in Heart Failure via Direct Interaction with Forkhead Box O. Circ. Heart Fail. 2015, 8, 799–808. [Google Scholar] [CrossRef] [Green Version]
  81. Yablonka-Reuveni, Z.; Seger, R.; Rivera, A.J. Fibroblast growth factor promotes recruitment of skeletal muscle satellite cells in young and old rats. J. Histochem. Cytochem. 1999, 47, 23–42. [Google Scholar] [CrossRef] [PubMed] [Green Version]
  82. Moran, A.L.; Nelson, S.A.; Landisch, R.M.; Warren, G.L.; Lowe, D.A. Estradiol replacement reverses ovariectomy-induced muscle contractile and myosin dysfunction in mature female mice. J. Appl. Physiol. 2007, 102, 1387–1393. [Google Scholar] [CrossRef] [PubMed] [Green Version]
  83. Sierzega, M.; Kaczor, M.; Kolodziejczyk, P.; Kulig, J.; Sanak, M.; Richter, P. Evaluation of serum microRNA biomarkers for gastric cancer based on blood and tissue pools profiling: The importance of miR-21 and miR-331. Br. J. Cancer 2017, 117, 266–273. [Google Scholar] [CrossRef] [PubMed] [Green Version]
  84. Keller, A.; Leidinger, P.; Gislefoss, R.; Haugen, A.; Langseth, H.; Staehler, P.; Lenhof, H.P.; Meese, E. Stable serum miRNA profiles as potential tool for non-invasive lung cancer diagnosis. RNA Biol. 2011, 8, 506–516. [Google Scholar] [CrossRef] [PubMed] [Green Version]
  85. Prado, C.M.; Lieffers, J.R.; McCargar, L.J.; Reiman, T.; Sawyer, M.B.; Martin, L.; Baracos, V.E. Prevalence and clinical implications of sarcopenic obesity in patients with solid tumours of the respiratory and gastrointestinal tracts: A population-based study. Lancet Oncol. 2008, 9, 629–635. [Google Scholar] [CrossRef]
Figure 1. Differentially present proteins in blood of patients with cancer vs. controls. Differentially present proteins by cancer stage, purple = local or locally advanced vs. controls, and red = metastatic vs. controls, or by cachexia status, green = weight loss > 5% vs. <5%, FC ≥ |1.5|, p ≤ 0.05.
Cancers 12 03787 g001
Figure 2. Comparison of proteins specific to cancer vs. cachexia. Venn diagram comparing differentially present proteins in local/locally advanced PDAC patients vs. controls (purple), in metastatic PDAC patients vs. controls (green), and for proteins correlated to cancer weight loss grade (CWLG) and body weight loss (blue).
Cancers 12 03787 g002
Figure 3. Top 30 proteins correlated with Cancer Weight Loss Grade. The partial Spearman’s rank correlation (r) adjusted for age and sex, and p-value are given for each protein. X-axis indicates cancer weight loss grade (0 = high BMI/low weight loss; 4 = low BMI/high weight loss) and Y axis indicates relative fluorescence units.
Cancers 12 03787 g003
Figure 4. Proteins correlated with weight loss. The partial Spearman’s rank correlation (r) adjusted for age and sex, and p-value are given for each protein. X-axis indicates percentage weight loss and Y axis indicates relative fluorescence units.
Cancers 12 03787 g004
Figure 5. Proteins correlated with cachexia relevant variables. Unique and overlapping proteins identified across the cachexia indices of cancer weight loss Grade (CWLG), weight loss (WL), skeletal muscle index (SMI), skeletal muscle density (SMD), and the combinations.
Cancers 12 03787 g005
Figure 6. Pathways implicated by proteins differentially present in patients with cachexia. Functional enrichment analysis of proteins correlated with CWLG, weight loss, SMI, and SMD were used for pathway analysis. Pathways with p < 0.05 are represented. The X-axis indicates the number of genes in each pathway and Y-axis indicate the pathway names.
Cancers 12 03787 g006
Figure 7. Predicted upstream regulators of proteins differentially present in patients with cancer cachexia. Predicted upstream regulators: The orange and blue color for the upstream regulators in the middle indicate activation and inhibition states, respectively. The red and green color for the downstream proteins indicate positive and negative correlations.
Cancers 12 03787 g007
Figure 8. Canonical pathways identified from protein co-expression network. Canonical pathways identified from protein-protein co-expression analysis. Many pathways that were earlier not known in cachexia such as Th1 and Th2 activation pathways, natural killer cell pathways were identified. Some of the well-studied pathways such as IL-6 signaling and protein ubiquitination pathway were also identified.
Cancers 12 03787 g008
Table 1. Clinical characteristics of patients included in this cohort.
CharacteristicsControl (n = 11)PDAC (n = 30)p-Value
Age a49.2 ± 14.767.1 ± 11.40.001
Female54.6 ± 12.770.5 ± 11.70.015
Male34.7 ± 8.564.2 ± 10.30.002
Gender b 0.138
Female814
Male316
Cancer Stage
Local/locally advanced19
Metastatic11
BMI (kg/m2) † a33.2 ± 7.828.0 ± 7.10.023
Female33.4 ± 8.826.1 ± 4.50.042
Male32.7 ± 3.829.7 ± 8.50.301
Change in weight (% mean) ‡ a−0.9 ± 9.111.9 ± 8.10.001
Female0.2 ± 10.4−10.8 ± 8.30.013
Male−4.0 ± 0.7−12.9 ± 7.80.129
Weight Loss Grade c 0.02
Grade 033
Grade 142
Grade 237
Grade 318
Grade 409
Skeletal muscle index (cm2/m2) * a
Female51.5 ± 9.339.6 ± 4.20.013
Male59.9 ± 4.446.1 ± 12.20.1
Skeletal muscle density (HU) a
Female30.8 ± 7.727.9 ± 9.50.99
Male40.3 ± 0.933.2 ± 9.80.427
Total Adipose Index (cm2/m2) * a
Female183.8 ± 82.1111.1 ± 52.20.140
Male177.4 ± 54.8143.7 ± 83.20.301
Sarcopenia Status (yes/no) § c2/920/80.0040
Female2/66/70.399
Male0/312/60.0632
Information not available-2
Values are indicated as mean ± standard deviation. † BMI calculated as weight (kg)/height (m)2. ‡ Weight loss in prior 6 months calculated as ((current weight in kg) − (weight 6 months ago in kg)/weight 6 months ago in kg)) × 100%. Negative values indicate weight loss. * Skeletal and total adipose indices were calculated as cross-sectional area (cm2)/height (m)2. Cancer Weight Loss grade was defined as history of weight loss combined with BMI. § Sarcopenia status was assigned using Martin et al. classification [27]. Statistically significant differences were not observed between males and females. a—Mann-Whitney U test; b—Chi-square test; c—Fisher’s exact test.
Table 2. Proteins correlated with CWLG.
Protein Namer-Valuep-ValueProtein Namer-Valuep-ValueProtein Namer-Valuep-Value
LYVE10.670.0001C5−0.550.0027TNFRSF10A−0.520.0056
C70.650.0003SEMA6B0.550.0028KRAS−0.520.0056
F2−0.640.0003PIM1−0.550.0031SPP10.520.0059
SLAMF60.640.0004HSD17B1−0.540.0032PIK3CA PIK3R10.520.0059
CDH15−0.610.0007SOST−0.540.0034PDXK0.510.0063
LEP−0.60.0010RPS70.540.0034TLR20.510.0064
ENTPD5−0.590.0013PRSS27−0.540.0035IFNAR10.510.0065
HSPD10.570.0018XPNPEP10.540.0037STK17B−0.510.0065
GHR−0.570.0020NANOG−0.540.0038WFIKKN1−0.520.0068
DLL40.570.0020ASGR10.540.0039FCER2−0.500.0073
CMPK1−0.570.0020MSTN−0.530.0040AHSG−0.500.0074
CA10−0.570.0021LCORL−0.530.0041IL1RL10.500.0075
LY90.560.0022LTA−0.530.0042INHBA0.500.0077
ALB−0.560.0025CRLF2−0.530.0044AFM−0.500.0077
GDNF−0.550.0026ABL2−0.530.0047BOC0.500.0078
SERPINA10.560.0026CXCL5−0.530.0048
Partial Spearman Correlation adjusted for age and gender was calculated for CWLG. All proteins with r ≥ 0.5 and p < 0.05 are reported. + value indicates correlation value.
Table 3. Proteins correlated with skeletal muscle index (SMI).
Protein Namer-Valuep-ValueProtein Namer-Valuep-Value
GRP0.700.0001SET0.560.0028
S100A70.620.0007LEP0.560.0028
CCL28−0.610.0009RSPO3−0.560.0031
CFH0.600.0012WFIKKN10.540.0041
AFM0.590.0012LPO−0.530.0050
MB0.590.0015IL1R20.530.0054
TYMS0.570.0023HRG0.520.0066
GHR0.570.0025HDAC80.510.0076
PIM10.570.0026MDK−0.500.0086
KLK11−0.560.0027
Partial Spearman Correlation adjusted for age and gender was calculated for SMI. All proteins which had r ≥ 0.5 and p < 0.05 are reported in this table. r-value indicates correlation value.
Table 4. Proteins correlated with skeletal muscle density (SMD).
Protein Namer-Valuep-Value
FABP3−0.773.7000 × 10−6
COL18A1−0.630.0006
LRRTM1−0.610.0008
CFH−0.580.0018
AKT20.570.0025
CFD−0.570.0026
C5−0.560.0031
IMPDH10.560.0032
IFNA7−0.550.0034
IL17B0.530.0051
LILRB2−0.530.0052
FCER2−0.510.0073
SIGLEC14−0.510.0074
CLEC1B0.500.0086
Partial Spearman Correlation adjusted for age and gender was calculated for SMD. All proteins which had r ≥ 0.5 and p < 0.05 are reported in this table. r-value indicates correlation value.
Table 5. Proteins correlated with total adipose index (TAI).
Protein Namer-Valuep-ValueProtein Namer-Valuep-Value
LEP0.853.13 × 10−8Human-virus0.560.003
C50.690.0001CFH0.540.004
CCL28−0.680.0002TP530.540.004
FABP30.670.0002DKKL10.550.004
BIRC50.650.0003AFM0.550.004
C1S0.650.0003PLG0.540.005
KLRF10.650.0003SFRP1−0.530.006
PIM10.650.0003UBE2G20.520.006
KLK11−0.610.001F90.530.006
MDK−0.610.001KLKB10.5520.006
PRKAA10.590.001PTN−0.520.007
HRG0.60.001LTBR0.510.007
RSPO3−0.580.002KEAP1−0.510.008
HMGN10.580.002APOE0.50.009
LMAN20.590.002CCL160.50.01
Partial Spearman Correlation adjusted for age and gender was calculated for TAI. All proteins which had r ≥ 0.5 and p < 0.05 are reported in this table. r-value indicates correlation value.
Publisher’s Note: MDPI stays neutral with regard to jurisdictional claims in published maps and institutional affiliations.

