Clinical Response to the CD95-Ligand Inhibitor Asunercept Is Defined by a Pro-Inflammatory Serum Cytokine Profile

 ,
,
Abstract
:Simple Summary
Abstract
1. Introduction
2. Results
2.1. Patient Characteristics and Drug Safety
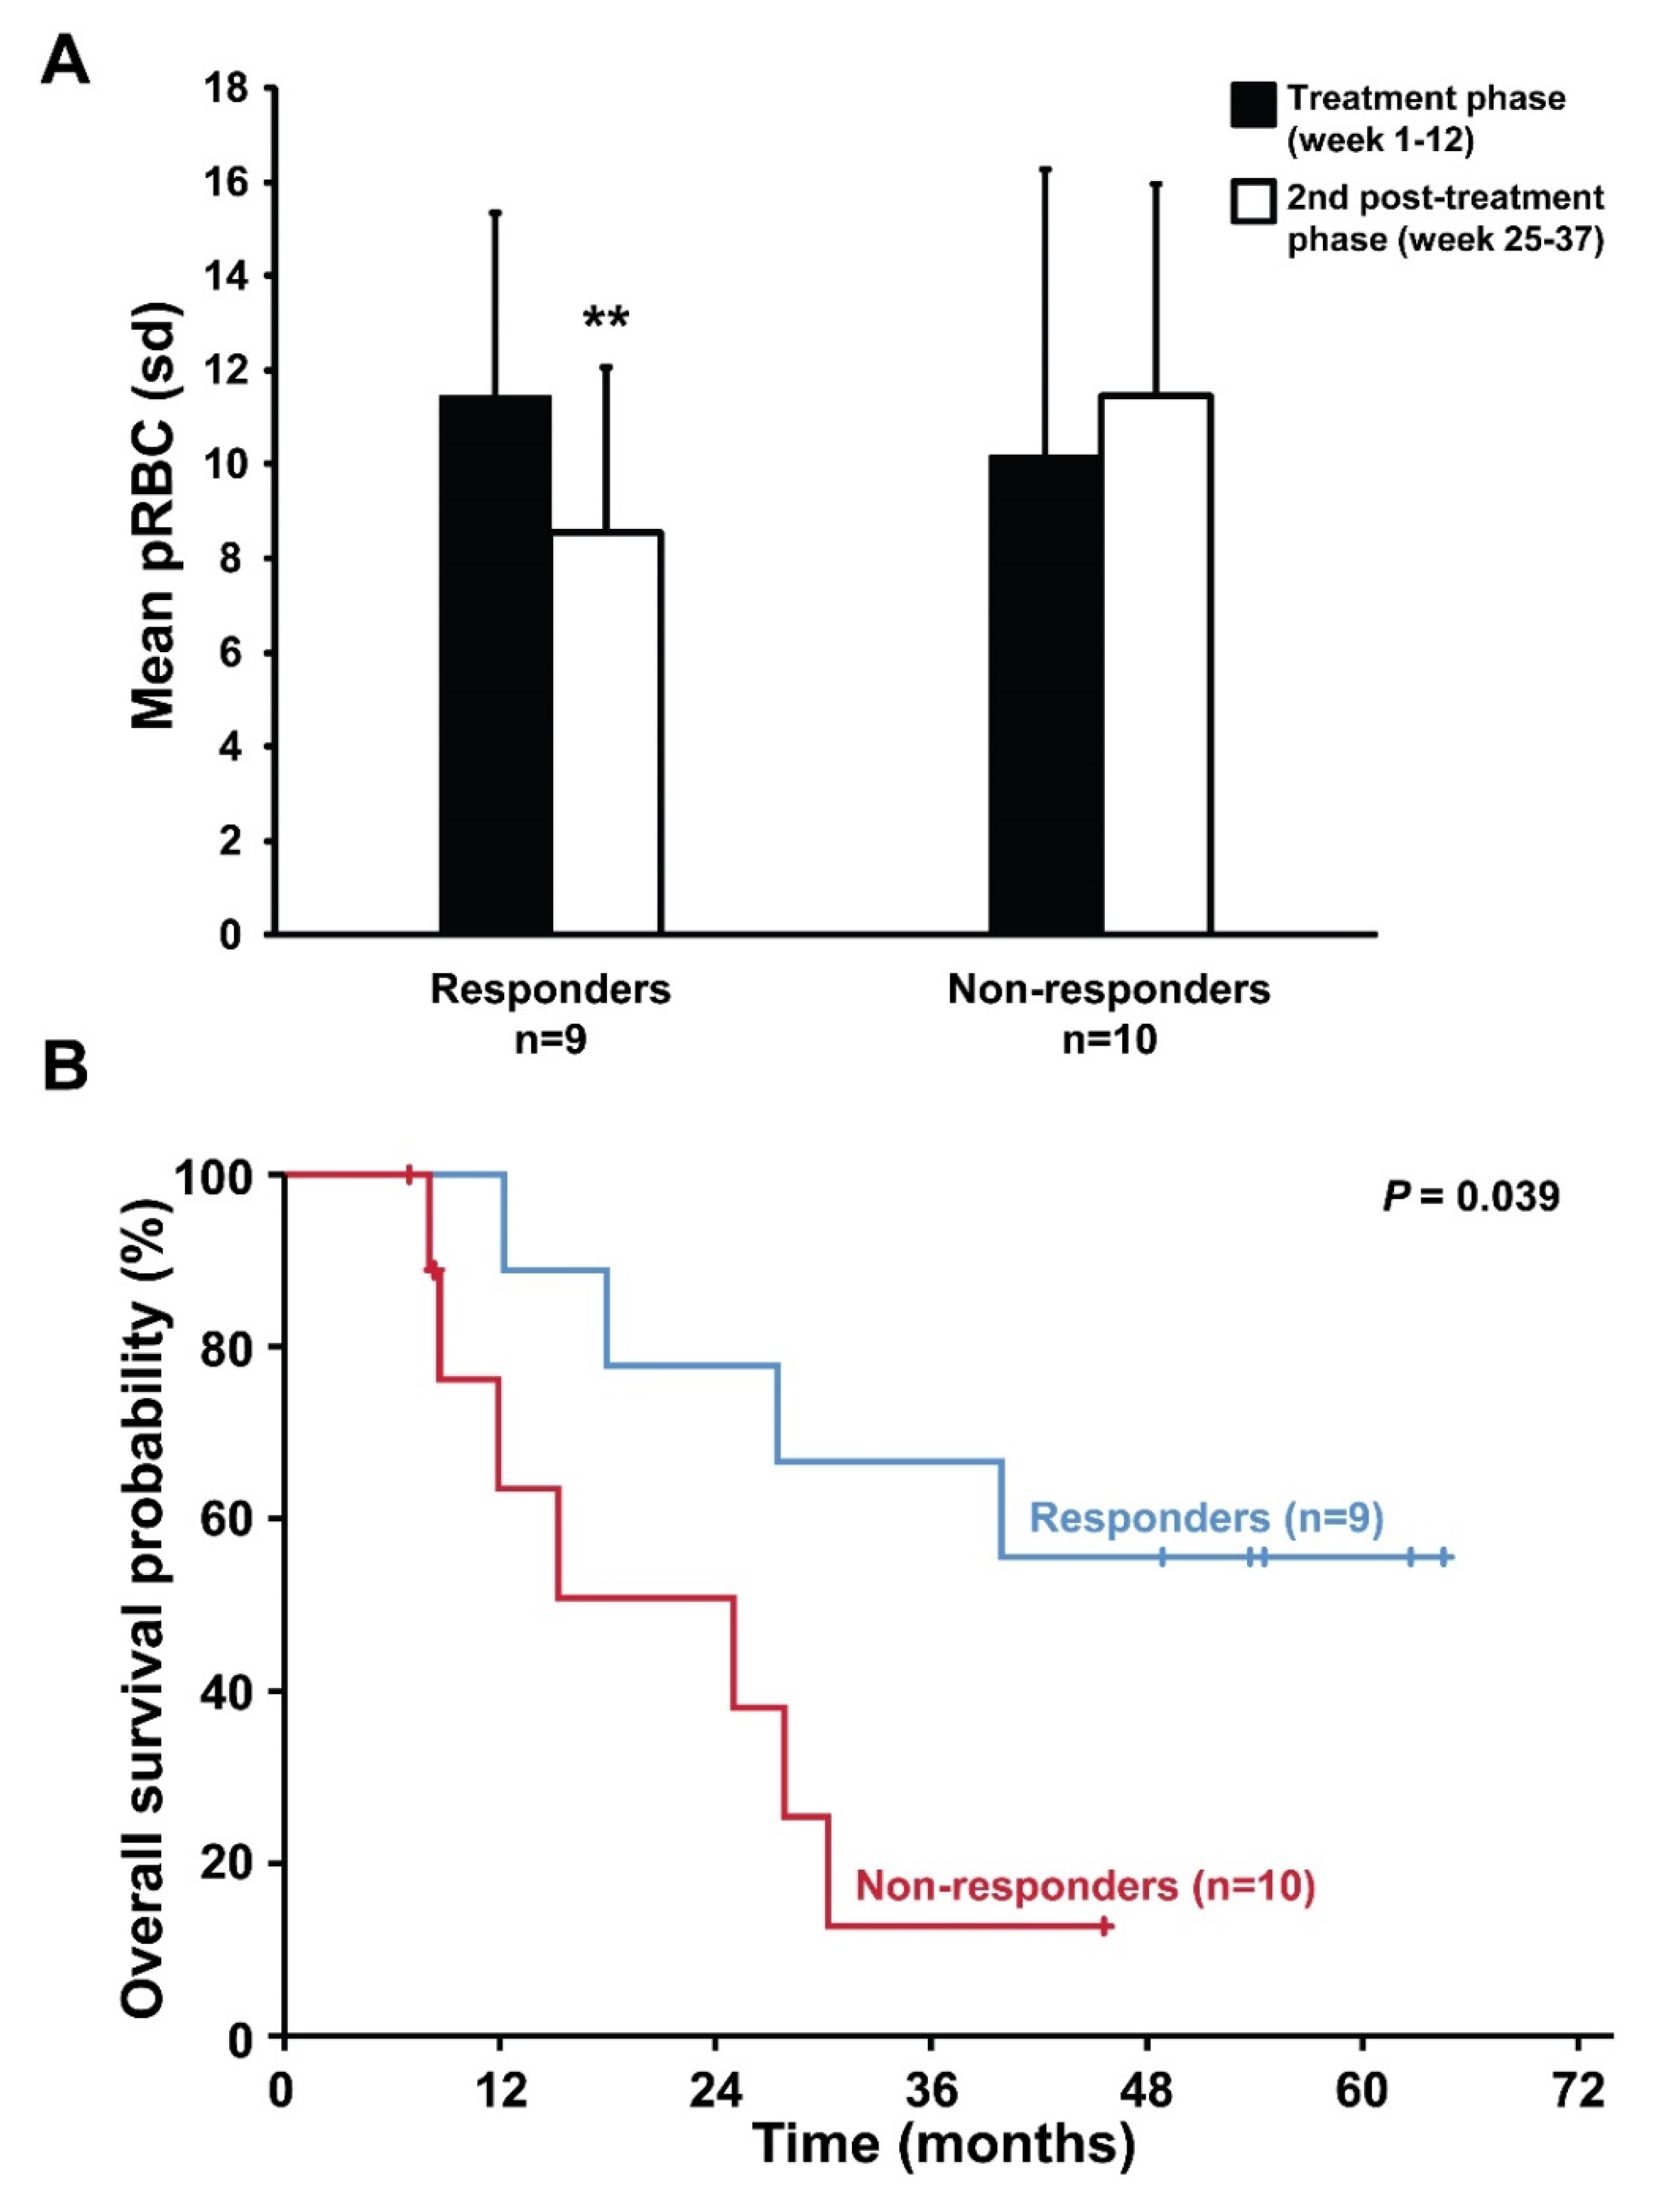
2.2. Response to Asunercept Treatment
2.3. Follow-up and Survival According to Treatment Response
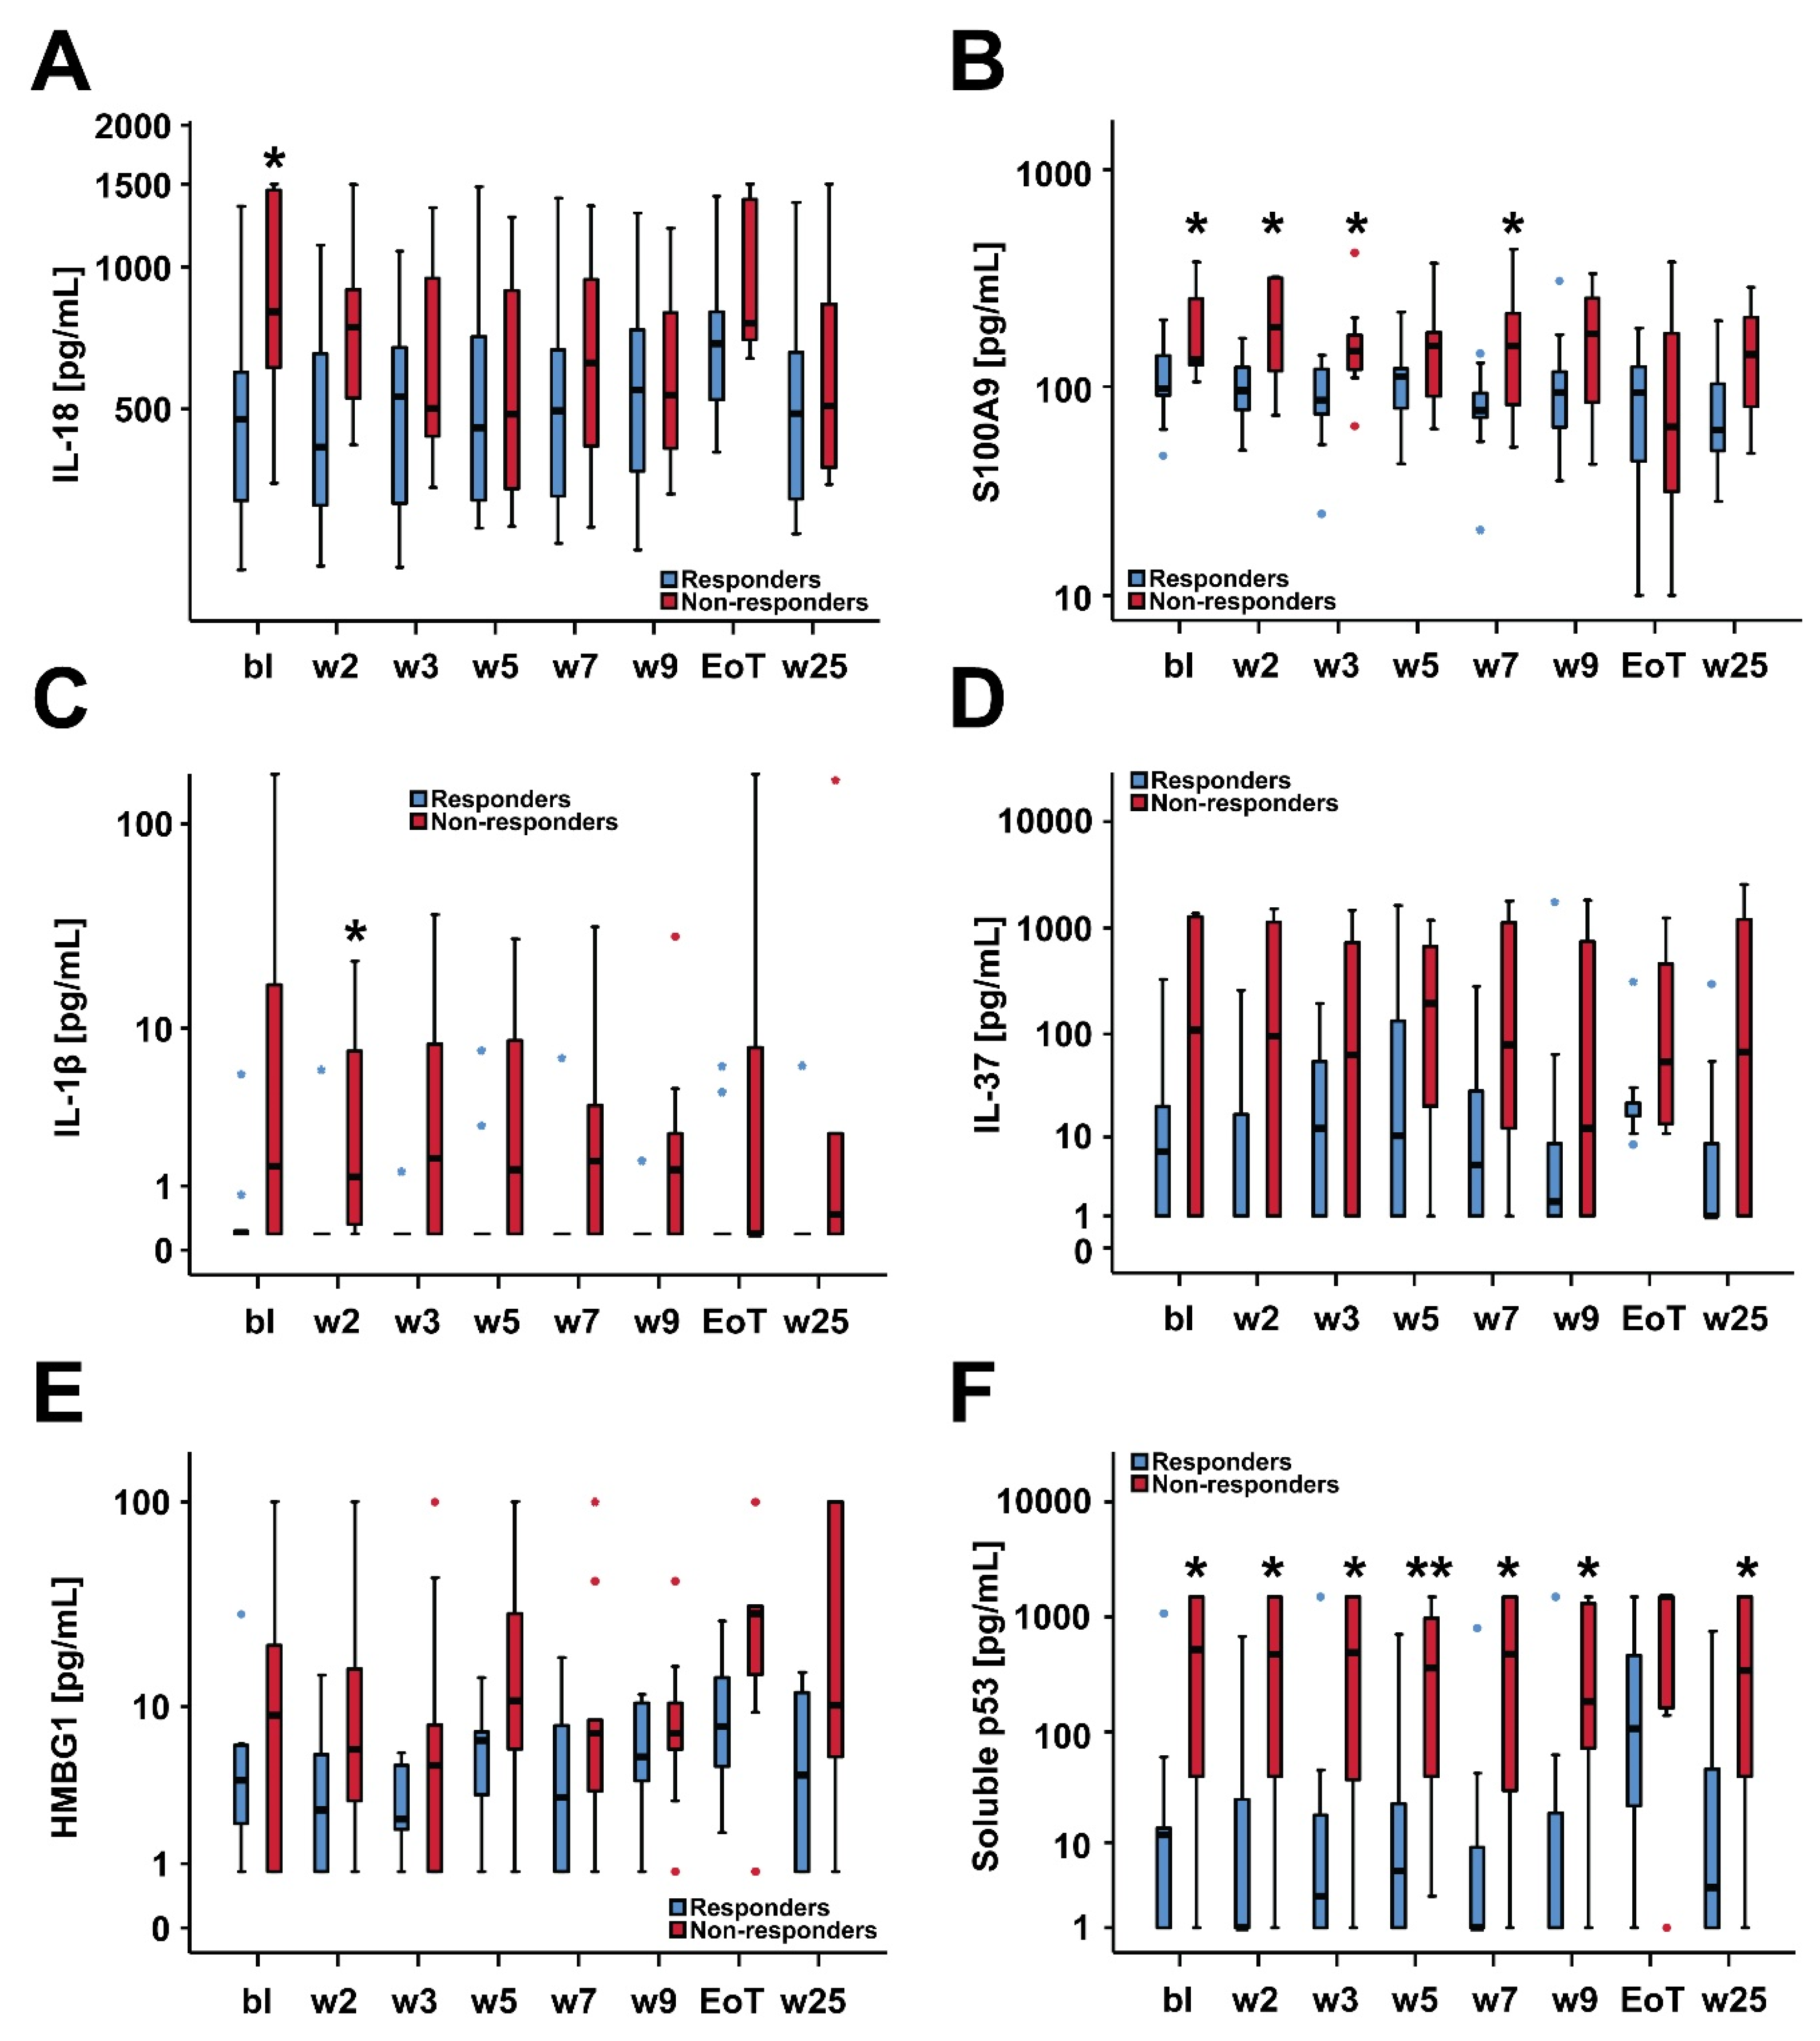
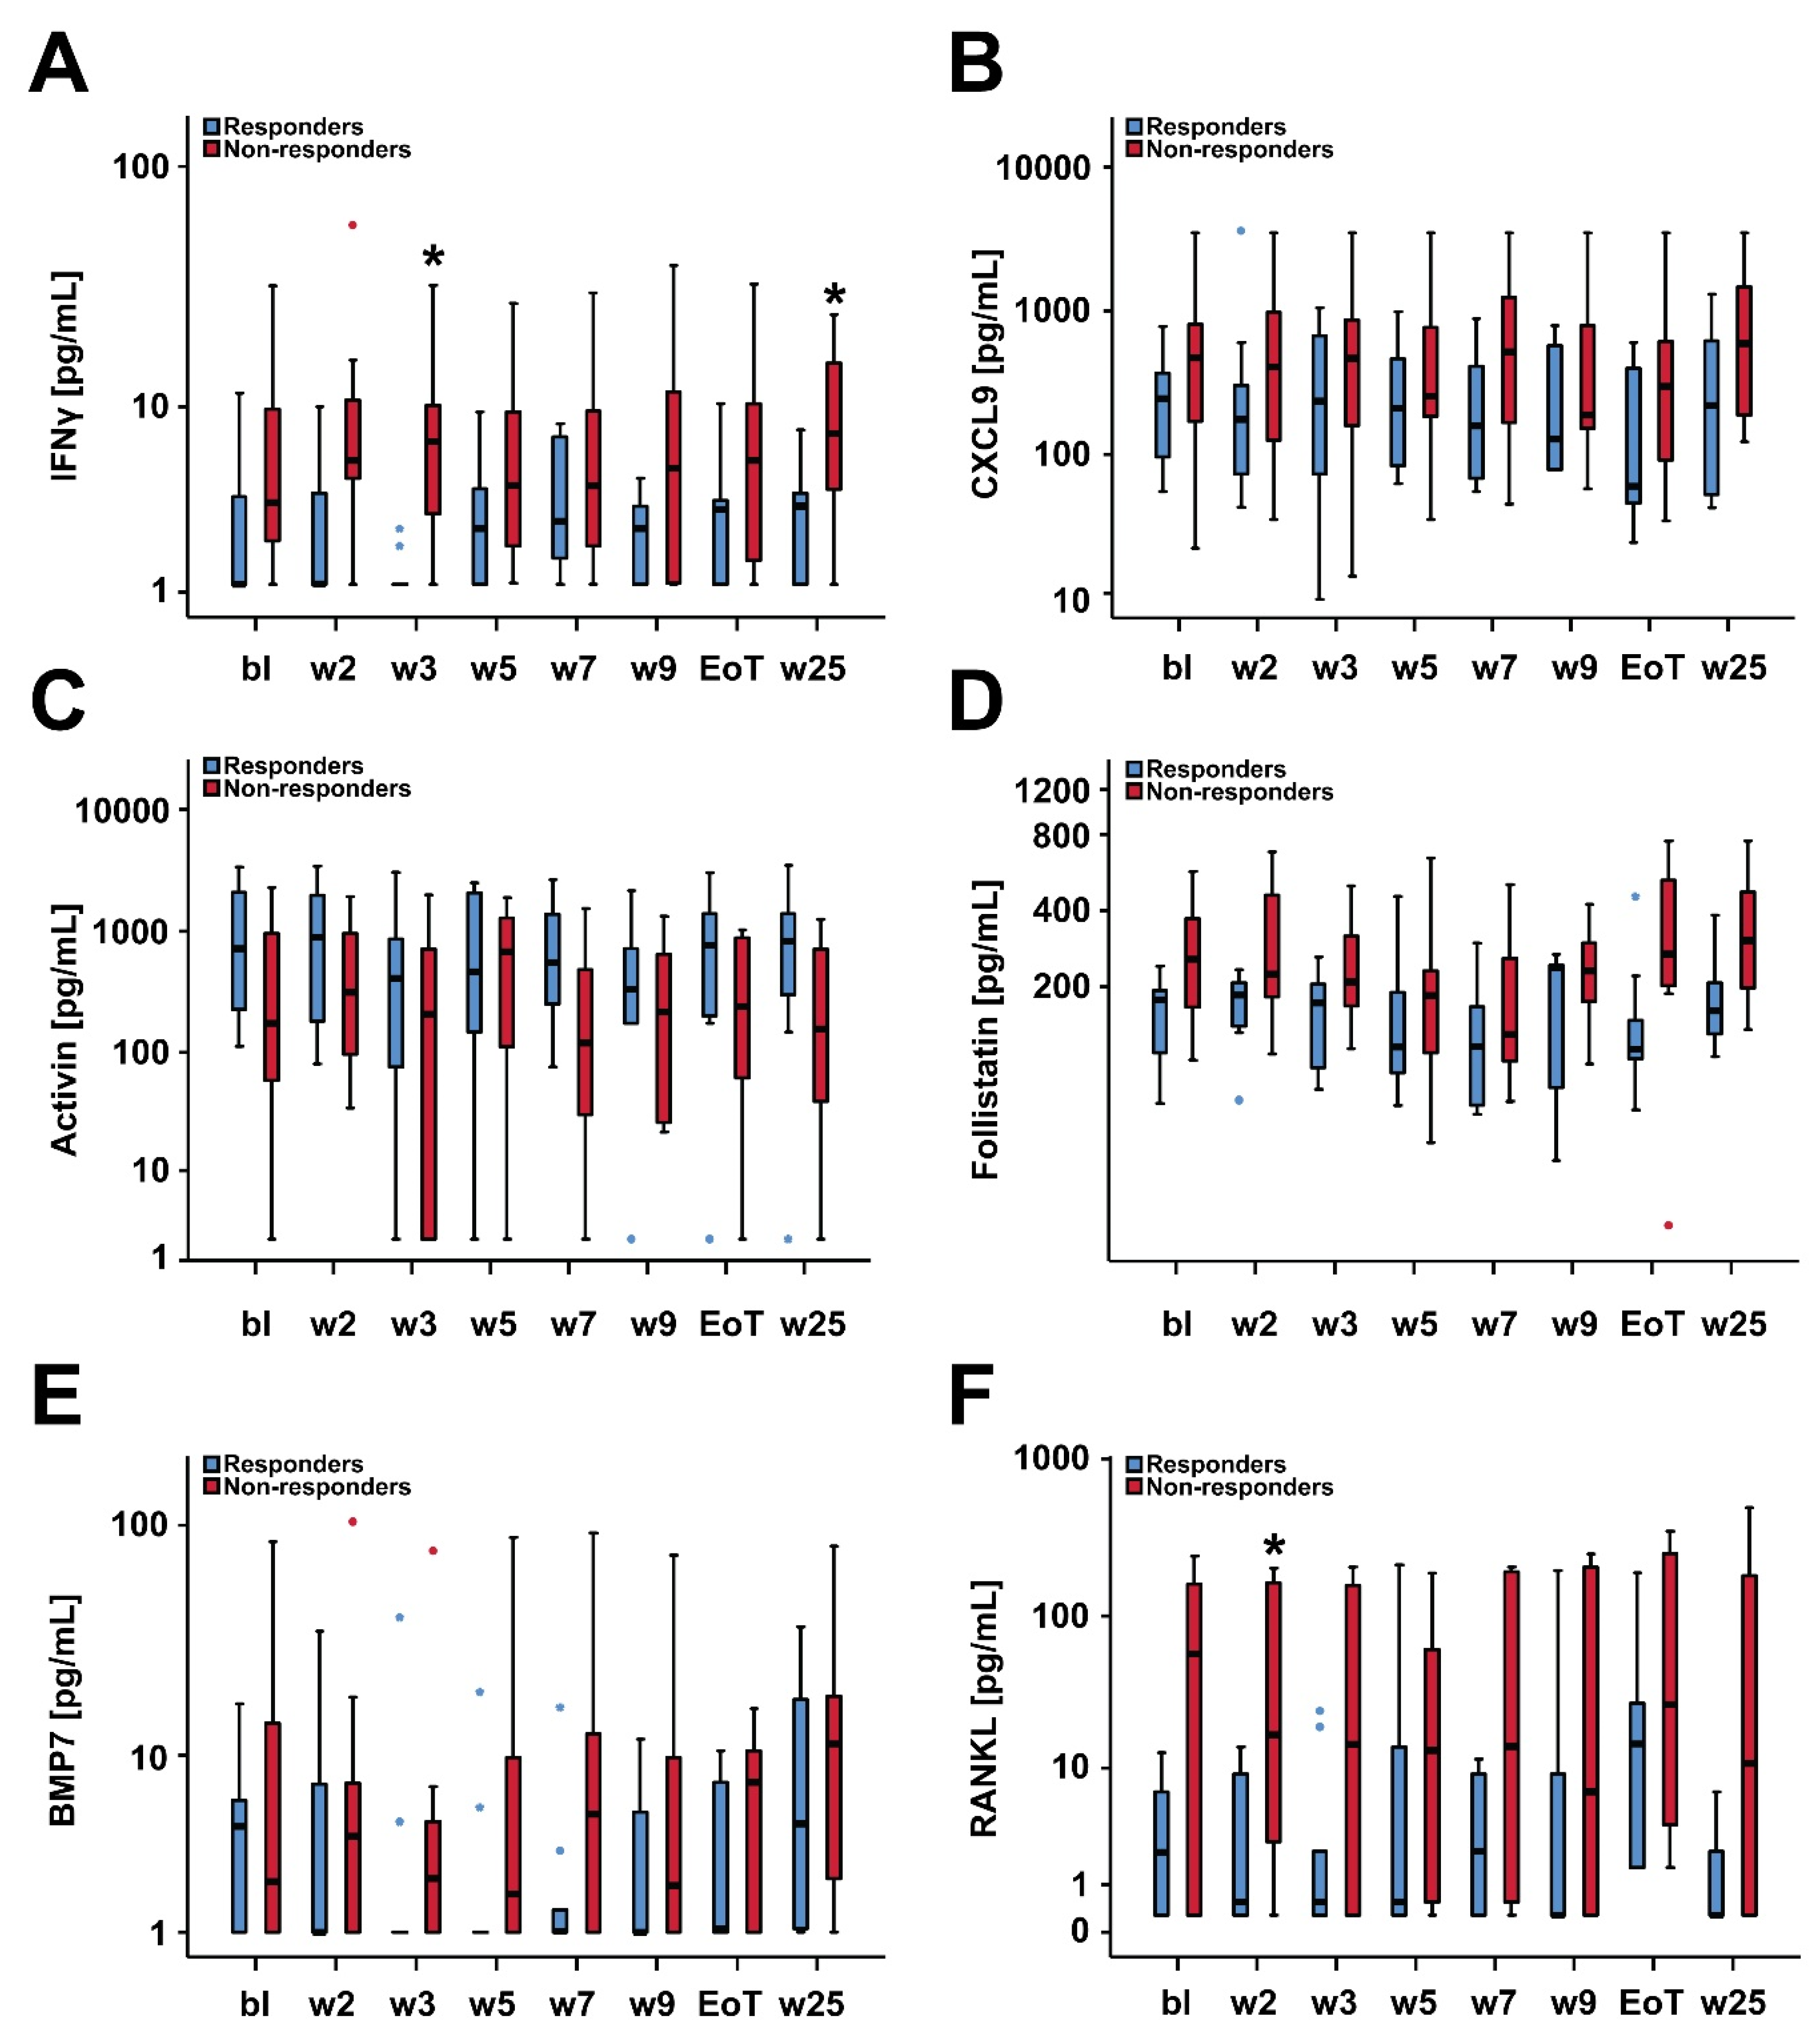
2.4. Biomarker Serum Levels and Response to Treatment with Asunercept
2.5. Survival and Baseline Serum Levels of IL-18, S100A9 and Soluble p53
3. Discussion
4. Materials and Methods
4.1. Study Design, Study Population, Treatment Schedule and Objectives
4.2. Collection of Serum Samples and Biomarker Assessments
4.3. Statistical Analysis
5. Conclusions
Author Contributions
Funding
Acknowledgments
Conflicts of Interest
References
- Steensma, D.P.; Bennett, J.M. The Myelodysplastic Syndromes: Diagnosis and Treatment. Mayo Clin. Proc. 2006, 81, 104–130. [Google Scholar] [CrossRef] [PubMed]
- Park, S.; Fenaux, P.; Greenberg, P.; Mehta, B.; Callaghan, F.; Kim, C.; Tomita, D.; Xu, H. Efficacy and safety of darbepoetin alpha in patients with myelodysplastic syndromes: A systematic review and meta-analysis. Br. J. Haematol. 2016, 174, 730–747. [Google Scholar] [CrossRef] [PubMed]
- Platzbecker, U.; Germing, U.; Götze, K.S.; Kiewe, P.; Mayer, K.; Chromik, J.; Radsak, M.; Wolff, T.; Zhang, X.; Laadem, A.; et al. Luspatercept for the treatment of anaemia in patients with lower-risk myelodysplastic syndromes (PACE-MDS): A multicentre, open-label phase 2 dose-finding study with long-term extension study. Lancet Oncol. 2017, 18, 1338–1347. [Google Scholar] [CrossRef]
- Fenaux, P.; Platzbecker, U.; Mufti, G.J.; Garcia-Manero, G.; Buckstein, R.; Santini, V.; Díez-Campelo, M.; Finelli, C.; Cazzola, M.; Ilhan, O.; et al. Luspatercept in Patients with Lower-Risk Myelodysplastic Syndromes. N. Engl. J. Med. 2020, 382, 140–151. [Google Scholar] [CrossRef] [PubMed]
- Frytak, J.R.; Henk, H.J.; De Castro, C.M.; Halpern, R.; Nelson, M. Estimation of economic costs associated with transfusion dependence in adults with MDS. Curr. Med Res. Opin. 2009, 25, 1941–1951. [Google Scholar] [CrossRef]
- Gattermann, N.; Hofmann, W.-K.; Meessen, A.; Schmitz, S.; Tsamaloukas, A.; Vollmer, T.; Wedding, U.; Plesnila-Frank, C.; Schramm, W.; Berger, K. Myelodysplastic Syndromes: Aspects of Current Medical Care and Economic Considerations in Germany. Oncol. Res. Treat. 2008, 31, 5. [Google Scholar] [CrossRef] [Green Version]
- Koulnis, M.; Liu, Y.; Hallstrom, K.; Socolovsky, M. Negative Autoregulation by Fas Stabilizes Adult Erythropoiesis and Accelerates Its Stress Response. PLoS ONE 2011, 6, e21192. [Google Scholar] [CrossRef]
- De Maria, R.; Zeuner, A.; Eramo, A.; Domenichelli, C.; Bonci, D.; Grignani, F.; Srinivasula, S.M.; Alnemri, E.S.; Testa, U.; Peschle, C. Negative regulation of erythropoiesis by caspase-mediated cleavage of GATA-1. Nat. Cell Biol. 1999, 401, 489–493. [Google Scholar] [CrossRef]
- Gupta, P.; Niehans, G.A.; Leroy, S.C.; Gupta, K.; Morrison, V.A.; Schultz, C.; Knapp, D.J.; Kratzke, R.A. Fas ligand expression in the bone marrow in myelodysplastic syndromes correlates with FAB subtype and anemia, and predicts survival. Leukemia 1999, 13, 44–53. [Google Scholar] [CrossRef] [Green Version]
- Gyan, E.; Frisan, E.; Beyne-Rauzy, O.; Deschemin, J.-C.; Pierre-Eugene, C.; Randriamampita, C.; Dubart-Kupperschmitt, A.; Garrido, C.; Dreyfus, F.; Mayeux, P.; et al. Spontaneous and Fas-induced apoptosis of low-grade MDS erythroid precursors involves the endoplasmic reticulum. Leukemia 2008, 22, 1864–1873. [Google Scholar] [CrossRef]
- Raimbault, A.; Pierre-Eugene, C.; Rouquette, A.; Deudon, C.; Willems, L.; Chapuis, N.; Mathis, S.; Kunz, C.; Fricke, H.; Kosmider, O.; et al. APG101 efficiently rescues erythropoiesis in lower risk myelodysplastic syndromes with severe impairment of hematopoiesis. Oncotarget 2016, 7, 14898–14911. [Google Scholar] [CrossRef] [PubMed]
- Boch, T.; Luft, T.; Metzgeroth, G.; Mossner, M.; Jann, J.-C.; Nowak, D.; La Meir, F.; Schumann, C.; Klemmer, J.; Brendel, S.; et al. Safety and efficacy of the CD95-ligand inhibitor asunercept in transfusion-dependent patients with low and intermediate risk MDS. Leuk. Res. 2018, 68, 62–69. [Google Scholar] [CrossRef] [PubMed]
- Bataller, A.; Montalban-Bravo, G.; Soltysiak, K.A.; Garcia-Manero, G. The role of TGFβ in hematopoiesis and myeloid disorders. Leukemia 2019, 33, 1076–1089. [Google Scholar] [CrossRef] [PubMed]
- Bewersdorf, J.P.; Zeidan, A.M. Transforming growth factor (TGF)-β pathway as a therapeutic target in lower risk myelodysplastic syndromes. Leukemia 2019, 33, 1303–1312. [Google Scholar] [CrossRef]
- Bock, O.; Loch, G.; Schade, U.; Büsche, G.; Wasielewski, R.; Wiese, B.; Kreipe, H. Osteosclerosis in advanced chronic idiopathic myelofibrosis is associated with endothelial overexpression of osteoprotegerin. Br. J. Haematol. 2005, 130, 76–82. [Google Scholar] [CrossRef] [PubMed]
- Ramos, F.; Robledo, C.; Izquierdo-García, F.M.; Suárez-Vilela, D.; Benito, R.; Fuertes, M.; Insunza, A.; Barragán, E.; Del Rey, M.; De Morales, J.M.G.-R.; et al. Bone marrow fibrosis in myelodysplastic syndromes: A prospective evaluation including mutational analysis. Oncotarget 2016, 7, 30492–30503. [Google Scholar] [CrossRef] [Green Version]
- De Bruin, A.M.; Voermans, C.; Nolte, M.A. Impact of interferon-γ on hematopoiesis. Blood 2014, 124, 2479–2486. [Google Scholar] [CrossRef] [Green Version]
- Sallman, D.A.; Cluzeau, T.; Basiorka, A.A.; List, A. Unraveling the Pathogenesis of MDS: The NLRP3 Inflammasome and Pyroptosis Drive the MDS Phenotype. Front. Oncol. 2016, 6, 151. [Google Scholar] [CrossRef]
- Benjamini, Y.; Hochberg, Y. Controlling the false discovery rate: A practical and powerful approach to multiple hypothesis testing. J. R. Stat. Soc. B. 1995, 57, 289–300. [Google Scholar] [CrossRef]
- Cogle, C.R.; Saki, N.; Khodadi, E.; Li, J.; Shahjahani, M.; Azizidoost, S. Bone marrow niche in the myelodysplastic syndromes. Leuk. Res. 2015, 39, 1020–1027. [Google Scholar] [CrossRef]
- Yang, L.; Qian, Y.; Eksioglu, E.; Epling-Burnette, P.K.; Wei, S. The inflammatory microenvironment in MDS. Cell. Mol. Life Sci. 2015, 72, 1959–1966. [Google Scholar] [CrossRef] [PubMed]
- Lambert, C.; Wu, Y.; Aanei, C. Bone Marrow Immunity and Myelodysplasia. Front. Oncol. 2016, 6, 172. [Google Scholar] [CrossRef] [PubMed] [Green Version]
- Ivy, K.S.; Ferrell, P.B. Disordered Immune Regulation and its Therapeutic Targeting in Myelodysplastic Syndromes. Curr. Hematol. Malign Rep. 2018, 13, 244–255. [Google Scholar] [CrossRef] [PubMed]
- Basiorka, A.A.; McGraw, K.L.; Eksioglu, E.A.; Chen, X.; Johnson, J.; Zhang, L.; Zhang, Q.; Irvine, B.A.; Cluzeau, T.; Sallman, D.A.; et al. The NLRP3 inflammasome functions as a driver of the myelodysplastic syndrome phenotype. Blood 2016, 128, 2960–2975. [Google Scholar] [CrossRef]
- Cluzeau, T.; McGraw, K.L.; Irvine, B.; Masala, E.; Ades, L.; Basiorka, A.A.; Maciejewski, J.; Auberger, P.; Wei, S.; Fenaux, P.; et al. Pro-inflammatory proteins S100A9 and tumor necrosis factor-α suppress erythropoietin elaboration in myelodysplastic syndromes. Haematologica 2017, 102, 2015–2020. [Google Scholar] [CrossRef] [Green Version]
- Shi, L.; Zhao, Y.; Fei, C.; Guo, J.; Jia, Y.; Wu, D.; Wu, L.; Chang, C. Cellular senescence induced by S100A9 in mesenchymal stromal cells through NLRP3 inflammasome activation. Aging 2019, 11, 9626–9642. [Google Scholar] [CrossRef]
- Chen, X.; Eksioglu, E.A.; Zhou, J.; Zhang, L.; Djeu, J.; Fortenbery, N.; Epling-Burnette, P.; Van Bijnen, S.; Dolstra, H.; Cannon, J.; et al. Induction of myelodysplasia by myeloid-derived suppressor cells. J. Clin. Investig. 2013, 123, 4595–4611. [Google Scholar] [CrossRef]
- Lim, H.X.; Hong, H.-J.; Cho, D.; Kim, T.S. IL-18 Enhances Immunosuppressive Responses by Promoting Differentiation into Monocytic Myeloid-Derived Suppressor Cells. J. Immunol. 2014, 193, 5453–5460. [Google Scholar] [CrossRef] [Green Version]
- Tsutsui, H.; Matsui, K.; Okamura, H.; Nakanishi, K. Pathophysiological roles of interleukin-18 in inflammatory liver diseases. Immunol. Rev. 2000, 174, 192–209. [Google Scholar] [CrossRef]
- Bossaller, L.; Chiang, P.-I.; Schmidt-Lauber, C.; Ganesan, S.; Kaiser, W.J.; Rathinam, V.A.K.; Mocarski, E.S.; Subramanian, D.; Green, D.R.; Silverman, N.; et al. Cutting Edge: FAS (CD95) Mediates Noncanonical IL-1β and IL-18 Maturation via Caspase-8 in an RIP3-Independent Manner. J. Immunol. 2012, 189, 5508–5512. [Google Scholar] [CrossRef] [Green Version]
- Musto, P.; Matera, R.; Minervini, M.M.; Ambrosio, C.C.-D.; Bodenizza, C.; Falcone, A.; Carotenuto, M. Low serum levels of tumor necrosis factor and interleukin-1 beta in myelodysplastic syndromes responsive to recombinant erythropoietin. Haematologica 1994, 79, 265–268. [Google Scholar] [PubMed]
- Stasi, R.; Brunetti, M.; Bussa, S.; Conforti, M.; Martin, L.S.; La Presa, M.; Bianchi, M.; Parma, A.; Pagano, A. Serum levels of tumour necrosis factor-α predict response to recombinant human erythropoietin in patients with myelodysplastic syndrome. Clin. Lab. Haematol. 1997, 19, 197–201. [Google Scholar] [CrossRef] [PubMed]
- Trümper, L.; Jung, W.; Dahl, G.; Diehl, V.; Gause, A.; Pfreundschuh, M. Interleukin-7, interleukin-8, soluble TNF receptor, and p53 protein levels are elevated in the serum of patients with Hodgkin’s disease. Ann. Oncol. 1994, 5, 93–96. [Google Scholar] [CrossRef] [PubMed]
- Del Principe, M.I.; Del Poeta, G.; Venditti, A.; Lococo, F.; Maurillo, L.; Marini, R.; Cox, M.C.; Panetta, P.; Suppo, G.; Degan, M.; et al. Clinical significance of soluble p53 protein in B-cell chronic lymphocytic leukemia. Haematologica 2004, 89, 1468–1475. [Google Scholar] [PubMed]
- Haasken, S.; Sutterwala, F.S. Damage control: Management of cellular stress by the NLRP3 inflammasome. Eur. J. Immunol. 2013, 43, 2003–2005. [Google Scholar] [CrossRef]
- Hartmann, N.; Messmann, J.J.; Leithäuser, F.; Weiswange, M.; Kluge, M.; Fricke, H.; Debatin, K.-M.; Strauss, G. Recombinant CD95-Fc (APG101) prevents graft-versus-host disease in mice without disabling antitumor cytotoxicity and T-cell functions. Blood 2013, 121, 556–565. [Google Scholar] [CrossRef]
- Malcovati, L.; Germing, U.; Kuendgen, A.; Della Porta, M.G.; Pascutto, C.; Invernizzi, R.; Giagounidis, A.; Hildebrandt, B.; Bernasconi, P.; Knipp, S.; et al. Time-Dependent Prognostic Scoring System for Predicting Survival and Leukemic Evolution in Myelodysplastic Syndromes. J. Clin. Oncol. 2007, 25, 3503–3510. [Google Scholar] [CrossRef]
- Hellstrom-Lindberg, E.; Negrin, R.; Stein, R.; Krantz, S.; Lindberg, G.; Vardiman, J.; Ost, A.; Greenberg, P. Erythroid response to treatment with G-CSF plus erythropoietin for the anaemia of patients with myelodysplastic syndromes: Proposal for a predictive model. Br. J. Haematol. 1997, 99, 344–351. [Google Scholar] [CrossRef]
- Schemper, M.; Smith, T.L. A note on quantifying follow-up in studies of failure time. Control. Clin. Trials 1996, 17, 343–346. [Google Scholar] [CrossRef]

| Entire Cohort n = 19 | Non-Responders n = 10 | Responders n = 9 | p | |
|---|---|---|---|---|
| Median age (years, range) | 75 (56–82) | 75 (56–77) | 76 (62–82) | 0.901 |
| Age category, n (%) | 0.582 | |||
| <65 years | 3 (16) | 1 (10) | 2 (22) | |
| ≥65 years | 16 (84) | 10 (90) | 7 (78) | |
| Sex, n (%) | 0.999 | |||
| Male | 12 (63) | 6 (60) | 6 (67) | |
| Female | 7 (37) | 4 (40) | 3 (33) | |
| ECOG at baseline, n (%) | 0.482 | |||
| 0 | 7 (41) | 2 (25) | 5 (56) | |
| 1 | 6 (35) | 3 (38) | 3 (33) | |
| 2 | 3 (18) | 2 (25) | 1 (11) | |
| 3 | 1 (6) | 1 (13) | 0 (0) | |
| Missing | 2 | 2 | ||
| WHO subtype, n (%) | 0.211 | |||
| RARS | 1 (5) | 0 (0) | 1 (11) | |
| RCMD | 16 (84) | 9 (90) | 7 (78) | |
| RCMD-RS | 1 (5) | 1 (10) | 0 (0) | |
| Del5q | 1 (5) | 0 (0) | 1 (11) | |
| Median time since first MDS diagnosis, months (range) | 17.0 (0.9–118.2) | 14.4 (7.1–39.7) | 25.5 (0.9–118.2) | 0.713 |
| Cytogenetic risk, n (%) | 0.999 | |||
| Low | 17 (90) | 9 (90) | 8 (89) | |
| Intermediate | 2 (10) | 1 (10) | 1 (11) | |
| High | 0 (0) | 0 (0) | 0 (0) | |
| WPSS sum score, n (%) | 0.211 | |||
| 1 | 2 (11) | 0 (0) | 2 (22) | |
| 2 | 16 (85) | 9 (90) | 7 (78) | |
| 3 | 1 (5) | 1 (10) | 0 (0) | |
| Asunercept dose, n (%) | 0.628 | |||
| 100 mg | 13 (68) | 6 (60) | 7 (78) | |
| 400 mg | 6 (32) | 4 (70) | 2 (22) | |
| Median CRP serum level at baseline (mg/L, range) | 4.4 (2.0–25.6) | 6.1 (2.0–25.6) | 2.6 (2.0–11.6) | 0.026 |
| Median ANC at baseline (1/nL, range) | 1.9 (0.5–5.8) | 2.6 (0.5–5.8) | 1.8 (1.1–3.1) | 0.728 |
| Median absolute lymphocyte count at baseline (1/nL, range) | 0.9 (0.3–3.4) | 0.9 (0.3–3.4) | 0.8 (0.7–1.3) | 0.642 |
| Median endogenous Epo serum level at baseline (U/L, range) | 157 (6–3499) | 157 (6–3499) | 284 (30–2147) | 0.989 |
| Responders (n = 10) | Non-responders (n = 9) | |||
|---|---|---|---|---|
| Median (IQR) | Median (IQR) | p | Adjusted p * | |
| IL-18 | 475.5 (319.3–599.1) | 804.6 (625.3–1341.9) | 0.018 | 0.136 |
| IFNγ | 1.2 (1.1–3.8) | 3.6 (2.2–8.7) | 0.131 | 0.204 |
| CXCL9 | 245.5 (95.7–368.3) | 470.6 (181.4–788.0) | 0.165 | 0.204 |
| S100A9 | 97.5 (90.9–139.2) | 133.2 (126.7–244.8) | 0.034 | 0.136 |
| IL-1β | 0.1 (0.1–0.2) | 1.5 (0.1–13.0) | 0.167 | 0.204 |
| HMGB1 | 4.0 (2.9–6.2) | 9.0 (1.9–18.0) | 0.373 | 0.407 |
| IL-37 | 7.0 (1.1–20.2) | 353.4 (3.3–1229.2) | 0.155 | 0.204 |
| Activin | 714.3 (227.2–2086.1) | 173.8 (58.6–958.8) | 0.145 | 0.204 |
| Follistatin | 177.5 (109.3–192.5) | 256.6 (165.8–371.2) | 0.058 | 0.174 |
| Follistatin/Activin | 0.21 (0.10–0.41) | 1.23 (0.14–2.80) | 0.186 | - |
| BMP7 | 4.5 (1.0–6.1) | 2.3 (1.0–13.9) | 0.750 | 0.750 |
| RANKL | 2.2 (0.3–6.7) | 56.8 (0.3–159.5) | 0.170 | 0.204 |
| sP53 | 11.8 (1.1–13.6) | 795.2 (48.2–1500) | 0.024 | 0.136 |
| IL-18 | IFNγ | CXCL9 | S100A9 | IL-1β | HMGB1 | IL-37 | Activin | Follistatin | BMP7 | RANKL | sP53 | |
|---|---|---|---|---|---|---|---|---|---|---|---|---|
| IL-18 | - | |||||||||||
| IFNγ | 0.514 * | - | ||||||||||
| CXCL9 | 0.593 ** | 0.422 | - | |||||||||
| S100A9 | 0.263 | 0.523 * | 0.209 | - | ||||||||
| IL-1β | 0.256 | 0.453 | 0.666 ** | 0.517 * | - | |||||||
| HMGB1 | 0.210 | 0.553 * | 0.545 * | 0.353 | 0.911 *** | - | ||||||
| IL-37 | 0.273 | 0.471 * | 0.669 ** | 0.516 * | 0.835 *** | 0.762 *** | - | |||||
| Activin | −0.531 * | −0.130 | 0.115 | −0.391 | 0.279 | 0.339 | 0.284 | - | ||||
| Follistatin | 0.577 * | 0.408 | 0.472 * | 0.253 | 0.272 | 0.199 | 0.137 | −0.488 * | - | |||
| BMP7 | −0.040 | 0.209 | 0.168 | −0.203 | −0.011 | 0.165 | −0.092 | 0.293 | −0.063 | - | ||
| RANKL | 0.252 | 0.332 | 0.665 ** | 0.297 | 0.716 *** | 0.666 ** | 0.894 *** | 0.185 | 0.424 | −0.173 | - | |
| sP53 | 0.393 | 0.453 | 0.643 ** | 0.447 | 0.760 *** | 0.672 ** | 0.854 *** | 0.116 | 0.296 | −0.035 | 0.823 *** | - |
| Odds Ratio per log2 Increase * in Baseline Cytokine | Area under the ROC Curve (AUC) | |||
|---|---|---|---|---|
| OR (95% CI) | p | AUC (95% CI) | p | |
| IL-18 | 4.94 (1.00–24.47) | 0.049 | 0.82 (0.63–1.00) | 0.018 |
| IFNγ | 1.81 (0.85–3.88) | 0.124 | 0.72 (0.48–0.96) | 0.111 |
| CXCL9 | 1.41 (0.80–2.49) | 0.234 | 0.69 (0.44–0.94) | 0.165 |
| S100A9 | 7.44 (0.90–61.38) | 0.060 | 0.79 (0.57–1.00) | 0.034 |
| IL-1β | 1.87 (0.73–4.84) | 0.194 | 0.68 (0.43–0.93) | 0.191 |
| HMGB1 | 1.26 (0.75–2.11) | 0.391 | 0.63 (0.35–0.90) | 0.141 |
| IL-37 | 1.22 (0.95–1.57) | 0.122 | 0.69 (0.44–0.94) | 0.126 |
| Activin | 0.72 (0.45–1.15) | 0.167 | 0.30 (0.05–0.54) | 0.145 |
| Follistatin | 4.75 (0.88–25.63) | 0.070 | 0.77 (0.53–1.00) | 0.058 |
| Follistatin/Activin | 1.44 (0.88–2.35) | 0.150 | 0.71 (0.43–0.98) | 0.169 |
| BMP7 | 1.12 (0.68–1.86) | 0.651 | 0.53 (0.24–0.81) | 0.860 |
| RANKL | 1.45 (0.97–2.18) | 0.069 | 0.70 (0.45–0.96) | 0.145 |
| Soluble P53 | 1.31 (1.00–1.70) | 0.047 | 0.80 (0.59–1.00) | 0.027 |
Publisher’s Note: MDPI stays neutral with regard to jurisdictional claims in published maps and institutional affiliations. |
© 2020 by the authors. Licensee MDPI, Basel, Switzerland. This article is an open access article distributed under the terms and conditions of the Creative Commons Attribution (CC BY) license (http://creativecommons.org/licenses/by/4.0/).
Share and Cite
Radujkovic, A.; Boch, T.; Nolte, F.; Nowak, D.; Kunz, C.; Gieffers, A.; Müller-Tidow, C.; Dreger, P.; Hofmann, W.-K.; Luft, T. Clinical Response to the CD95-Ligand Inhibitor Asunercept Is Defined by a Pro-Inflammatory Serum Cytokine Profile. Cancers 2020, 12, 3683. https://doi.org/10.3390/cancers12123683
Radujkovic A, Boch T, Nolte F, Nowak D, Kunz C, Gieffers A, Müller-Tidow C, Dreger P, Hofmann W-K, Luft T. Clinical Response to the CD95-Ligand Inhibitor Asunercept Is Defined by a Pro-Inflammatory Serum Cytokine Profile. Cancers. 2020; 12(12):3683. https://doi.org/10.3390/cancers12123683
Chicago/Turabian StyleRadujkovic, Aleksandar, Tobias Boch, Florian Nolte, Daniel Nowak, Claudia Kunz, Alexandra Gieffers, Carsten Müller-Tidow, Peter Dreger, Wolf-Karsten Hofmann, and Thomas Luft. 2020. "Clinical Response to the CD95-Ligand Inhibitor Asunercept Is Defined by a Pro-Inflammatory Serum Cytokine Profile" Cancers 12, no. 12: 3683. https://doi.org/10.3390/cancers12123683
APA StyleRadujkovic, A., Boch, T., Nolte, F., Nowak, D., Kunz, C., Gieffers, A., Müller-Tidow, C., Dreger, P., Hofmann, W.-K., & Luft, T. (2020). Clinical Response to the CD95-Ligand Inhibitor Asunercept Is Defined by a Pro-Inflammatory Serum Cytokine Profile. Cancers, 12(12), 3683. https://doi.org/10.3390/cancers12123683