Article

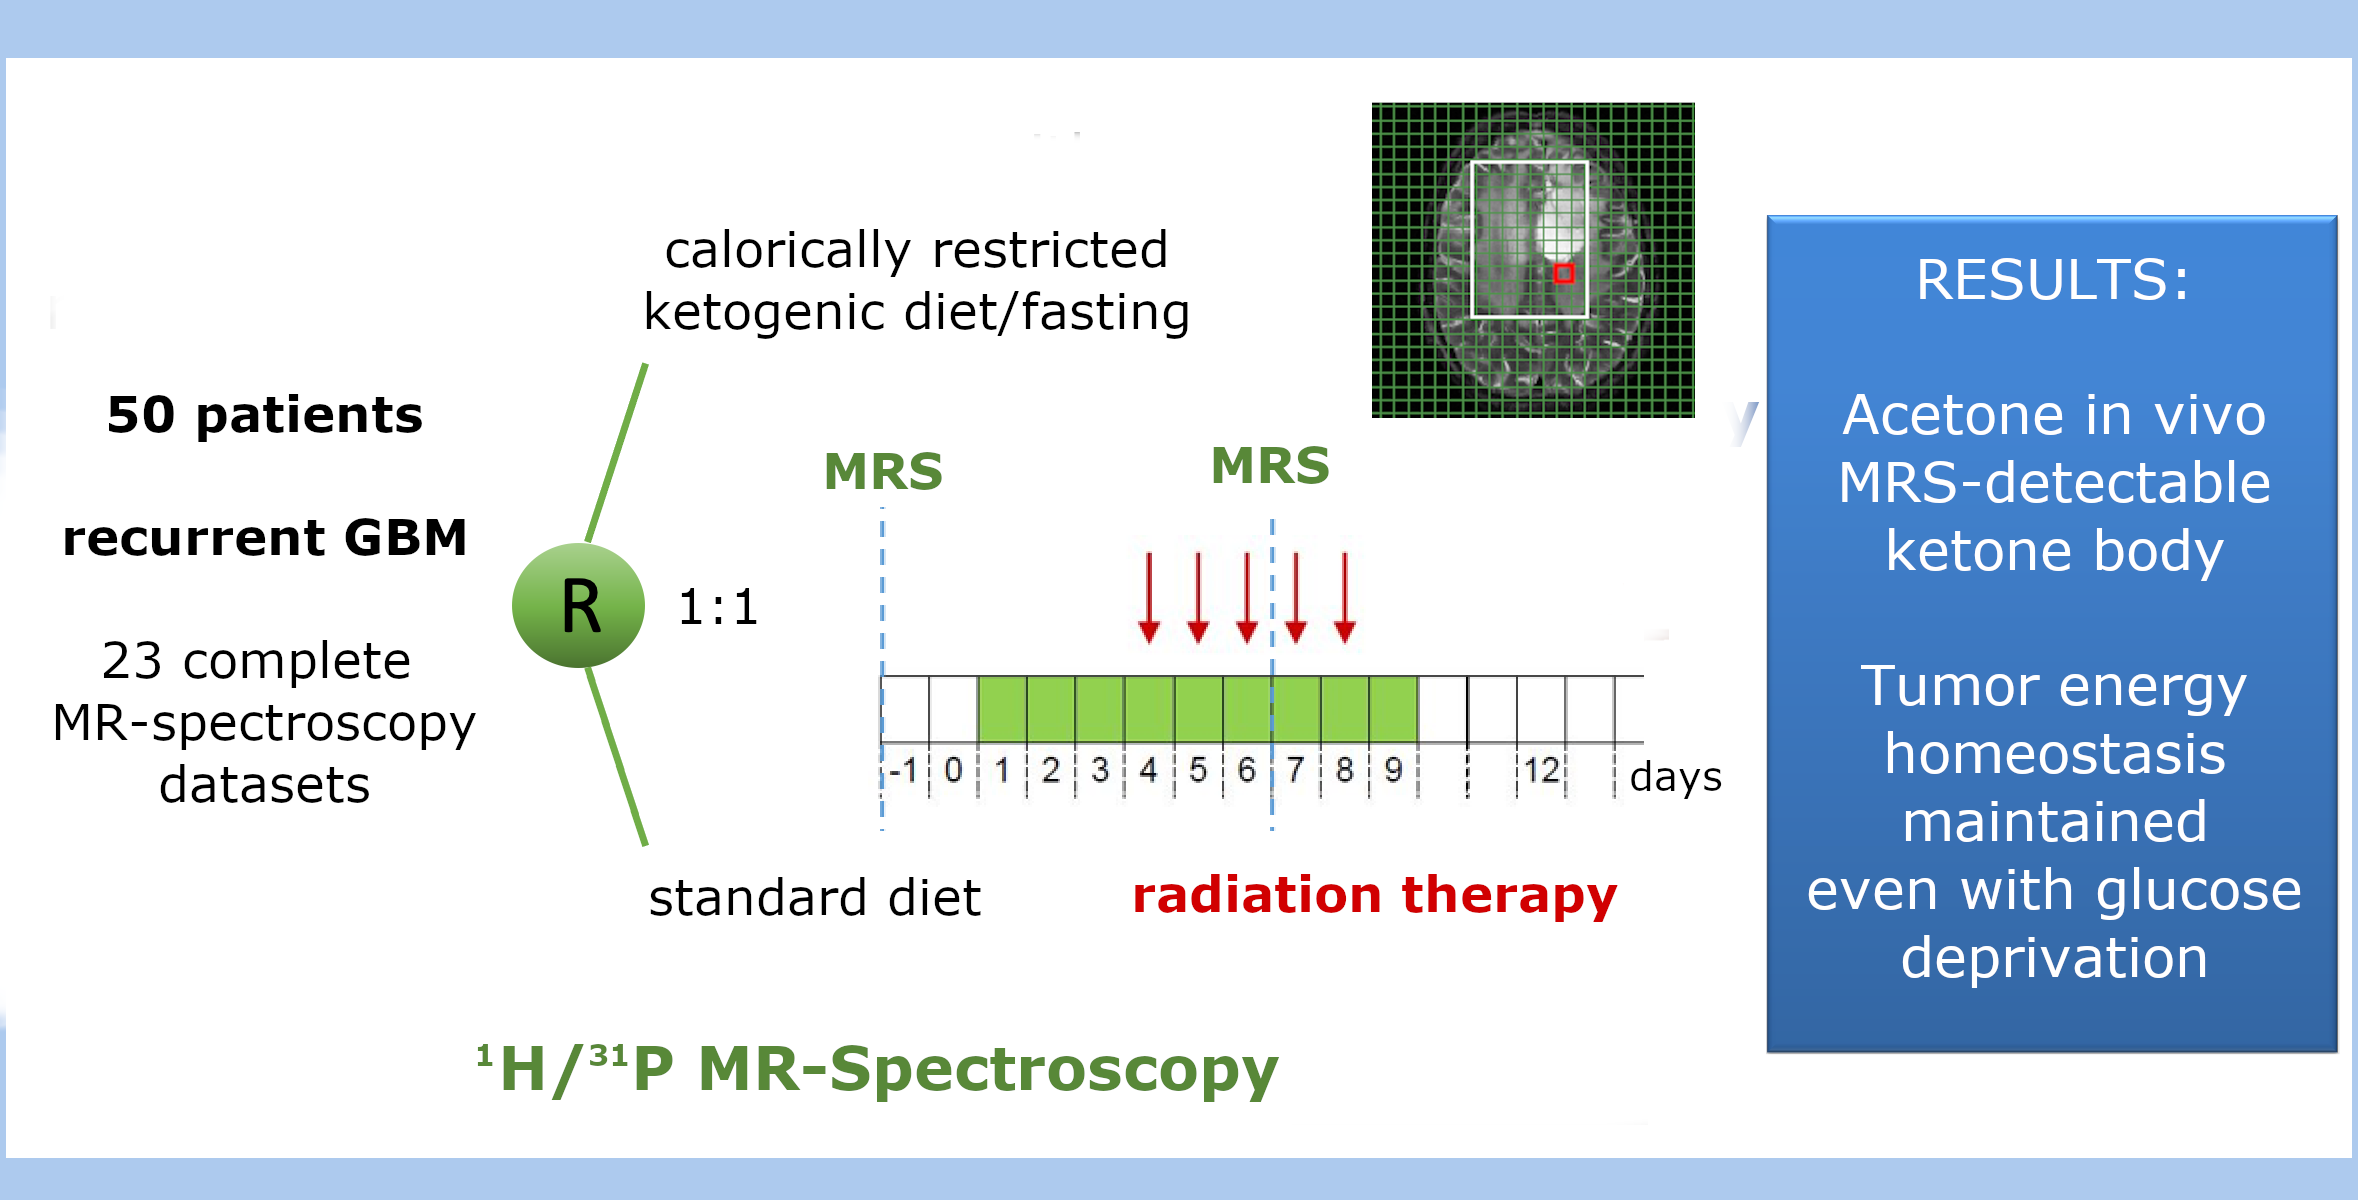
Maintenance of Energy Homeostasis during Calorically Restricted Ketogenic Diet and Fasting-MR-Spectroscopic Insights from the ERGO2 Trial

by
Katharina J. Wenger
1,2,3,4,*,
Marlies Wagner
1,2,3,4,
Patrick N. Harter
2,3,4,5,
Kea Franz
2,3,4,6,
Jörg Bojunga
4,7,
Emmanouil Fokas
2,3,4,8,
Detlef Imhoff
2,3,4,8,
Claus Rödel
2,3,4,8,
Johannes Rieger
9,10,
Elke Hattingen
1,2,3,4,
Joachim P. Steinbach
2,3,4,9,
Ulrich Pilatus
1,2,3,4 and
Martin Voss
2,3,4,9
1
Institute of Neuroradiology, University Hospital Frankfurt, Goethe University, 60528 Frankfurt am Main, Germany
2
University Cancer Center Frankfurt (UCT), University Hospital Frankfurt, Goethe University, 60590 Frankfurt am Main, Germany
3
German Cancer Consortium (DKTK) Partner Site Frankfurt/Mainz, 60590 Frankfurt am Main, Germany
4
Frankfurt Cancer Institute (FCI), 60590 Frankfurt am Main, Germany
5
Neurological Institute (Edinger-Institute), University Hospital Frankfurt, Goethe University, 60528 Frankfurt am Main, Germany
6
Department of Neurosurgery, University Hospital Frankfurt, Goethe University, 60528 Frankfurt am Main, Germany
7
Department of Medicine, University Hospital Frankfurt, Goethe University, 60590 Frankfurt am Main, Germany
8
Department of Radiotherapy and Oncology, University Hospital Frankfurt, Goethe University, 60590 Frankfurt am Main, Germany
9
Dr. Senckenberg Institute of Neurooncology, University Hospital Frankfurt, Goethe University, 60528 Frankfurt am Main, Germany
10
Interdisciplinary Division of Neuro-Oncology, University Hospital Tübingen, 72076 Tübingen, Germany
*
Author to whom correspondence should be addressed.
Cancers 2020, 12(12), 3549; https://doi.org/10.3390/cancers12123549
Submission received: 15 October 2020 / Revised: 12 November 2020 / Accepted: 25 November 2020 / Published: 27 November 2020
(This article belongs to the Special Issue Imaging Cancer Metabolism)

Abstract

:

Simple Summary

The glioblastoma is a highly malignant brain tumor with very limited treatment options up to date. Metabolism of this tumor is highly dependent on glucose uptake. It is believed that glioblastoma cells cannot metabolize ketone bodies, which are found in the blood during periods of fasting or ketogenic dieting. According to this hypothesis, dieting could lead to cancer cell starvation. The ERGO2 (Ernaehrungsumstellung bei Patienten mit Rezidiv eines Glioblastoms) MR-spectroscopic imaging subtrial was designed to investigate tumor metabolism in patients randomized to calorically restricted ketogenic diet/intermittent fasting versus standard diet. The non-invasive investigation of tumor metabolism is of high clinical interest.

Abstract

Background: The ERGO2 (Ernaehrungsumstellung bei Patienten mit Rezidiv eines Glioblastoms) MR-spectroscopic imaging (MRSI) subtrial investigated metabolism in patients randomized to calorically restricted ketogenic diet/intermittent fasting (crKD-IF) versus standard diet (SD) in addition to re-irradiation (RT) for recurrent malignant glioma. Intracerebral concentrations of ketone bodies (KB), intracellular pH (pHi), and adenosine triphosphate (ATP) were non-invasively determined. Methods: 50 patients were randomized (1:1): Group A keeping a crKD-IF for nine days, and Group B a SD. RT was performed on day 4–8. Twenty-three patients received an extended MRSI-protocol (1H decoupled 31P MRSI with 3D chemical shift imaging (CSI) and 2D 1H point-resolved spectroscopy (PRESS)) at a 3T scanner at baseline and on day 6. Voxels were selected from the area of recurrent tumor and contralateral hemisphere. Spectra were analyzed with LCModel, adding simulated signals of 3-hydroxybutyrate (βOHB), acetone (Acn) and acetoacetate (AcAc) to the standard basis set. Results: Acn was the only reliably MRSI-detectable KB within tumor tissue and/or normal appearing white matter (NAWM). It was detected in 4/11 patients in Group A and in 0/8 patients in Group B. MRSI results showed no significant depletion of ATP in tumor tissue of patients at day 6 during crKD-IF, even though there were a significant difference in ketone serum levels between Group A and B at day 6 and a decline in fasting glucose in Group A from baseline to day 6. The tumor specific alkaline pHi was maintained. Conclusions: Our metabolic findings suggest that tumor cells maintain energy homeostasis even with reduced serum glucose levels and may generate additional ATP through other sources.

Graphical Abstract

1. Introduction

Despite multimodal treatment options including surgical resection [1], radiotherapy, and/or chemotherapy [2] as well as tumor treating fields [3], glioblastoma (GBM) continues to carry a poor prognosis. Only 15–20% of patients survive longer than three years [4]. A standard second line treatment has not yet been established. According to current guidelines, treatment at recurrence can consist of re-resection, chemotherapy or re-irradiation [5]. With regard to chemotherapy, alkylating substances (re-challenge with either temozolomide or nitrosoureas such as lomustine) are the most commonly used treatment options [6]. Re-irradiation shows low toxicity even for patients with large tumor volumes [7], but median progression free survival (PFS) is restricted to approximately 5 months [8].
According to Otto Warburg’s theory, malignant cells display high rates of glycolysis and lactate production, even in the presence of adequate oxygen [9,10]. Activated Protein kinase B (PKB/Akt) has been shown to stimulate glucose consumption in malignant cells without affecting the rate of oxidative phosphorylation, rendering cancer cells dependent on aerobic glycolysis for continued growth and survival [11]. To a large extend, increased glucose metabolism in GBM can be plausibly explained through activation of phosphoinositide 3-kinase (PI3K) and Akt via epidermal growth factor receptor (EGFR) gene amplifications and mutations as well as loss of phosphatase and tensin homolog (PTEN) [12]. Activation of hypoxia inducible factor-1α (HIF-1α) in hypoxic and necrotic tumor regions additionally increases aerobic glycolysis [13].
While normal neurons and glial cells can metabolize either ketone bodies (KB; β-hydroxybutyrate (βOHB), acetoacetate (AcAc), and acetone (Ac) formed from acetoacetate by spontaneous decarboxylation) or glucose (Figure 1), it has been suggested that malignant brain tumor cells lack this metabolic flexibility due to a deficiency of enzymes to oxidize ketone bodies [14,15,16,17,18]. KB are formed in the liver via acetyl-CoA predominantly from fatty acids, and blood concentrations increase during fasting or high-fat diets. They can be detected intracerebrally using proton (1H) MR-spectroscopic imaging (MRSI) [19,20,21].
The ketogenic diet (KD) is a well-tolerated, high-fat low-carbohydrate diet that can lower circulating glucose and insulin levels when calorie restricted [22,23]. If tumor cells indeed lacked the flexibility to produce adenosine triphosphate (ATP) from ketone body oxidation, KD could result in a selective vulnerability of glioma cells to glucose reduction [24]. In support of this hypothesis, some preclinical studies found that calorie restricted KD (crKD) can reduce tumor growth through effects on angiogenesis, apoptosis, and inflammation and can improve prognosis in high-grade glioma mouse models [25,26,27]. In addition, fasting mimicking diets (FMD) and fasting itself showed an increase in resistance to chemotherapy in normal but not cancer cells of several preclinical cancer models, which could reduce potentially life-threatening side effects of treatments [28,29,30,31].
Another important and energy dependent aspect of tumor metabolism is pH homeostasis. Through changes in the expression of cellular membrane ion transport channels and the CO2/HCO3 buffering system, tumor cells maintain an ATP-dependent reversed pH gradient with a slightly alkaline intracellular pH (pHi) and an acidic extracellular pH (pHe), promoting proliferation, migration and invasion [32,33,34]. ATP levels and pHi values can be measured non-invasively in vitro using phosphorous (31P) MRSI [35].
The ERGO2 trial (Ernaehrungsumstellung bei Patienten mit Rezidiv eines Glioblastoms) is the first prospective randomized study designed to test feasibility and efficacy of the combination of crKD and radiotherapy in any tumor type. Here, we present results of the MRSI subtrial.

2. Results

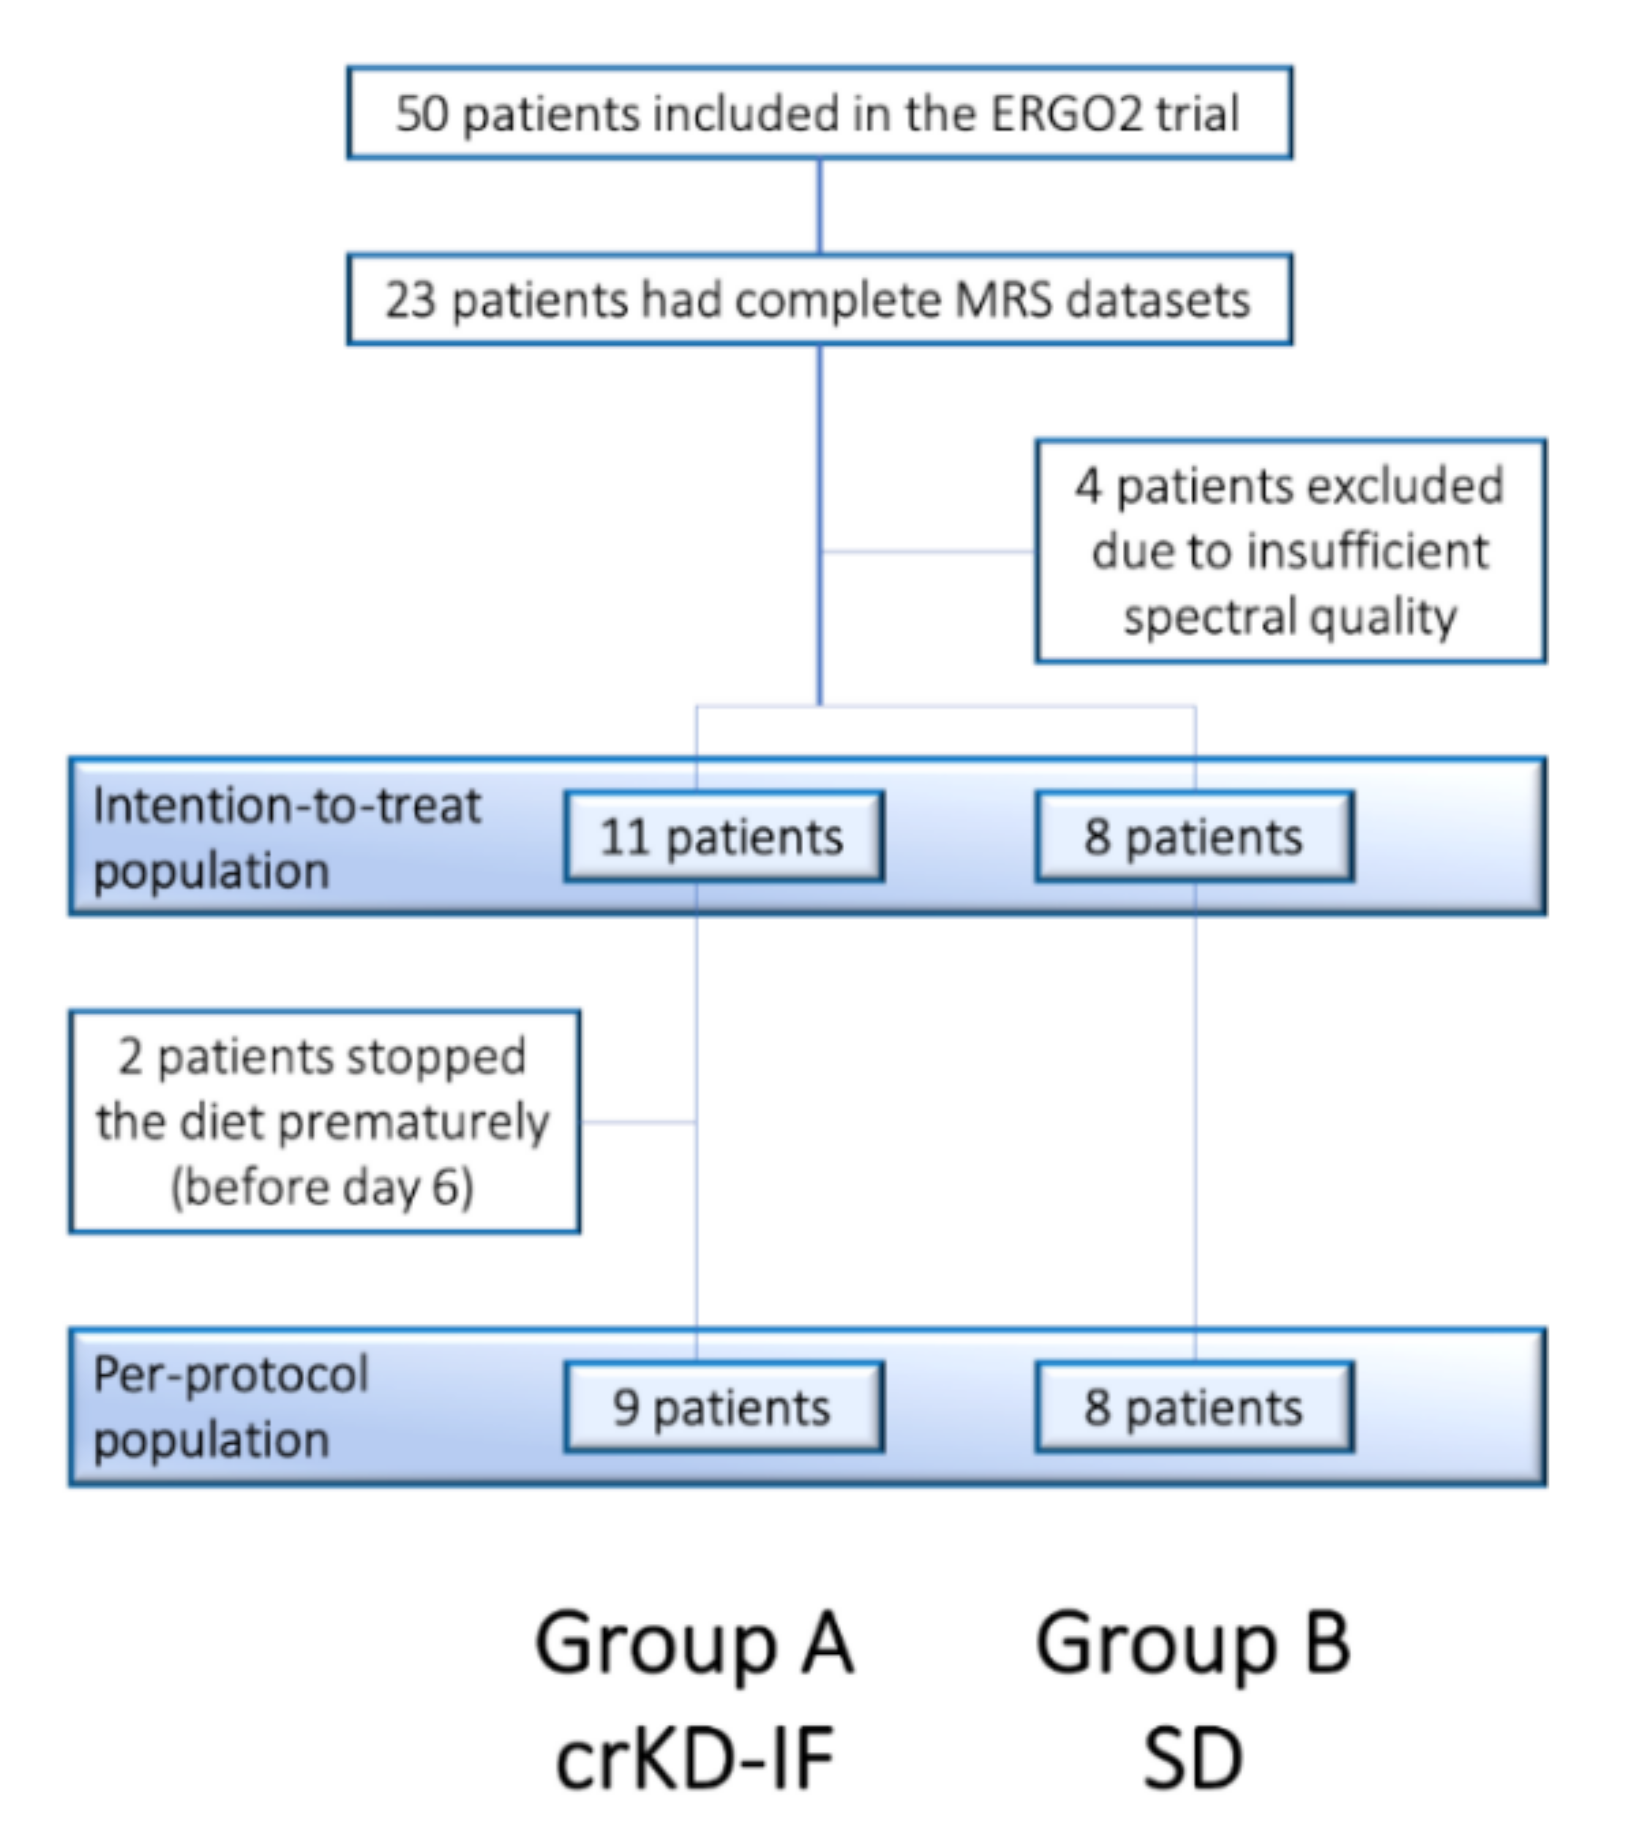
2.1. Patient Characteristics and Prior Treatment MRSI Substudy

Of 23 patients with complete MRS datasets, four were excluded from the analysis due insufficient spectral quality, leaving 11 patients in Group A with crKD-IF and 8 patients in Group B with SD. These 19 patients defined the intention-to-treat population (ITT; Figure 2).
Patient characteristics and treatment are summarized in Table 1.
Median age at study inclusion was 51 years (Group A: 53 years, Group B: 42.5 years; mean Group A: 53 ± 7, Group B 41 ± 14). 79% of all patients were included with a primary diagnosis of GBM (n = 15), while 21% suffered from other higher-grade tumors progressed from lower-grade glioma (n = 4). 9% (n = 1) of patients in Group A and 50% (n = 4) of patients in Group B were surgically resected or re-resected within one month prior to start of study re-irradiation therapy. All of these patients included in the MRS study had only received partial resection for recurrent GBM or suffered from multifocal GBM with non-resected tumor locations.

2.2. Adherence to Radiation Study Protocol

Sixteen patients underwent hypofractionated radiotherapy with a total dose of 20 Gy over five consecutive days on day 4–8. Three patients were treated with alternative schemes (Group A: n = 1, Group B n = 2).

2.3. Patients’ Adherence to Recommended Dietary Intervention

Overall dietary requirements were well tolerated in both groups. 2/19 patients (Group A: n = 2, Group B n = 0) patients did not complete the required nine days of dietary intervention but dropped out after two and four days respectively. The remaining 17 patients defined the per protocol population (PPP).

2.4. Detectability of Ketone Bodies in Urine and Blood Samples

At baseline, urine and blood ketone levels as well as fasting blood glucose levels did not differ between the groups. 64% of patients in Group A (n = 7) achieved blood ketone levels (βOHB) > 0.5 mmol/L at day 6 during crKD-IF. Mean ketone blood levels (βOHB) in the ITT population of Group A were 1.27 ± 1.23 mmol/L and 1.4 ± 1.23 mmol/L in the PPP. None of the patients in Group B at day 6 during a balanced nutrition achieved a blood ketone level > 0.5 mmol/L, with mean levels of 0.13 ± 0.1 mmol/L. There was a significant difference at day 6 between Group A and B with respect to ketone blood levels (ITT p < 0.01, PPP p = 0.02; one patient in Group A with no ketone blood levels reported). Five patients in Group A tested positive for urine ketosis (AcAc, Acn) with a median of +++ (range 1.5–16 mmol/L; + = 1.5 mmol/L, ++ 4.0 mmol/L, +++ 8.0 mmol/L, ++++ 16 mmol/L), while one patient was tested negative (four patients with no urine samples obtained). In Group B on day 6 during a balanced nutrition, no patients tested positive for urine ketosis. Within the MRSI substudy in the ITT population, fasting glucose levels in patients of Group A declined during the intervention with mean glucose levels at baseline of 86.4 ± 13 mg/dL and 79.8 ± 14.3 mg/dL on day 6. Comparison of means showed a decline of −6.6 ± 5.6 mg/dL but did not reach statistical significance (p = 0.25). With regard to the PPP, similar results could be shown with a decline of −7.4 ± 6.7 mg/dL that did not reach statistical significance (p = 0.28).

2.5. Intracerebral Detectability and Quantitation of Ketone Bodies Using MRSI

In 4/11 patients at day 6 during crKD-IF (Group A), intracerebral KB were detected with an estimated CRLB < 35% as given by LCModel. All patients displayed an Acn signal at 2.22 ppm. In one of these patients (Patient 26), an Acn signal was fitted in voxels of tumor tissue and normal appearing white matter (NAWM), in all other patients (Patient 27, 34, 38) in voxels of NAWM only. Acn signals were quantified and are listed in Table 2 with respective urine and blood ketone levels.
The relationship between MRSI detected KB and KB in blood samples and urine samples was weak with R-values of −0.22 and 0.44 respectively (Pearson correlation coefficient). No signals for βOHB or AcAc in either patient group and no signal for Acn in Group B were fitted with CRLB < 35%. 1H-MRS spectrum of Patient 38 with Acn fit of NAWM at day 6 during crKD-IF is shown in Figure 3b,c.

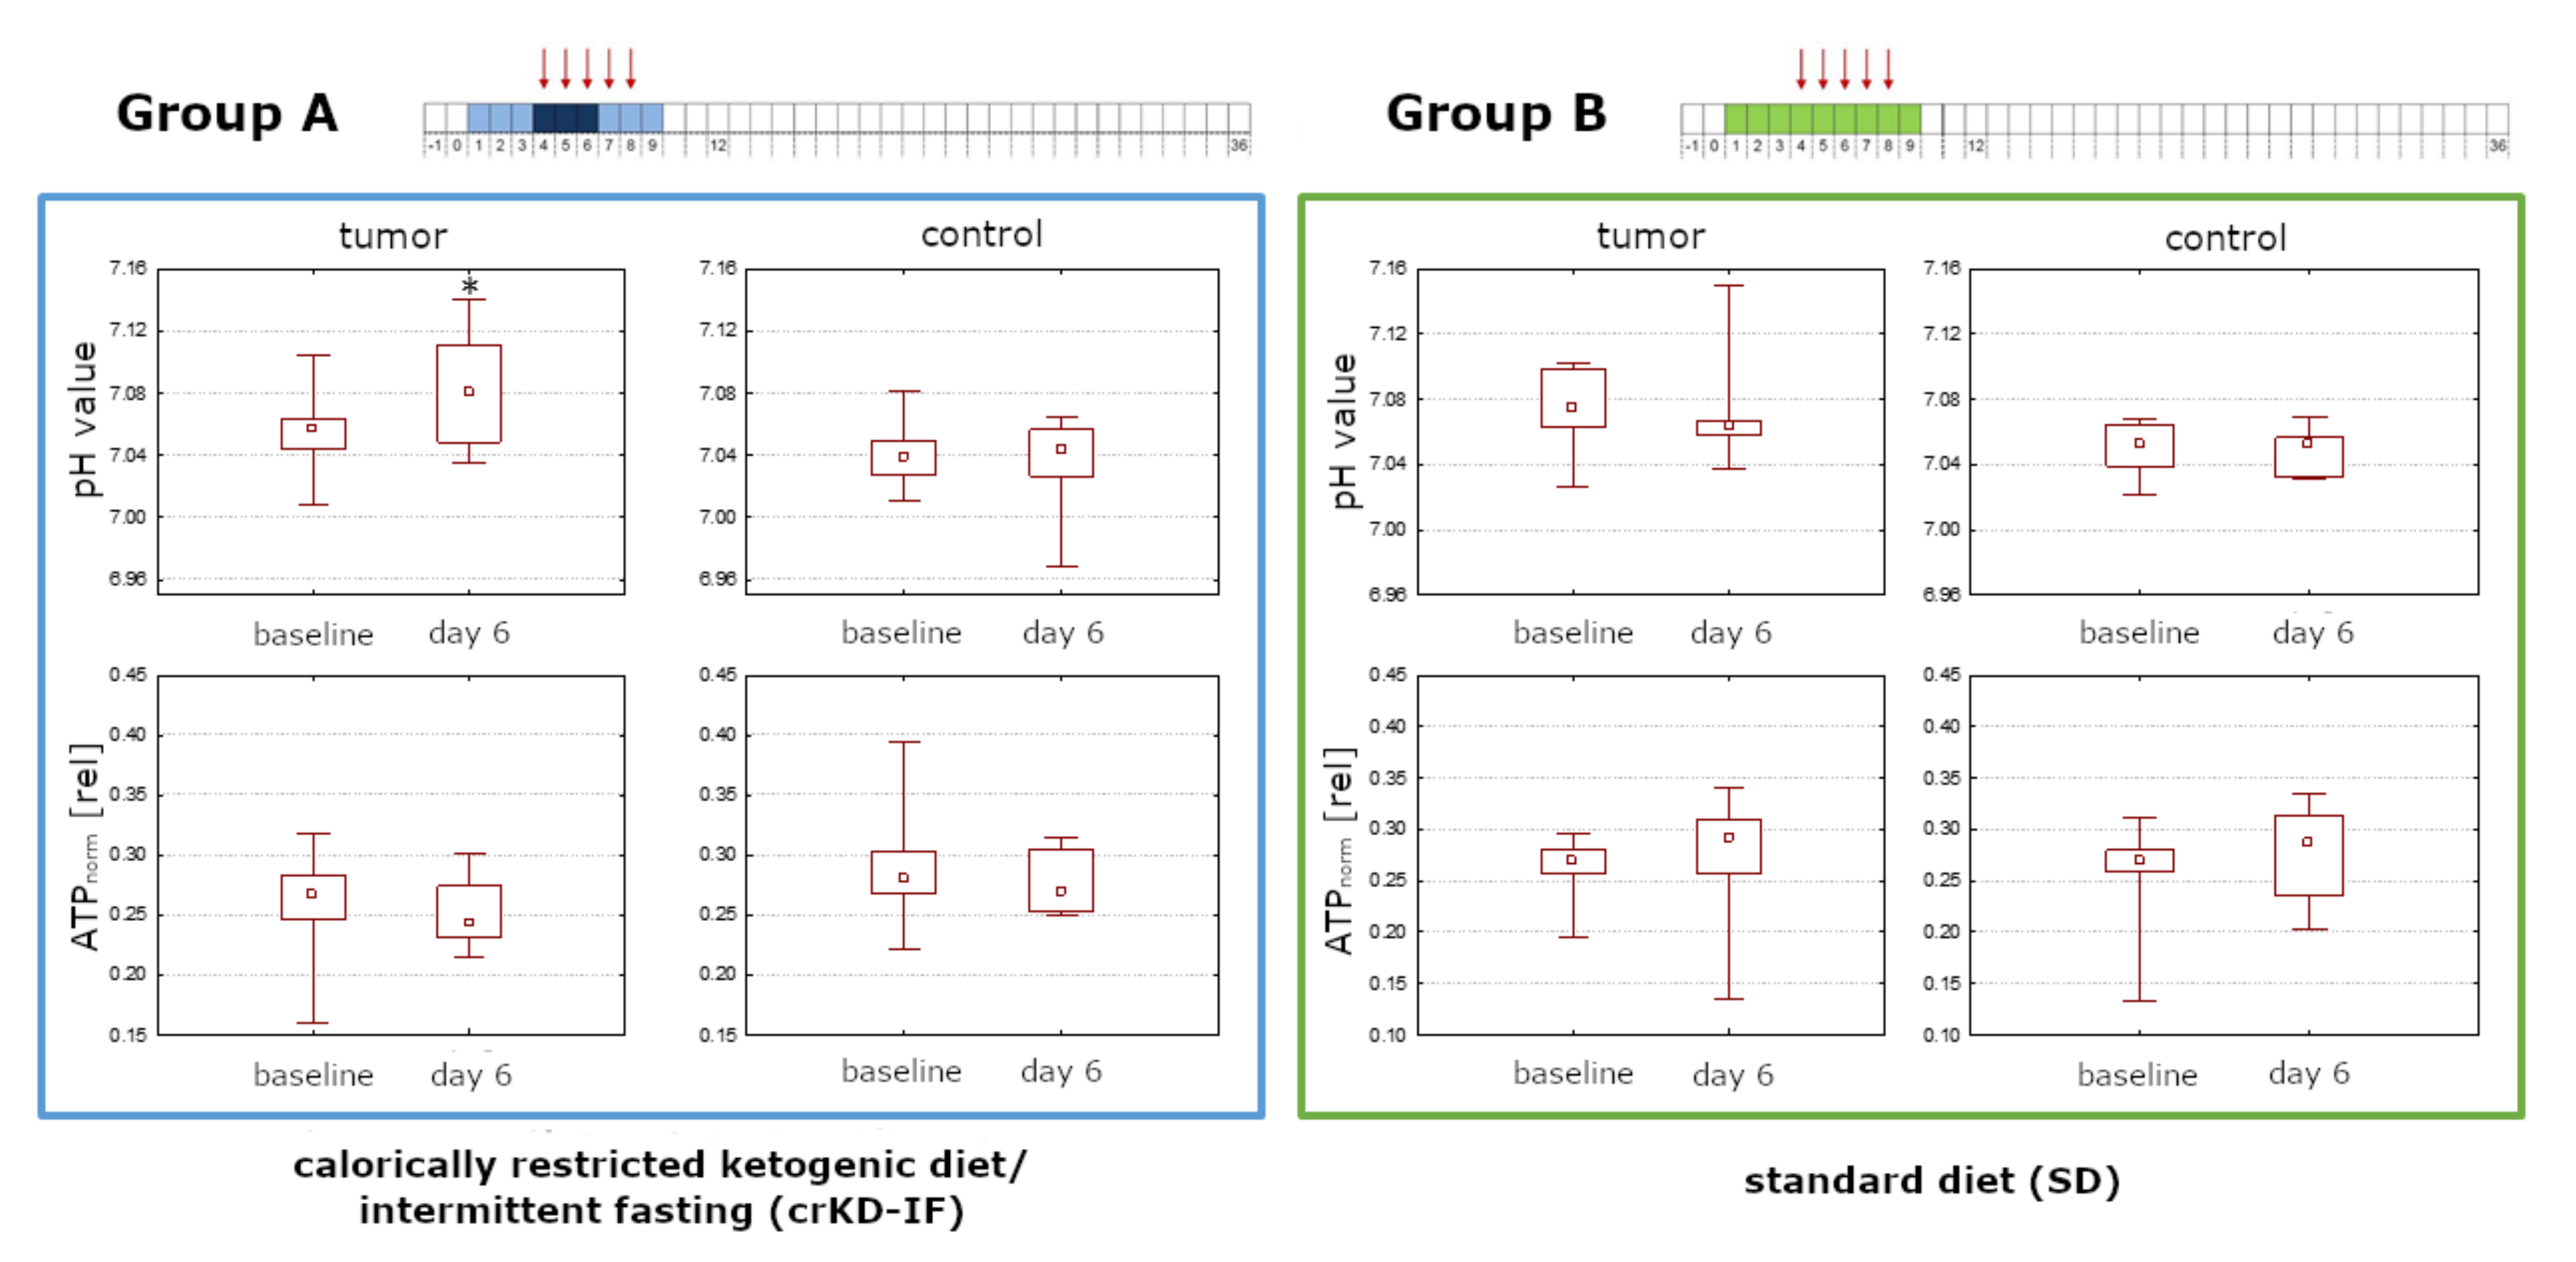
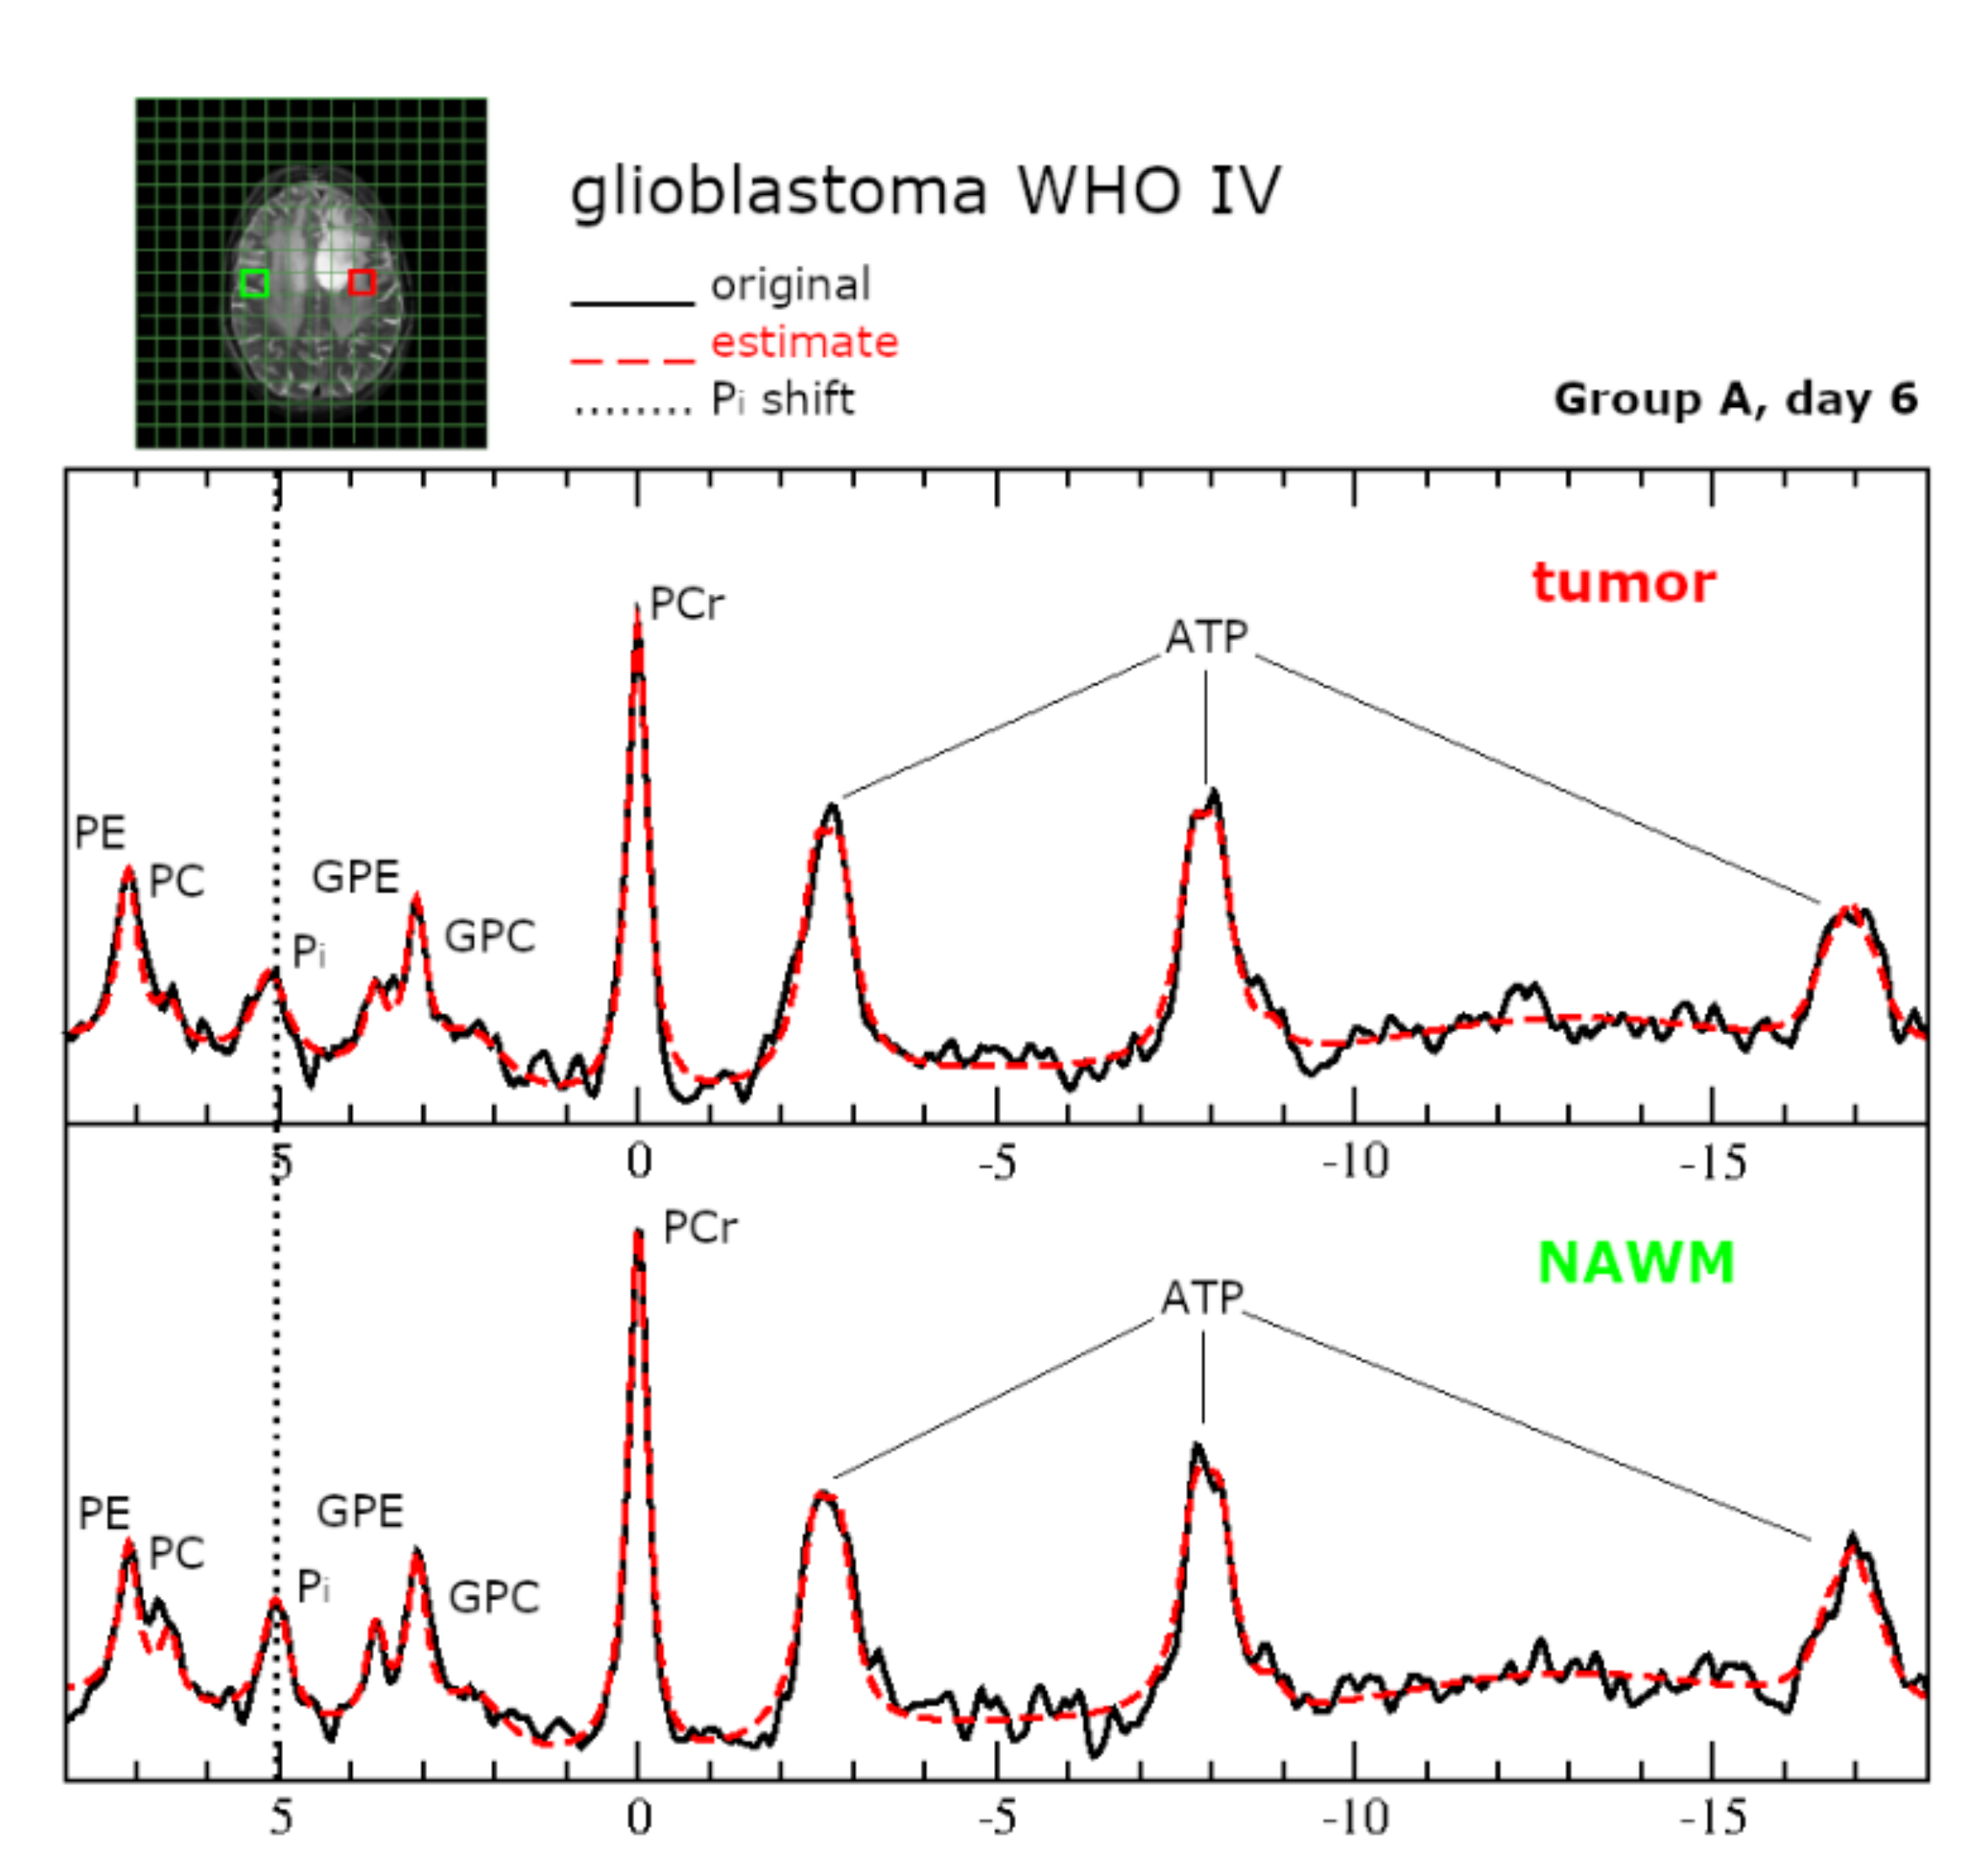
2.6.Intracellular pH and Energy Metabolism

For both groups in the ITT population, pHi was significantly lower in control voxels (NAWM) than in tumor voxels (Day 6 Group A: p = 0.01; Group B: p = 0.02). Group A exhibited a significant increase in pHi in tumor voxels comparing baseline levels to day 6 during crKD-IF (p = 0.03), while there were no significant changes reported for Group B (p = 0.48). No significant changes in ATP levels were detected in tumor or control voxels of either group comparing baseline to day 6 (Group A tumor: p = 0.29; Group A control: p = 0.65; Group B tumor: p = 0.33; Group B control: p = 0.21). Box-and-whisker plots with minimum, maximum, interquartile ranges and median are shown in Figure 4. Representative 31P spectra are displayed in Figure 5.
Analyzing the mean values of day 6 tumor ATP and tumor pHi as well as the change of ATP and pH from baseline to day 6, there was no statistically significant difference splitting for serum ketosis (≥0.5 mmol/L or <0.5 mmol/L) or glucose ketone index (>2 mmol/L or ≤2 mmol/L) [36]. Accordingly, there was no statistically significant correlation of ATP or pHi to the serum ketosis or serum glucose at day 6.
Median glucose of all patients was 83.5 mg/dL (4.6 mmol/L) at day 6. An unplanned sub-analysis of the patients of the KD-IF group who completed treatment per protocol had shown, that patients with a glucose below the median had a significantly longer PFS than patients above the median (median PFS 111 days (95%CI 45–178) vs. 42 days (95%CI 41–43), p = 0.014) [37]. When applying the same median split (>83.5 mg/dL: n = 5, <83.5 mg/dL: n = 6) to compare mean values of tumor ATP and pHi at day 6, there was no statistical difference (tumor ATP p = 0.98, tumor pHi p = 0.79).

3. Discussion

3.1. Discussion

In our study, Acn was the only reliably MRSI-detectable KB within tumor tissue and/or NAWM. It was only detected in patients during crKD-IF (Group A), not in patients with a balanced diet. But even with elevated ketone serum and urine levels in most patients in Group A, it was merely detected in 4/11 patients.
Reports on MRSI-detectability of KB are not consistent throughout literature and concentrations sometimes fail to show a correlation with serum or urine levels [19,20,38,39]. This may be related to the rather small signal amplitudes of the KB, especially after a short dietary intervention. AcAc and β-OHB as hydrophilic anions can merely cross the blood–brain barrier (BBB) via a monocarboxylate transporter (MCT), which facilitates proton-linked transport of monocarboxylates [40]. Rat studies have shown an upregulation of cerebral MCT-1 after several weeks of ketogenic diet, but not after short periods of fasting (48 h) [41,42]. Acn on the other hand, is both hydrophilic and lipophilic and can be found in aqueous and lipid compartments [43,44]. Its concentration in cerebrospinal fluid is proportional to plasma, indicating free diffusivity across the BBB [45]. Increased overall tissue concentration combined with the high MR sensitivity of the Acn singlet at 2.22 ppm, which arises from six equivalent protons, may account for MR detection of this specific KB while the others remain invisible. The AcAc and βOHB signal originate from three equivalent protons, resulting in half the amplitude for the same molecular concentration compared to Acn. In addition, the 1.2-ppm βOHB signal is a doublet due to J-coupling, so the peak height is further reduced by a factor of 2. Therefore a lower sensitivity of MRSI detection has to be assumed for AcAc and βOHB [20].
MRSI results showed no significant depletion of ATP production in tumor tissue of patients at day 6 during crKD-IF, even though there were a significant difference in ketone blood levels between Group A and B at day 6, and a decline in fasting glucose in Group A from baseline to day 6. The absence of a cellular energy breakdown suggests that tumor cells maintain glycolysis even with reduced glucose levels and in addition may generate ATP through other sources.
Recently, the hypothesis that brain tumors are metabolically inflexible has been contradicted in vivo (but not in vitro) in two rat glioma models (9L and RG2) [24,46,47,48]. During infusion of 13C-labled β-OHB, 13C-labeling of glutamate was detected in vivo in tumor voxels using 13C/1H MR Spectroscopy. Glutamate was labeled through fast exchange with α-ketoglutarate, which is an intermediate metabolite in the tricarboxylic acid cycle and can derive from oxidative metabolism of β-OHB. Contribution of ketone bodies to oxidative metabolism increased when animals were fed a KD with upregulation of MCT-1 in RG2 tumor cells. Histological staining confirmed that tumor cells made up the vast majority of the tissue, demonstrating enzyme capacity of tumor cells to oxidize KB, generating ATP.
Acidification of the extracellular milieu (low pHe) and concomitant intracellular alkalization of the cytoplasm (high pHi) are hallmarks of cancer, leading to a reverse pH gradient in cancer cells [49,50]. A rapid increase in intracellular lactate concentration in glycolytic tumors is concomitant with a sharp decrease in pH that starts to relax rapidly towards more alkaline values [51]. Intracellular alkalosis is maintained through several mechanisms including the increased expression and activity of acid extruding plasma membrane transporters, for example, Na+/H+ exchangers (NHE), H+/K+-ATPases, and Na+/HCO3 cotransporters (NBC), which work in concert with carbonic anhydrases (CA) [52]. Since a shift from glycolysis towards oxidative phosphorylation is expected during KD/fasting, less intracellular lactate will be generated in the fasting state. In our study, stable ATP values between baseline and day 6 in Group A were corroborated not only by maintenance, but even a slight increase in alkaline pHi in tumor voxels. Our findings might be the momentary result of an overshoot due to the joint activity of lactate and H+ co-transporting MCT1 and MCT4. However, this hypothesis needs to be experimentally confirmed by further studies. Ultimately, low intracellular H+ concentrations will favor lactate flux into the cell [52]. The direct influence of ketone bodies on pHi appears less likely. Voronina et al. exposed synaptosomes to high levels of β-OHB and saw no changes in intracellular pH [53]. As opposed to glucose utilization, utilization of ketone bodies does not result in lactate production. Experiments with glioblastoma cell culture further showed that lactate excretion is stable even when β-OHB is available as an additional source of energy [15]. Consistent with these findings, we recently reported that isocitrate dehydrogenase (IDH) mutant tumors, which are less glycolytic, display significantly lower lactate concentrations compared with IDH wild-type tumors and a near-normal pHi [54]. Ultimately in the complex process of cancer metabolism, other factors may come into play—for example a different link of glucose and β-OHB metabolism to redox potential via nicotinamide adenine dinucleotide (NAD) utilization.

3.2. Limitations

Due to missing values of patients withdrawing from study or MRS consent, the number of cases available for analysis is reduced and therefore the statistical power.
In accordance with prior studies, a carefully simulated and constructed LCModel basis set for the specific acquisition and quantitative criteria of KB is necessary. Increased numbers of signal averages with consecutively increased scan time, larger voxels and employment of a semi localization by adiabatic selective refocusing (semi-LASER) sequence may allow improved detection of KB [20]. However, when the protocol for this study was set up in 2013, a semi-LASER sequence was not implemented at our center.
Phantom replacement as an external reference method for metabolite quantitation is affected by several factors that can create variability between measurements in phantom and human subjects such as coil loading, transmit calibration, and receive profile. While the Tofts formula, which was applied in this study, takes some factors such as coil loading into account, others such as the inhomogeneous B1 field obtained at 3 T are not corrected for. Quantitative estimates of metabolite concentrations in patients therefore may differ from their true concentrations. The study protocol did not include the acquisition of water spectra for an internal reference method in addition or as a comparison to the external method.
Unfavorably, 31P MRSI has a poor spatial resolution (large voxel sizes) when compared to 1H MRSI and an increased spreading of signal into adjacent voxels caused by the point spread function (PSF). The PSF describes the blurring of a point due to coarse k-space sampling. This holds especially true for 8 × 8 × 8 k-space sampling, which is typical for many 31P MRSI studies and was employed in this study. The inherent partial volume effect tends to level focal changes in the position of the signal of inorganic phosphate. Since we used only one signal to fit inorganic phosphate, the estimated pHi rather indicates a deviation to higher values compared the real pHi in the target region [55].

4. Materials and Methods

4.1. Patients and Study Design

ERGO 2 was a randomized, open-label study (ClinicalTrials.gov NCT01754350; DRKS-ID: DRKS00010749), including an extended MRSI protocol that was approved by Ethic Committees of all participating centers (University Hospital Frankfurt am Main, University Hospital Tübingen, University Hospital Erfurt, approval code: 1/13). MRSI was performed at the Frankfurt site only. Study population consisted of patients with recurrence of a histologically confirmed GBM, gliosarcoma or malignant progression of a lesser grade brain tumor in MRI follow-up and a multidisciplinary tumor board (MDT) recommendation for re-irradiation therapy. The initial radiotherapy and the initial surgical resection/biopsy had to be completed at least 6 months prior and a sufficient performance status (Karnofsky-index ≥ 60%) was required. Primary endpoint of the study was progression free survival at 6 months (PFS-6) which has been reported separately [37]. Secondary endpoints addressed in this report were detection and monitoring of cerebral and specifically intratumoral concentrations of βOHB, Ac and AcAc, as well as the impact of crKD-IF on intratumoral ATP levels and maintenance of a reversed pH gradient.
The 50 patients enrolled at all centers were randomized 1:1 in two groups: Group A keeping a crKD for nine days, including three days of fasting and group B keeping a balanced diet over the same period. For Group A, crKD was scheduled from day 1–3 (21–23 kcal/kg/day, max. 50 g carbohydrates/day), and again from day 7–9 (21–23 kcal/kg/day, max. 50 g carbohydrates/day). During days 4–6, fasting (0 kcal/day) was required with unlimited supply of liquids, at least 1.5–2.0 L/day (water, tea, vegetables broth). For Group B, a complete and balanced nutrition as recommended by the German Nutrition Society (DGE) with approximately 60–80 g fat, 5 g/kg bodyweight carbohydrates and 0.8 g/kg bodyweight proteins were ensured. All patients were counseled by a DGE-certified nutritionist who developed a patient specific diet plan and provided ketogenic recipes to patients in Group A. Body weight was closely monitored and diet was terminated in case of a weight loss of more than 10% of the initial body weight, severe and symptomatic hypoglycemia, or any common toxicity criteria (CTC) grade 4 adverse event related to the diet. Hypofractionated radiotherapy was performed after three-dimensional CT planning with a total dose of 20 Gy over five consecutive days on day 4–8 (5 × 4 Gy) [56]. Further clinical follow-up visits were scheduled at day 12, after one month and hereafter every two months. Study design is outlined in Figure 6.

4.2. Magnetic Resonance Imaging

Of the 50 patients enrolled at all centers, 32 received 1H/31P MRSI at baseline (day −1) and 23/32 on day 6. Day 6 corresponds to the third day of fasting after three days of crKD (21–23 kcal/kg/day) in the intervention group and the third day of radiotherapy (5 × 4 Gy). MRSI was scheduled in addition to routine follow-up scans and was declined by a number of patients. Examinations were performed on a clinical whole-body 3 T MR Scanner (Magnetom Trio, Siemens Medical Solutions, Erlangen, Germany), using a double-tuned 1H/31P volume head coil (Rapid Biomedical, Rimpar, Germany). The MR protocol included 3D T1-w gradient echo sequences, T2 weighted turbo spin echo, 1H decoupled 31P MRSI with 3D CSI recording the FID, as well as with 1H MRSI recording the spin echo at TE 30 ms. Tumor tissue was identified on previously acquired standard-MRI images with gadolinium-based contrast agent in tumors with disruption of the blood–brain barrier and on newly acquired T2 weighted images. For 1H MRSI the volume of interest (VOI) was selected by a combination of the point resolved selected spectroscopy (PRESS) and outer volume suppression, aimed to enclose the recurrent tumor as well as contralateral NAWM. Details on MRSI protocol are listed in Table 3.

4.3. Data Analysis

Registration of the acquired multimodal spectroscopic data to 3D-anatomical data was performed with an in-house software tool scripted in MATLAB (The Mathworks, Inc., Natick, MA, USA) [57]. The tool provides a graphical user interface which facilitates the selection of voxels from the entire 3D spectroscopic data set using 3D-T1 weighted and T2 weighted reference images with an MRSI grid overlay. Voxels were selected from the area of the recurrent tumor. Control voxels were selected in areas of NAWM on the contralateral hemisphere, anatomically corresponding to the selected tumor area. Spectra of insufficient quality (linewidth of the water signal (FWHM) > 0.1 ppm, Cramér–Rao lower bounds (CRLB) of choline as given by LCModel > 15%, large artifacts), e.g., those close to the skull/brain interface, were excluded from the analysis. Considering the expected low concentrations of cerebral KB in our study design, a rejection threshold using CRLB of a metabolite fitting of 35% was applied to Acn, AcAc, and βOHB. Above this threshold, the metabolite was considered as undetectable [58].
Analysis of patient proton MRSI data was performed in the frequency domain using LCModel (version 6.3-1C), a non-iterative commercially available software package that analyzes in vivo MRS data as a linear combination of model spectra which were simulated, and a build in basis data set for simulation of MM and lipids [59]. For each selected proton voxel, corresponding phosphorous data were analyzed with the software package jMRUI (Version 6.0 beta) [60] employing a non-linear least square fitting algorithm (AMARES) in the time domain [61].

4.4. 31P MRSI Model

The model was composed of 14 exponentially decaying sinusoids. The signal of phosphocreatine (PCr) was adjusted to 0 ppm, and constraints for phosphocholine (PC), phosphoethanolamine (PE), glyceroethanolamine (GPE), and glycerophosphocholine (GPC) signals were applied keeping the chemical shifts at a fixed difference with regard to the position of PCr, while adjusting the linewidth to the value of PCr. ATP was modeled by 7 sinusoids assuming two doublets and a triplet with an 18 Hz coupling constant. One signal with a fixed chemical shift of 2.24 ppm and maximum line width of 50 Hz was used to account for potential macromolecule signals in the phosphodiester region [62,63]. One signal was used to model the inorganic phosphate (Pi) in the spectra region between 3.3 and 5.0 ppm. At physiological pH, H2PO4 and HPO4 ions contribute to the Pi signal. Since both components have different chemical shift, the chemical shift (signal position) of inorganic phosphate (Pi) is pH dependent and can be used as a pH-marker [55]. Referring to the approach of Petroff et al. [64] (i.e., calculating pH according to pH = pkA + 10log (δ1 − δ0/δ0 − δ2)), the pH values of the predefined areas of interest were determined from the chemical shift difference between Pi and PCr. The formula is implemented in jMRUI with the following default values: pkA 6.75 ppm, delta1 3.27 ppm, delta2 5.63 ppm. Fitting the 31P spectra, all signals were generally assigned correctly as visually assessed, leaving a flat line for the residual with equal distribution of noise. Changes in ATP concentrations were monitored using the intensity of ATPß signal, normalized to the intensity of the other phosphate containing metabolites (ATP ß/(PEth + GPE + GPC + PCre + ATPß)). Each metabolite symbol represents its intensity as given by jMRUI AMARES. The normalization corrects for variations in coil sensitivity due to different coil loadings, while still being sensitive to changes in ATP concentrations.

4.5. Simulation of Basis Set for 1H MRSI

The basis set for LCModel was simulated using the NMRScope-B plugin, which is implemented in jMRUI (Version 6.0 beta) [65]. MR spectra for each metabolite were calculated based on a priori knowledge of scalar coupling, chemical shifts, and vendor specific hardware parameters for data acquisition. The metabolites simulated and included in the data evaluation were: sodium-3-hydroxybutyrate (βOHB), acetone natural (Acn), lithium acetoacetate (AcAc), sodium l-lactate (Lac), N-acetyl-l-aspartic acid (NAA), creatine anhydrous (Cr), choline chloride (Cho), l-glutamine (Gln), l-glutamic acid (Glu), and myo-inositol (mI) (all Merck KGaA, Darmstadt, Germany). A line broadening of 3 Hz was applied to each basis spectrum.
Following simulation, the basis set was tested on phantom data, including signals for the respective metabolites at expected in vivo concentrations (Lac 2 mmol/L, NAA 8 mmol/L, Cr 6 mmol/L, Cho 2 mmol/L, Gln 2 mmol/L, Glu 7 mmol/L, mI 4 mmol/L). Concentrations of βOHB, Acn and AcAc were at 1 mM. The frequency, phases and linewidths of the peaks were all constrained relative to the creatine singlet at 3.03 ppm (Figure 3a).

4.6. Phantom Replacement

A spherical phantom was prepared containing 2600 mL of an aqueous solution (Dulbecco’s phosphate buffered saline, DPBS) and the respective metabolites at physiological pH (pH adjusted to 6.96 by titration with NaOH). The spherical size was chosen to minimize susceptibility artifacts. The phantom was placed in the center of the dual tuned head coil. Measurements lead to well-resolved spectra with flat baselines. Using the phantom replacement technique as described by Tofts et al. and applied by our group before, metabolite levels for Acn were calculated [66,67]. Data were acquired with a transmit/receive coil. Regarding the principle-of-reprocity we applied corrections as described by Michaelis et al., which are also included in the Tofts formula [68]. Relaxation effects for Acn signals at 3T (signal loss) were corrected assuming previously published values for NAA for T2 and T1 (T2 = 270 ms; T1 = 1.4 s, correction factor 0.59) [69,70].

4.7. Laboratory Testing

Patient urine samples were analyzed using Combur® 10 Test Strips (Hoffmann-La Roche, Basel, Switzerland), while capillary blood samples were analyzed using the Precision Xceed system with blood β-ketone test strips (Abott, Chicago, IL, USA). Combur® Test Strips detect AcAc (detection limit approximately 0.5 mmol/L) and Acn (detection limit approximately 7 mmol/L), while blood test strips detect βOHB (detection limit < 1 mmol/L).

4.8. Statistics

Statistical analysis was performed using a commercially available software (STATISTICA, version 7.1; StatSoft, Tulsa, OK, USA). A Wilcoxon signed-rank test as a paired, non-parametric statistical hypothesis test was used to compare pHi and ATP levels at baseline and on day 6 (equal to the third day of fasting after three days of crKD) within tumor tissue and NAWM. The same test was used to compare pHi and ATP levels within tumor tissue and NAWM at each point of time. An unpaired t-test was used to compare blood ketone levels of Group A and B and a paired t-test to compare glucose levels at baseline and on day 6 for each group. For all tests, p < 0.05 was considered significant. The Pearson correlation coefficient was used to measure the strength of a linear association between MRSI detected KB and KB in urine and blood samples.

5. Conclusions

MRSI allowed specific detection of ketosis in patients with recurrent GBM during crKD-IF, but sensitivity was low. The intervention did not affect tumor ATP levels or pHi the way, that would reflect a selective vulnerability of tumor cells to glucose starvation. According to our findings, tumor cells maintain energy homeostasis even with reduced glucose levels through either enhanced uptake of glucose or generation of ATP through other sources, possibly even KB oxidation. Findings of the subtrial are in line with the negative results of the main trial [37] with regard to progression free and overall survival (PFS und OS) and suggest that metabolic interventions targeting brain tumor metabolism need to be further refined.

Author Contributions

Conceptualization, project administration, supervision, funding acquisition, J.R., C.R., J.P.S., E.H., and J.B.; Methodology, investigation, K.J.W., M.W., P.N.H., K.F., E.H., J.B., E.F., D.I., C.R., J.R., U.P., and M.V.; Formal analysis, validation, K.J.W., M.W., P.N.H., E.H., U.P., J.R., and M.V.; Writing—original draft, visualization K.J.W., M.W., E.H., U.P., J.P.S., and M.V.; Writing—review and editing K.J.W., M.W., P.N.H., K.F., E.H., J.B., E.F., D.I., C.R., J.R., U.P., and M.V. All authors have read and agreed to the published version of the manuscript.

Funding

This trial was funded by the investigator-initiated trial (IIT) program of the University Cancer Center Frankfurt (UCT). The UCT had no involvement in the clinical trial itself or the writing of the report. The Senckenberg Institute of Neurooncology is supported by the Senckenberg Foundation.

Acknowledgments

The authors thank the patients and their relatives for their participation in the study and the support. We are grateful to all local investigators and study nurses in the participating centers. We particularly thank Manuela Vetter of the Study center Frankfurt for the excellent trial support and project management and the colleagues of the outpatient clinic for nutritional medicine Frankfurt am Main.

Conflicts of Interest

The authors declare no conflict of interest.

References

  1. Chaichana, K.L.; Jusue-Torres, I.; Navarro-Ramirez, R.; Raza, S.M.; Pascual-Gallego, M.; Ibrahim, A.; Hernandez-Hermann, M.; Gomez, L.; Ye, X.; Weingart, J.D.; et al. Establishing percent resection and residual volume thresholds affecting survival and recurrence for patients with newly diagnosed intracranial glioblastoma. Neuro-Oncology 2014, 16, 113–122. [Google Scholar] [CrossRef] [PubMed]
  2. Stupp, R.; Hegi, M.E.; Mason, W.P.; van den Bent, M.J.; Taphoorn, M.J.; Janzer, R.C.; Ludwin, S.K.; Allgeier, A.; Fisher, B.; Belanger, K.; et al. Effects of radiotherapy with concomitant and adjuvant temozolomide versus radiotherapy alone on survival in glioblastoma in a randomised phase III study: 5-year analysis of the EORTC-NCIC trial. Lancet Oncol. 2009, 10, 459–466. [Google Scholar] [CrossRef]
  3. Hottinger, A.F.; Pacheco, P.; Stupp, R. Tumor treating fields: A novel treatment modality and its use in brain tumors. NEUONC 2016, 18, 1338–1349. [Google Scholar] [CrossRef] [PubMed] [Green Version]
  4. Stupp, R.; Mason, W.P.; van den Bent, M.J.; Weller, M.; Fisher, B.; Taphoorn, M.J.B.; Belanger, K.; Brandes, A.A.; Marosi, C.; Bogdahn, U.; et al. Radiotherapy plus concomitant and adjuvant temozolomide for glioblastoma. N. Engl. J. Med. 2005, 352, 987–996. [Google Scholar] [CrossRef] [PubMed]
  5. Kommission Leitlinien der Deutschen Gesellschaft für Neurologie. Leitlinien für Diagnostik und Therapie in der Neurologie; Thieme: Stuttgart, Germany, 2013. (In German) [Google Scholar]
  6. Weller, M.; Cloughesy, T.; Perry, J.R.; Wick, W. Standards of care for treatment of recurrent glioblastoma—Are we there yet? Neuro-Oncology 2013, 15, 4–27. [Google Scholar] [CrossRef] [Green Version]
  7. Zemlin, A.; Märtens, B.; Wiese, B.; Merten, R.; Steinmann, D. Timing of re-irradiation in recurrent high-grade gliomas: A single institution study. J. Neuro Oncol. 2018, 138, 571–579. [Google Scholar] [CrossRef]
  8. Combs, S.E.; Thilmann, C.; Edler, L.; Debus, J.; Schulz-Ertner, D. Efficacy of Fractionated Stereotactic Reirradiation in Recurrent Gliomas: Long-Term Results in 172 Patients Treated in a Single Institution. JCO 2005, 23, 8863–8869. [Google Scholar] [CrossRef]
  9. Warburg, O. On the Origin of Cancer Cells. Science 1956, 123, 309–314. [Google Scholar] [CrossRef]
  10. Seyfried, T.N.; Flores, R.; Poff, A.M.; D’Agostino, D.P.; Mukherjee, P. Metabolic therapy: A new paradigm for managing malignant brain cancer. Cancer Lett. 2015, 356, 289–300. [Google Scholar] [CrossRef]
  11. Elstrom, R.L.; Bauer, D.E.; Buzzai, M.; Karnauskas, R.; Harris, M.H.; Plas, D.R.; Zhuang, H.; Cinalli, R.M.; Alavi, A.; Rudin, C.M.; et al. Akt stimulates aerobic glycolysis in cancer cells. Cancer Res. 2004, 64, 3892–3899. [Google Scholar] [CrossRef] [Green Version]
  12. Chakravarti, A.; Zhai, G.; Suzuki, Y.; Sarkesh, S.; Black, P.M.; Muzikansky, A.; Loeffler, J.S. The prognostic significance of phosphatidylinositol 3-kinase pathway activation in human gliomas. J. Clin. Oncol. 2004, 22, 1926–1933. [Google Scholar] [CrossRef] [PubMed] [Green Version]
  13. Liu, Y.; Li, Y.; Tian, R.; Liu, W.; Fei, Z.; Long, Q.; Wang, X.; Zhang, X. The expression and significance of HIF-1alpha and GLUT-3 in glioma. Brain Res. 2009, 1304, 149–154. [Google Scholar] [CrossRef] [PubMed]
  14. Oudard, S.; Boitier, E.; Miccoli, L.; Rousset, S.; Dutrillaux, B.; Poupon, M.F. Gliomas are driven by glycolysis: Putative roles of hexokinase, oxidative phosphorylation and mitochondrial ultrastructure. Anticancer Res. 1997, 17, 1903–1911. [Google Scholar] [PubMed]
  15. Maurer, G.D.; Brucker, D.P.; Bähr, O.; Harter, P.N.; Hattingen, E.; Walenta, S.; Mueller-Klieser, W.; Steinbach, J.P.; Rieger, J. Differential utilization of ketone bodies by neurons and glioma cell lines: A rationale for ketogenic diet as experimental glioma therapy. BMC Cancer 2011, 11, 315. [Google Scholar] [CrossRef] [PubMed] [Green Version]
  16. Kiebish, M.A.; Han, X.; Cheng, H.; Seyfried, T.N. In Vitro Growth Environment Produces Lipidomic and Electron Transport Chain Abnormalities in Mitochondria from Non-Tumorigenic Astrocytes and Brain Tumours. ASN Neuro 2009, 1, AN20090011. [Google Scholar] [CrossRef] [Green Version]
  17. Seyfried, T.N.; Mukherjee, P. Targeting energy metabolism in brain cancer: Review and hypothesis. Nutr. Metab. 2005, 2, 30. [Google Scholar] [CrossRef] [PubMed] [Green Version]
  18. Skinner, R.; Trujillo, A.; Ma, X.; Beierle, E.A. Ketone bodies inhibit the viability of human neuroblastoma cells. J. Pediatric Surg. 2009, 44, 212–216. [Google Scholar] [CrossRef] [PubMed]
  19. Seymour, K.J.; Bluml, S.; Sutherling, J.; Sutherling, W.; Ross, B.D. Identification of cerebral acetone by 1H-MRS in patients with epilepsy controlled by ketogenic diet. MAGMA 1999, 8, 33–42. [Google Scholar] [CrossRef]
  20. Berrington, A.; Schreck, K.C.; Barron, B.J.; Blair, L.; Lin, D.D.M.; Hartman, A.L.; Kossoff, E.; Easter, L.; Whitlow, C.T.; Jung, Y.; et al. Cerebral Ketones Detected by 3T MR Spectroscopy in Patients with High-Grade Glioma on an Atkins-Based Diet. AJNR 2019, 40, 1908–1915. [Google Scholar] [CrossRef]
  21. Artzi, M.; Liberman, G.; Vaisman, N.; Bokstein, F.; Vitinshtein, F.; Aizenstein, O.; Ben Bashat, D. Changes in cerebral metabolism during ketogenic diet in patients with primary brain tumors: 1H-MRS study. J. Neuro Oncol. 2017, 132, 267–275. [Google Scholar] [CrossRef]
  22. Rieger, J.; Bähr, O.; Maurer, G.D.; Hattingen, E.; Franz, K.; Brucker, D.; Walenta, S.; Kämmerer, U.; Coy, J.F.; Weller, M.; et al. ERGO: A pilot study of ketogenic diet in recurrent glioblastoma. Int. J. Oncol. 2014, 44, 1843–1852. [Google Scholar] [CrossRef] [PubMed] [Green Version]
  23. Thio, L.L.; Erbayat-Altay, E.; Rensing, N.; Yamada, K.A. Leptin contributes to slower weight gain in juvenile rodents on a ketogenic diet. Pediatr. Res. 2006, 60, 413–417. [Google Scholar] [CrossRef] [PubMed] [Green Version]
  24. De Feyter, H.M.; Behar, K.L.; Rao, J.U.; Madden-Hennessey, K.; Ip, K.L.; Hyder, F.; Drewes, L.R.; Geschwind, J.-F.; de Graaf, R.A.; Rothman, D.L. A ketogenic diet increases transport and oxidation of ketone bodies in RG2 and 9L gliomas without affecting tumor growth. Neuro-Oncology 2016, 18, 1079–1087. [Google Scholar] [CrossRef] [PubMed]
  25. Mukherjee, P. Antiangiogenic and Proapoptotic Effects of Dietary Restriction on Experimental Mouse and Human Brain Tumors. Clin. Cancer Res. 2004, 10, 5622–5629. [Google Scholar] [CrossRef] [Green Version]
  26. Seyfried, T.N.; Sanderson, T.M.; El-Abbadi, M.M.; McGowan, R.; Mukherjee, P. Role of glucose and ketone bodies in the metabolic control of experimental brain cancer. Br. J. Cancer 2003, 89, 1375–1382. [Google Scholar] [CrossRef] [Green Version]
  27. Zhou, W.; Mukherjee, P.; Kiebish, M.A.; Markis, W.T.; Mantis, J.G.; Seyfried, T.N. The calorically restricted ketogenic diet, an effective alternative therapy for malignant brain cancer. Nutr. Metab. 2007, 4, 5. [Google Scholar] [CrossRef] [Green Version]
  28. Raffaghello, L.; Lee, C.; Safdie, F.M.; Wei, M.; Madia, F.; Bianchi, G.; Longo, V.D. Starvation-dependent differential stress resistance protects normal but not cancer cells against high-dose chemotherapy. Proc. Natl. Acad. Sci. USA 2008, 105, 8215–8220. [Google Scholar] [CrossRef] [Green Version]
  29. Di Biase, S.; Shim, H.S.; Kim, K.H.; Vinciguerra, M.; Rappa, F.; Wei, M.; Brandhorst, S.; Cappello, F.; Mirzaei, H.; Lee, C.; et al. Fasting regulates EGR1 and protects from glucose- and dexamethasone-dependent sensitization to chemotherapy. PLoS Biol. 2017, 15, e2001951. [Google Scholar] [CrossRef] [Green Version]
  30. Lee, C.; Safdie, F.M.; Raffaghello, L.; Wei, M.; Madia, F.; Parrella, E.; Hwang, D.; Cohen, P.; Bianchi, G.; Longo, V.D. Reduced levels of IGF-I mediate differential protection of normal and cancer cells in response to fasting and improve chemotherapeutic index. Cancer Res. 2010, 70, 1564–1572. [Google Scholar] [CrossRef] [Green Version]
  31. Brandhorst, S.; Wei, M.; Hwang, S.; Morgan, T.E.; Longo, V.D. Short-term calorie and protein restriction provide partial protection from chemotoxicity but do not delay glioma progression. Exp. Gerontol. 2013, 48, 1120–1128. [Google Scholar] [CrossRef] [Green Version]
  32. Moreira, J.; Hamraz, M.; Abolhassani, M.; Bigan, E.; Pérès, S.; Paulevé, L.; Nogueira, M.; Steyaert, J.-M.; Schwartz, L. The Redox Status of Cancer Cells Supports Mechanisms behind the Warburg Effect. Metabolites 2016, 6, 33. [Google Scholar] [CrossRef] [PubMed]
  33. Cardone, R.A.; Casavola, V.; Reshkin, S.J. The role of disturbed pH dynamics and the Na+/H+ exchanger in metastasis. Nat. Rev. Cancer 2005, 5, 786–795. [Google Scholar] [CrossRef] [PubMed]
  34. Alfarouk, K.O.; Muddathir, A.K.; Shayoub, M.E.A. Tumor Acidity as Evolutionary Spite. Cancers 2011, 3, 408–414. [Google Scholar] [CrossRef] [PubMed] [Green Version]
  35. Radda, G.K. Handbook of Magnetic Resonance Spectroscopy in Vivo: MRS Theory, Practice and Applications; Bottomley, P.A., Griffiths, J.R., Eds.; John Wiley & Sons, Inc.: Hoboken, NJ, USA, 2016; ISBN 978-1-118-99766-6. [Google Scholar]
  36. Meidenbauer, J.J.; Mukherjee, P.; Seyfried, T.N. The glucose ketone index calculator: A simple tool to monitor therapeutic efficacy for metabolic management of brain cancer. Nutr. Metab. 2015, 12, 12. [Google Scholar] [CrossRef] [PubMed] [Green Version]
  37. Voss, M.; Wagner, M.; von Mettenheim, N.; Harter, P.N.; Wenger, K.J.; Franz, K.; Bojunga, J.; Vetter, M.; Gerlach, R.; Glatzel, M.; et al. ERGO2: A prospective randomized trial of calorie restricted ketogenic diet and fasting in addition to re-irradiation for malignant glioma. Int. J. Radiat. Oncol. Biol. Phys. 2020, 108, 987–995. [Google Scholar] [CrossRef]
  38. Pan, J.W.; Rothman, T.L.; Behar, K.L.; Stein, D.T.; Hetherington, H.P. Human brain beta-hydroxybutyrate and lactate increase in fasting-induced ketosis. J. Cereb. Blood Flow Metab. 2000, 20, 1502–1507. [Google Scholar] [CrossRef] [PubMed] [Green Version]
  39. Cecil, K.M.; Mulkey, S.B.; Ou, X.; Glasier, C.M. Brain ketones detected by proton magnetic resonance spectroscopy in an infant with Ohtahara syndrome treated with ketogenic diet. Pediatr. Radiol. 2015, 45, 133–137. [Google Scholar] [CrossRef]
  40. Halestrap, A.P.; Wilson, M.C. The monocarboxylate transporter family-Role and regulation. IUBMB Life 2012, 64, 109–119. [Google Scholar] [CrossRef]
  41. Leino, R.L.; Gerhart, D.Z.; Duelli, R.; Enerson, B.E.; Drewes, L.R. Diet-induced ketosis increases monocarboxylate transporter (MCT1) levels in rat brain. Neurochem. Int. 2001, 38, 519–527. [Google Scholar] [CrossRef]
  42. Pifferi, F.; Tremblay, S.; Croteau, E.; Fortier, M.; Tremblay-Mercier, J.; Lecomte, R.; Cunnane, S.C. Mild experimental ketosis increases brain uptake of 11 C-acetoacetate and 18 F-fluorodeoxyglucose: A dual-tracer PET imaging study in rats. Nutr. Neurosci. 2011, 14, 51–58. [Google Scholar] [CrossRef]
  43. Musa-Veloso, K. Non-invasive detection of ketosis and its application in refractory epilepsy. Prostaglandins Leukot. Essent. Fat. Acids 2004, 70, 329–335. [Google Scholar] [CrossRef] [PubMed]
  44. Sulway, M.J.; Malins, J.M. Acetone in diabetic ketoacidosis. Lancet 1970, 2, 736–740. [Google Scholar] [CrossRef]
  45. Likhodii, S.S.; Burnham, W.M. Ketogenic diet: Does acetone stop seizures? Med. Sci. Monit. 2002, 8, HY19-24. [Google Scholar] [PubMed]
  46. Boros, L.G.; Collins, T.Q.; Somlyai, G. What to eat or what not to eat-that is still the question. Neuro-Oncology 2017, 19, 595–596. [Google Scholar] [CrossRef] [Green Version]
  47. De Feyter, H.M.; Behar, K.L.; de Graaf, R.A.; Rothman, D.L. “What to eat or what not to eat-that is still the question”—Reply. Neuro-Oncology 2017, 19, 596–597. [Google Scholar] [CrossRef] [Green Version]
  48. Rieger, J.; Steinbach, J.P. To diet or not to diet—that is still the question. Neuro-Oncology 2016, 18, 1035–1036. [Google Scholar] [CrossRef] [Green Version]
  49. Webb, B.A.; Chimenti, M.; Jacobson, M.P.; Barber, D.L. Dysregulated pH: A perfect storm for cancer progression. Nat. Rev. Cancer 2011, 11, 671–677. [Google Scholar] [CrossRef]
  50. Persi, E.; Duran-Frigola, M.; Damaghi, M.; Roush, W.R.; Aloy, P.; Cleveland, J.L.; Gillies, R.J.; Ruppin, E. Systems analysis of intracellular pH vulnerabilities for cancer therapy. Nat. Commun. 2018, 9, 2997. [Google Scholar] [CrossRef]
  51. Counillon, L.; Bouret, Y.; Marchiq, I.; Pouysségur, J. Na + /H + antiporter (NHE1) and lactate/H + symporters (MCTs) in pH homeostasis and cancer metabolism. BBA Mol. Cell Res. 2016, 1863, 2465–2480. [Google Scholar] [CrossRef]
  52. García-Cañaveras, J.C.; Chen, L.; Rabinowitz, J.D. The Tumor Metabolic Microenvironment: Lessons from Lactate. Cancer Res. 2019, 79, 3155–3162. [Google Scholar] [CrossRef] [Green Version]
  53. Voronina, P.P.; Adamovich, K.V.; Adamovich, T.V.; Dubouskaya, T.G.; Hrynevich, S.V.; Waseem, T.V.; Fedorovich, S.V. High Concentration of Ketone Body β-Hydroxybutyrate Modifies Synaptic Vesicle Cycle and Depolarizes Plasma Membrane of Rat Brain Synaptosomes. J. Mol. Neurosci. 2020, 70, 112–119. [Google Scholar] [CrossRef] [PubMed]
  54. Wenger, K.J.; Steinbach, J.P.; Bähr, O.; Pilatus, U.; Hattingen, E. Lower Lactate Levels and Lower Intracellular pH in Patients with IDH -Mutant versus Wild-Type Gliomas. AJNR 2020, 41, 1414–1422. [Google Scholar] [CrossRef] [PubMed]
  55. Wenger, K.J.; Hattingen, E.; Franz, K.; Steinbach, J.P.; Bähr, O.; Pilatus, U. Intracellular pH measured by 31 P-MR-spectroscopy might predict site of progression in recurrent glioblastoma under antiangiogenic therapy. J. Magn. Reson. Imaging 2017, 46, 1200–1208. [Google Scholar] [CrossRef] [PubMed]
  56. Henke, G.; Paulsen, F.; Steinbach, J.P.; Ganswindt, U.; Isijanov, H.; Kortmann, R.-D.; Bamberg, M.; Belka, C. Hypofractionated reirradiation for recurrent malignant glioma. Strahlenther Onkol. 2009, 185, 113–119. [Google Scholar] [CrossRef] [PubMed]
  57. Klose, U. (Ed.) Proceedings of Data Acquisition and Evaluation Methods in Proton MR Spectroscopy 2011; Shaker Verlag: Herzogenrath, Germany, 2012; ISBN 978-3-8440-1116-6. [Google Scholar]
  58. Kreis, R. The trouble with quality filtering based on relative Cramér-Rao lower bounds. Magn. Reson. Med. 2016, 75, 15–18. [Google Scholar] [CrossRef] [PubMed]
  59. Provencher, S.W. Estimation of metabolite concentrations from localized in vivo proton NMR spectra. Magn. Reson. Med. 1993, 30, 672–679. [Google Scholar] [CrossRef]
  60. Naressi, A.; Couturier, C.; Castang, I.; de Beer, R.; Graveron-Demilly, D. Java-based graphical user interface for MRUI, a software package for quantitation of in vivo/medical magnetic resonance spectroscopy signals. Comput. Biol. Med. 2001, 31, 269–286. [Google Scholar] [CrossRef]
  61. Vanhamme, L.; van den Boogaart, A.; Van Huffel, S. Improved method for accurate and efficient quantification of MRS data with use of prior knowledge. J. Magn. Reson. 1997, 129, 35–43. [Google Scholar] [CrossRef] [Green Version]
  62. Raghunand, N.; Howison, C.; Sherry, A.D.; Zhang, S.; Gillies, R.J. Renal and systemic pH imaging by contrast-enhanced MRI. Magn. Reson. Med. 2003, 49, 249–257. [Google Scholar] [CrossRef]
  63. Hattingen, E.; Bähr, O.; Rieger, J.; Blasel, S.; Steinbach, J.; Pilatus, U. Phospholipid Metabolites in Recurrent Glioblastoma: In Vivo Markers Detect Different Tumor Phenotypes before and under Antiangiogenic Therapy. PLoS ONE 2013, 8, e56439. [Google Scholar] [CrossRef] [Green Version]
  64. Petroff, O.A.C.; Prichard, J.W.; Behar, K.L.; Rothman, D.L.; Alger, J.R.; Shulman, R.G. Cerebral metabolism in hyper- and hypocarbia: 31P and 1H nuclear magnetic resonance studies. Neurology 1985, 35, 1681. [Google Scholar] [CrossRef]
  65. Starcuk, Z.; Strbak, O.; Starcukova, J.; Graveron-Demilly, D. Simulation of steady state free precession acquisition mode in coupled spin systems for fast MR spectroscopic imaging. In Proceedings of the 2008 IEEE International Workshop on Imaging Systems and Techniques, Crete, Greece, 10–12 September 2008; IEEE: New York, NY, USA, 2008; pp. 302–306. [Google Scholar]
  66. Tofts, P.S.; Waldman, A.D. Spectroscopy:1H Metabolite Concentrations. In Quantitative MRI of the Brain; Tofts, P., Ed.; John Wiley & Sons, Ltd: Chichester, UK, 2003; pp. 299–339. ISBN 978-0-470-84721-3. [Google Scholar]
  67. Wenger, K.J.; Hattingen, E.; Harter, P.N.; Richter, C.; Franz, K.; Steinbach, J.P.; Bähr, O.; Pilatus, U. Fitting algorithms and baseline correction influence the results of non-invasive in vivo quantitation of 2-hydroxyglutarate with 1 H-MRS. NMR Biomed. 2019, 32, e4027. [Google Scholar] [CrossRef] [PubMed] [Green Version]
  68. Michaelis, T.; Merboldt, K.D.; Bruhn, H.; Hänicke, W.; Frahm, J. Absolute concentrations of metabolites in the adult human brain in vivo: Quantification of localized proton MR spectra. Radiology 1993, 187, 219–227. [Google Scholar] [CrossRef] [PubMed]
  69. Ganji, S.K.; Banerjee, A.; Patel, A.M.; Zhao, Y.D.; Dimitrov, I.E.; Browning, J.D.; Sherwood Brown, E.; Maher, E.A.; Choi, C. T2 measurement of J-coupled metabolites in the human brain at 3T: T2 OF J-COUPLED METABOLITES AT 3T. NMR Biomed. 2012, 25, 523–529. [Google Scholar] [CrossRef] [PubMed] [Green Version]
  70. Hattingen, E.; Pilatus, U.; Franz, K.; Zanella, F.E.; Lanfermann, H. Evaluation of optimal echo time for1H-spectroscopic imaging of brain tumors at 3 Tesla. J. Magn. Reson. Imaging 2007, 26, 427–431. [Google Scholar] [CrossRef]
Figure 1. Brain uptake and metabolism of ketone bodies. 3-HBD, hydroxybutyrate dehydrogenase; SAT, succinylCoA:acetoacetate CoA transferase; PDH, pyruvate dehydrogenase; TCA, tricarboxylic acid.
Cancers 12 03549 g001
Figure 2. Consort flow diagram of the ERGO 2 MRSI subtrial.
Cancers 12 03549 g002
Figure 3. (a) Simulated dataset tested on phantom data containing βOHB 1 mM, Acn 1 mM, AcAc 1 mM, Lac 2 mM, and standard metabolites at expected in vivo concentrations. (b,c) Analysis of patient proton MRSI data (both Patient 38) at day 6 during crKD-IF using LCModel with simulated KB and standard metabolites, as well as a build in basis data set for simulation of MM and lipids. For visualization, a line broadening of 3 Hz was applied to all spectra. Green (NAWM) and red (tumor) boxes indicate voxel positioning on T2-weighted imaging (T2WI). The tumor voxel shown (c) was excluded from analysis due to insufficient spectral quality, but shown here to demonstrate the difficulty of data evaluation in these heavily pretreated patients with recurrent high-grade glioma and ongoing re-irradiation therapy. The small Acn signal in the spectrum is comparable to the baseline modulations due to other strongly coupled metabolites, lipids, and macromolecules and this difficult to ascertain visually.
Cancers 12 03549 g003
Figure 4. Analysis of the ITT population (11 patients in Group A with crKD-IF and 8 patients in Group B with SD). Group A exhibited a significant increase in pHi in tumor voxels comparing baseline levels to day 6 during crKD-IF (p = 0.03), while there were no significant changes reported for Group B (p = 0.48). ATP levels were stable in tumor or control voxels of either group comparing baseline to day 6. A Wilcoxon signed-rank test as a paired, non-parametric statistical hypothesis test was used to compare pHi and ATP levels. Box-and-whisker plots with minimum, maximum, interquartile ranges (25th and 75th percentiles) and median are shown.
Cancers 12 03549 g004
Figure 5. Representative 31P spectra for tumor tissue and NAWM at 3T. Green (NAWM) and red (tumor) boxes indicate voxel positioning on T2WI. The original spectrum is depicted as a black line and the spectral fit as a red dotted line. One signal was used to model the inorganic phosphate (Pi). At physiological pH, H2PO4, and HPO4 ions contribute to the Pi signal. Since both components have different chemical shift, the chemical shift (signal position) of inorganic phosphate (Pi) is pH dependent and can be used as a pH-marker.
Cancers 12 03549 g005
Figure 6. 50 patients with recurrent GBM and indication for re-irradiation therapy were randomized (1:1) in two groups: Group A keeping a ketogenic diet with calorie restriction (21–23 kcal/kg/day) for nine days, including three days of fasting (0 kcal/day) and group B keeping a balanced diet. RT was performed on day 4–8 (5 × 4 Gy). 32 received an extended MRS examination at baseline (day −1) and 23/32 on day 6. MRSI examinations were scheduled in addition to routine follow-up. Adapted from Voss et al. [37].
Cancers 12 03549 g006
Table 1. Patient characteristics MRS substudy. Decimal round method if not otherwise specified.
CharacteristicsAll Patients (n = 19)Group B (n = 8)
Group A (n = 11)
General
Age, median53 (range 38–64)42.5 (range 25–61)
Age, mean53 (SD = 7)41 (SD = 14)
Karnofsky index, mean rounded to nearest tenth (SD)90 (SD = 13)90 (SD = 6)
Histology
Glioblastoma, IDH wildtype, WHO IV (n)53
Glioblastoma IDH-mutant, WHO IV (n)11
Glioblastoma IDH-mutant, IDH unknown, WHO IV (n)41
Anaplastic astrocytoma, IDH wildtype, WHO III (n)10
Oligodendroglioma, IDH-mutant and 1p/19q co-deleted, WHO II (n)01
Pleomorphic Xanthoastrocytoma, IDH wildtype (n)01
Undifferentiated neuroepithelial tumor, NOS, WHO IV (n)01
MGMT promotor methylation status
Not methylated46% (n = 5)63% (n = 5)
Methylated46% (n = 5)25% (n = 2)
Not known9% (n = 1)13% (n = 1)
Prior treatment
Radiation therapy up to 60 Gy100% (n = 11)100% (n = 8)
Concomitant TMZ100% (n = 11)88% (n = 7)
Median of adjuvant cycles of TMZ63
Prior treatment with Bevacizumab18% (n = 2)13% (n = 1)
Resection prior to study treatment9% (n = 1)50% (n = 4)
Time interval first and second irradiation (months)
Median911
Mean14 (SD = 9)17 (SD = 16)
Table 2. Quantitation of intracerebral KB in patients with KB signals with an estimated CRLB < 35% as given by LCModel
Patient IDGroupDrop out during 9 Days of crKD-IFHistology at First DiagnosisGlucose Baseline (mg/dL)Glucose Day 6 (mg/dL)Blood Ketone Levels Day 6 (mmol/L)Urine Ketosis Day 6 (mmol/L)Acn Signal Quantitation (mmol/L)
26AyesGlioblastoma78.059.00.10tumor tissue 0.12; NAWM 0.14
27AyesGlioblastoma84.098.0N/AN/ANAWM 0.28
34AnoAnaplastic astrocytoma112.078.00.41.5NAWM 0.21
38AnoGlioblastoma81.054.04.5N/ANAWM 0.25
Table 3. MR-spectroscopy sequence protocol. TR, repetition time, TE, echo time, FID, free induction decay, CSI, chemical shift imaging, PRESS, point resolved spectroscopy, * nominal size due to k-space sampling, ** defined by slice selection, *** delay between excitation and data acquisition.
SequenceSlice ThicknessTR; Excitation Flip AngleTEMatrix Size; in Plane ResolutionVector Size; BandwidthScan Time
3D FID 31P CSI25 mm *2000 ms; 60°2.3 *** ms8 × 8 × 8 at 240 × 240 × 200 mm3 FOV interpolated to 16 × 16 × 16; 30 × 30 mm2 *1024; 2000 Hz10:44 m
2D 1H PRESS sequence12.5 mm **1500 ms; 90°30 ms16 × 16 at 240 × 240, interpolated to 32 × 32; 15 × 15 mm2 *1024; 2000 Hz4:45 m
Publisher’s Note: MDPI stays neutral with regard to jurisdictional claims in published maps and institutional affiliations.

