1. Introduction
Colorectal cancer (CRC) treatment is challenging due to the heterogeneous nature of cancer, in which prognosis depends on the tumor type and disease stage. Despite progress in diagnosis and therapy, metastasis and chemoresistance are two critical processes for the overall survival of CRC patients [
1]. Approximately 50–60% of patients who are diagnosed with CRC will eventually develop metastatic disease. Most often, metastases develop after first-line chemotherapeutic drug and monoclonal antibody treatments for local disease. Over several years, many studies have demonstrated that metastatic CRC presents significant molecular heterogeneity [
2,
3]. This observation explains the enormous variability noted in regard to treatment outcomes. The cellular plasticity of epithelial to mesenchymal transition (EMT) is one of the key factors responsible for the heterogeneous nature of the metastatic CRC phenotype. EMT is not a binary process [
4]. The epithelial cells undergoing EMT give rise to cell populations that may enter into states with various proportions of epithelial and mesenchymal features. Metastatic cells represent various EMT states, from epithelial-like through to mixed epithelial/mesenchymal (hybrid) to a strongly mesenchymal phenotype. Hybrid and mesenchymal cells exhibit increased migratory and invasive features, suggesting a detrimental role of EMT during metastatic dissemination [
5,
6]. Another complicating factor is that EMT has been linked to additional traits that are not associated with canonical EMT regulation, such as stemness and resistance to anticancer therapeutic drugs [
7].
Cancer cells have developed a number of mechanisms to overcome anticancer therapy, and the active efflux of drugs from cells via multidrug resistance proteins (MRPs) is one of them. MRPs belong to the superfamily of ATP-binding cassette (ABC) proteins, active transporters with a broad range of substrate spectra, including anticancer drugs [
8]. The human genome contains 48 ABC genes, and they are classified into seven subfamilies (ABCA-ABCG) [
9]. Among them, ABCB1, ABCC1, and ABCG2 are highly involved in the acquisition of multidrug resistance (MDR). Increased ABC transporter expression has been correlated with aggressive and invasive cancers. EMT is an important regulator of ABC transporters, and the expression of ABC transporters changes continuously during EMT [
10,
11]. Mechanistically, it was demonstrated that the promoters of ABC transporters carry several binding sites for EMT-inducing transcription factors, and the overexpression of Twist, Snail, and ZEB increases the promoter activity of ABC transporters [
12,
13]. In our previous studies, we performed transcriptomic and functional analyses of CRC in the early stages of metastasis induced by the overexpression of Snail, the transcription factor involved in EMT initiation. Our results showed that Snail regulates early phenotype conversion towards a hybrid EMT. Interestingly, we found a correlation between Snail expression and ABCC4 (MRP4) protein upregulation [
14]. The relationship between epithelial transition and ABCC4 expression and function in CRC has not been previously defined. In the current study, we propose that ABCC4 expression changes during EMT and may be differentially regulated in various subpopulations of CRC. ABCC4 is able to transport a range of organic anionic compounds out of the cell; thus, most functional studies of ABCC4 have classically focused on its role in cancer chemotherapy [
15]. However, the physiological actions of this protein are quite diverse, and drug transport appears not to be the most important evolutionarily conserved function. The efflux of cyclic adenosine monophosphate (cAMP) through ABCC4 has been well documented in various cell types, suggesting that this transporter plays a relevant role in the regulation of cAMP signaling. ABCC4 was shown to modulate the compartmentalization of cAMP signaling in a colon adenocarcinoma cell line (HT29, T84), and ABCC4 inhibition with MK571 compound leads to the accumulation of cAMP at or near the plasma membrane [
16]. Notably, the inhibition of ABCC4 function through MK571 or gene knockout was shown to have a direct role in cell migration. The pharmacological inhibition of ABCC4 with MK571 resulted in the intracellular accumulation of cAMP, leading to increased fibroblast migration related to protein kinase A (PKA) activity [
17,
18]. In the current paper, we show that in CRC, similar to what has been observed in fibroblasts, ABCC4 can regulate cell migration in a cAMP-dependent manner.
The understanding of the mechanistic linkage between two phenomena, ABCC4 transport function and cell migration, would significantly contribute to the improvement of anticancer therapy in CRC. Numerous ABC transporter inhibitors have been developed and tested [
19]. The clinical use of ABC transporter inhibitors is still an ongoing challenge, partially due to the intratumor heterogeneity; thus, the evaluation of ABCC4 expression status alone or in combination with other transporters in various CRC subpopulations supported by information on signaling pathways related to ABCC4 transport function may improve the development of patient-tailored therapy.
3. Discussion
During the multistep progression of carcinomas that are initially benign, epithelial cells acquire a few distinctly mesenchymal traits that confer to them the ability to invade adjacent tissues and then disseminate to distant tissues. Much of this phenotypic progression towards increased invasiveness depends on the activation of the EMT [
5]. Experimental and clinical studies have shown that EMT is an important regulator of ABC protein expression, the active transporters of a broad range of anticancer drugs and the expression of ABC transporters change continuously during EMT [
9,
10]. We found a correlation between this phenotypic conversion and ABCC4 protein upregulation in HT29 cells overexpressing Snail; thus, in the current study, we propose that ABCC4 protein expression and function are related to epithelial reprogramming in CRC [
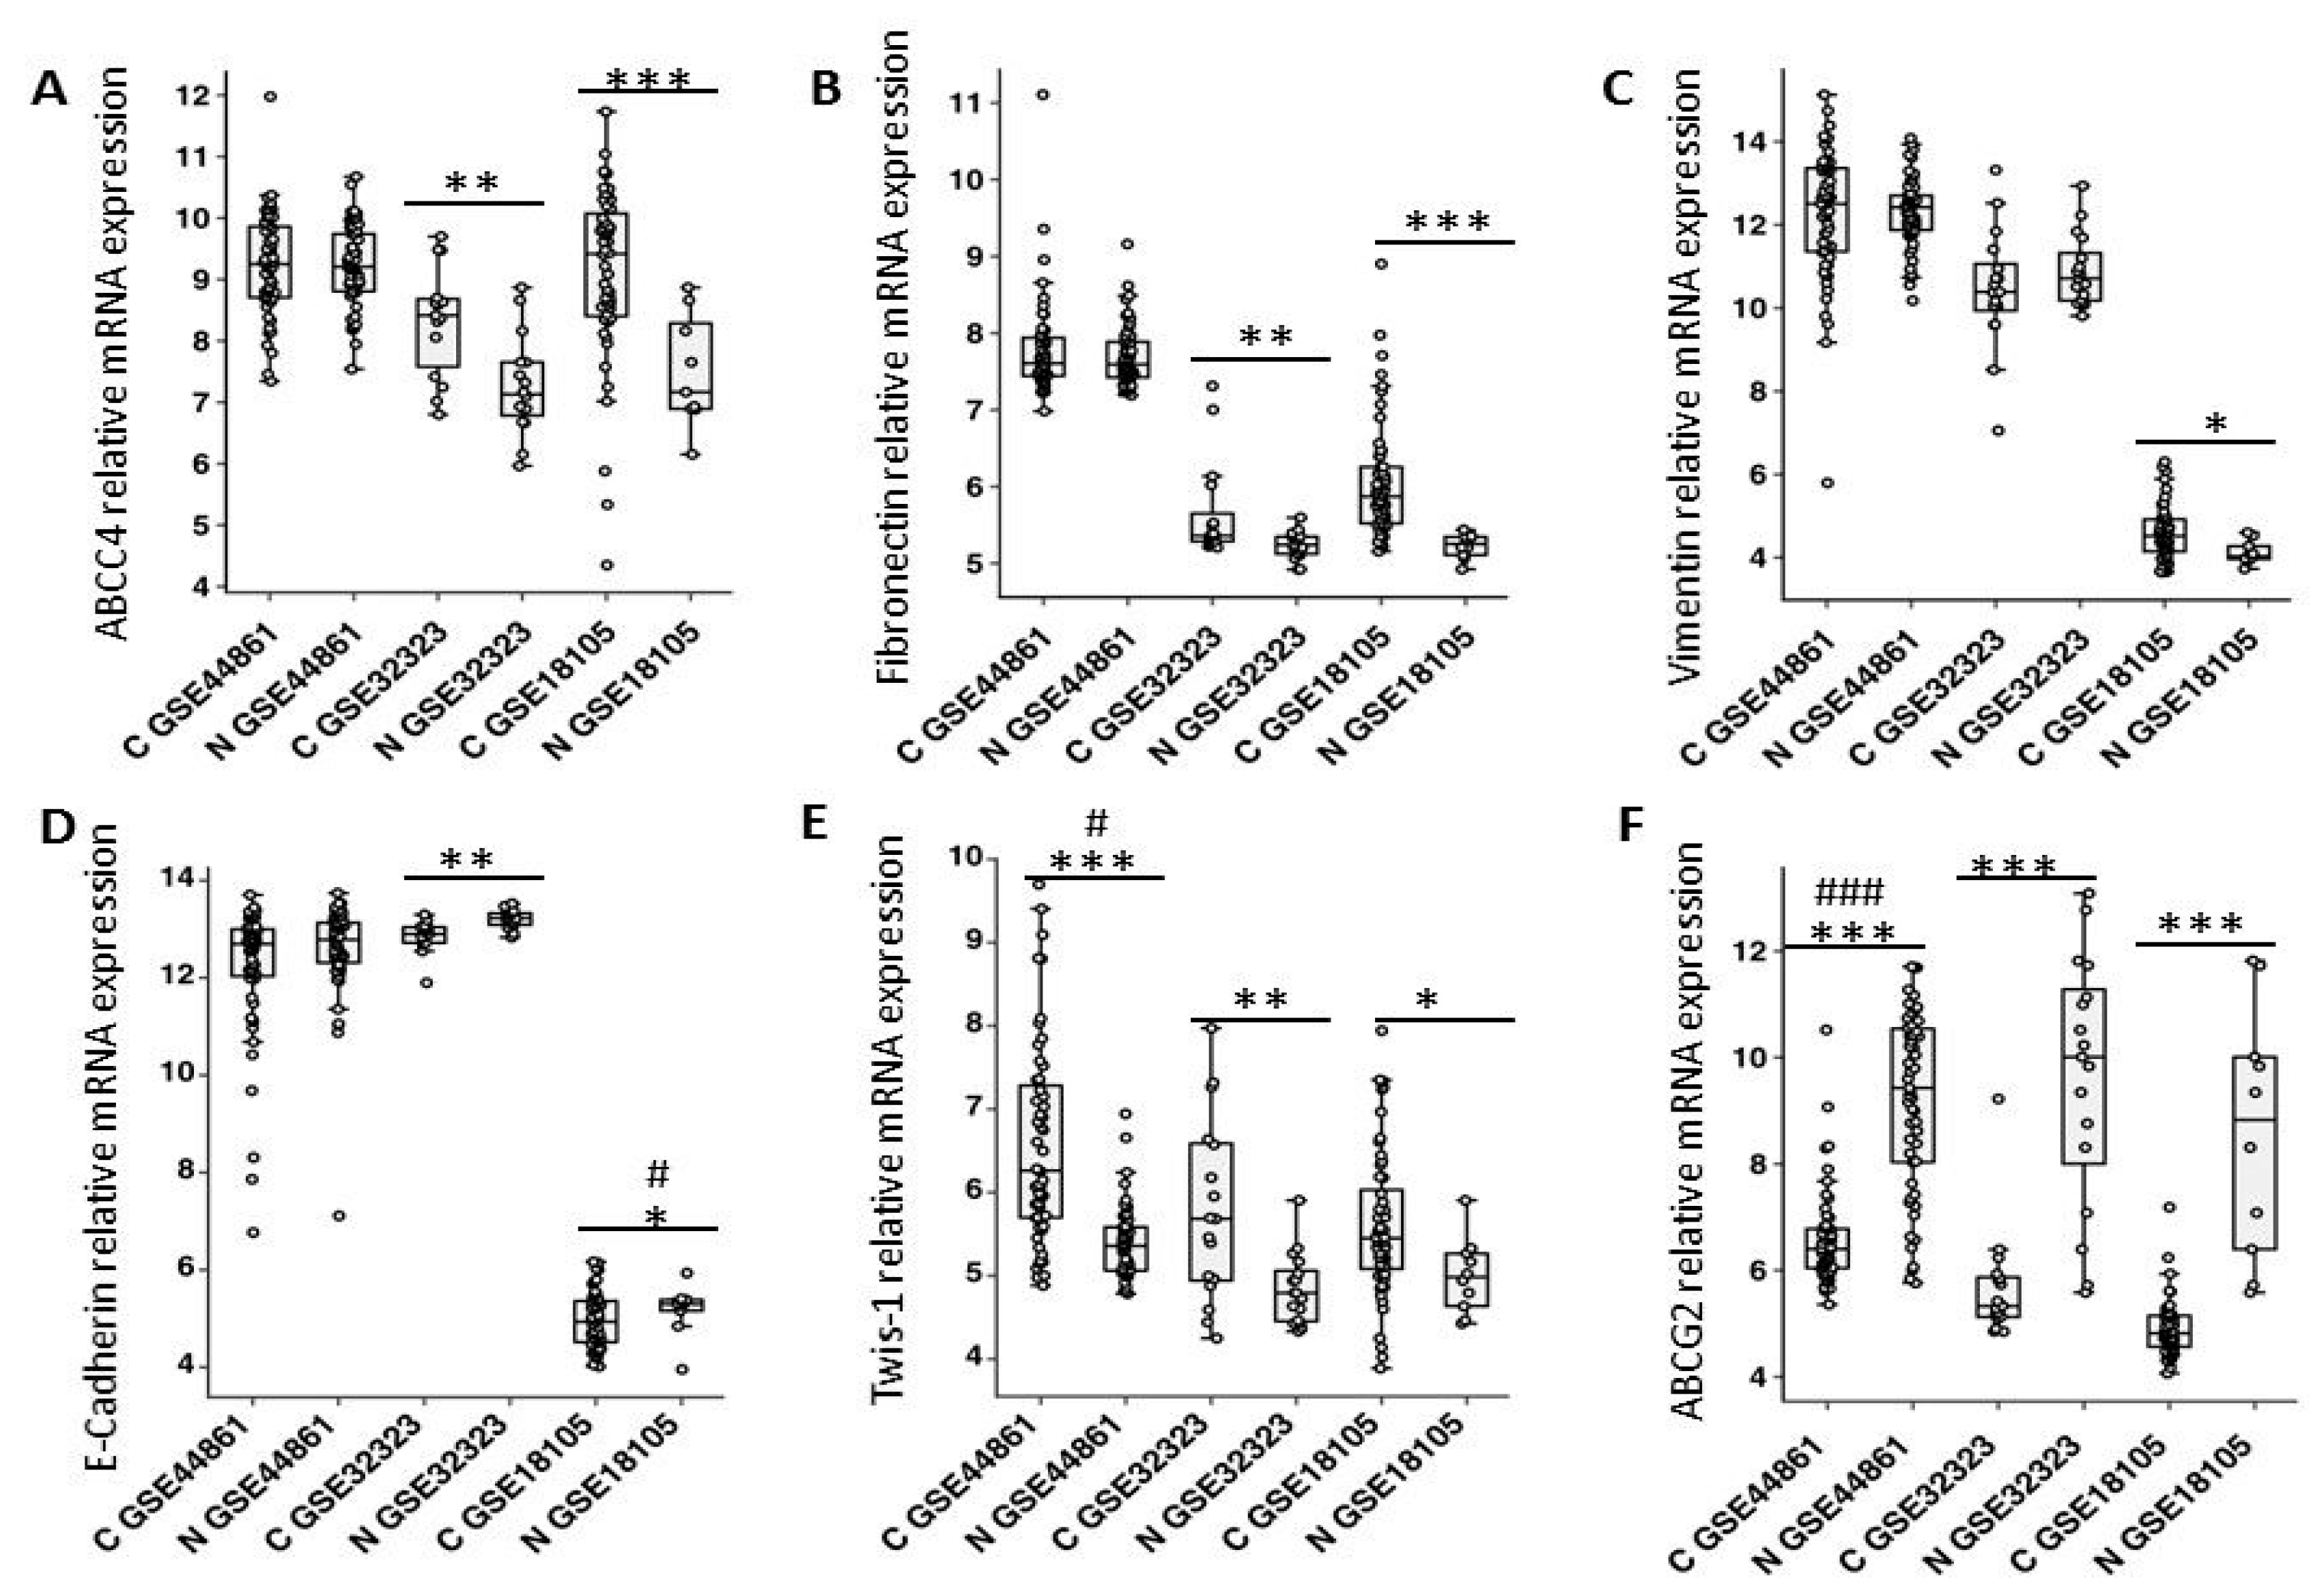
14]. To support our hypothesis, we first analyzed the
ABCC4 expression levels in CRC tissue. Our analysis of GEO sets showed that
ABCC4 expression was elevated in CRC patient samples compared to normal colon tissue. Further analysis of the same datasets revealed increased expression of mesenchymal markers and decreased expression of E-cadherin in patient samples. We also found a positive correlation between
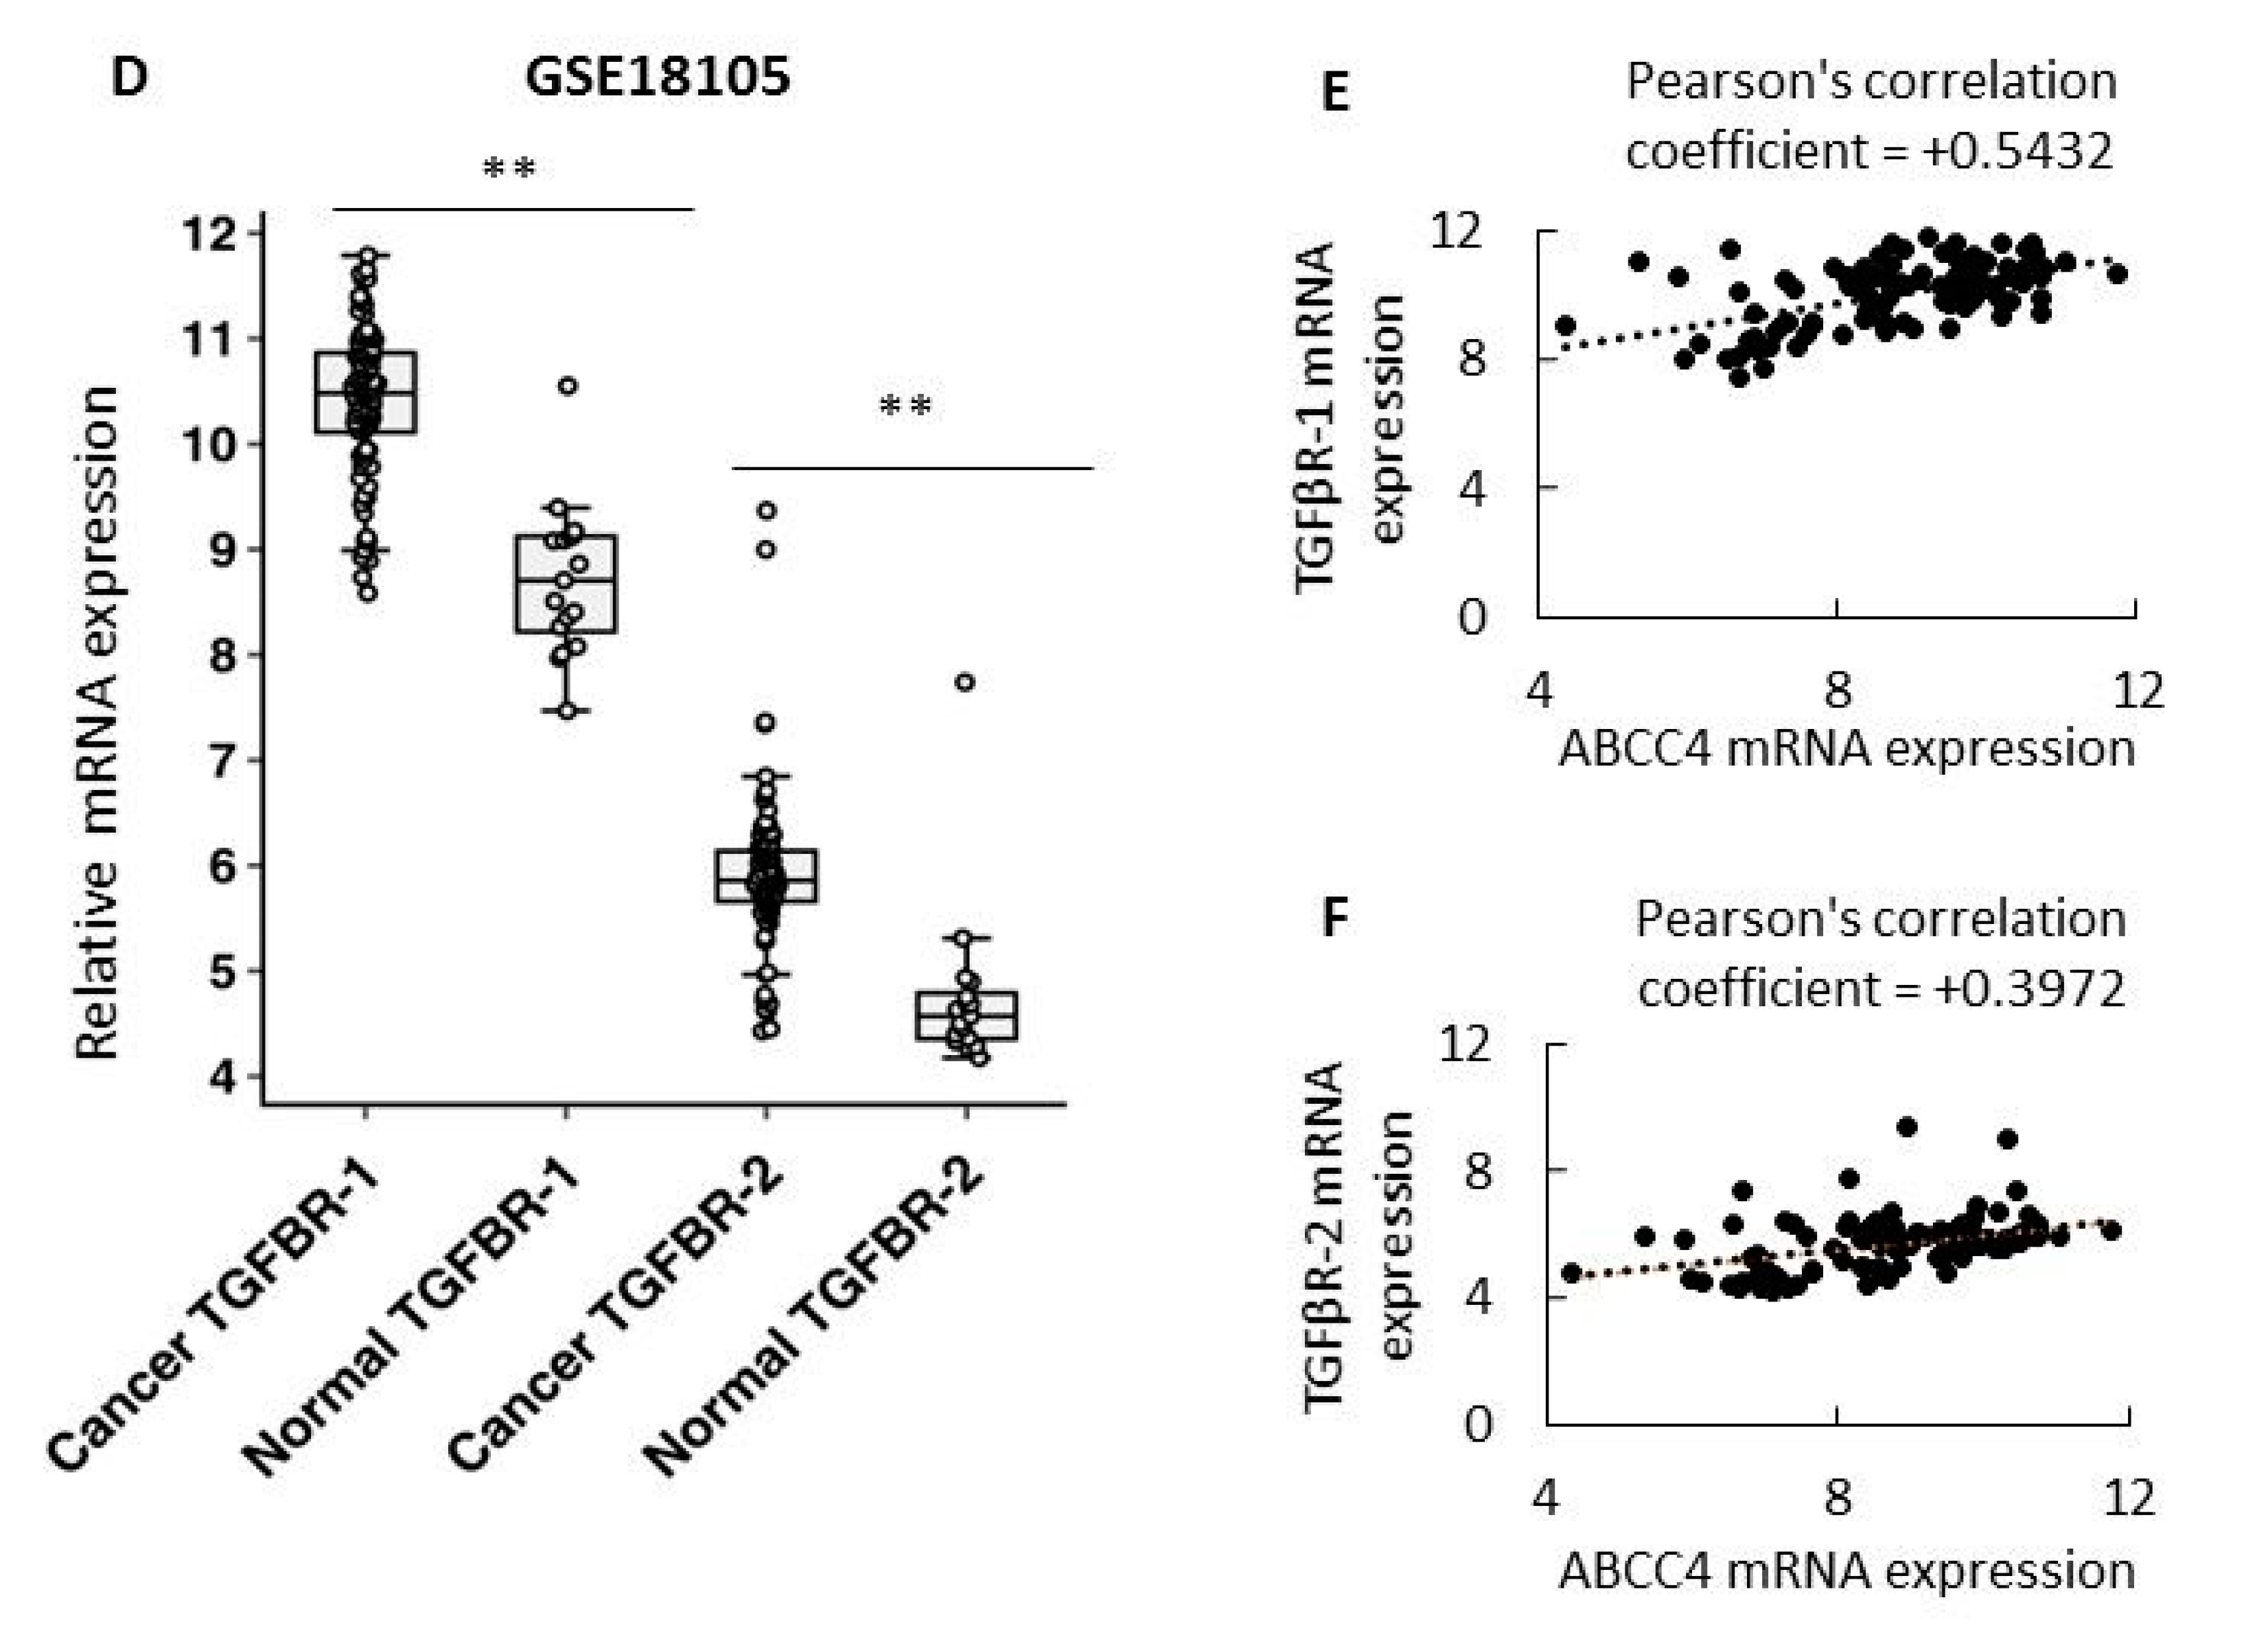
ABCC4 expression and
TGFβ1/2 receptors and its ligand
TGFβ2, which were shown to be involved in epithelial conversion induction in cancers. Clinically, ABC transporters were the first and most studied mechanism of resistance associated with MDR. Interestingly, to date, ABCG2 has been recognized as the main drug efflux protein in CRC [
21]. Several studies have shown that ABCG2, through its function in xenobiotic clearance, might play an important role in irinotecan resistance. However, other studies comparing the expression of
ABCG2 mRNA in normal colon tissue and tumor tissue showed a decreased expression in tumor tissue. The latter data suggest that primary colon cancer cells exhibit an initial downregulation of
ABCG2 mRNA expression [
22]. Our results clearly indicated that ABCC4 is a prevalent drug transporter in tumors in which ABCG2 is downregulated. We showed that HT29 lines overexpressing Snail, which represent a CRC model in the early stages of phenotype conversion, exhibited an upregulated
ABCC4 expression and concomitant downregulated
ABCG2 expression. These results correspond to microarray data (GEO) from patient samples. We found that
ABCC4 was significantly upregulated while
ABCG2 was downregulated in primary tumors compared to normal colon tissues. These data support the hypothesis that CRC may depend on several drug transporters, specifically regulating their expression and executing their function during cancer progression from primary to metastatic disease. Nevertheless, the ABC transporter mRNA expression may have limited reliability with respect to protein function. A very limited number of studies describing the association between the transcriptional and protein overexpression of ABC transporters in cancers have been published [
35]. The correlation between the level of ABC proteins and their transporter function in cancers remains to be proven as well. In CRC, the significance of ABCG2 protein measurement in predicting clinical resistance to irinotecan in patients was examined. ABCG2 protein expression analyzed by IHC showed that ABCG2-positive cells were mainly positioned in the front of the carcinomatous tissue (the invasion front), and strong membranous staining was significantly correlated with a higher Dukes’ stage, more lymph nodes, and the presence of distant metastases [
36]. However, the role of ABCG2 as a prognostic factor or predictor of irinotecan efficacy in CRC is not well established. The few studies available seem to report discordant results mainly due to the lack of validated assays and standardized reference values for IHC protocols [
21,
22]. This lack of consistency may also be a result of either cancer heterogeneity and/or an incomplete understanding of the biological role of ABC transporters in cancer progression. In view of the above, the analysis of the mRNA and protein expression levels of specific ABC transporters in relation to their transporter function in various cancer cell subpopulations may have clinical value.
ABCC4 is unique among ABC transporters since its different locations (basolateral/apical membranous versus cytoplasmic) may fundamentally influence its transport function. To date, the mechanism of ABCC4 cellular trafficking has not been elucidated; however, changes in ABCC4 expression led to changes in its localization and function [
31,
32,
33,
34]. It is widely accepted that ABC transporters can bind their substrates either from the surroundings of the plasma membrane or intracellular vesicles and transport them out of the cell directly to the external milieu [
33,
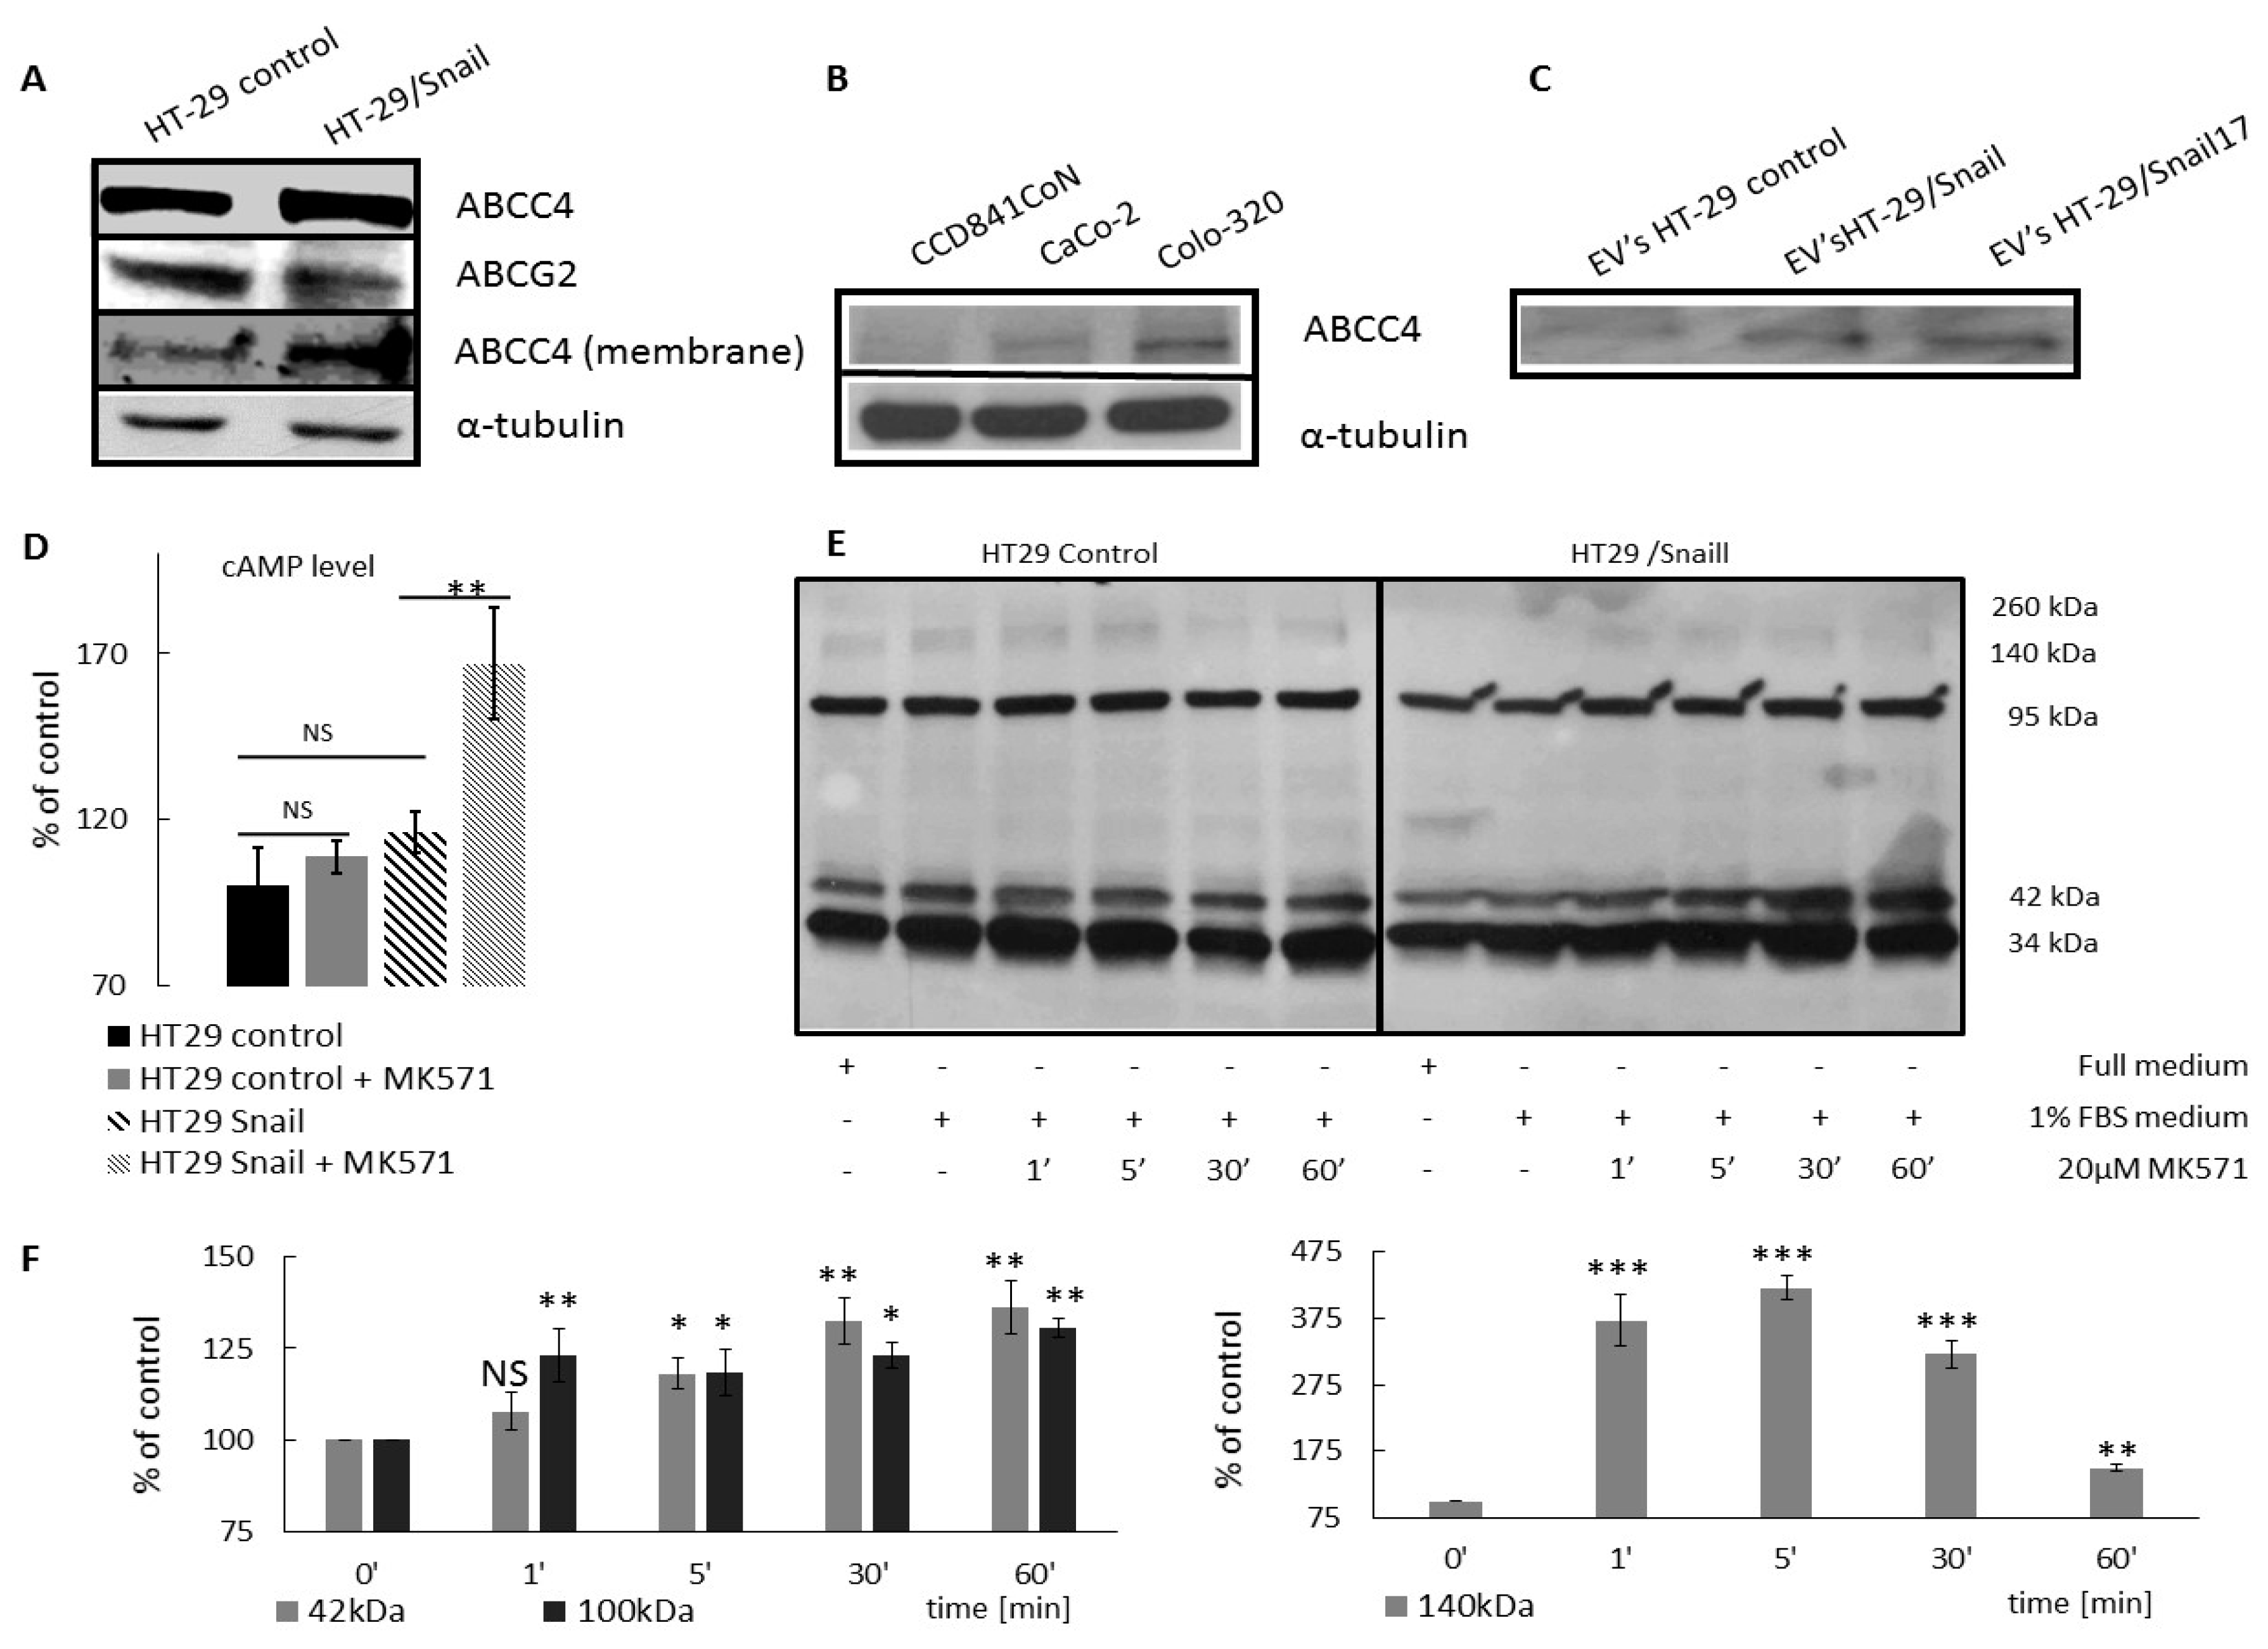
37]. Our results showed a higher level of ABCC4 in the plasma membrane fraction and in EVs from two clones of HT29 cells stably overexpressing Snail, suggesting that the level of ABCC4 expression in CRC determines its functional localization in tumor cells.
To further explore the role of the ABCC4 transporter in CRC progression, we confirmed that ABCC4 upregulation is correlated with the phenotype conversion process in CRC. We measured the ABCC4 protein level in CRC cell lines representing various phenotypes from epithelial to intermediate mesenchymal to strongly mesenchymal. All of these cell lines were either directly derived from primary colorectal cancers of different clinical stages and differentiation grades [
25]. We believe that all the lines with clearly defined genetic backgrounds—i.e., methylation and epigenetic status—the occurrence (or not) of
KRAS,
BRAF,
SMAD4, and other mutations were the best experimental models to identify the particular ABCC4 expression status in CRC to mimic a patient-specific approach. ABCC4 expression analysis in those lines showed that cells with an epithelial phenotype (CCD841CoN) expressed less ABCC4 than cells with an intermediate or a strongly mesenchymal phenotype (CaCo-2 and Colo-320, respectively). The highest expression of ABCC4 was observed in Colo-320 cells, strongly mesenchymal cells with the strongest expression of the EMT signature and the highest propensity to local invasion in the analyzed group of cells. These results confirmed that the ABCC4 expression is related to phenotypic transition in CRC.
In addition to xenobiotic efflux, ABCC4 was shown to control the export of endogenous signals, such as cyclic nucleotides and prostaglandins, and their cellular concentration; therefore, ABCC4 plays an important role in other processes. Platelet aggregation, retinal neovascularization, CFTR-mediated secretory diarrhea and fibroblast migration are partially related to ABCC4 transport activity [
37]. Among the endogenous substrates of ABCC4, cAMP and cGMP play important roles in the signaling pathways at various stages of the cell migration process, either directly or by activating their corresponding kinases. As ABCC4 was shown to have a higher affinity for cAMP, we tried to monitor the effect of ABCC4 inhibition on the intracellular cAMP levels to further evaluate the significance of ABCC4 protein in CRC progression. We noted that treatment with MK571 increased the intracellular level of cAMP in HT29 cells. However, the effect was more pronounced in HT29 cells that mesenchymal characteristics acquired by Snail overexpression.
The cAMP-PKA pathway is the most relevant mechanism to the outcome of ABCC4 expression. Localized increases in cAMP concentration and cAMP-dependent PKA at the leading edge both play pivotal roles in ensuring the polarity of migrating cells [
28,
29]. The polarized activation of the cAMP-dependent kinase PKA is not only an essential early step for directional cell migration but is also involved in actin polymerization and cytoskeleton dynamics regulation. We observed that inhibition of ABCC4 increased the intracellular level of cAMP and modulated PKA activity and phospho-serine/tyrosine levels in HT29 cells overexpressing Snail. The diversity of PKA substrates permits the regulation of multiple signaling events based on the subcellular localization of PKA [
38]. Studies have shown that at the leading edge, PKA activates small GTPases, such as Rac and Cdc42, which are important for lamellipodia and filopodia formation, respectively, during cell migration [
39]. Phosphorylation-activated Rac induces the WASP/WAVE-mediated activation of Apr 2/3 and promotes the formation of dendritic actin network-containing lamellipodia [
40]. Additionally, the PKA-dependent phosphorylation of VASP can regulate actin polymerization and hence can control protrusion formation during cell migration. [
41].
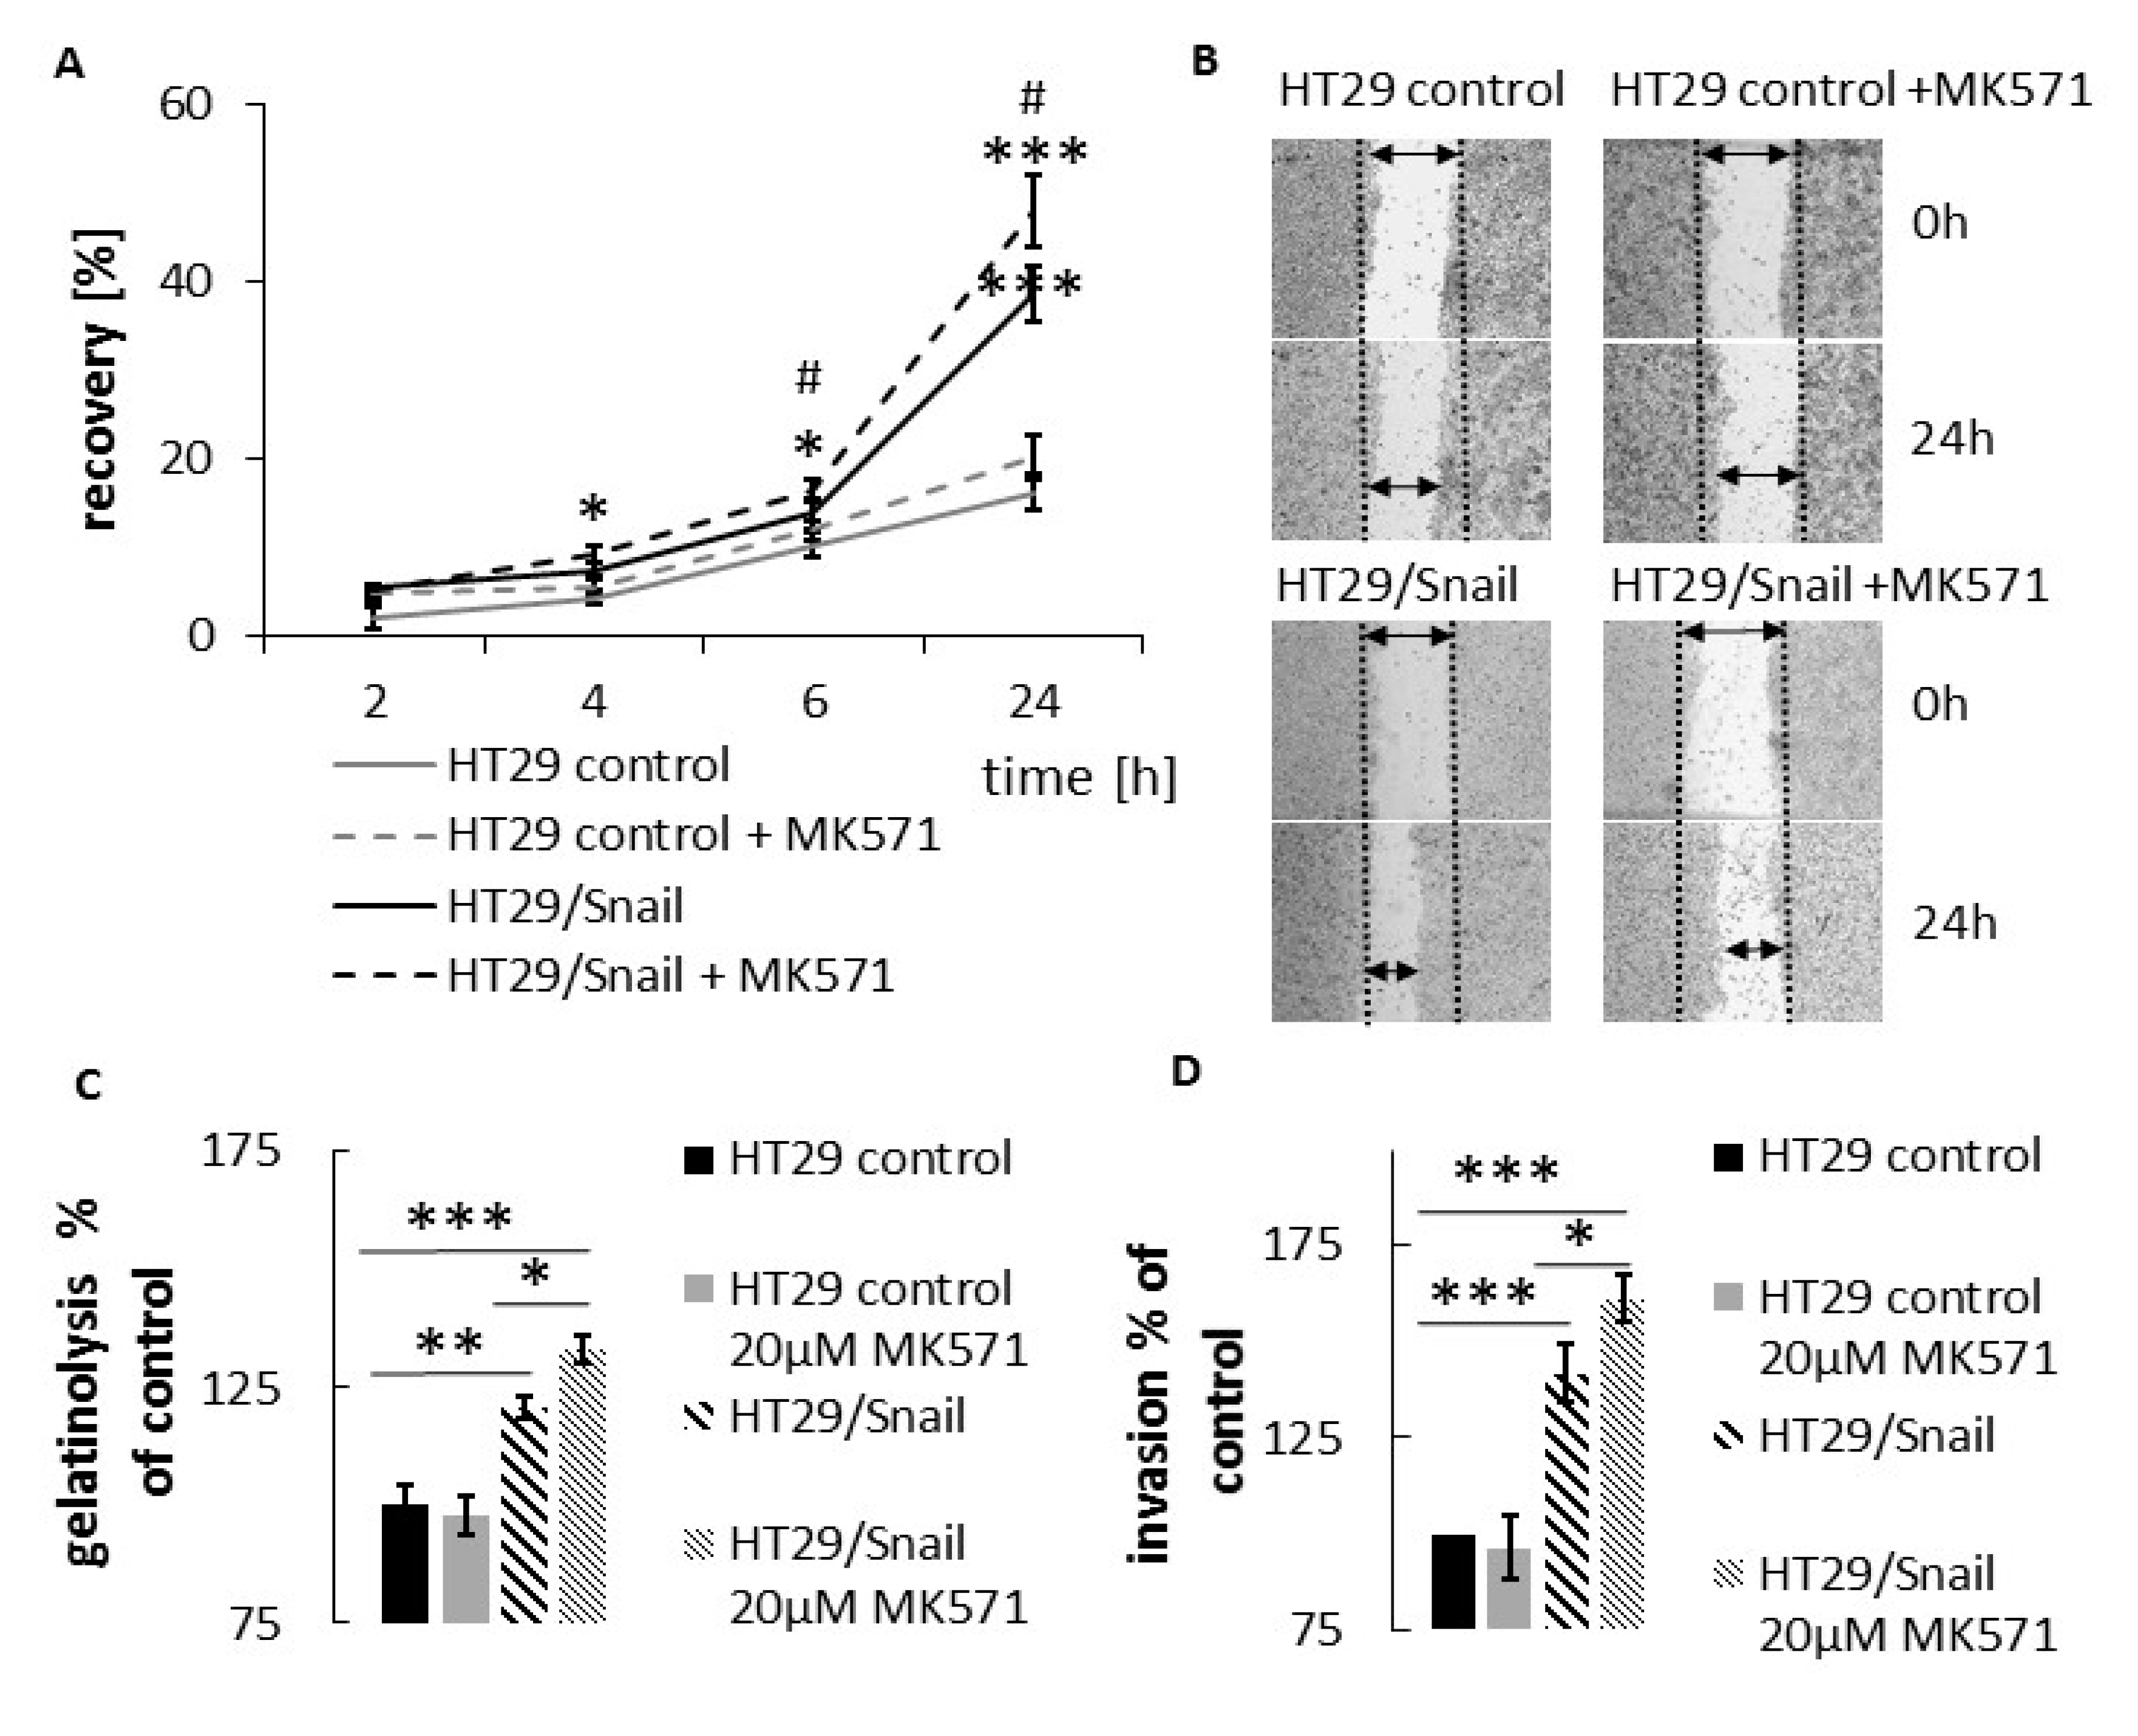
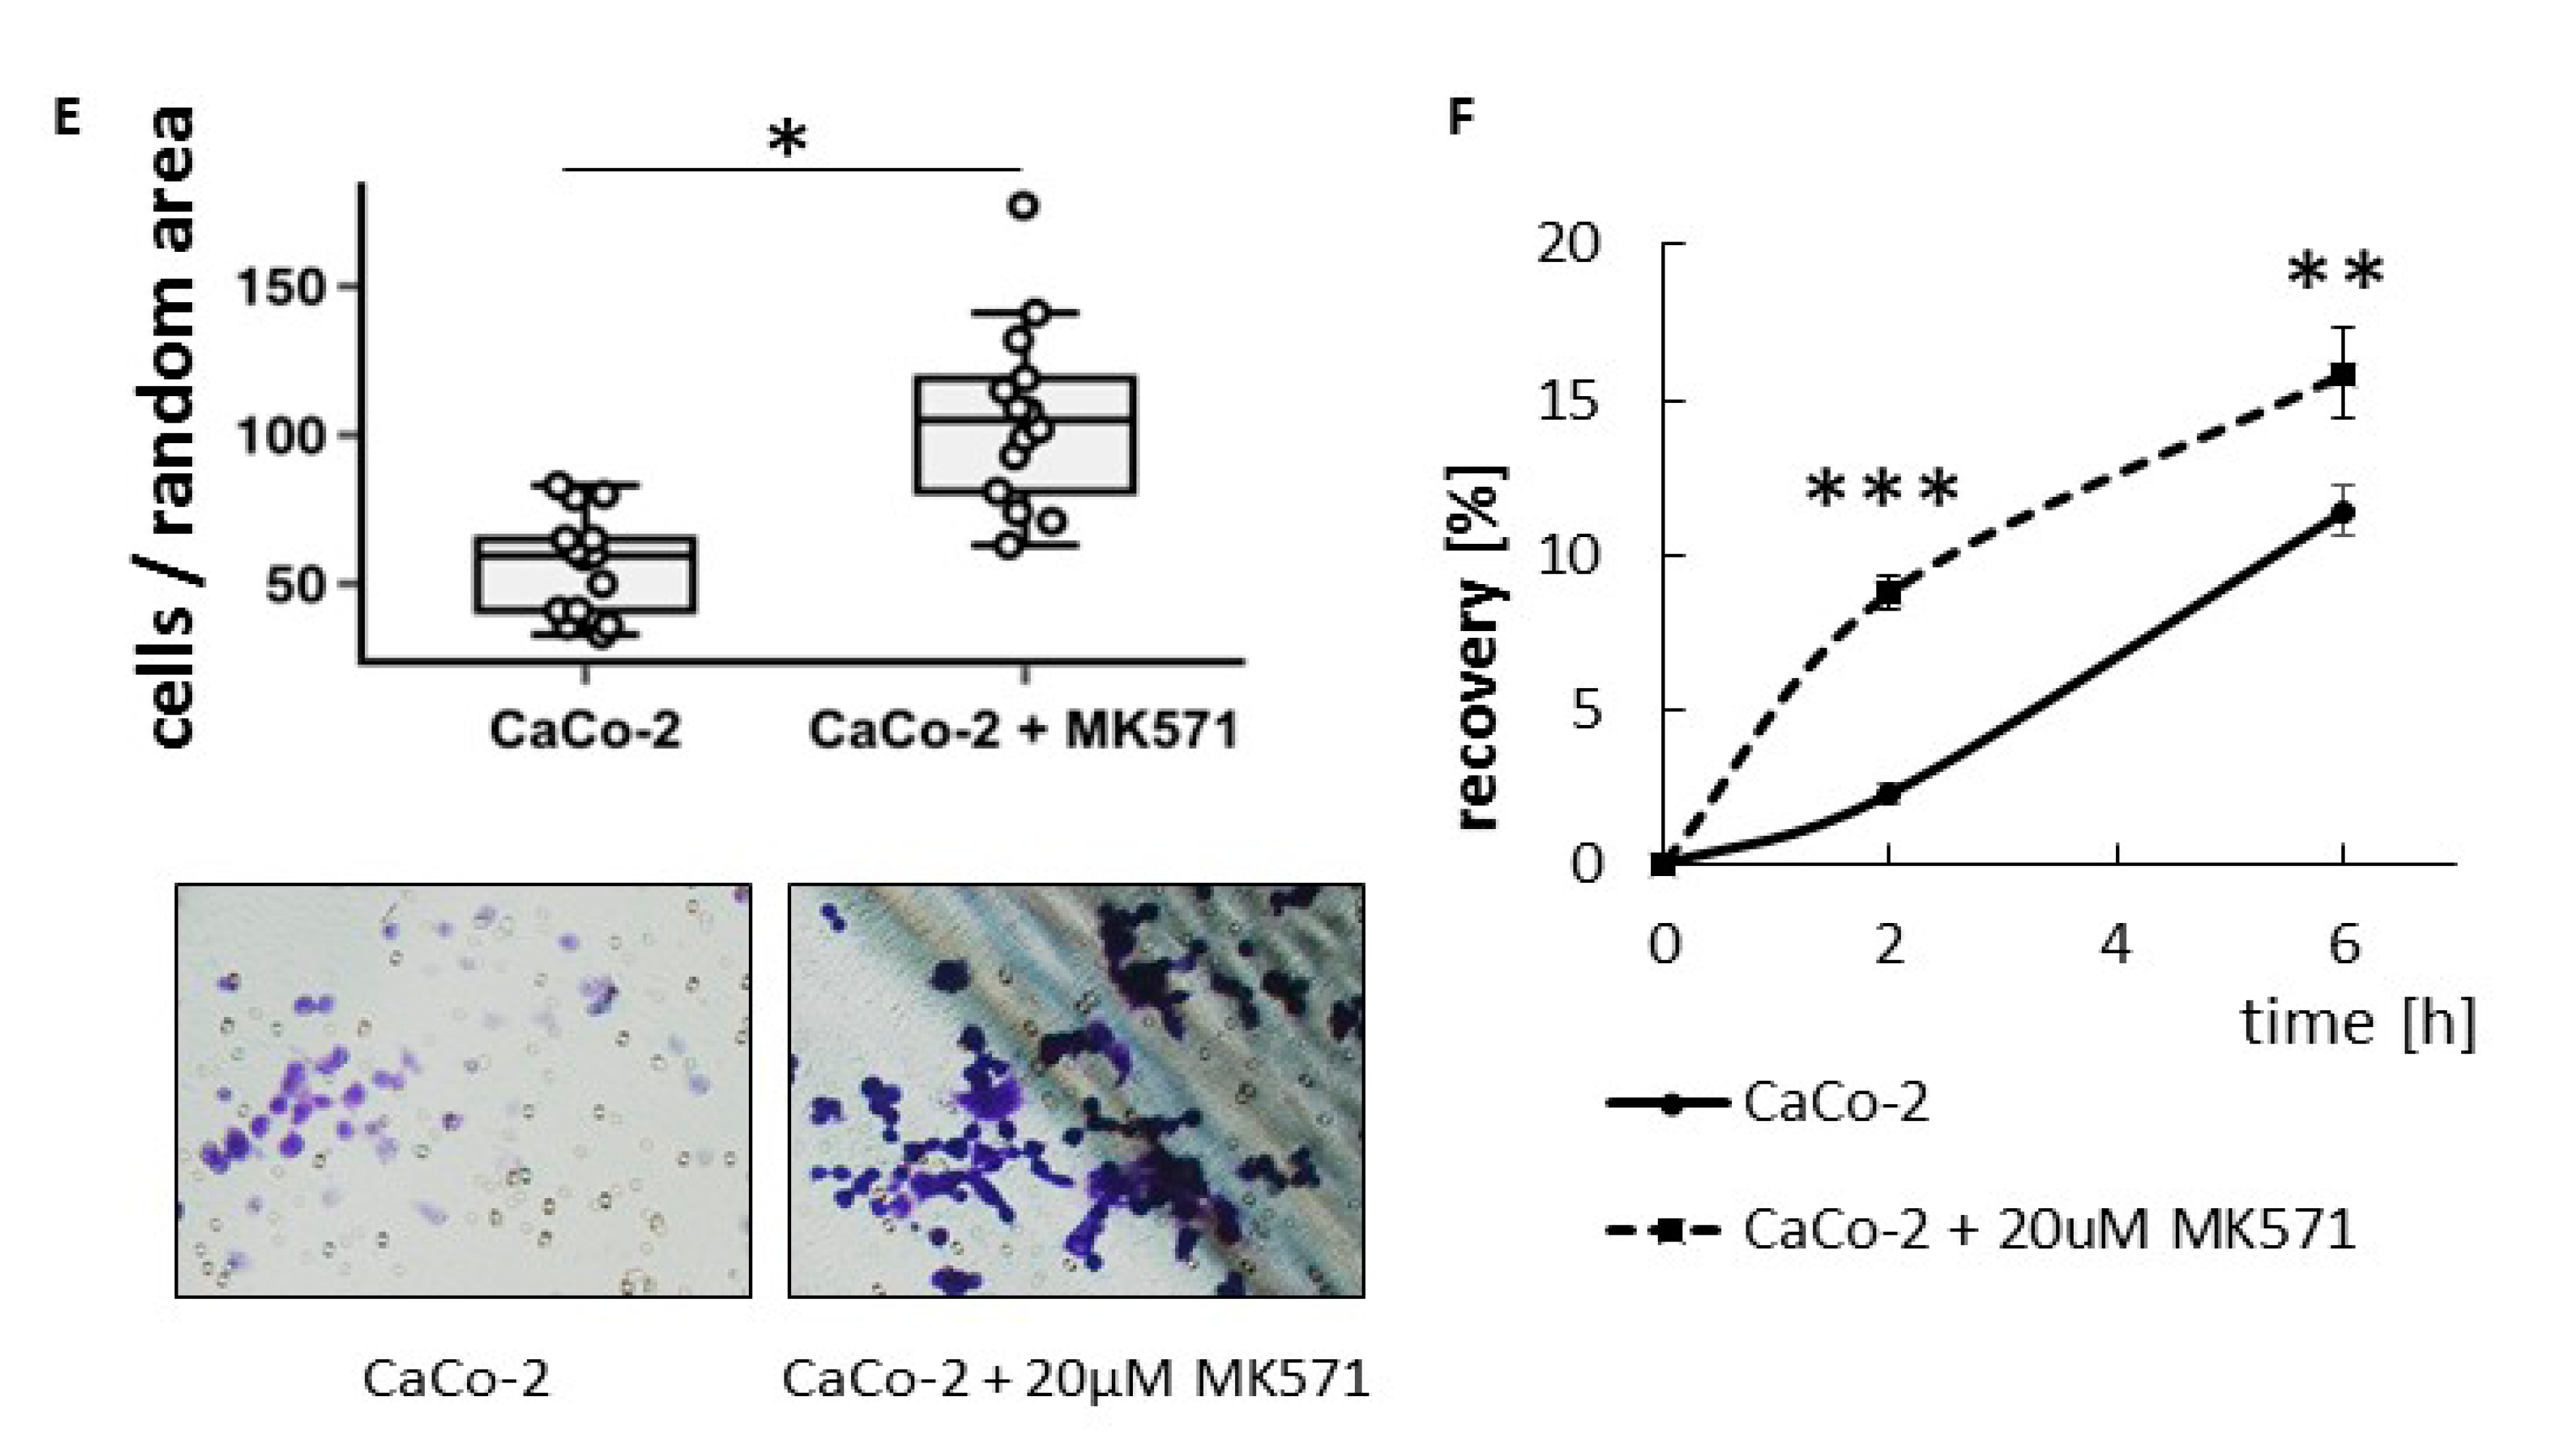
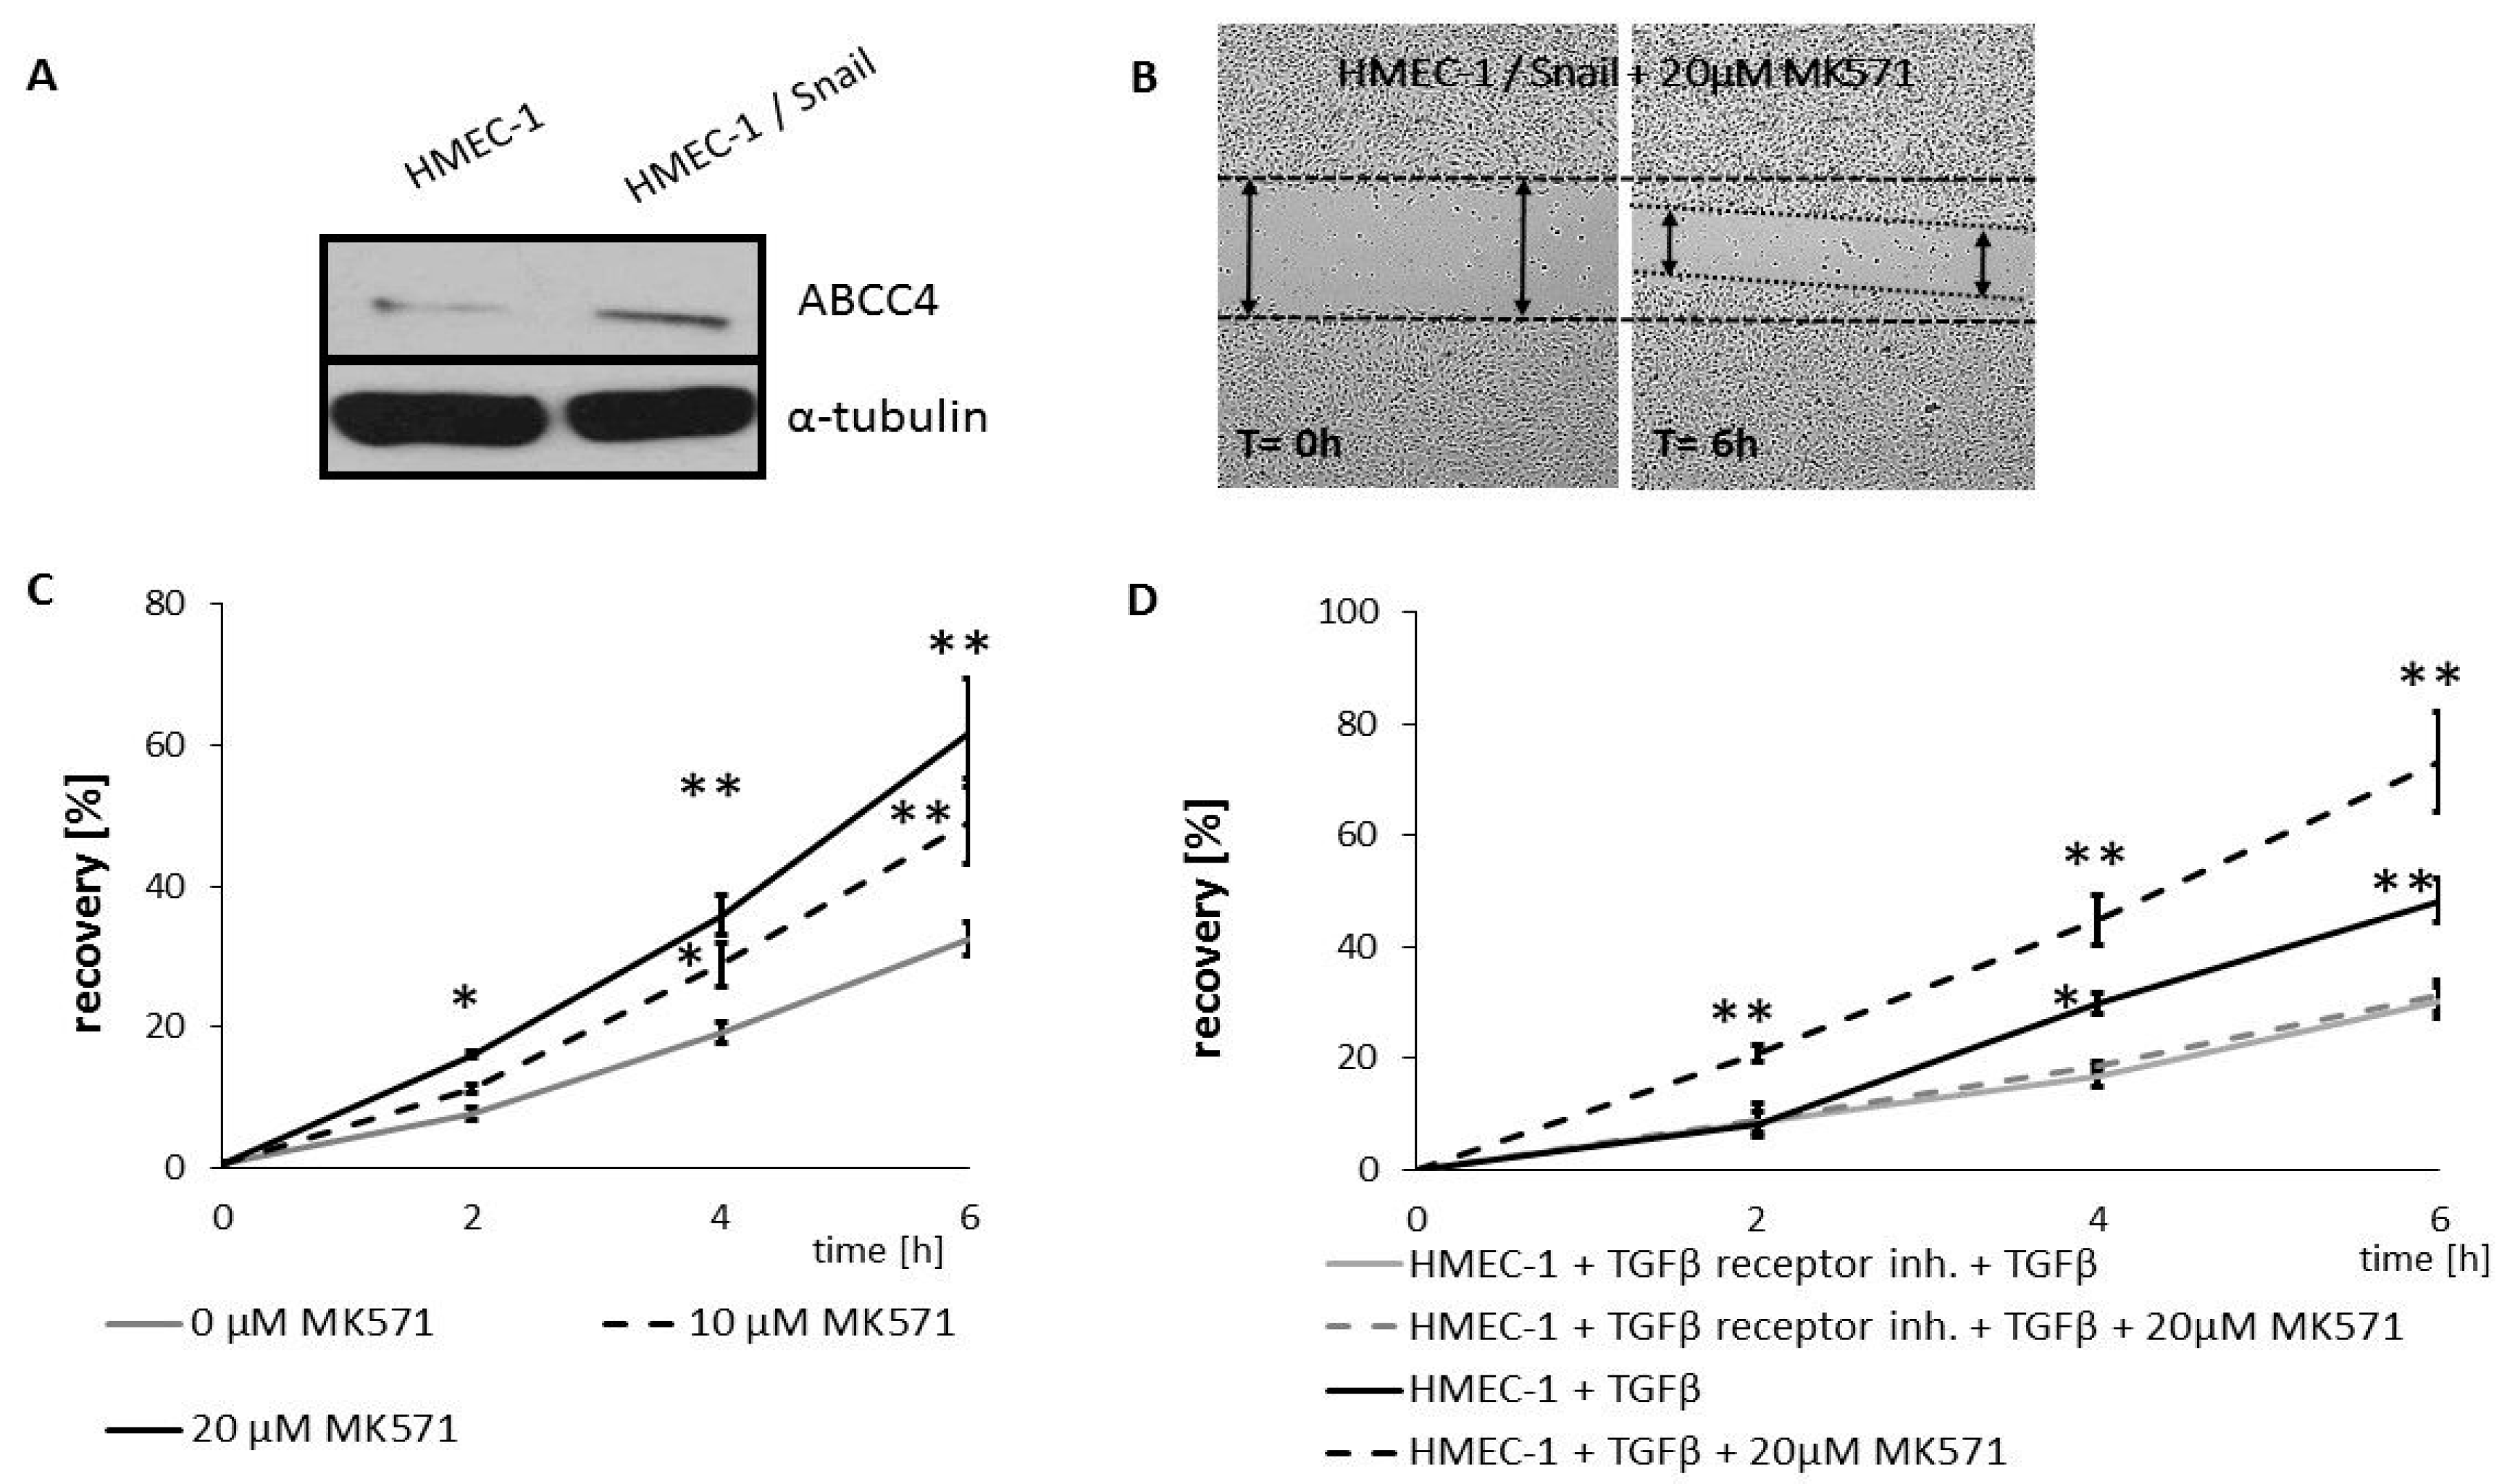
This observation prompted us to validate the effect of ABCC4 inhibition on cell motility. The obtained results confirmed that HT29 cells with acquired mesenchymal characteristics (by Snail overexpression) are more prone to ABCC4 inhibition, which leads to an increase in the migratory and invasive properties of cells. The same effect—i.e., an increase in migration—was shown in the CaCo-2 line, classified as an intermediate mesenchymal phenotype. Thus, our results showed that in CRC, similar to what was observed in fibroblasts, ABCC4 can regulate cell migration in a cyclic nucleotide-dependent manner. However, the intracellular cyclic nucleotide level is controlled not only by the process involving active efflux transport from the cell but also by phosphodiesterase-mediated hydrolysis. In fibroblasts, the inhibition of ABCC4 function through MK571 treatment or gene knockout showed that the intracellular cAMP level was moderately regulated by ABCC4 near the leading edge of the cells, whereas forskolin and PDE inhibitors strongly elevated the cAMP level inside the cells. Therefore, ABCC4 regulates fibroblast migration through the spatial resolution of cAMP signaling and localized PKA activation at the cell front [
18]. Similarly, ABCC4 was shown to modulate the compartmentalization of cAMP signaling in a colon adenocarcinoma cell lines (HT29 and T84), and ABCC4 inhibition with MK571 leads to the accumulation of cAMP at or near the plasma membrane. Interestingly, irinotecan, a first- and second-line chemotherapeutic drug for CRC, was also demonstrated to increase the cAMP levels at or near the plasma membrane to levels comparable to the effect of MK571 in mouse intestinal epithelial cells and human CRC cells [
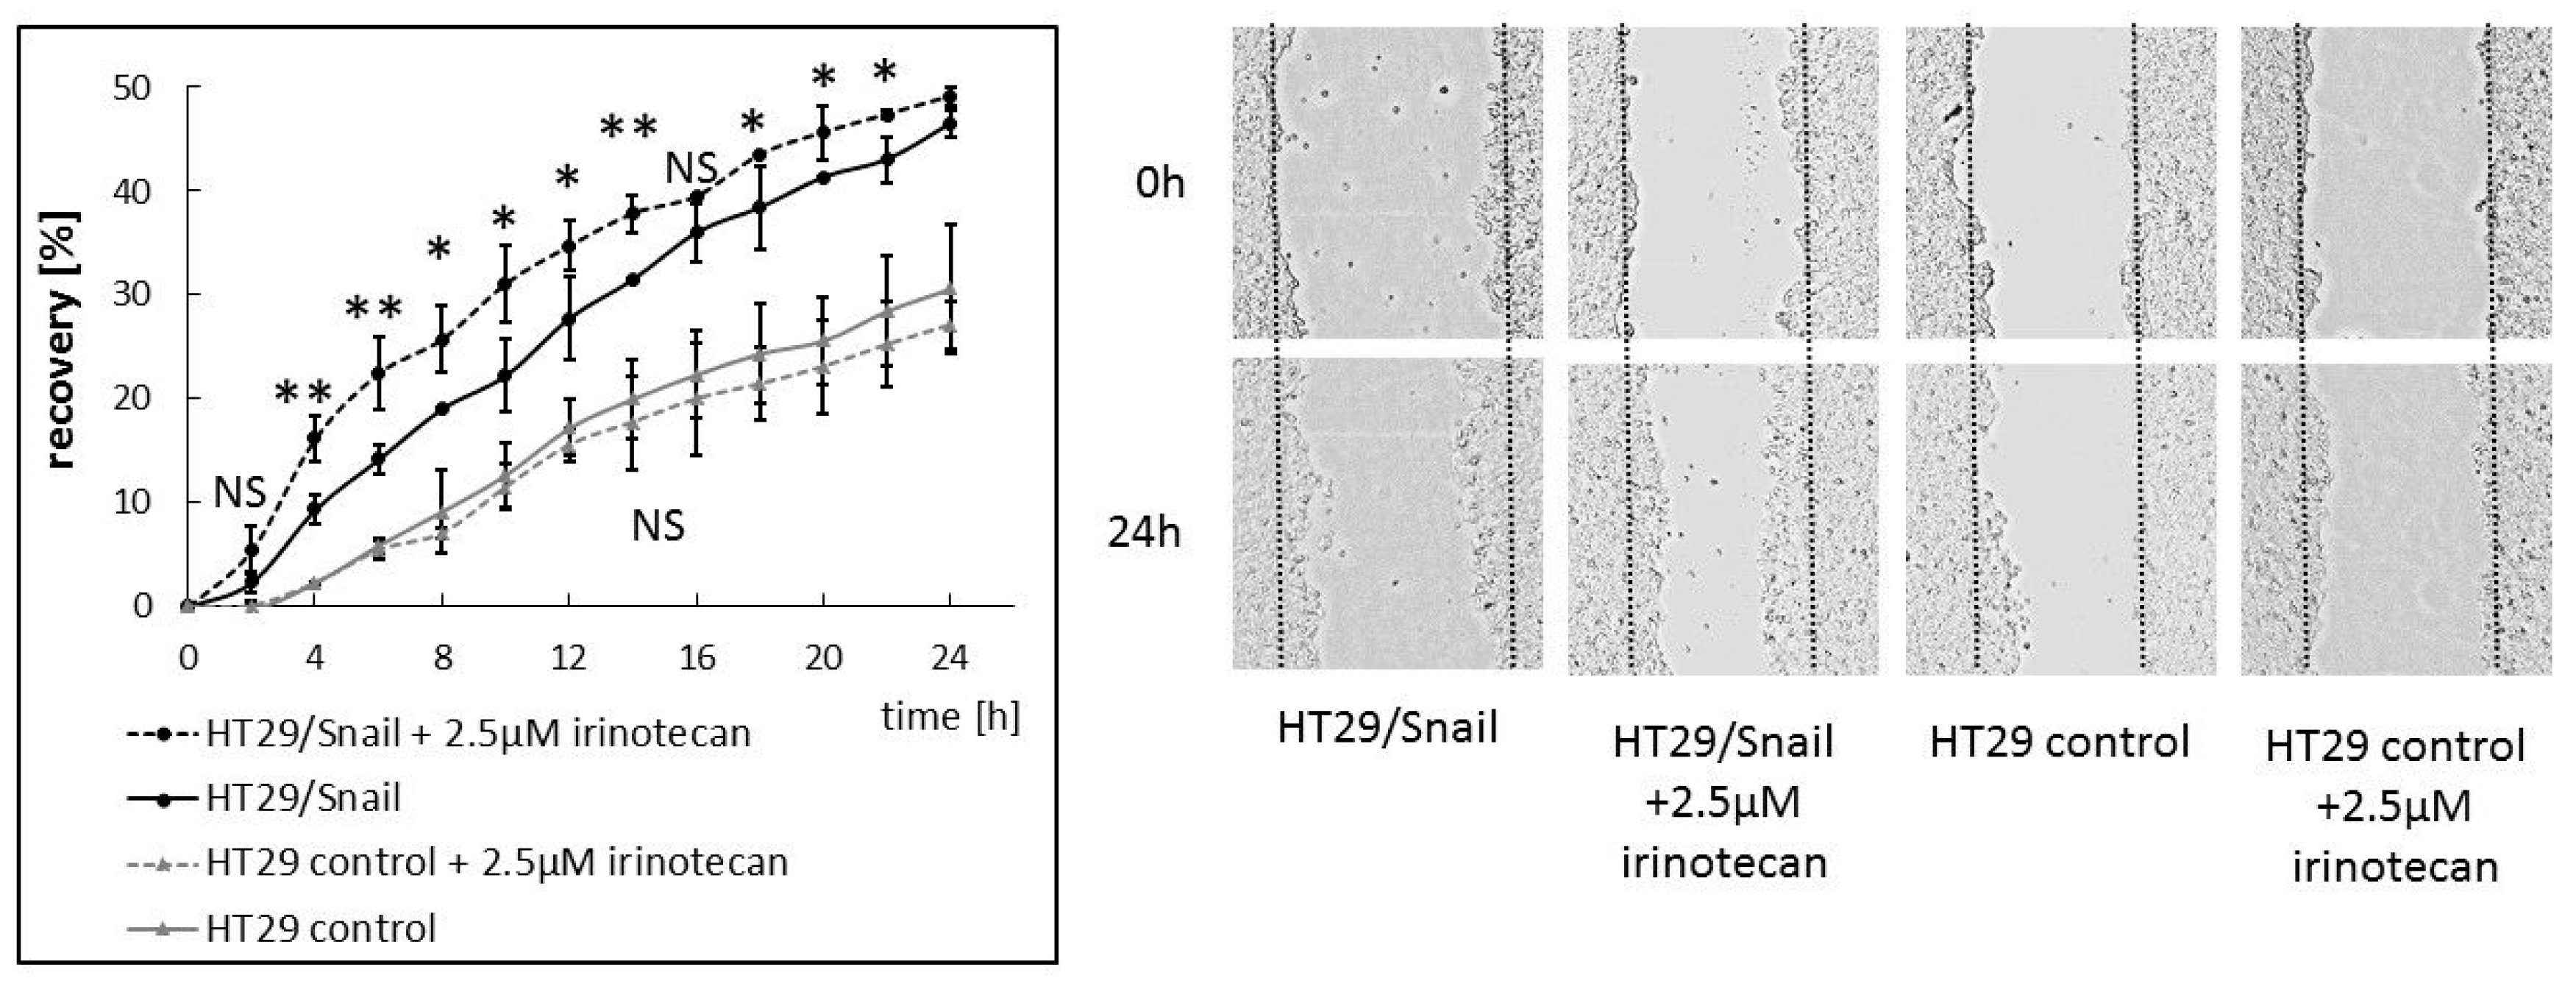
33]. This observation raises the question of whether irinotecan increases the migration rate in CRC cells with a specific phenotype and ABCC4 expression level. Since irinotecan has been reported to be a potential substrate for ABCC4, we reasoned that these drugs, through substrate competition with cAMP, may also elevate intracellular levels of cAMP and increase cell migration and ultimately cancer dissemination. Our results confirmed the above assumption: irinotecan increased CRC migration, and the effect was more pronounced in cells with mesenchymal characteristics.
Taken together, our results indicated that the pharmacological inhibition of ABCC4 regulates cAMP signaling and PKA activity and increases the migratory rate and invasive protrusion formation in CRC. Thus, during the use of ABCC4 inhibitors to reduce chemotherapy resistance or drugs that are potential substrates of ABCC4, the indirect effect on cancer metastasis should be taken into consideration and may be important in selecting a therapy scheme for individual patients. However, the involvement of ABCC4 protein in cell migration is ambiguous. The siRNA silencing of ABCC4 in human retinal microvascular endothelial cells (HRECs) enhanced their migration [
42], while pharmacological inhibition of ABCC4 activity or downregulation through RNAi in dendritic cells (DCs) resulted in the reduced migration of DCs [
43]. The ambiguous role of cyclic nucleotides in cell migration should also be considered. This observation suggests that various intracellular mechanisms may be responsible for ABCC4 involvement in migration and that the ABCC4 function may be cell type-dependent.
As tumor heterogeneity is accepted and heterogeneity seems particularly pronounced in CRC, patient-derived material analysis is required to further increase the translatability of our findings. The single-cell sequencing of normal tissues, primary tumors, circulating tumor cells, and metastases, combined with cellular analyses and functional validations, will reveal the role of ABCC4 protein in the diverse responses of CRC patients to therapy.
4. Materials and Methods
4.1. Patients Samples Analysis.
Microarray profiles and datasets of primary CRC were acquired from the public Gene Expression Omnibus (GEO) databases—National Center for Biotechnology Information (NCBI), U.S. National Library of Medicine 8600 Rockville Pike, Bethesda MD, 20894 USA [
20] with the following entries: GSE18105, GSE44861, and GSE32323 (Affymetrix Human Genome U133 Plus 2.0 platform). [
20] GSE18105 consisted of 110 samples, GSE44861 consisted of 111 samples, and GSE32323 consisted of 34 samples. For each dataset, samples were divided into two defined groups: colon cancer samples (c) and normal colon samples (n)—and the number of analyzed samples in each group was as follows: GSE18105: n
c = 94, n
n = 16; GSE44861: n
c = 56, n
n = 55; GSE32323 n
c = 17 n
n = 18. Next, the obtained data were analyzed using the same microarray ID for each mRNA in every dataset (e.g., 203196_at for ABCC4 analysis). Data were presented as box charts, with the median and all the data points depicted. Statistical analysis was performed using BioVinci version 1.1.5 developed by BioTuring Inc., San Diego, CA, USA, [
44]
4.2. Cell Culture
Colon cancer cell lines and dermal microvascular endothelium were obtained from American Type Culture Collection (Manassas, VA, USA) and cultured: HT29 and HT29/Snail in McCoy’s 5A medium (LifeTechnologies, Waltham, MA, USA), COLO-320 in RPMI-1640, CCD 841 CoN and CaCo-2 in Eagle’s Minimum Essential Medium (EMEM), HMEC-1 in MCBD-131 medium (Life Technologies, Waltham, MA, USA), all supplemented with 10% FBS (LifeTechnologies, Waltham, MA, USA) and antibiotics—streptomycin and penicillin (Sigma-Aldrich, St. Louis, MO, USA), primocin (Invivogen, San Diego, CA, USA) in a 90–95% humidified atmosphere of 5% CO2. HMEC-1 were additionally supplemented with EGF, hydrocortisone, and L-Glutamine (Sigma-Aldrich, St. Louis, MO, USA). The cells were periodically tested for mycoplasma every 4 weeks using the PlasmoTest (Invivogen, San Diego, CA, USA).
4.3. Western Immunoblotting
Proteins isolated from HT-29 cells were extracted with NP-40 lysis buffer (50 mM Tris, pH 8.0, containing 1% Nonidet-Igepal, 150 mM NaCl, 5 mM EDTA) with the Halt protease inhibitor cocktail (Thermo Scientific, Waltham, MA, USA), and the soluble protein fraction was collected through centrifugation. The protein concentrations in the cell lysates were measured with the BCA method (Pierce/Thermo Scientific, Waltham, MA, USA) and were equalized between samples. The protein extracts were subjected to SDS-PAGE analysis and were electro transferred onto PVDF or nitrocellulose membranes (BioRad, Hercules, CA, USA) followed by immunodetection goat anti human ABCC4 #PA5-18315 (Thermo Fisher Scientific), rabbit anty human ABCG2 #ORB155559 (Biorbyt). The control-mouse rabbit anti-α-tubulin antibody conjugated with HRP (NB100-690H) was obtained from Novus Biologicals (Centennial, CO, USA) and used as a loading control. Detection was performed using secondary HRP-conjugated antibodies (Santa Cruz Biotechnology, Dallas, TX, USA) followed by incubation with an enhanced chemiluminescence kit (Thermo Scientific, Waltham, MA, USA) and development with Kodak BioMax Light Film (Eastman Kodak, Rochester, NY, USA).
4.4. Biotinylation of Cell-Surface Proteins
HT29 cells were seeded on 75 cm2 bottles. After reaching 80% confluence, they were washed 3× with PBS pH 8.0. Next, 2.5 mL freshly made of 2mM biotin (EZ-Link Sulfo -NHS-Biotin Thermo Scientific, Waltham, MA, USA) solution in pH 8.0 PBS was added for 2 h 4 °C. Next, biotin solution was aspirate and cells were washed 3× with cold TBS pH 7.4 solution, then cells were lysed for 30 min using M-PER™ Mammalian Protein Extraction Reagent #78501 (Thermo Scientific, Waltham, MA, USA), centrifuged (20 min, 4 °C) and supernatant were collected and diluted to 1 mg/mL of total proteins. To 1ml of sample, 100 µL of streptavidin agarose slurry was added and incubated overnight at 4 °C on a rocky platform. Agarose/sample was centrifuged and the pellet was washed 4x with lysis solution. Finally, 80 µL of Laemmli buffer supplemented with 2 βME was added and incubated for 10 min at 95 °C, and next the samples were analyzed by SDS-PAGE and Western blot using Ab anti ABCC4
4.5. cAMP Level Measurement
A cAMP level analysis was performed using the cAMP competitive Kit (#581001 Cayman Chemical, Ann Arbor MA, USA). Cells incubated for 24 h w/wo 20 µM MK571 were treated with 0.1M HCl for 20min in RT and assayed according to the manufacturer’s protocol. Calculation was performed using data sheet provided by the Cayman. The cAMP concentration of HT29 control cells was set as 100%, and next all the obtained data were recalculated as the % of control.
4.6. Wound Healing (Scratch) Assay
Cells were seeded on 6-well plate or 24-well pate and were grown to confluence; with a 20 μL pipette tip and rinsed twice with PBS. New medium w/wo tested chemical compound was added. The wounded area was visualized after every 2 h using Nikon Eclipse TE 2000-U microscope (Nikon, Japan) or Spark® multimode microplate reader (TECAN, Switzerland)). Wound area was calculated by ImageJ software. Cell motility was estimated through the quantification of the % of recovery using the equation: R (%) = [1 − (wound area at Tt/wound area at T0)] × 100,where T0 is the wounded area at 0 h and Tt is the wounded area after th.
4.7. Fluorescent Dequenching (DQ) Gelatine Assay
The surface of 24-well plates was coated with 250 µL 0.1 mg/mL DQ gelatine (Life Technologies, Waltham, MA, USA) overnight at 4 °C and then washed 3× with PBS. Then, 1 × 10⁵ cells/well were added for 24 h to earlier prepared DQ gelatine-coated dishes in full medium supplemented w/wo 20 µM MK571. FITC fluorescence generated by the cleavage of DQ gelatine was measured using a Thermo Labsystem Fluoroscan Ascent reader (ThermoFisher Scientific, Waltham, MA, USA) fitted with FITC excitation and emission filters. Data are presented as the percent of increase above background fluorescence (100%) observed in the control HT-29.
4.8. Trans-Well Invasion and Trans-Well Migration Assays
HT-29 control or HT-29/Snail cells were treated with 20 µM of MK571 for 24 h. Then, cells were trypsinized, washed twice with medium, and transferred (2.5 × 10⁴ cells/chamber) to the upper chamber of Nunc™ Cell Culture Inserts (transwell) 8.0 μm pore diameter (#141006) covered with BD Matrigel (2 h, 0.6 mg/mL of Matrigel—75 µL) for 6 h in 0.1% BSA medium—supplemented w/wo MK571. Full medium in lower chamber was used as chemoattractant. Next, the medium and the Matrigel from the top surface of the membrane was removed, invaded cells on the bottom surface of the membrane were washed 2× with PBS, then fixed for 5 min with 96% ethanol at 4 °C. Cells were dyed at RT as follows: 6 min—hematoxylin, 1 min—1% eosin. Finally, membranes were cut out from chambers, placed on microscope glass and number of cells that migrate into the membrane was counted. CaCo2 cells incubated for 24 h with (MK571 20 µM) or untreated once were seeded on un-coated trans-well inserts (8 µM pores) in the upper chamber in 2% BSA medium (w/wo 20 µM MK571). Full medium in the lower chamber served as chemoattractant for cell migration. Cells were calculated in randomly assigned areas after 3 h of incubation followed by hematoxylin/eosin staining. Minimal and maximal cell counts are shown as the lower and upper extremes by respective whiskers.
4.9. PKA Phosphorylation Assay
Cells were seeded on a 6-well plate (5 × 10⁵/well). After 24 h, full growth medium was changed into starving (FBS free) medium for 24 h. Next, 20 µM of MK571 was added to cells for 60, 30, 5, and 1 min. Cells without starving procedure were used as positive control, and cells not treated with MK571 were used as negative control. After washing with PBS, cells were lysed, and SDS/PAGE and Western blot were performed using phospho-(ser/thr) PKA Substrate Antibody #9621 (Cell Signalling, Technology, Danvers, MA, USA).
4.10. WST-1 Cell Viability and Proliferation Assay
A total of 2 × 10⁴ cells per well were seeded on 96-well plate and left for 24 h. Next, 100 µL of fresh medium was added containing irinotecan to a final concentration of 0, 5, 25, 50, 100 µM. Next, after 48 h of incubation 10 µL of WST-1 reagent (ScienCell, Research Lab., Carlsbad, CA, USA) freshly made, #8038 was added for 2 h. Calculation of cell viability was done by OD450nm- OD630nm using the Spark multimode microplate reader.
4.11. Statistical Analysis
All the experiments were repeated at least three times and the results were expressed as mean ± standard deviation (SD). Statistical evaluation was performed using normality test (Shapiro–Wilk) followed by T-Student test (for normally distributed data) or Mann-Whitney U test (for not normally distributed data). Calculation and graphs were performed using BioVinci version 1.1.5 developed by BioTuring Inc., San Diego, CA, USA, [
44].
p values < 0.05 were considered statistically significant for all analyses: *
p < 0.05; **
p < 0.005; ***
p < 0.001, NS—not statistically significant. Pearson’s linear correlation and Spearman correlation (
Supplementary Materials) analysis were performed to analyze the correlation between TGFβ1/2 and TGFβR1/2 in CRC tissues with Pearson correlation coefficient (PCC): 0–0.25 no PCC, 0.25–0.5 low PCC, 0.5–0.75 moderately PCC, 0.75–1 strong PCC. Data density distribution is presented in
Supplementary Materials, Figure S2 was produced using SinaPlot server [
45].
The densitometry analysis of WB were performed with n = 3 (ABCC4/ABCG2 protein, PKA substrates) or n = 2 (EV’s analysis) biological replicates. All the functional tests were performed in triplicate with n = 3 of biological replicates.


