Bioenergetic Profiling of the Differentiating Human MDS Myeloid Lineage with Low and High Bone Marrow Blast Counts

 ,
,  , , ,
, , ,
Abstract
:Simple Summary
Abstract

1. Introduction
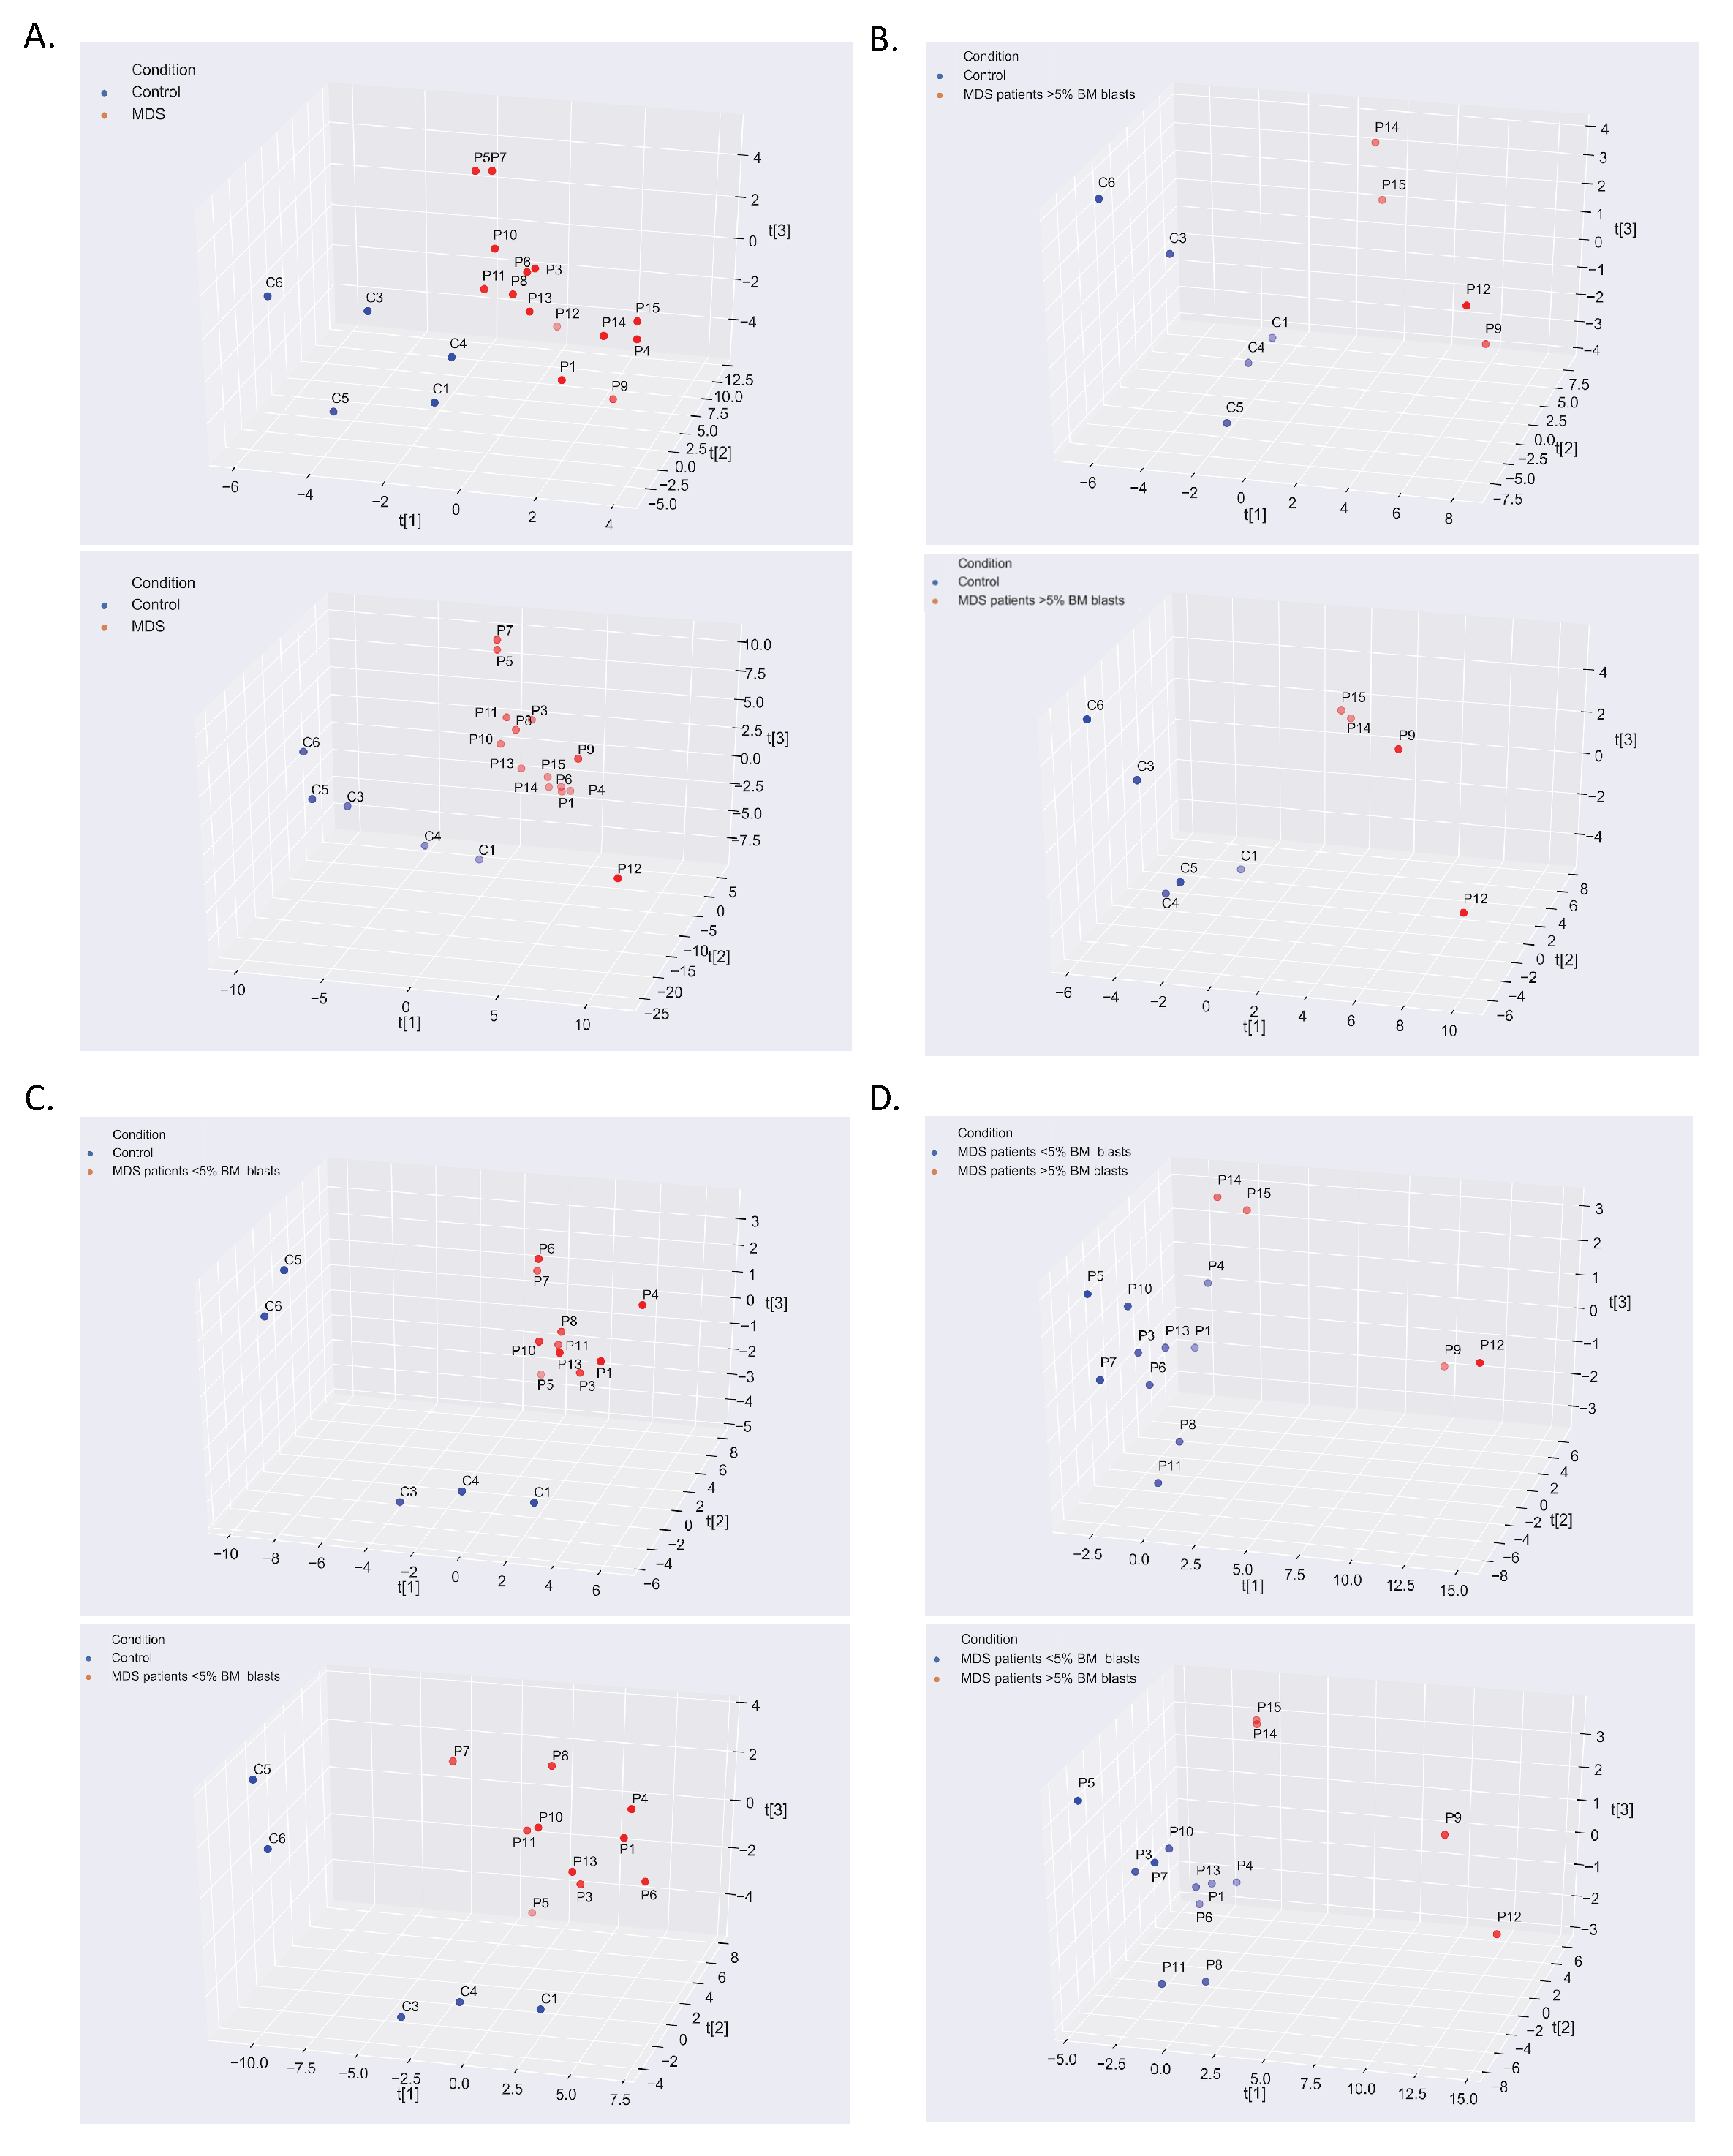
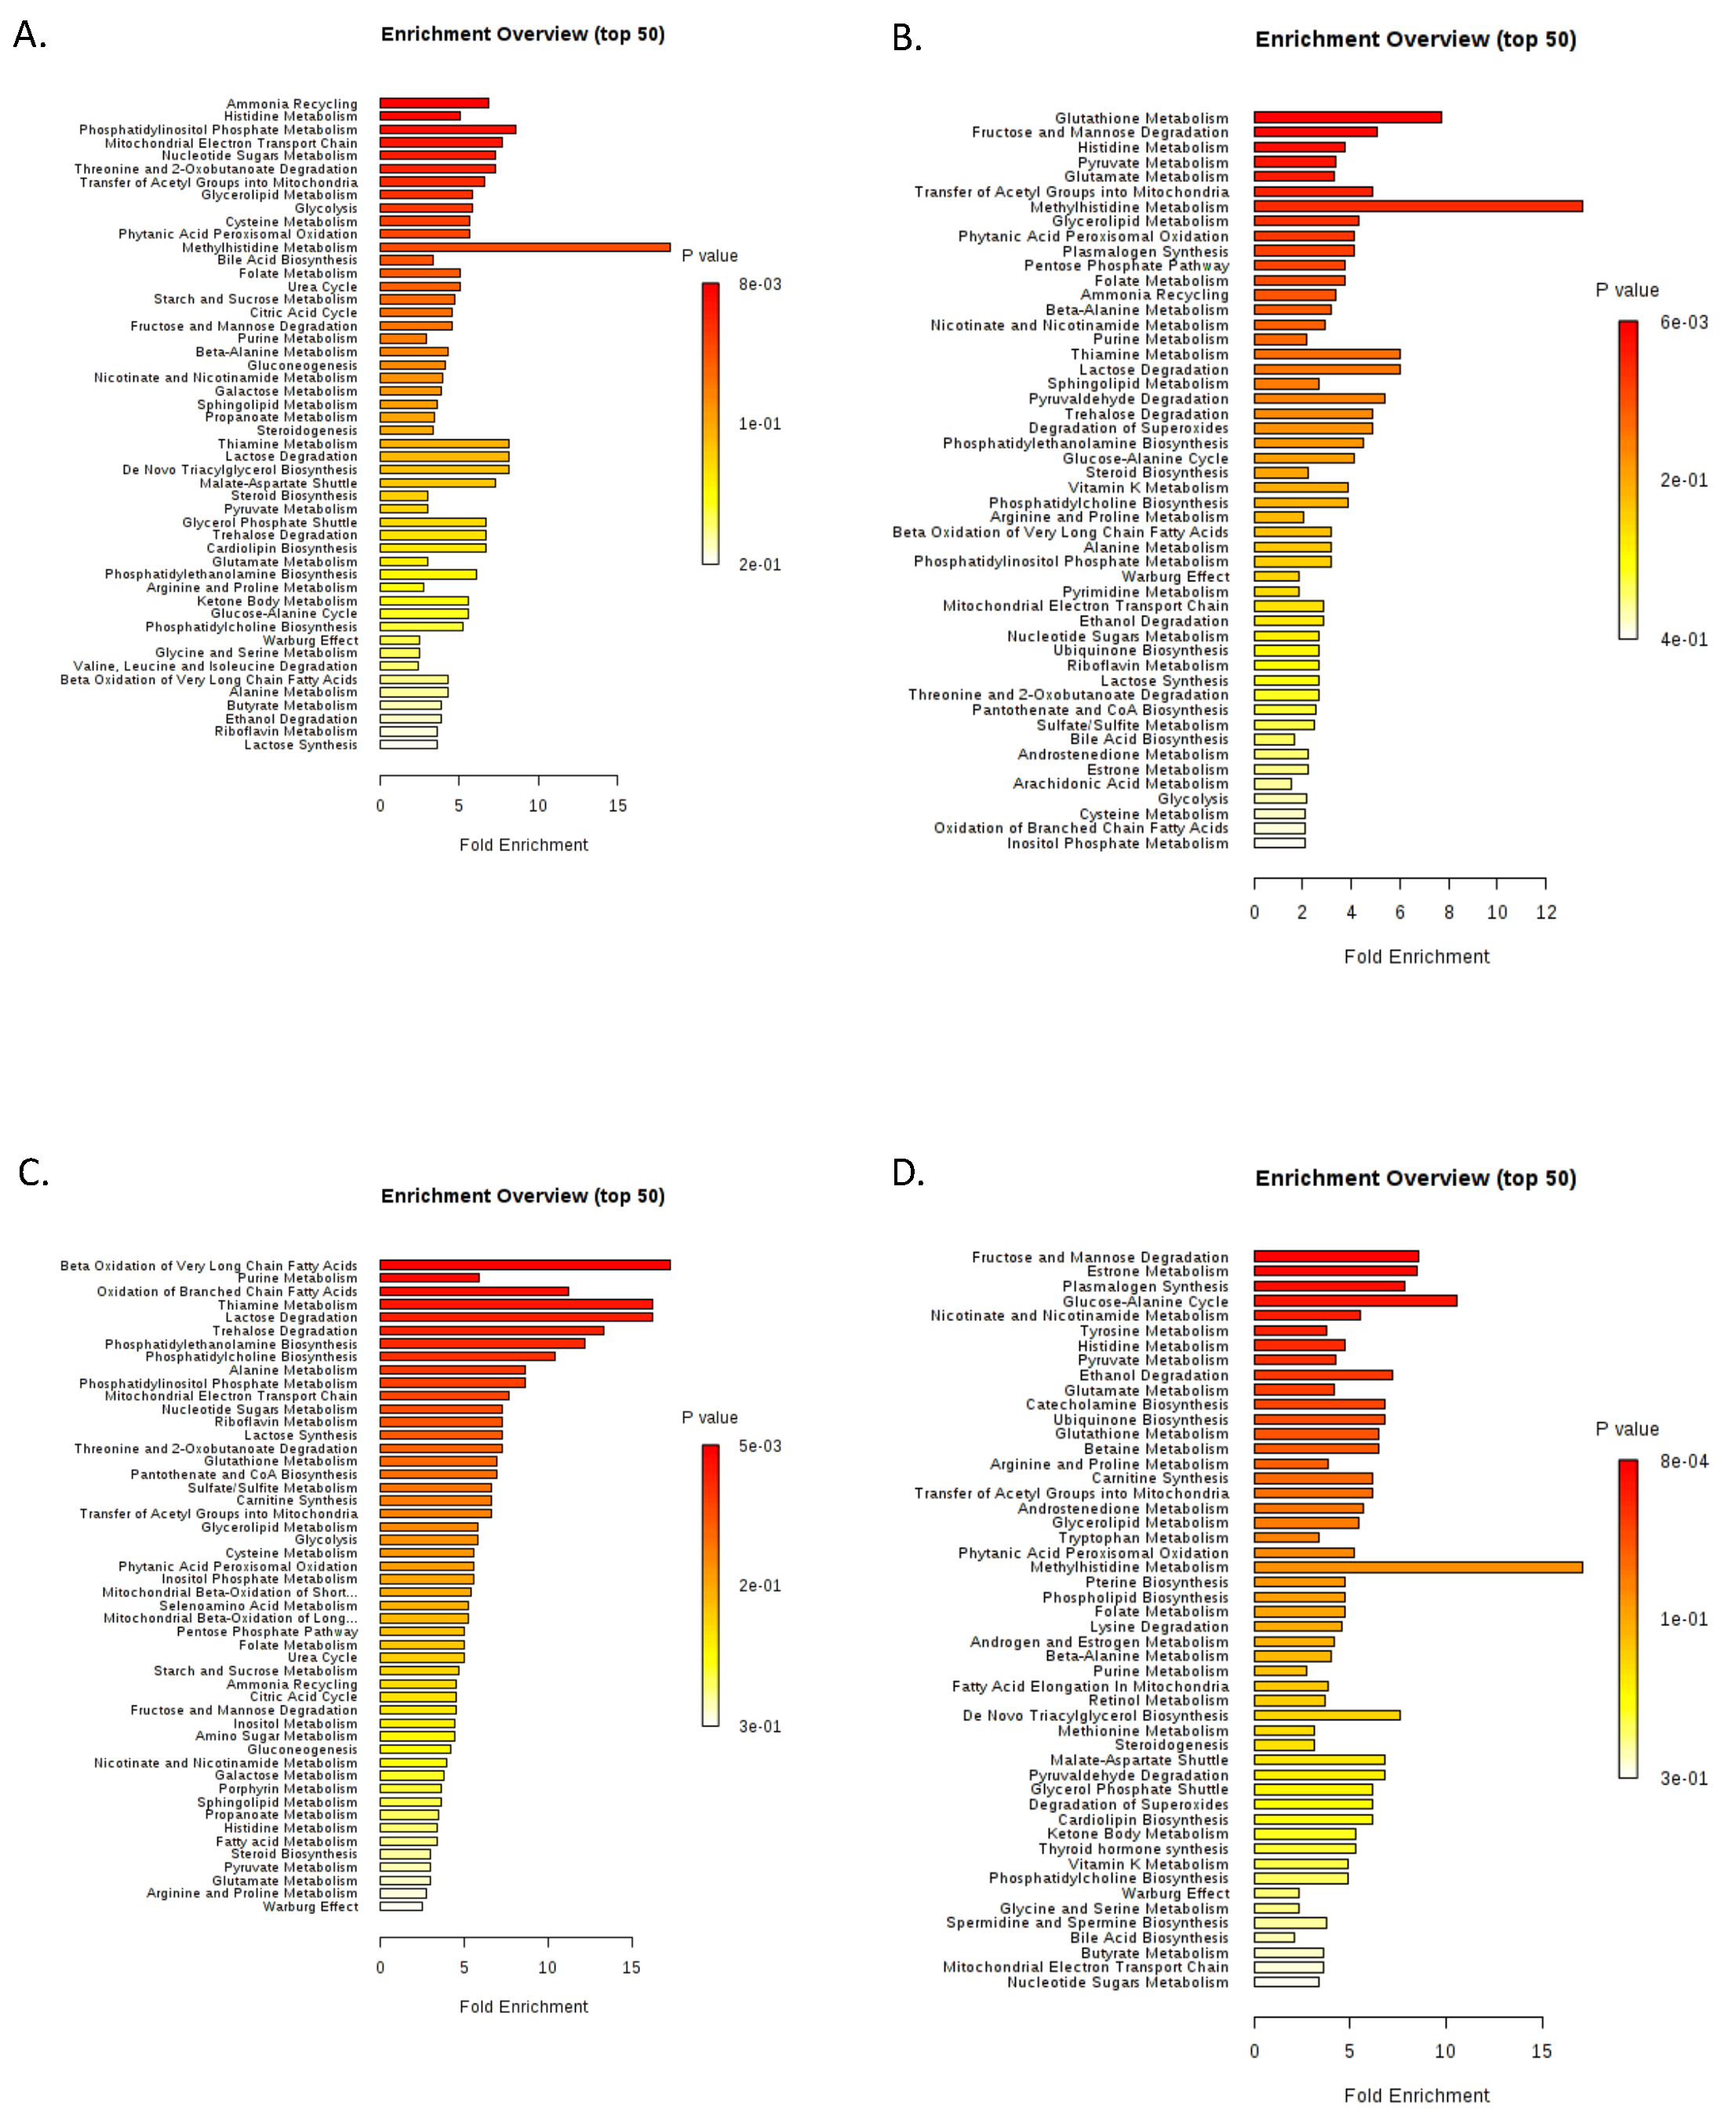
2. Results
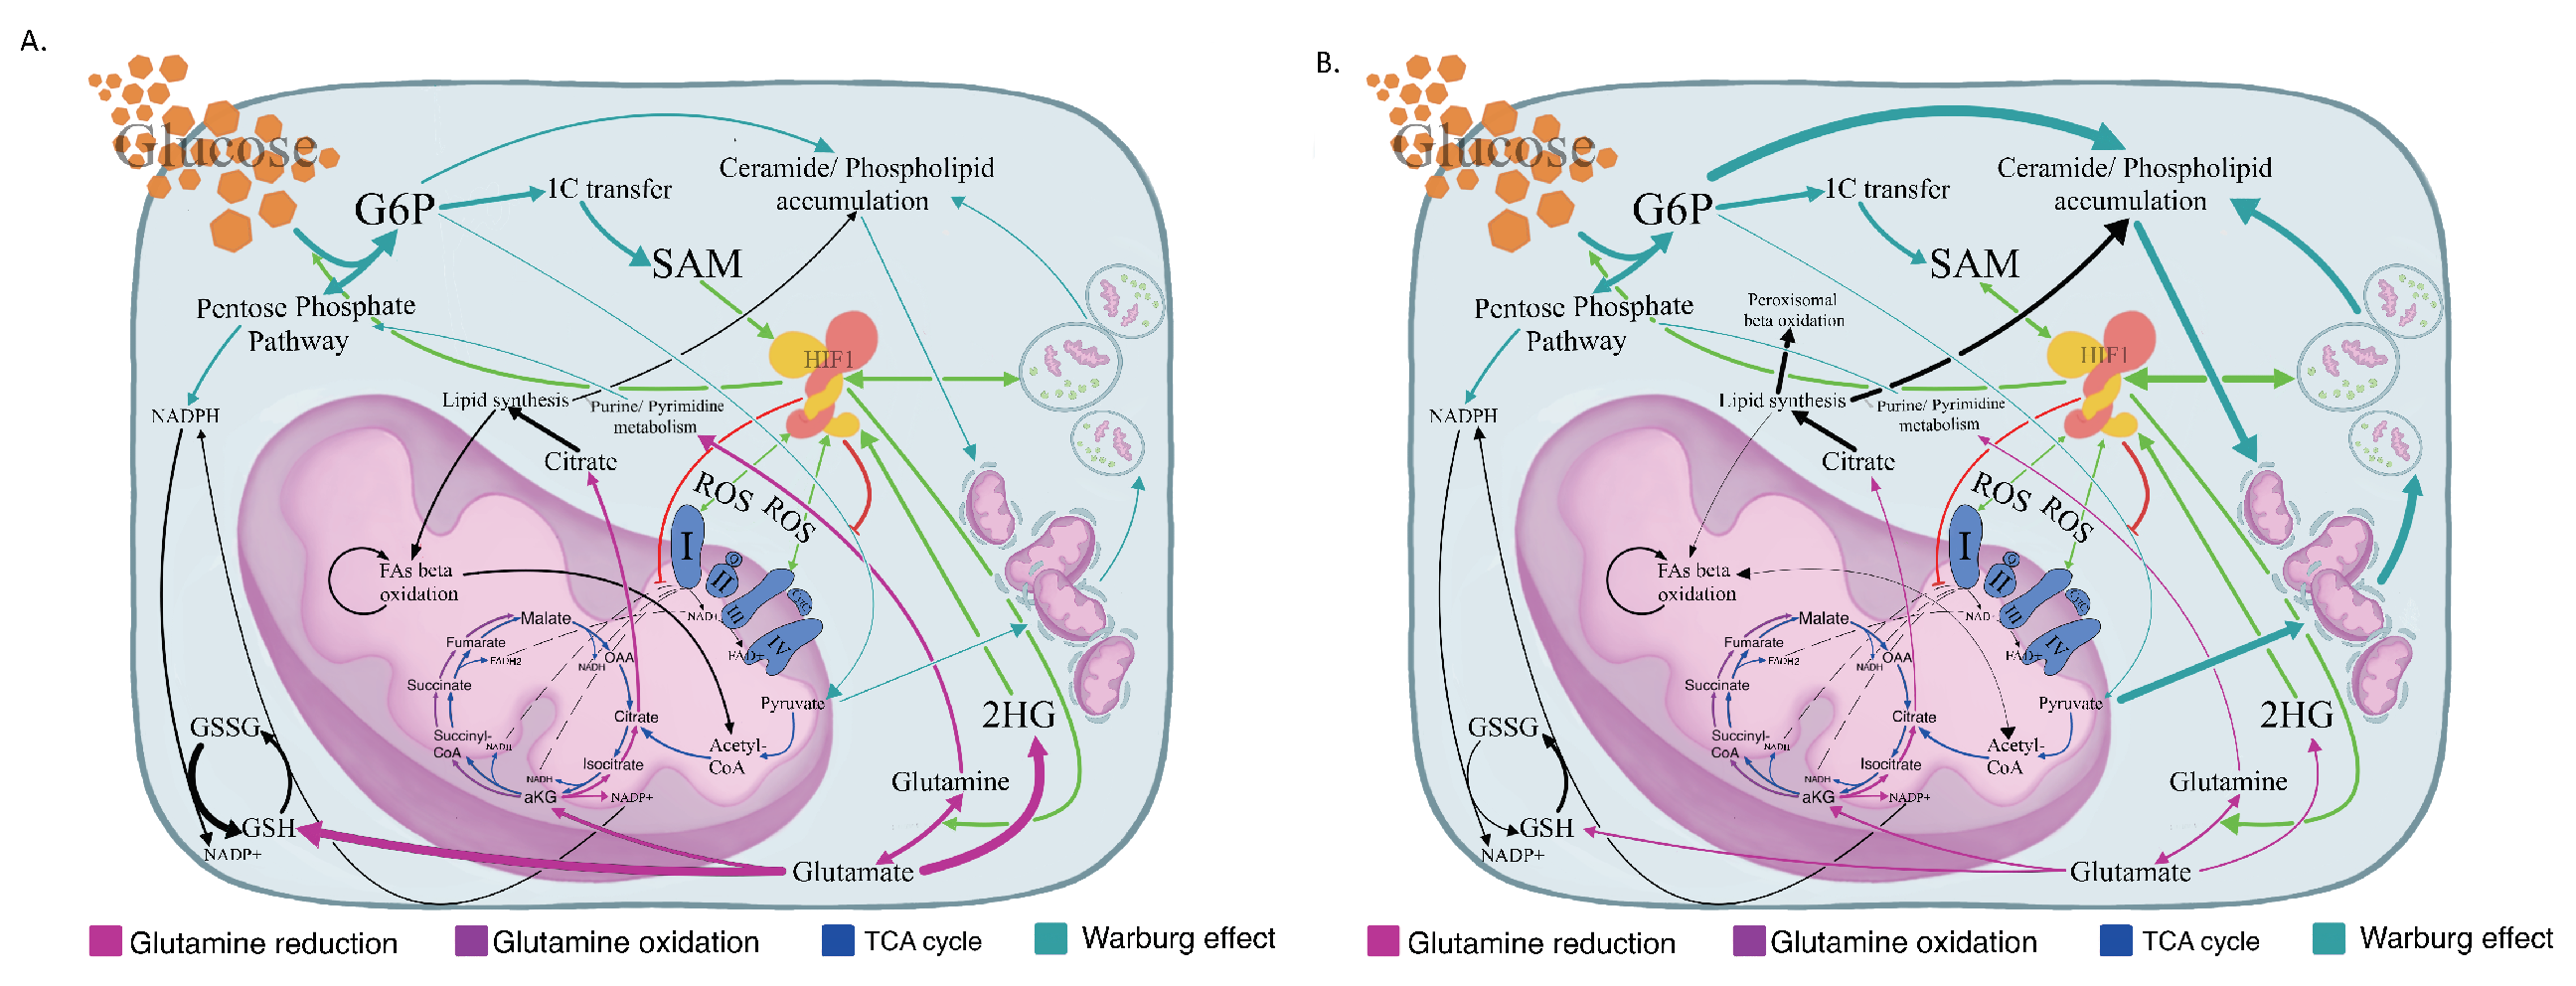
2.1. The Warburg Effect and Its Branches in the MDS Metabolome
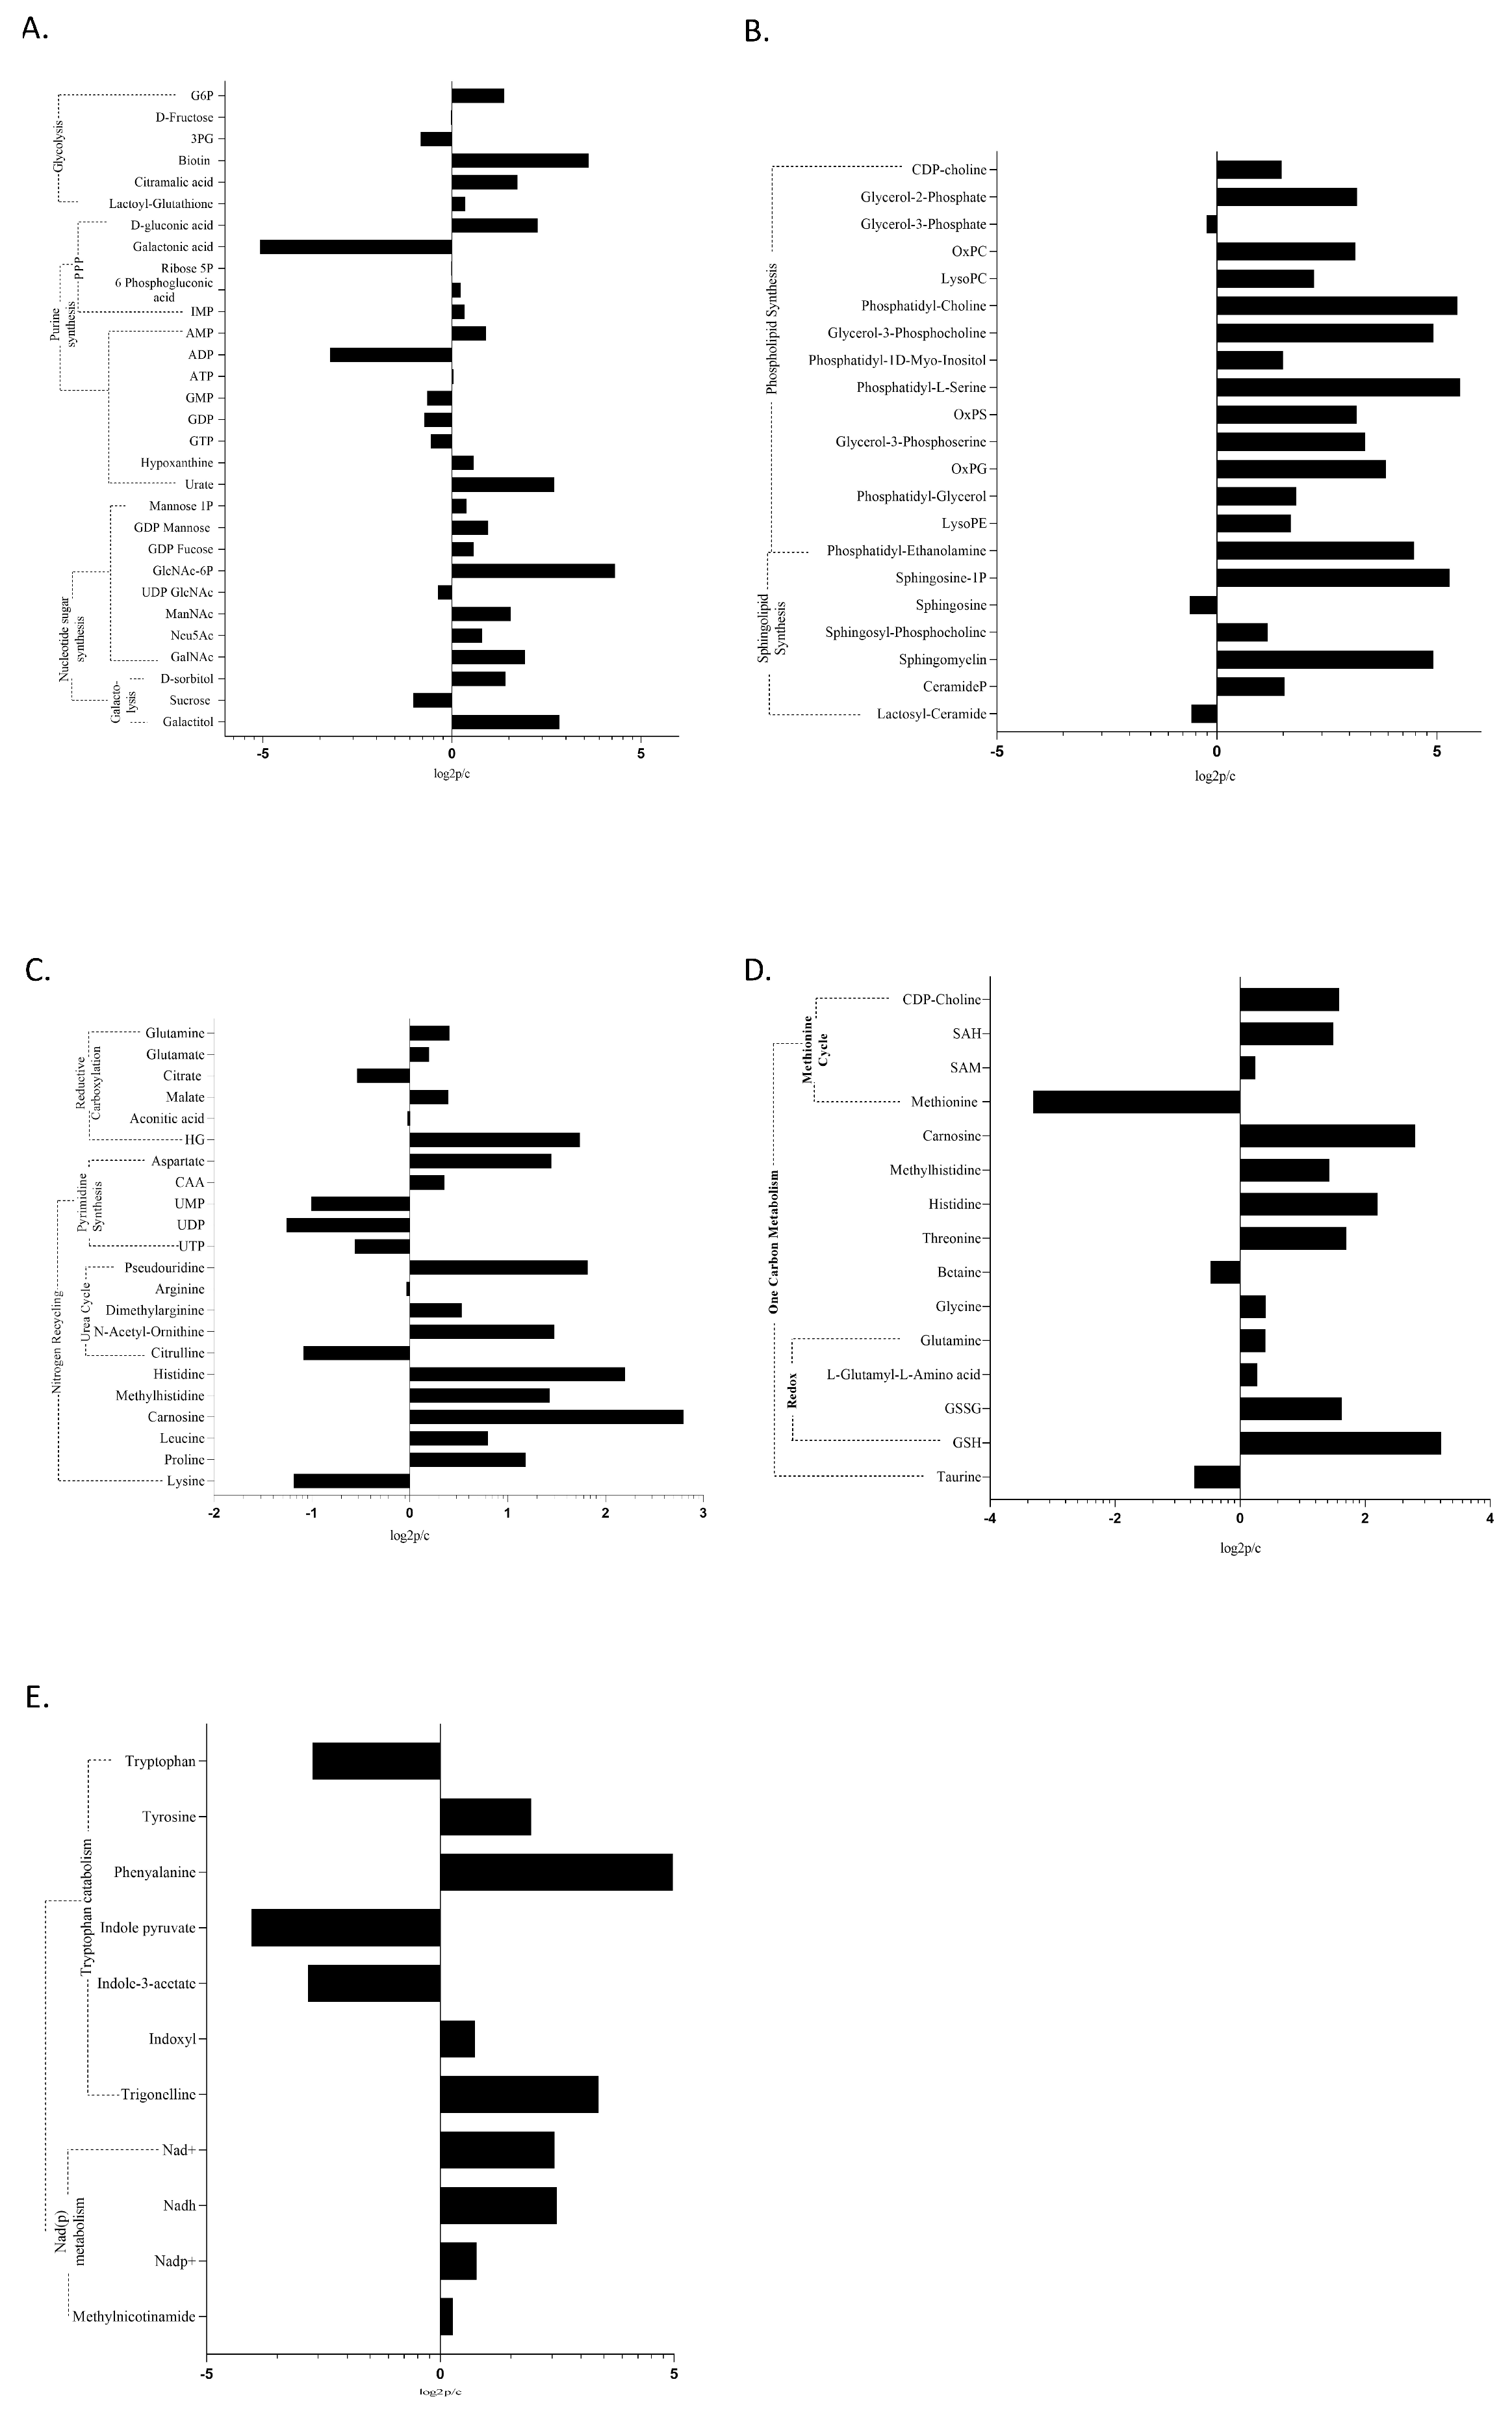

2.2. The MDS Metabolome Is Dominated by Fat, While the BM Blast Count Delineates the Lipid Origin and Degradation Pathway
2.3. The Optical Ratio NADH/FADH2, and the Redox Ratios NAD/NADH, GSH/GSSG, and NADP/NADPH
2.4. Glutamine Metabolism, Nitrogen Detoxification, and the TCA in MDS
2.5. Epigenetic Modifiers Are a Distinctive Feature of MDS
3. Discussion
4. Materials and Methods
4.1. Sample Collection and Preparation
4.2. Chromatography
4.3. Mass Spectrometry
4.4. Data Processing
4.5. Study Approval
5. Conclusions
Supplementary Materials
Author Contributions
Funding
Acknowledgments
Conflicts of Interest
References
- Ito, K.; Suda, T. Metabolic requirements for the maintenance of self-renewing stem cells. Nat. Rev. Mol. Cell Biol. 2014, 15, 243–256. [Google Scholar] [CrossRef] [PubMed] [Green Version]
- Turgeon, M.O.; Perry, N.J.S.; Poulogiannis, G. DNA Damage, Repair, and Cancer Metabolism. Front. Oncol. 2018, 8, 15. [Google Scholar] [CrossRef] [PubMed] [Green Version]
- Wang, Q.; Zhang, Y.; Yang, C.; Xiong, H.; Lin, Y.; Yao, J.; Li, H.; Xie, L.; Zhao, W.; Yao, Y.; et al. Acetylation of metabolic enzymes coordinates carbon source utilization and metabolic flux. Science 2010, 327, 1004–1007. [Google Scholar] [CrossRef] [PubMed] [Green Version]
- Anderson, K.A.; Madsen, A.S.; Olsen, C.A.; Hirschey, M.D. Metabolic control by sirtuins and other enzymes that sense NAD(+), NADH, or their ratio. Biochim. Biophys. Acta Bioenerg. 2017, 1858, 991–998. [Google Scholar] [CrossRef] [PubMed]
- Shim, E.H.; Livi, C.B.; Rakheja, D.; Tan, J.; Benson, D.; Parekh, V.; Kho, E.Y.; Ghosh, A.P.; Kirkman, R.; Velu, S.; et al. L-2-Hydroxyglutarate: An epigenetic modifier and putative oncometabolite in renal cancer. Cancer Discov. 2014, 4, 1290–1298. [Google Scholar] [CrossRef] [PubMed] [Green Version]
- Newman, A.C.; Maddocks, O.D.K. One-carbon metabolism in cancer. Br. J. Cancer 2017, 116, 1499–1504. [Google Scholar] [CrossRef] [PubMed]
- Canto, C.; Menzies, K.J.; Auwerx, J. NAD(+) Metabolism and the Control of Energy Homeostasis: A Balancing Act between Mitochondria and the Nucleus. Cell Metab. 2015, 22, 31–53. [Google Scholar] [CrossRef] [Green Version]
- Sharma, S.; Kelly, T.K.; Jones, P.A. Epigenetics in cancer. Carcinogenesis 2010, 31, 27–36. [Google Scholar] [CrossRef]
- Mrozek, K.; Bloomfield, C.D. Chromosome aberrations, gene mutations and expression changes, and prognosis in adult acute myeloid leukemia. Hematol. Am. Soc. Hematol. Educ. Program. 2006, 1, 169–177. [Google Scholar] [CrossRef] [Green Version]
- Zahid, M.F.; Malik, U.A.; Sohail, M.; Hassan, I.N.; Ali, S.; Shaukat, M.H.S. Cytogenetic Abnormalities in Myelodysplastic Syndromes: An Overview. Int. J. Hematol. Oncol. Stem Cell Res. 2017, 11, 231–239. [Google Scholar]
- Jabbour, E.; Ghanem, H.; Huang, X.; Ravandi, F.; Garcia-Manero, G.; O’Brien, S.; Faderl, S.; Pierce, S.; Choi, S.; Verstovsek, S.; et al. Acute myeloid leukemia after myelodysplastic syndrome and failure of therapy with hypomethylating agents: An emerging entity with a poor prognosis. Clin. Lymphoma Myeloma Leuk. 2014, 14, 93–97. [Google Scholar] [CrossRef] [PubMed] [Green Version]
- Stergiou, I.; Kambas, K.; Giannouli, S.; Katsila, T.; Dimitrakopoulou, A.; Vidali, V.; Synolaki, E.; Papageorgiou, A.; Nezos, A.; Patrinos, G.; et al. Autophagy in Myelodysplastic Syndromes: The Role of HIF-1a/REDD1 Molecular Pathway. Blood 2018, 132, 1808. [Google Scholar] [CrossRef]
- Bosc, C.; Broin, N.; Fanjul, M.; Saland, E.; Farge, T.; Courdy, C.; Batut, A.; Masoud, R.; Larrue, C.; Skuli, S.; et al. Autophagy regulates fatty acid availability for oxidative phosphorylation through mitochondria-endoplasmic reticulum contact sites. Nat. Commun. 2020, 11, 4056. [Google Scholar] [CrossRef] [PubMed]
- Vander Heiden, M.G.; Cantley, L.C.; Thompson, C.B. Understanding the Warburg effect: The metabolic requirements of cell proliferation. Science 2009, 324, 1029–1033. [Google Scholar] [CrossRef] [PubMed] [Green Version]
- Mailloux, R.J.; Beriault, R.; Lemire, J.; Singh, R.; Chenier, D.R.; Hamel, R.D.; Appanna, V.D. The tricarboxylic acid cycle, an ancient metabolic network with a novel twist. PLoS ONE 2007, 2, 690. [Google Scholar] [CrossRef] [PubMed] [Green Version]
- Berg, J.M.; Tymoczko, J.L.; Stryer, L. Oxidative Phosphorylation. In Biochemistry, 5th ed.; W H Freeman: New York, NY, USA, 2002. [Google Scholar]
- Kumar, B.; Garcia, M.; Weng, L.; Jung, X.; Murakami, J.L.; Hu, X.; McDonald, T.; Lin, A.; Kumar, A.R.; DiGiusto, D.L.; et al. Acute myeloid leukemia transforms the bone marrow niche into a leukemia-permissive microenvironment through exosome secretion. Leukemia 2018, 32, 575–587. [Google Scholar] [CrossRef] [PubMed]
- Rosenzweig, A.; Blenis, J.; Gomes, A.P. Beyond the Warburg Effect: How Do Cancer Cells Regulate One-Carbon Metabolism? Front. Cell Dev. Biol. 2018, 6, 90. [Google Scholar] [CrossRef] [PubMed]
- Ma, L.; Zong, X. Metabolic Symbiosis in Chemoresistance: Refocusing the Role of Aerobic Glycolysis. Front. Oncol. 2020, 10, 5. [Google Scholar] [CrossRef] [Green Version]
- Narayanaswamy, P.; Teo, G.; Ow, J.R.; Lau, A.; Kaldis, P.; Tate, S.; Choi, H. MetaboKit: A comprehensive data extraction tool for untargeted metabolomics. Mol. Omics 2020. [Google Scholar] [CrossRef]
- Houten, S.M.; Violante, S.; Ventura, F.V.; Wanders, R.J. The Biochemistry and Physiology of Mitochondrial Fatty Acid beta-Oxidation and Its Genetic Disorders. Annu. Rev. Physiol. 2016, 78, 23–44. [Google Scholar] [CrossRef] [Green Version]
- Wanders, R.J.; Waterham, H.R.; Ferdinandusse, S. Metabolic Interplay between Peroxisomes and Other Subcellular Organelles Including Mitochondria and the Endoplasmic Reticulum. Front. Cell Dev. Biol. 2015, 3, 83. [Google Scholar] [CrossRef] [PubMed] [Green Version]
- Hosios, A.M.; Vander Heiden, M.G. The redox requirements of proliferating mammalian cells. J. Biol. Chem. 2018, 293, 7490–7498. [Google Scholar] [CrossRef] [PubMed] [Green Version]
- Samudio, I.; Fiegl, M.; Andreeff, M. Mitochondrial uncoupling and the Warburg effect: Molecular basis for the reprogramming of cancer cell metabolism. Cancer Res. 2009, 69, 2163–2166. [Google Scholar] [CrossRef] [PubMed] [Green Version]
- Zhao, R.Z.; Jiang, S.; Zhang, L.; Yu, Z.B. Mitochondrial electron transport chain, ROS generation and uncoupling (Review). Int. J. Mol. Med. 2019, 44, 3–15. [Google Scholar] [CrossRef] [Green Version]
- Wang, Y.; Bai, C.; Ruan, Y.; Liu, M.; Chu, Q.; Qiu, L.; Yang, C.; Li, B. Coordinative metabolism of glutamine carbon and nitrogen in proliferating cancer cells under hypoxia. Nat. Commun. 2019, 10, 201. [Google Scholar] [CrossRef] [PubMed] [Green Version]
- Stein, L.R.; Imai, S. The dynamic regulation of NAD metabolism in mitochondria. Trends Endocrinol. Metab. 2012, 23, 420–428. [Google Scholar] [CrossRef] [Green Version]
- Gaude, E.; Schmidt, C.; Gammage, P.A.; Dugourd, A.; Blacker, T.; Chew, S.P.; Saez-Rodriguez, J.; O’Neill, J.S.; Szabadkai, G.; Minczuk, M.; et al. NADH Shuttling Couples Cytosolic Reductive Carboxylation of Glutamine with Glycolysis in Cells with Mitochondrial Dysfunction. Mol. Cell 2018, 69, 581–593. [Google Scholar] [CrossRef] [Green Version]
- Zala, D.; Schlattner, U.; Desvignes, T.; Bobe, J.; Roux, A.; Chavrier, P.; Boissan, M. The advantage of channeling nucleotides for very processive functions. F1000Research 2017, 6, 724. [Google Scholar] [CrossRef]
- Cooper, A.J.; Pinto, J.T.; Callery, P.S. Reversible and irreversible protein glutathionylation: Biological and clinical aspects. Expert Opin. Drug Metab. Toxicol. 2011, 7, 891–910. [Google Scholar] [CrossRef] [Green Version]
- Hayashi, Y.; Zhang, Y.; Yokota, A.; Yan, X.; Liu, J.; Choi, K.; Li, B.; Sashida, G.; Peng, Y.; Xu, Z.; et al. Pathobiological Pseudohypoxia as a Putative Mechanism Underlying Myelodysplastic Syndromes. Cancer Discov. 2018, 8, 1438–1457. [Google Scholar] [CrossRef] [Green Version]
- Tong, H.; Hu, C.; Zhuang, Z.; Wang, L.; Jin, J. Hypoxia-inducible factor-1alpha expression indicates poor prognosis in myelodysplastic syndromes. Leuk. Lymphoma 2012, 53, 2412–2418. [Google Scholar] [CrossRef] [PubMed]
- Greenberg, P.L.; Tuechler, H.; Schanz, J.; Sanz, G.; Garcia-Manero, G.; Sole, F.; Bennett, J.M.; Bowen, D.; Fenaux, P.; Dreyfus, F.; et al. Revised international prognostic scoring system for myelodysplastic syndromes. Blood 2012, 120, 2454–2465. [Google Scholar] [CrossRef] [PubMed]
- Speijer, D. Can All Major ROS Forming Sites of the Respiratory Chain Be Activated By High FADH2/NADH Ratios?: Ancient evolutionary constraints determine mitochondrial ROS formation. Bioessays 2019, 41, 1800180. [Google Scholar] [CrossRef] [PubMed] [Green Version]
- Santidrian, A.F.; Matsuno-Yagi, A.; Ritland, M.; Seo, B.B.; LeBoeuf, S.E.; Gay, L.J.; Yagi, T.; Felding-Habermann, B. Mitochondrial complex I activity and NAD+/NADH balance regulate breast cancer progression. J. Clin. Investig. 2013, 123, 1068–1081. [Google Scholar] [CrossRef] [PubMed] [Green Version]
- Velez, J.; Hail, N., Jr.; Konopleva, M.; Zeng, Z.; Kojima, K.; Samudio, I.; Andreeff, M. Mitochondrial uncoupling and the reprograming of intermediary metabolism in leukemia cells. Front. Oncol. 2013, 3, 67. [Google Scholar] [CrossRef] [PubMed] [Green Version]
- Yang, C.; Ko, B.; Hensley, C.T.; Jiang, L.; Wasti, A.T.; Kim, J.; Sudderth, J.; Calvaruso, M.A.; Lumata, L.; Mitsche, M.; et al. Glutamine oxidation maintains the TCA cycle and cell survival during impaired mitochondrial pyruvate transport. Mol. Cell 2014, 56, 414–424. [Google Scholar] [CrossRef] [PubMed] [Green Version]
- Morad, S.A.; Cabot, M.C. Ceramide-orchestrated signalling in cancer cells. Nat. Rev. Cancer 2013, 13, 51–65. [Google Scholar] [CrossRef]
- Santos, C.R.; Schulze, A. Lipid metabolism in cancer. FEBS J. 2012, 279, 2610–2623. [Google Scholar] [CrossRef]
- Stevens, B.M.; Khan, N.; D’Alessandro, A.; Nemkov, T.; Winters, A.; Jones, C.L.; Zhang, W.; Pollyea, D.A.; Jordan, C.T. Characterization and targeting of malignant stem cells in patients with advanced myelodysplastic syndromes. Nat. Commun. 2018, 9, 3694. [Google Scholar] [CrossRef]
- Loew, A.; Kohnke, T.; Rehbeil, E.; Pietzner, A.; Weylandt, K.H. A Role for Lipid Mediators in Acute Myeloid Leukemia. Int. J. Mol. Sci. 2019, 20, 2425. [Google Scholar] [CrossRef] [Green Version]
- Haanstra, J.R.; van Tuijl, A.; Kessler, P.; Reijnders, W.; Michels, P.A.; Westerhoff, H.V.; Parsons, M.; Bakker, B.M. Compartmentation prevents a lethal turbo-explosion of glycolysis in trypanosomes. Proc. Natl. Acad. Sci. USA 2008, 105, 17718–17723. [Google Scholar] [CrossRef] [PubMed] [Green Version]
- Pattingre, S.; Bauvy, C.; Levade, T.; Levine, B.; Codogno, P. Ceramide-induced autophagy: To junk or to protect cells? Autophagy 2009, 5, 558–560. [Google Scholar] [CrossRef] [PubMed] [Green Version]
- Ribas, V.; Garcia-Ruiz, C.; Fernandez-Checa, J.C. Glutathione and mitochondria. Front. Pharmacol. 2014, 5, 151. [Google Scholar] [CrossRef] [PubMed] [Green Version]
- Fujiki, Y.; Okumoto, K.; Mukai, S.; Honsho, M.; Tamura, S. Peroxisome biogenesis in mammalian cells. Front. Physiol. 2014, 5, 307. [Google Scholar] [CrossRef] [PubMed] [Green Version]
- Liu, Y.; Levine, B. Autosis and autophagic cell death: The dark side of autophagy. Cell Death Differ. 2015, 22, 367–376. [Google Scholar] [CrossRef] [PubMed] [Green Version]
- Palomo, L.; Sole, F. SF3B1: The lord of the rings in MDS. Blood 2020, 136, 149–151. [Google Scholar] [CrossRef] [PubMed]
- Dalton, W.B. The metabolic reprogramming and vulnerability of SF3B1 mutations. Mol. Cell Oncol. 2020, 7, 1697619. [Google Scholar] [CrossRef]
- Dalton, W.B.; Helmenstine, E.; Walsh, N.; Gondek, L.P.; Kelkar, D.S.; Read, A.; Natrajan, R.; Christenson, E.S.; Roman, B.; Das, S.; et al. Hotspot SF3B1 mutations induce metabolic reprogramming and vulnerability to serine deprivation. J. Clin. Investig. 2019, 129, 4708–4723. [Google Scholar] [CrossRef]
- Chong, J.; Wishart, D.S.; Xia, J. Using MetaboAnalyst 4.0 for Comprehensive and Integrative Metabolomics Data Analysis. Curr. Protoc. Bioinform. 2019, 68, 86. [Google Scholar] [CrossRef]


| Ratios | G1 vs. Controls | G2 vs. Controls | G1 vs. G2 |
|---|---|---|---|
| NAD+/NADH | 3.76 | 0.97 | 0.41 |
| ADP/ATP | 6.82 | 26.01 | 0.95 |
| Citrate/aKG | 12.45 | 3.77 | 0.38 |
| GSH/GSSG | 0.86 | 3.35 | 3.87 |
| NADP+/NADPH | 1.21 | 0.25 | 0.21 |
| FAD/FADH2 | 2.19 | 2.94 | 2.22 |
| NADH/FADH2 | 1.02 | 1.34 | 0.48 |
| Pyruvate/Lactate | 0.97 | 0.83 | 2.31 |
Publisher’s Note: MDPI stays neutral with regard to jurisdictional claims in published maps and institutional affiliations. |
© 2020 by the authors. Licensee MDPI, Basel, Switzerland. This article is an open access article distributed under the terms and conditions of the Creative Commons Attribution (CC BY) license (http://creativecommons.org/licenses/by/4.0/).
Share and Cite
Poulaki, A.; Katsila, T.; Stergiou, I.E.; Giannouli, S.; Gόmez-Tamayo, J.C.; Piperaki, E.-T.; Kambas, K.; Dimitrakopoulou, A.; Patrinos, G.P.; Tzioufas, A.G.; et al. Bioenergetic Profiling of the Differentiating Human MDS Myeloid Lineage with Low and High Bone Marrow Blast Counts. Cancers 2020, 12, 3520. https://doi.org/10.3390/cancers12123520
Poulaki A, Katsila T, Stergiou IE, Giannouli S, Gόmez-Tamayo JC, Piperaki E-T, Kambas K, Dimitrakopoulou A, Patrinos GP, Tzioufas AG, et al. Bioenergetic Profiling of the Differentiating Human MDS Myeloid Lineage with Low and High Bone Marrow Blast Counts. Cancers. 2020; 12(12):3520. https://doi.org/10.3390/cancers12123520
Chicago/Turabian StylePoulaki, Aikaterini, Theodora Katsila, Ioanna E. Stergiou, Stavroula Giannouli, Jose Carlos Gόmez-Tamayo, Evangelia-Theophano Piperaki, Konstantinos Kambas, Aglaia Dimitrakopoulou, George P. Patrinos, Athanasios G. Tzioufas, and et al. 2020. "Bioenergetic Profiling of the Differentiating Human MDS Myeloid Lineage with Low and High Bone Marrow Blast Counts" Cancers 12, no. 12: 3520. https://doi.org/10.3390/cancers12123520