Calcitriol in the Presence of Conditioned Media from Metastatic Breast Cancer Cells Enhances Ex Vivo Polarization of M2 Alternative Murine Bone Marrow-Derived Macrophages


Abstract
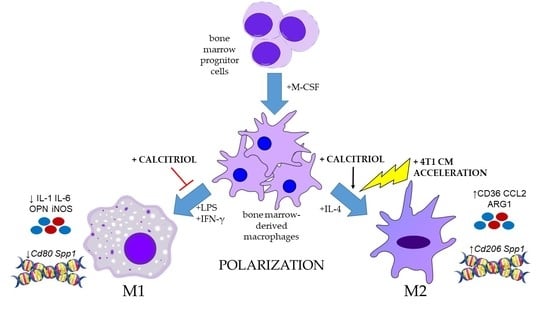
Simple Summary
Abstract
1. Introduction
2. Results
2.1. Calcitriol Does Not Significantly Affect the Proliferation of BMDMs
2.2. Calcitriol Differentially Alters the Expression of BMDM Genes
2.3. Calcitriol Slightly Influences the Expression of BMDMs Proteins
2.4. Calcitriol Modifies the Pattern of Cytokine/Chemokine Production Characteristic of Specific BMDMs Classes
2.5. Calcitriol Reduces or Increases the Expression of Markers Characteristic of Class M1 or M2 BMDMs
2.6. CM from Cancer and Normal Cells Affects the Proliferation of BMDMs Differently
2.7. Calcitriol Modulates CM-Induced Gene Expression of BMDMs
2.8. Calcitriol in Combination with CM Modifies the Profile of Cytokines Secreted by BMDMs
2.9. M2 BMDMs Differentiated in the Presence of Calcitriol Enhance the Migratory Potential of 4T1 and 67NR Cells
3. Discussion
4. Materials and Methods
4.1. Ex Vivo Differentiation of BMDMs and Phenotype Polarization
4.2. SRB Cell Proliferation Assay
4.3. RNA Isolation and Real-Time PCR Analysis
4.4. Cell Surface Marker Analysis by Flow Cytometry
4.5. Cytokine Array
4.6. Quantitative Protein Evaluation by ELISA
4.7. Spectroscopic Determination of Nitrite Ions in the Griess Test
4.8. Total Protein Quantification and Western Blot Assay
4.9. Determination of Arginase Activity
4.10. Imaging by Immunofluorescence Microscopy
4.11. Generation of CM from Murine Breast Cancer and Normal Epithelial Cell Cultures
4.12. The Transwell Migration Assay
4.13. Statistical Analysis
5. Conclusions
Supplementary Materials
Author Contributions
Funding
Conflicts of Interest
References
- Ginhoux, F.; Jung, S. Monocytes and macrophages: Developmental pathways and tissue homeostasis. Nat. Rev. Immunol. 2014, 14, 392–404. [Google Scholar] [CrossRef] [PubMed]
- Chanmee, T.; Ontong, P.; Konno, K.; Itano, N. Tumor-Associated Macrophages as Major Players in the Tumor Microenvironment. Cancers 2014, 6, 1670–1690. [Google Scholar] [CrossRef] [PubMed]
- Rhee, I. Diverse macrophages polarization in tumor microenvironment. Arch. Pharm. Res. 2016, 39, 1588–1596. [Google Scholar] [CrossRef] [PubMed]
- Rőszer, T. Understanding the Mysterious M2 Macrophage through Activation Markers and Effector Mechanisms. Mediat. Inflamm. 2015, 2015, 1–16. [Google Scholar] [CrossRef] [PubMed]
- Mantovani, A.; Sozzani, S.; Locati, M.; Allavena, P.; Sica, A. Macrophage polarization: Tumor-associated macrophages as a paradigm for polarized M2 mononuclear phagocytes. Trends Immunol. 2002, 23, 549–555. [Google Scholar] [CrossRef]
- Lewis, C.E.; Pollard, J.W. Distinct Role of Macrophages in Different Tumor Microenvironments. Cancer Res. 2006, 66, 605–612. [Google Scholar] [CrossRef]
- Obeid, E.; Nanda, R.; Fu, Y.X.; Olopade, O.I. The role of tumor-associated macrophages in breast cancer progression (review). Int. J. Oncol. 2013, 43, 5–12. [Google Scholar] [CrossRef]
- Zhao, X.; Qu, J.; Sun, Y.; Wang, J.; Liu, X.; Wang, F.; Zhang, H.; Wang, W.; Ma, X.; Gao, X.; et al. Prognostic significance of tumor-associated macrophages in breast cancer: A meta-analysis of the literature. Oncotarget 2017, 8, 30576–30586. [Google Scholar] [CrossRef]
- Takeya, M.; Komohara, Y. Role of tumor-associated macrophages in human malignancies: Friend or foe? Pathol. Int. 2016, 66, 491–505. [Google Scholar] [CrossRef]
- D’Ambrosio, D.; Cippitelli, M.; Cocciolo, M.G.; Mazzeo, D.; Di Ucia, P.; Lang, R.; Sinigaglia, F.; Panina-Bordignon, P. Inhibition of IL-12 production by 1, 25-dihydroxyvitamin D3. Involvement of NF-kappaB downregulation in transcriptional repression of the p40 gene. J. Clin. Investig. 1998, 101, 252. [Google Scholar] [CrossRef]
- Wasnik, S.; Rundle, C.H.; Baylink, D.J.; Yazdi, M.S.; Carreon, E.E.; Xu, Y.; Qin, X.; Lau, K.W.; Tang, X. 1,25-Dihydroxyvitamin D suppresses M1 macrophages and promotes M2 differentiation at bone injury sites. JCI Insight 2018, 3. [Google Scholar] [CrossRef] [PubMed]
- Zhang, Y.; Leung, D.Y.M.; Richers, B.N.; Liu, Y.; Remigio, L.K. Vitamin D inhibits monocyte/macrophage pro-inflammatory cytokine production by targeting mitogen-activated protein kinase phosphatase 1. J. Immunol. 2013, 188, 2127–2135. [Google Scholar] [CrossRef] [PubMed]
- Almerighi, C.; Sinistro, A.; Cavazza, A.; Ciaprini, C.; Rocchi, G.; Bergamini, A. 1,25-Dihydroxyvitamin D3 inhibits CD40L-induced pro-inflammatory and immunomodulatory activity in Human Monocytes. Cytokine 2009, 45, 190–197. [Google Scholar] [CrossRef]
- Di Rosa, M.; Malaguarnera, M.; Nicoletti, F.; Malaguarnera, L. Vitamin D3: A helpful immuno-modulator. Immunology 2011, 134, 123–139. [Google Scholar] [CrossRef] [PubMed]
- Chang, J.M.; Kuo, M.C.; Kuo, H.T.; Hwang, S.J.; Tsai, J.C.; Chen, H.C.; Lai, Y.H. 1-α,25-Dihydroxyvitamin D3 regulates inducible nitric oxide synthase messenger RNA expression and nitric oxide release in macrophage-like RAW 264.7 cells. J. Lab. Clin. Med. 2004, 143, 14–22. [Google Scholar] [CrossRef]
- Mora, J.R.; Iwata, M.; von Andrian, U.H. Vitamin effects on the immune system: Vitamins A and D take centre stage. Nat. Rev. Immunol. 2008, 8, 685–698. [Google Scholar] [CrossRef]
- Coussens, A.; Timms, P.M.; Boucher, B.J.; Venton, T.R.; Ashcroft, A.T.; Skolimowska, K.H.; Newton, S.M.; Wilkinson, K.A.; Davidson, R.N.; Griffiths, C.J.; et al. 1α,25-dihydroxyvitamin D3 inhibits matrix metalloproteinases induced by Mycobacterium tuberculosis infection. Immunology 2009, 127, 539–548. [Google Scholar] [CrossRef]
- Zhang, X.L.; Guo, Y.F.; Song, Z.X.; Zhou, M. Vitamin D prevents podocyte injury via regulation of macrophage M1/M2 phenotype in diabetic nephropathy rats. Endocrinology 2014, 155, 4939–4950. [Google Scholar] [CrossRef]
- Scott, J.F.; Das, L.M.; Ahsanuddin, S.; Qiu, Y.; Binko, A.M.; Traylor, Z.P.; Debanne, S.M.; Cooper, K.D.; Boxer, R.; Lu, K.Q. Oral Vitamin D Rapidly Attenuates Inflammation from Sunburn: An Interventional Study. J. Invest. Derm. 2017, 137, 2078–2086. [Google Scholar] [CrossRef]
- Wilmanski, T.; Zhou, X.; Zheng, W.; Shinde, A.; Donkin, S.S.; Wendt, M.; Burgess, J.R.; Teegarden, D. Inhibition of pyruvate carboxylase by 1α,25-dihydroxyvitamin D promotes oxidative stress in early breast cancer progression. Cancer Lett. 2017, 411, 171–181. [Google Scholar] [CrossRef]
- Narvaez, C.J.; Matthews, D.; LaPorta, E.; Simmons, K.M.; Beaudin, S.; Welsh, J. The impact of vitamin D in breast cancer: Genomics, pathways, metabolism. Front. Physiol. 2014, 5, 1–10. [Google Scholar] [CrossRef] [PubMed]
- Díaz, L.; Díaz-Muñoz, M.; García-Gaytán, A.C.; Méndez, I. Mechanistic effects of calcitriol in cancer biology. Nutrients 2015, 7, 5020–5050. [Google Scholar] [CrossRef] [PubMed]
- Feldman, D.; Krishnan, A.V.; Swami, S.; Giovannucci, E.; Feldman, B.J. The role of vitamin D in reducing cancer risk and progression. Nat. Rev. Cancer 2014, 14, 342–357. [Google Scholar] [CrossRef] [PubMed]
- Anisiewicz, A.; Pawlik, A.; Filip-Psurska, B.; Turlej, E.; Dzimira, S.; Milczarek, M.; Gdesz, K.; Papiernik, D.; Jarosz, J.; Kłopotowska, D.; et al. Unfavorable effect of calcitriol and its low-calcemic analogs on metastasis of 4T1 mouse mammary gland cancer. Int. J. Oncol. 2017, 52, 103–126. [Google Scholar] [CrossRef] [PubMed]
- Anisiewicz, A.; Kowalski, K.; Banach, J.; Łabędź, N.; Stachowicz-Suhs, M.; Piotrowska, A.; Milczarek, M.; Kłopotowska, D.; Dzięgiel, P.; Wietrzyk, J. Vitamin D Metabolite Profile in Cholecalciferol- or Calcitriol-Supplemented Healthy and Mammary Gland Tumor-Bearing Mice. Nutrients 2020, 12, 3416. [Google Scholar] [CrossRef] [PubMed]
- Ajibade, A.A.; Kirk, J.S.; Karasik, E.; Gillard, B.; Moser, M.T.; Johnson, C.S.; Trump, D.L.; Foster, B.A. Early growth inhibition is followed by increased metastatic disease with vitamin D (Calcitriol) treatment in the TRAMP model of prostate cancer. PLoS ONE 2014, 9, e89555. [Google Scholar] [CrossRef] [PubMed]
- Cao, Y.; Jin, F.; Li, B.; Wang, Y.; Wei, M.; Feng, Y.; Du, Y.; Liu, F.; Li, X.; Guan, S.; et al. Vitamin D aggravates breast cancer by inducing immunosuppression in the tumor bearing mouse. Immunotherapy 2018, 10, 555–566. [Google Scholar] [CrossRef]
- Pawlik, A.; Anisiewicz, A.; Filip-Psurska, B.; Nowak, M.; Turlej, E.; Trynda, J.; Banach, J.; Gretkierewicz, P.; Wietrzyk, J. Calcitriol and Its Analogs Establish the Immunosuppressive Microenvironment That Drives Metastasis in 4T1 Mouse Mammary Gland Cancer. Int. J. Mol. Sci. 2018, 19, 2116. [Google Scholar] [CrossRef]
- Pawlik, A.; Anisiewicz, A.; Filip-Psurska, B.; Klopotowska, D.; Maciejewska, M.; Mazur, A.; Wietrzyk, J. Divergent effect of tacalcitol (PRI-2191) on Th17 cells in 4T1 tumor bearing young and old ovariectomized mice. Aging Dis. 2020, 11, 241–253. [Google Scholar] [CrossRef]
- Anisiewicz, A.; Pawlik, A.; Filip-Psurska, B.; Wietrzyk, J. Differential Impact of Calcitriol and Its Analogs on Tumor Stroma in Young and Aged Ovariectomized Mice Bearing 4T1 Mammary Gland Cancer. Int. J. Mol. Sci. 2020, 21, 6359. [Google Scholar] [CrossRef]
- Estébanez, N.; Gómez-Acebo, I.; Palazuelos, C.; Llorca, J.; Dierssen-Sotos, T. Vitamin D exposure and risk of breast cancer: A meta-analysis. Sci. Rep. 2018, 8, 1–13. [Google Scholar] [CrossRef] [PubMed]
- Manson, J.E.; Cook, N.R.; Lee, I.-M.; Christen, W.; Bassuk, S.S.; Mora, S.; Gibson, H.; Gordon, D.; Copeland, T.; D’Agostino, D.; et al. Vitamin D Supplements and Prevention of Cancer and Cardiovascular Disease. N. Engl. J. Med. 2019, 380, 33–44. [Google Scholar] [CrossRef] [PubMed]
- Ordóñez-Mena, J.M.; Schöttker, B.; Fedirko, V.; Jenab, M.; Olsen, A.; Halkjær, J.; Kampman, E.; de Groot, L.; Jansen, E.; Bueno-de-Mesquita, H.B.; et al. Pre-diagnostic vitamin D concentrations and cancer risks in older individuals: An analysis of cohorts participating in the CHANCES consortium. Eur. J. Epidemiol. 2016, 31, 311–323. [Google Scholar] [CrossRef] [PubMed]
- Kanstrup, C.; Teilum, D.; Rejnmark, L.; Bigaard, J.V.; Eiken, P.; Kroman, N.; Tjønneland, A.; Mejdahl, M.K. 25-Hydroxyvitamin D at time of breast cancer diagnosis and breast cancer survival. Breast Cancer Res. Treat. 2020, 179, 699–708. [Google Scholar] [CrossRef]
- Kim, J.; Bae, J.-S. Tumor-Associated Macrophages and Neutrophils in Tumor Microenvironment. Mediat. Inflamm. 2016, 2016, 1–11. [Google Scholar] [CrossRef]
- Acharyya, S.; Oskarsson, T.; Vanharanta, S.; Malladi, S.; Kim, J.; Morris, P.G.; Manova-Todorova, K.; Leversha, M.; Hogg, N.; Seshan, V.E.; et al. A CXCL1 Paracrine Network Links Cancer Chemoresistance and Metastasis. Cell 2012, 150, 165–178. [Google Scholar] [CrossRef]
- Wang, N.; Liu, W.; Zheng, Y.; Wang, S.; Yang, B.; Li, M.; Song, J.; Zhang, F.; Zhang, X.; Wang, Q.; et al. CXCL1 derived from tumor-associated macrophages promotes breast cancer metastasis via activating NF-κB/SOX4 signaling. Cell Death Dis. 2018, 9, 880. [Google Scholar]
- Li, L.; Liu, Y.D.; Zhan, Y.T.; Zhu, Y.H.; Li, Y.; Xie, D.; Guan, X.Y. High levels of CCL2 or CCL4 in the tumor microenvironment predict unfavorable survival in lung adenocarcinoma. Thorac. Cancer 2018, 9, 775–784. [Google Scholar] [CrossRef]
- De la Fuente López, M.; Landskron, G.; Parada, D.; Dubois-Camacho, K.; Simian, D.; Martinez, M.; Romero, D.; Roa, J.C.; Chahuán, I.; Gutiérrez, R.; et al. The relationship between chemokines CCL2, CCL3, and CCL4 with the tumor microenvironment and tumor-associated macrophage markers in colorectal cancer. Tumor Biol. 2018, 40, 1–12. [Google Scholar] [CrossRef]
- Tokunaga, R.; Zhang, W.; Naseem, M.; Puccini, A.; Berger, M.D.; Soni, S.; McSkane, M.; Baba, H.; Lenz, H.-J. CXCL9, CXCL10, CXCL11/CXCR3 axis for immune activation—A target for novel cancer therapy. Cancer Treat. Rev. 2018, 63, 40–47. [Google Scholar] [CrossRef]
- Arango Duque, G.; Descoteaux, A. Macrophage Cytokines: Involvement in Immunity and Infectious Diseases. Front. Immunol. 2014, 5, 1–13. [Google Scholar] [CrossRef]
- Martinez, F.O.; Gordon, S. The M1 and M2 paradigm of macrophage activation: Time for reassessment. F1000Prime Rep. 2014, 6, 1–13. [Google Scholar] [CrossRef] [PubMed]
- Gunasekar, P.; Swier, V.J.; Fleegel, J.P.; Boosani, C.S.; Radwan, M.M.; AgrawalI, D.K. Vitamin D and macrophage polarization in epicardial adipose tissue of atherosclerotic swine. PLoS ONE 2018, 13, e0199411. [Google Scholar] [CrossRef] [PubMed]
- Xu, H.; Soruri, A.; Gieseler, R.K.H.; Peters, J.H. 1,25-Dihydroxyvitamin D3 Exerts Opposing Effects to IL-4 on MHC Class-II Antigen Expression, Accessory Activity, and Phagocytosis of Human Monocytes. Scand. J. Immunol. 1993, 38, 535–540. [Google Scholar] [CrossRef] [PubMed]
- Rath, M.; Müller, I.; Kropf, P.; Closs, E.I.; Munder, M. Metabolism via arginase or nitric oxide synthase: Two competing arginine pathways in macrophages. Front. Immunol. 2014, 5, 1–11. [Google Scholar] [CrossRef]
- Xu, R.; Li, Y.; Yan, H.; Zhang, E.; Huang, X.; Chen, Q.; Chen, J.; Qu, J.; Liu, Y.; He, J.; et al. CCL2 promotes macrophages-associated chemoresistance via MCPIP1 dual catalytic activities in multiple myeloma. Cell Death Dis. 2019, 10. [Google Scholar] [CrossRef]
- Sierra-Filardi, E.; Nieto, C.; Domínguez-Soto, Á.; Barroso, R.; Sánchez-Mateos, P.; Puig-Kroger, A.; López-Bravo, M.; Joven, J.; Ardavín, C.; Rodríguez-Fernández, J.L.; et al. CCL2 Shapes Macrophage Polarization by GM-CSF and M-CSF: Identification of CCL2/CCR2-Dependent Gene Expression Profile. J. Immunol. 2014, 192, 3858–3867. [Google Scholar] [CrossRef]
- Carson, W.F.; Salter-Green, S.E.; Scola, M.M.; Joshi, A.; Gallagher, K.A.; Kunkel, S.L. Enhancement of macrophage inflammatory responses by CCL2 is correlated with increased miR-9 expression and downregulation of the ERK1/2 phosphatase Dusp6. Cell. Immunol. 2017, 314, 63–72. [Google Scholar] [CrossRef]
- Soria, G.; Ben-Baruch, A. The inflammatory chemokines CCL2 and CCL5 in breast cancer. Cancer Lett. 2008, 267, 271–285. [Google Scholar] [CrossRef]
- Giopanou, I.; Lilis, I.; Papaleonidopoulos, V.; Agalioti, T.; Kanellakis, N.I.; Spiropoulou, N.; Spella, M.; Stathopoulos, G.T. Tumor-derived osteopontin isoforms cooperate with TRP53 and CCL2 to promote lung metastasis. Oncoimmunology 2017, 6, e1256528. [Google Scholar] [CrossRef]
- Wei, J.; Li, S.; Heimberger, A.B.; Wei, J.; Marisetty, A.; Schrand, B.; Gabrusiewicz, K.; Hashimoto, Y.; Ott, M.; Grami, Z.; et al. Osteopontin mediates glioblastoma-associated macrophage infiltration and is a potential therapeutic target. J. Clin. Investig. 2018, 129, 137–149. [Google Scholar] [CrossRef]
- Lin, C.N.; Wang, C.J.; Chao, Y.J.; Lai, M.D.; Shan, Y.S. The significance of the co-existence of osteopontin and tumor-associated macrophages in gastric cancer progression. BMC Cancer 2015, 15, 128. [Google Scholar] [CrossRef] [PubMed]
- Inoue, M.; Shinohara, M.L. Intracellular osteopontin (iOPN) and immunity. Immunol. Res. 2011, 49, 160–172. [Google Scholar] [CrossRef] [PubMed]
- Anisiewicz, A.; Filip-Psurska, B.; Pawlik, A.; Nasulewicz-Goldeman, A.; Piasecki, T.; Kowalski, K.; Maciejewska, M.; Jarosz, J.; Banach, J.; Papiernik, D.; et al. Calcitriol Analogues Decrease Lung Metastasis but Impair Bone Metabolism in Aged Ovariectomized Mice Bearing 4T1 Mammary Gland Tumours. Aging Dis. 2019, 10, 977. [Google Scholar] [CrossRef] [PubMed]
- Shinde, A.; Hardy, S.D.; Kim, D.; Akhand, S.S.; Jolly, M.K.; Wang, W.-H.; Anderson, J.C.; Khodadadi, R.B.; Brown, W.S.; George, J.T.; et al. Spleen Tyrosine Kinase–Mediated Autophagy Is Required for Epithelial–Mesenchymal Plasticity and Metastasis in Breast Cancer. Cancer Res. 2019, 79, 1831–1843. [Google Scholar] [CrossRef] [PubMed]
- DuPre, S.A.; Hunter, K.W. Murine mammary carcinoma 4T1 induces a leukemoid reaction with splenomegaly: Association with tumor-derived growth factors. Exp. Mol. Pathol. 2007, 82, 12–24. [Google Scholar] [CrossRef]
- Papiernik, D.; Urbaniak, A.; Kłopotowska, D.; Nasulewicz-Goldeman, A.; Ekiert, M.; Nowak, M.; Jarosz, J.; Cuprych, M.; Strzykalska, A.; Ugorski, M.; et al. Retinol-binding protein 4 accelerates metastatic spread and increases impairment of blood flow in mouse mammary gland tumors. Cancers 2020, 12, 623. [Google Scholar] [CrossRef]
- Madera, L.; Greenshields, A.; Coombs, M.R.P.; Hoskin, D.W. 4T1 murine mammary carcinoma cells enhance macrophage-mediated innate inflammatory responses. PLoS ONE 2015, 10, e0133385. [Google Scholar] [CrossRef]
- Liu, G.; Yin, L.; Ouyang, X.; Zeng, K.; Xiao, Y.; Li, Y. M2 Macrophages Promote HCC Cells Invasion and Migration via miR-149-5p/MMP9 Signaling. J. Cancer 2020, 11, 1277–1287. [Google Scholar] [CrossRef]
- Tian, Y.; Guo, Y.; Zhu, P.; Zhang, D.; Liu, S.; Tang, M.; Wang, Y.; Jin, Z.; Li, D.; Yan, D.; et al. TRIM59 loss in M2 macrophages promotes melanoma migration and invasion by upregulating MMP-9 and Madcam1. Aging 2019, 11, 8623–8641. [Google Scholar] [CrossRef]
- Zheng, P.; Luo, Q.; Wang, W.; Li, J.; Wang, T.; Wang, P.; Chen, L.; Zhang, P.; Chen, H.; Liu, Y.; et al. Tumor-associated macrophages-derived exosomes promote the migration of gastric cancer cells by transfer of functional Apolipoprotein E. Cell Death Dis. 2018, 9, 434. [Google Scholar] [CrossRef]
- Xu, S.; Zhang, Z.; Fu, L.; Song, J.; Xie, D.; Yu, D.; Xu, D.; Sun, G. Calcitriol inhibits migration and invasion of renal cell carcinoma cells by suppressing Smad2/3-, STAT3- and β-catenin-mediated epithelial-mesenchymal transition. Cancer Sci. 2020, 111, 59–71. [Google Scholar] [CrossRef] [PubMed]
- Wang, L.; Zhou, S.; Guo, B. Vitamin D Suppresses Ovarian Cancer Growth and Invasion by Targeting Long Non-Coding RNA CCAT2. Int. J. Mol. Sci. 2020, 21, 2334. [Google Scholar] [CrossRef] [PubMed]
- Liu, P.T. Toll-Like Receptor Triggering of a Vitamin D-Mediated Human Antimicrobial Response. Science 2006, 311, 1770–1773. [Google Scholar] [CrossRef] [PubMed]
- Tang, J.C.Y.; Jackson, S.; Walsh, N.P.; Greeves, J.; Fraser, W.D.; Ball, N.; Dutton, J.; Nicholls, H.; Piec, I.; Washbourne, C.J. The dynamic relationships between the active and catabolic vitamin D metabolites, their ratios, and associations with PTH. Sci. Rep. 2019, 9, 1–10. [Google Scholar] [CrossRef] [PubMed]
- Wietrzyk, J.; Chodyński, M.; Fitak, H.; Wojdat, E.; Kutner, A.; Opolski, A. Antitumor properties of diastereomeric and geometric analogs of vitamin D3. Anticancer Drugs 2007, 18, 447–457. [Google Scholar] [CrossRef] [PubMed]
- Giustarini, D.; Rossi, R.; Milzani, A.; Dalle-Donne, I. Nitrite and Nitrate Measurement by Griess Reagent in Human Plasma: Evaluation of Interferences and Standardization. Methods Enzymol. 2008, 440, 361–380. [Google Scholar] [CrossRef] [PubMed]


| Protein | M0 | M0 + cal | M1 | M1 + cal | M2 | M2 + cal |
|---|---|---|---|---|---|---|
| G-CSF | 1.36% | 0.81% | 0.04% | 1.45% | 3.10% *# | 3.61% *^# |
| GM-CSF | 0.22% | 0.04% | 0.00% | 0.00% | 4.88% *# | 3.67% *^# |
| IFN-γ | 0.00% | 0.00% | 0.02% | 1.00% *^& | 0.00% | 0.00% # |
| IL-1RA | 20.50% | 13.34% | 79.44% * | 104.76% *^& | 55.42% *# | 49.91% *^# |
| IL-10 | 0.00% | 0.00% | 0.00% | 0.00% | 1.32% *# | 1.09% *^# |
| IL-27 | 0.00% | 0.00% | 0.00% | 0.00% | 4.56% *# | 6.31% *^# |
| CXCL10 | 71.66% | 45.75% * | 100.04% * | 90.25% | 121.41% * | 123.68% *^ |
| CXCL11 | 1.92% | 1.25% | 1.08% * | 2.41% ^& | 0.00% *# | 0.00% *^# |
| CXCL1 | 69.48% | 68.10% | 16.13% * | 20.79% *^ | 124.39% *# | 143.05% *^#& |
| CCL12 | 0.00% | 0.00% | 0.00% | 0.00% | 5.44% *# | 3.76% *^# |
| CXCL9 | 2.00% | 1.07% | 13.80% * | 12.27% *^ | 6.89% *# | 4.01% |
| CCL3 | 101.63% | 88.85% | 1.82% * | 5.72% *^ | 100.13% # | 77.59% *#& |
| CCL4 | 79.07% | 72.03% | 0.49% * | 3.41% *^ | 69.20% # | 66.37% # |
| CXCL2 | 110.57% | 104.17% | 49.29% * | 52.74% *^ | 83.07% *# | 67.31% *^ |
| CCL5 | 136.22% | 126.49% | 120.81% | 105.06% *^ | 121.55% | 110.80% * |
| CXCL12 | 6.45% | 4.79% | 4.78% | 5.40% | 3.46% * | 3.44% * |
| TIMP-1 | 2.11% | 1.55% | 1.52% | 2.97% | 13.64% *# | 17.58% *^# |
| TNF-α | 10.82% | 13.76% | 109.60% * | 115.36% *^ | 46.21% *# | 48.80% *^# |
| Mix 1 | ||
|---|---|---|
| Antibody | Host Species | Manufacturer |
| F4/80- BV421 | Rat | BD Biosciences |
| CD11b-APC | Rat | BD Biosciences |
| CD54-FITC | Hamster | BD Biosciences |
| MHC II-PerCP-Cy5.5 | Rat | BioLegend |
| CD204-BV650 | Rat | BioLegend |
| CD80-PeCy7 | Hamster | BioLegend |
| CD44-BV510 | Rat | BioLegend |
| CD163-PE | Rat | Thermo Fisher |
| Mix 2 | ||
| F4/80-BV421 | Rat | BD Biosciences |
| CD36-PE | Mouse | BD Biosciences |
| CD86-FITC | Rat | BD Biosciences |
Publisher’s Note: MDPI stays neutral with regard to jurisdictional claims in published maps and institutional affiliations. |
© 2020 by the authors. Licensee MDPI, Basel, Switzerland. This article is an open access article distributed under the terms and conditions of the Creative Commons Attribution (CC BY) license (http://creativecommons.org/licenses/by/4.0/).
Share and Cite
Anisiewicz, A.; Łabędź, N.; Krauze, I.; Wietrzyk, J. Calcitriol in the Presence of Conditioned Media from Metastatic Breast Cancer Cells Enhances Ex Vivo Polarization of M2 Alternative Murine Bone Marrow-Derived Macrophages. Cancers 2020, 12, 3485. https://doi.org/10.3390/cancers12113485
Anisiewicz A, Łabędź N, Krauze I, Wietrzyk J. Calcitriol in the Presence of Conditioned Media from Metastatic Breast Cancer Cells Enhances Ex Vivo Polarization of M2 Alternative Murine Bone Marrow-Derived Macrophages. Cancers. 2020; 12(11):3485. https://doi.org/10.3390/cancers12113485
Chicago/Turabian StyleAnisiewicz, Artur, Natalia Łabędź, Izabela Krauze, and Joanna Wietrzyk. 2020. "Calcitriol in the Presence of Conditioned Media from Metastatic Breast Cancer Cells Enhances Ex Vivo Polarization of M2 Alternative Murine Bone Marrow-Derived Macrophages" Cancers 12, no. 11: 3485. https://doi.org/10.3390/cancers12113485
APA StyleAnisiewicz, A., Łabędź, N., Krauze, I., & Wietrzyk, J. (2020). Calcitriol in the Presence of Conditioned Media from Metastatic Breast Cancer Cells Enhances Ex Vivo Polarization of M2 Alternative Murine Bone Marrow-Derived Macrophages. Cancers, 12(11), 3485. https://doi.org/10.3390/cancers12113485