Article

Plasma Predictive Features in Treating EGFR-Mutated Non-Small Cell Lung Cancer

by
Christi M. J. Steendam
1,2,†,
G. D. Marijn Veerman
3,†,
Melinda A. Pruis
1,3,
Peggy Atmodimedjo
4,
Marthe S. Paats
1,
Cor van der Leest
2,
Jan H. von der Thüsen
4,
David C. Y. Yick
5,
Esther Oomen-de Hoop
3,
Stijn L. W. Koolen
3,
Winand N. M. Dinjens
4,
Ron H. N. van Schaik
6,
Ron H. J. Mathijssen
3,
Joachim G. J. V. Aerts
1,
Hendrikus Jan Dubbink
4,*,‡ and
Anne-Marie C. Dingemans
1,7,*,‡
1
Department of Pulmonology, Erasmus MC Cancer Institute, University Medical Center, 3015 GD Rotterdam, The Netherlands
2
Department of Pulmonology, Amphia Hospital, 4818 CK Breda, The Netherlands
3
Department of Medical Oncology, Erasmus MC Cancer Institute, University Medical Center, 3015 GD Rotterdam, The Netherlands
4
Department of Pathology, Erasmus MC Cancer Institute, University Medical Center, 3015 GD Rotterdam, The Netherlands
5
Department of Pathology, Amphia Hospital, 4818 CK Breda, The Netherlands
6
Department of Clinical Chemistry, Erasmus MC Cancer Institute, University Medical Center, 3015 GD Rotterdam, The Netherlands
7
Department of Pulmonology, Maastricht UMC+, 6229 HX Maastricht, The Netherlands
*
Authors to whom correspondence should be addressed.
Steendam and Veerman contributed equally.
Dubbink and Dingemans shared last author.
Cancers 2020, 12(11), 3179; https://doi.org/10.3390/cancers12113179
Submission received: 31 August 2020 / Revised: 19 October 2020 / Accepted: 21 October 2020 / Published: 29 October 2020
(This article belongs to the Special Issue Plasma Proteins and Cancer)

Abstract

:

Simple Summary

Patients with non-small cell lung cancer with an activating EGFR mutation in the tumor, are treated with targeted therapy against this mutation. In the end, all patients develop resistance against this therapy, but some patients have a very short or no benefit. In this study, the authors used blood samples from 41 patients to investigate predictive factors for lack of or short efficacy of targeted therapy. They found that lack of disappearance of the treated mutation in blood after 6 or 12 weeks, the presence of co-occurring TP53 mutations, and decrease of erlotinib therapy concentrations in time are correlated to a shorter time of benefit. Confirmation of these findings in a larger cohort is desirable, this may lead to implementation of blood sampling for DNA analysis and therapy concentration measurement in daily practice in the future, to identify patients in need of closer follow-up or more extensive treatment.

Abstract

Although epidermal growth factor receptor (EGFR)-tyrosine kinase inhibitors (TKIs) are the preferred treatment for patients with EGFR-mutated non-small cell lung cancer (NSCLC), not all patients benefit. We therefore explored the impact of the presence of mutations found in cell-free DNA (cfDNA) and TKI plasma concentrations during treatment on progression-free survival (PFS). In the prospective START-TKI study blood samples from 41 patients with EGFR-mutated NSCLC treated with EGFR-TKIs were available. Next generation sequencing (NGS) on cfDNA was performed, and plasma TKI concentrations were measured. Patients without complete plasma conversion of EGFR mutation at week 6 had a significantly shorter PFS (5.5 vs. 17.0 months, p = 0.002) and OS (14.0 vs. 25.5 months, p = 0.003) compared to patients with plasma conversion. In thirteen (second line) osimertinib-treated patients with a (plasma or tissue) concomitant TP53 mutation at baseline, PFS was significantly shorter compared to six wild-type cases; 8.8 vs. 18.8 months, p = 0.017. Erlotinib Cmean decrease of ≥10% in the second tertile of treatment was also associated with a significantly shorter PFS; 8.9 vs. 23.6 months, p = 0.037. We obtained evidence that absence of plasma loss of the primary EGFR mutation, isolated plasma p.T790M loss after six weeks, baseline concomitant TP53 mutations, and erlotinib Cmean decrease during treatment are probably related to worse outcome.

1. Introduction

Non-small cell lung cancer (NSCLC) has the highest mortality among solid tumors and once metastasized, patients have a limited prognosis and depend on palliative treatment [1]. Lung adenocarcinoma comprises some specific subgroups defined by oncogenic driver mutations, including the epidermal growth factor receptor (EGFR)-mutation. The outcome of patients with EGFR-mutated NSCLC has significantly improved with the introduction of EGFR-tyrosine kinase inhibitors (TKIs), with a median overall survival (OS) of more than 3 years [2]. However, up to 10% of patients have an initial lack of response (primary resistance) and 10 to 30% of patients have early progressive disease within 6 months [3,4]. Therefore, it is important to identify these patients early, in order to implement close monitoring and immediate switch to a next line of treatment.
Nevertheless, predictive biomarkers for EGFR-mutated NSCLC are scarce. Some studies have observed that concomitant mutations are associated with worse clinical outcome [5,6]. Especially, the presence of concomitant TP53 mutations was associated with shorter progression-free survival (PFS) and OS [7,8,9,10].
Next to tumor mutational characteristics, treatment outcome might be dependent on the actual TKI exposure. For multiple TKIs relationships have been found between pharmacokinetic parameters (e.g., minimal drug concentration or total exposure) and OS or PFS [11]. Variability in TKI exposure is high and can be influenced by drug–drug interactions, genetic variations in drug metabolizing (CYP) enzymes, lifestyle (e.g., smoking), and concomitant intake of food or herbs [12,13]. This is relevant, since higher exposure to a drug is thought to increase toxicity, while a lower exposure may lead to pharmacokinetic resistance, resulting in a lower survival. For several TKIs exposure-response or exposure-toxicity relations have been found [11]. In the case of erlotinib and osimertinib, no definite target plasma concentrations have been described to optimize their efficacy [11]. Concerning toxicity, pharmacologic modelling has shown that osimertinib concentrations have a positive relationship with occurrence of skin rash and diarrhea, and increase in cardiac QTc time [14]. For erlotinib, there is evidence that its main toxicity (diarrhea and skin rash) is correlated with dosage and drug concentrations [15,16,17]. In addition to TKI exposure, the possibility of penetration of the blood-brain barrier is of interest as brain metastases are a frequent site of metastasis and progression in NSCLC. Of all EGFR TKIs, drug penetration across the blood-brain barrier is highest for osimertinib [18]. This explains the lower incidence of central nervous system (CNS) progression for osimertinib compared to other EGFR-TKIs [19].
Although tissue biopsy is still considered the gold standard in defining the histological diagnosis and enabling extensive molecular investigation, the possibilities of plasma investigations for cell-free DNA (cfDNA) from a blood sample are increasing [20,21]. Besides the benefit of being a less invasive procedure with negligible risks, the cfDNA is likely to represent the full spectrum of clonal variation in the cell-free tumor DNA (ctDNA) as opposed to tissue obtained from just one tumor lesion/region [22]. Detection of primary activating EGFR mutations and resistance mechanisms, e.g., p.T790M development in plasma, have shown to be adequate and effective for directing therapy [23].
Our study aimed to explore the predictive value of blood-based biomarkers including cfDNA plasma mutation detection and drug level monitoring in patients with EGFR-mutated NSCLC treated with a first or second line EGFR-TKI.

2. Results

Between March 2017 and May 2019, a total of 41 unique patients with EGFR-mutated NSCLC, treated with a 1st generation EGFR-TKI in first line or 3rd generation EGFR-TKI in second line for a EGFR p.T790M resistance mutation, were included. Five patients were enrolled twice, both at first line and second line treatment. Hence, 46 observed treatment lines were available. Minimal follow-up was six months. Median follow-up of patients still alive at data cut-off at December 1st 2019 was 14.9 months (range 6.4–34.0 months).

2.1. Baseline Characteristics

Baseline characteristics are presented in Table 1. In the total cohort of individual patients (n = 41), the median PFS in the first line cohort (13.6 months (n = 14, 95% confidence interval (CI) 3.2–23.9 months)) was comparable to the PFS in the second line cohort (11.5 months (n = 27, 95% CI 3.2–19.8, p = 0.768)), see Supplementary Data Figure S1.
At baseline, samples for NGS were available in all patients: tissue samples were available in 32 patients (78%) and plasma in 38 (93%) patients of the total population (n = 41). In 31 out of 38 plasma samples ctDNA was detected (82%). There was no significant difference in PFS in patients with or without detectable ctDNA at baseline (see Supplementary Data Figure S2). However, the patients without baseline EGFR mutations in plasma (n = 7) did not have any radiological progression events, compared to 22 events in patients with detectable EGFR mutations at baseline (n = 31). At data cut-off, five patients were still on treatment and two died of other reasons (one patient due to multi-organ failure with empyema after chest tube placement, the other patient suddenly passed away at home after sudden onset of dyspnea, presumably because of pulmonary embolism or a cardiac event, see also Supplementary Data Table S1). In one patient a MAP2K1 mutation was found in absence of EGFR mutations in plasma at baseline, which was not detected in the tumor tissue, this patient was still on treatment at data cut-off. Treatment during study and best response are summarized in Table 2.

2.2. Presence of Concomitant Mutations (besides EGFR Primary Mutation and p.T790M)

At baseline, 26 patients harbored concomitant mutations (63%, n = 41), including TP53, ERBB2, CTNB1, MTOR, CDKN2A, ARAF, PIK3CA, PTEN, MAP2K1, and APC mutations. In 11 patients (27%) more than one concomitant mutation was detected and all of them included a TP53 mutation. One patient had more than one concomitant mutation found in plasma, with a PIK3CA mutation besides EGFR and TP53 mutations, and an additional PTEN mutation in tissue. There was no significant difference in PFS in patients with no, one or more concomitant mutations, see Supplementary Data Figure S3.

2.3. Presence of TP53 Mutations

A TP53 mutation was detected in 23 patients (56%); seven times a TP53 mutation was detected in plasma, compared to 22 in tissue. In one case, the TP53 mutation in plasma did not correspond to the mutation in tissue at baseline, but did agree with the tissue mutation at radiologic progression. TP53 mutations were most common in exon 7 and exon 5, the majority were missense mutations, see Table 3. In the total EGFR cohort, median PFS in patients without a TP53 mutation at baseline (n = 10, 18.8 months, 95% CI 13.5–24.1) was not significantly longer than median PFS in the TP53 mutated group (n = 23, 13.1 months, 95% CI 4.1–22.1, p = 0.068). In the second line cohort, the PFS was significantly shorter in thirteen patients with a TP53 mutation at basel ine than in six wild-type patients (8.8 (95% CI 0.7–16.9) vs. 18.8 (95% CI 13.3–24.3) months, p = 0.017), see Supplementary Data Figure S4C. In one patient a new TP53 mutation was detected in tumor tissue at time of progressive disease (PD). At baseline however, no tissue was available for this patient. No other new TP53 mutations were demonstrated over the course of treatment.

2.4. Resistance Mechanisms

At radiologic progression, in 19 patients (83% out of 23 patients with available samples) at least one new concomitant mutation was detected, of which 12 (52%) had more than one concomitant mutation.

2.4.1. First Line Cohort (1st Generation EGFR-TKI)

At data cut-off, 15 of the 19 patients had a PFS event (79%), while 13 showed radiological progression of disease (68%). Plasma samples for analysis at PD were available in 11 patients and tissue samples in seven of these patients. In six patients treated with erlotinib or gefinitib a EGFR p.T790M mutation was detected at PD; in two patients EGFR p.T790M was detected in plasma but not in tissue (including one missing tissue sample), two cases had EGFR p.T790M confirmed in both plasma and tissue, and in two other patients EGFR p.T790M was present in tissue but not in plasma. Two patients also developed an extra possible resistance mutation in tissue samples, a novel CDKN2A homozygote deletion and a novel APC mutation next to EGFR p.T790M.

2.4.2. Second Line Cohort (Osimertinib)

At data cut-off, 18 of 27 patients had a PFS event, of whom 16 demonstrated radiological progression (59%). At PD, plasma samples were collected in all 16 patients with radiologic progression, and a new tumor biopsy was taken in 12 cases. In 14 patients different genetic alterations at PD compared to baseline were detected. These possible resistance mechanisms to osimertinib were divided into on-target and off-target resistance mechanisms. On-target mechanisms were observed in four patients, including three EGFR p.C797S mutations. In addition, 21 off target mutations were observed in 11 patients. In three patients, the tumor transformed to a small-cell lung cancer, all having a TP53 and PIK3CA mutation at PD. Loss of EGFR p.T790M mutation was observed in nine patients, including all patients with a transformation to small-cell lung cancer. Other emerging mutations were BRAF p.V600E, CDKN2A homozygous deletions, MET amplifications, and PTEN mutations. In two patients, the resistance mutation was detected in plasma, as tissue was not available (EGFR p.C797S and BRAF p.V600E). An extra mutation was detected in two cases, which were not found in tissue (PIK3CA mutation and a BRAF mutation). In another patient, a PIK3CA mutation was detected in both plasma and tissue.

2.5. Plasma Conversion

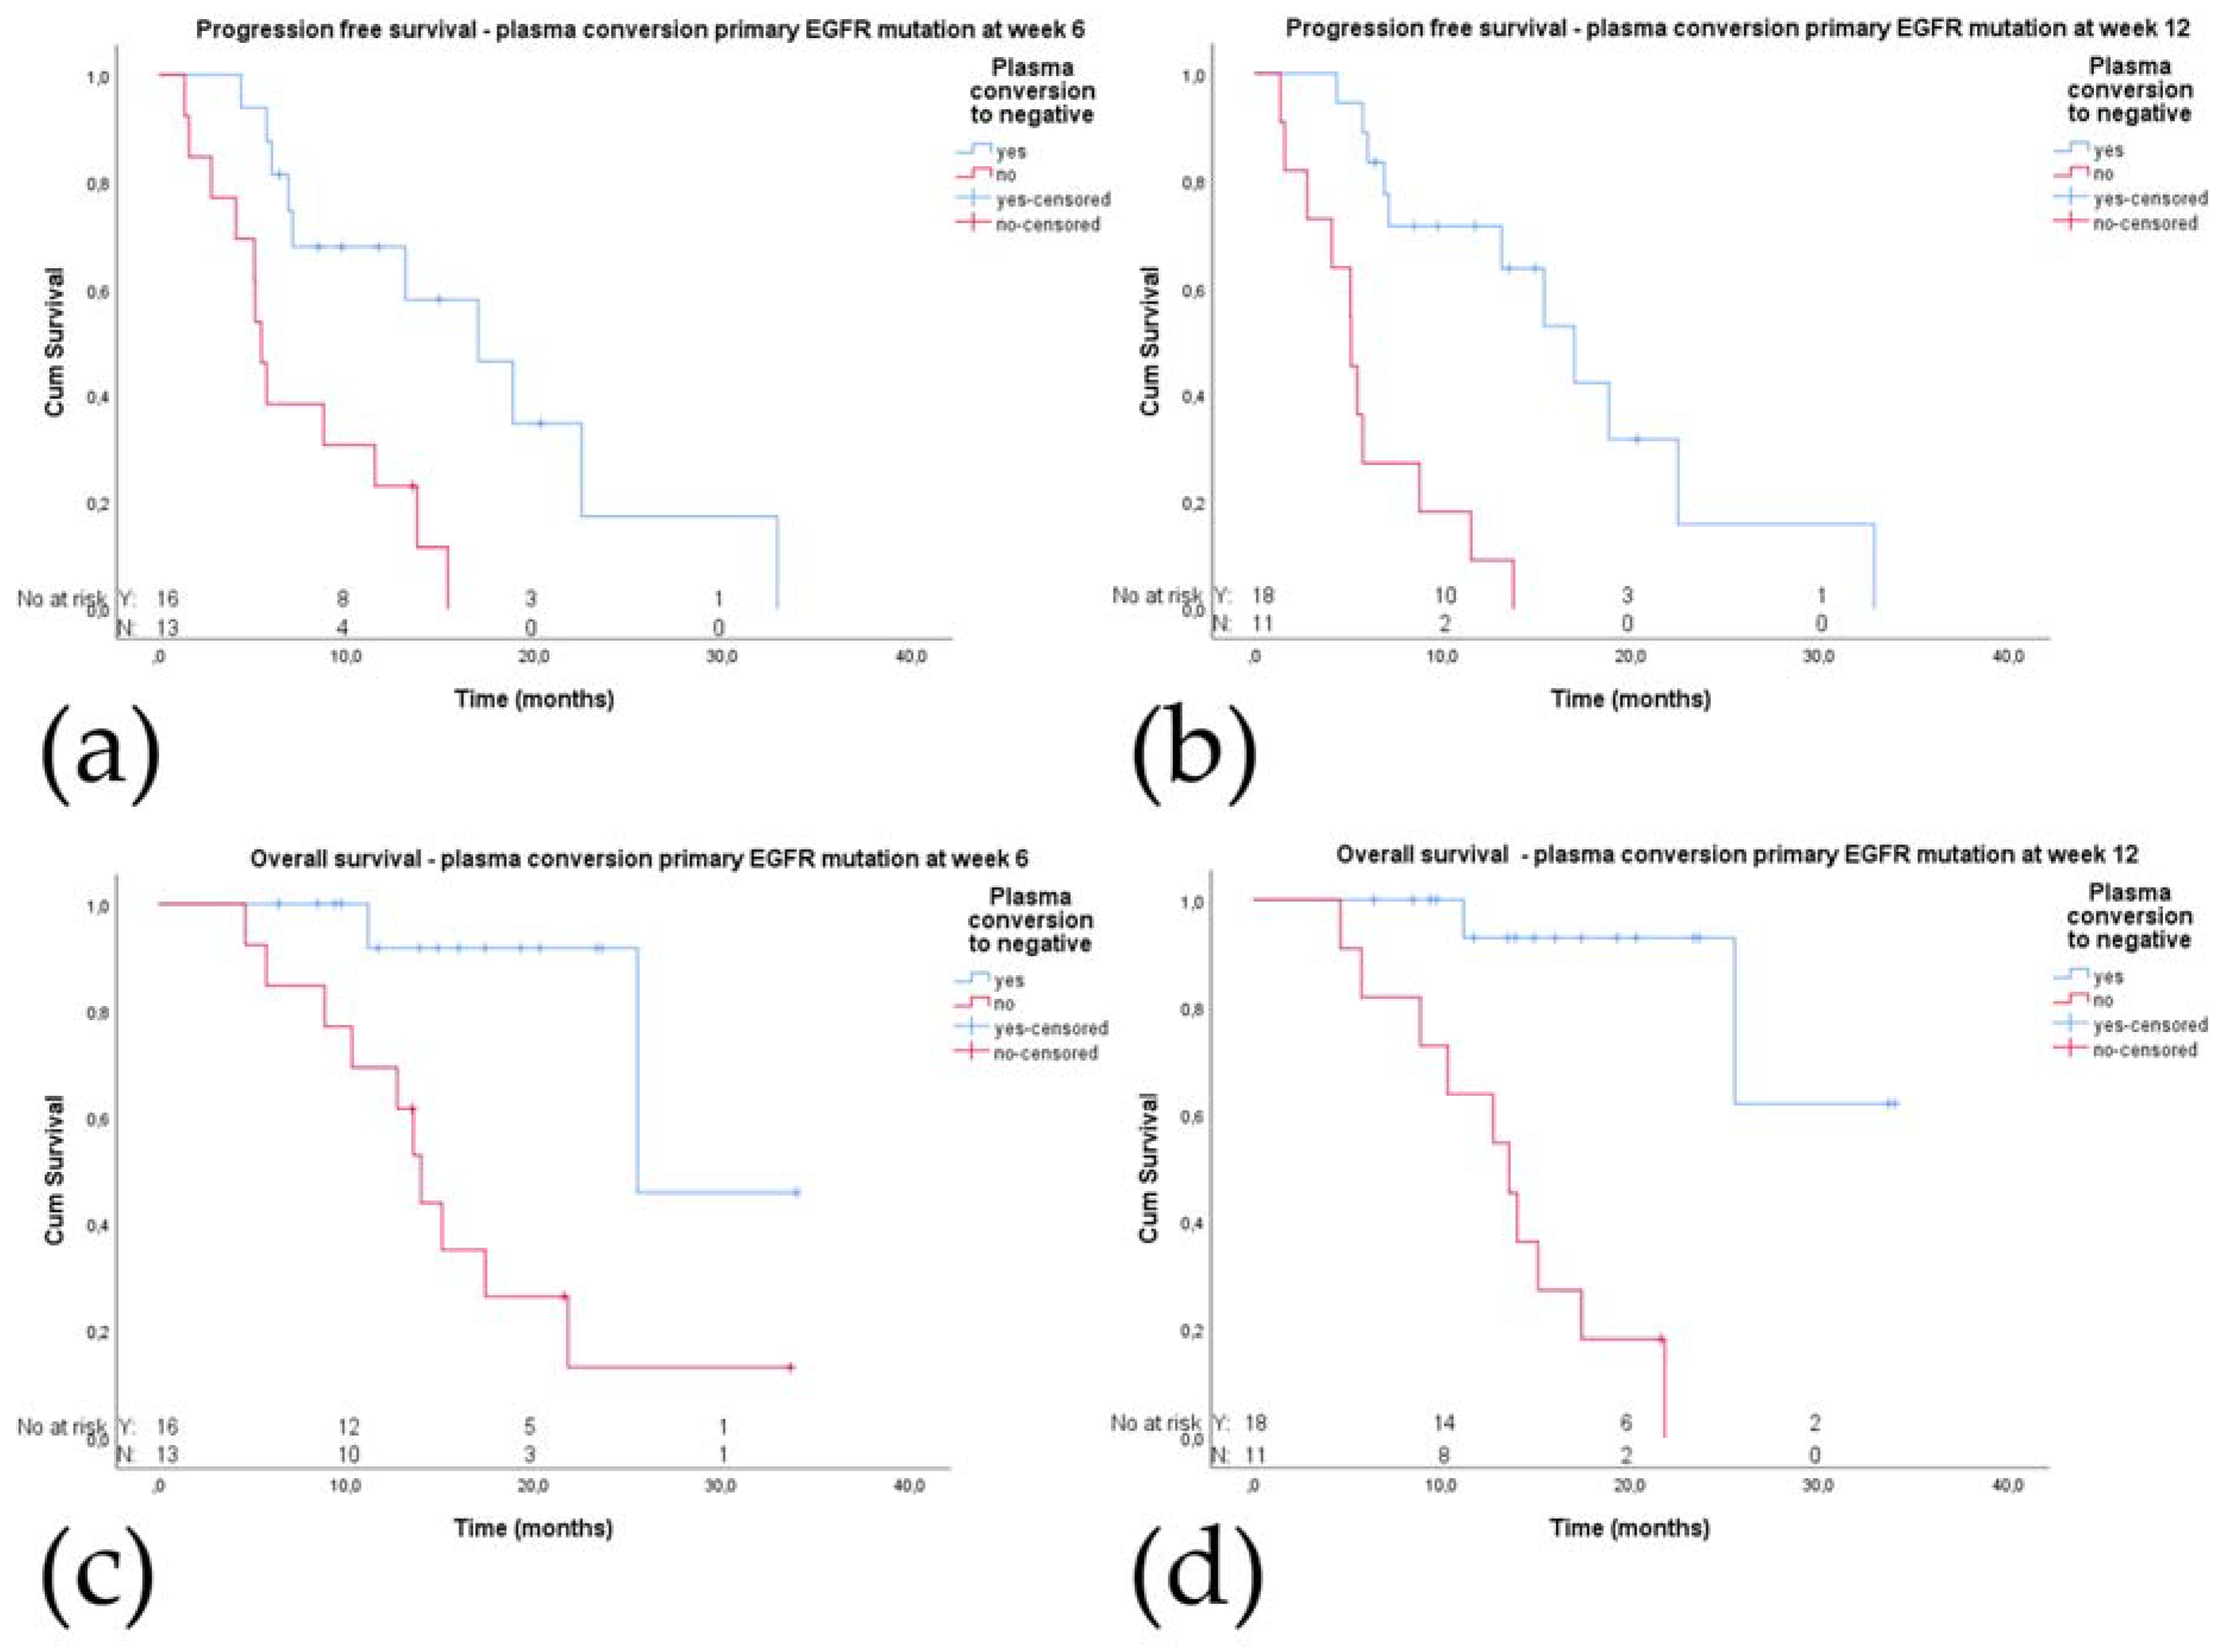
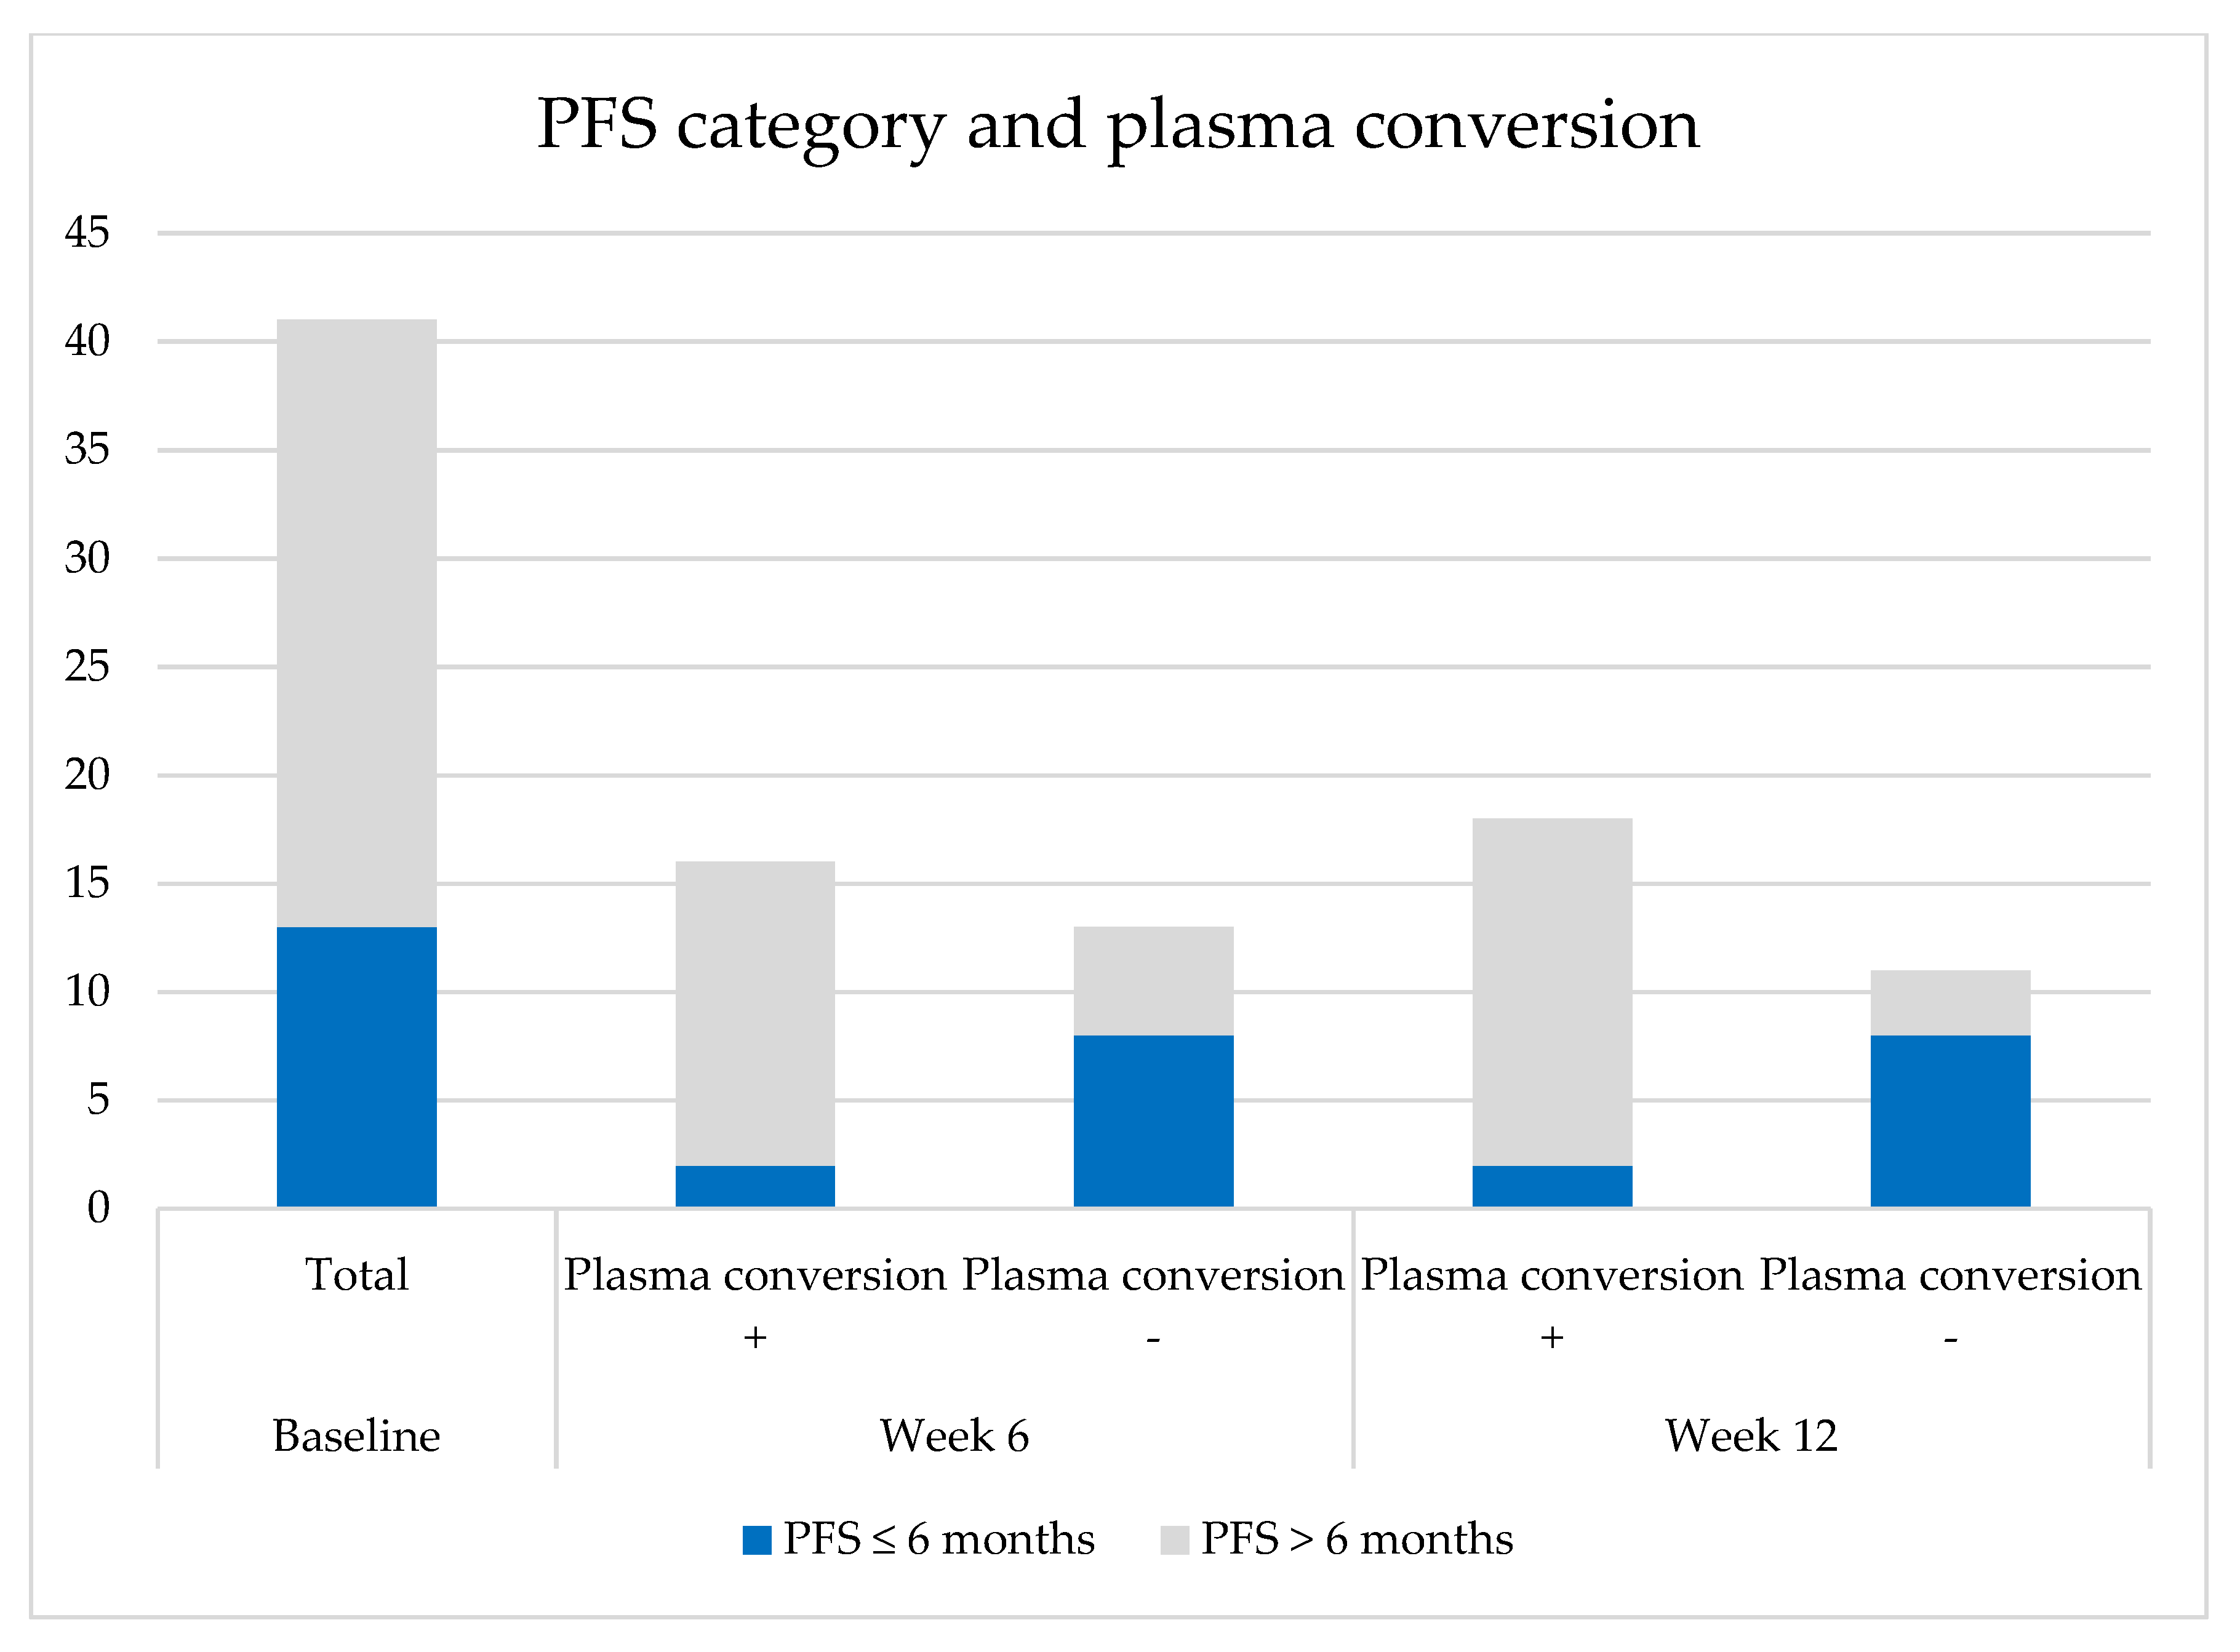
2.5.1. Plasma Conversion to cfDNA Negative for the Primary EGFR Mutation

Plasma conversion status was evaluable in 29 patients at week 6 and 12 after start of treatment. Sixteen and 18 patients had complete plasma conversion at week 6 and 12 respectively. Patients with complete plasma conversion had a significantly longer PFS compared to patients without complete plasma conversion at either week 6 (17.0 (95% CI 9.7–24.2) vs. 5.5 (95% CI 4.7–6.2) months, p = 0.002; Figure 1a), and week 12 (17.0 (95% CI 11.7–22.3) vs. 5.1 (95% CI 3.7–6.6) months, p < 0.001; Figure 1b). Illustrative, both patients who reached complete plasma conversion at week 12 already had an almost complete conversion of the primary EGFR mutation at week 6 (−80 and −97% respectively). These significant differences in PFS in patients with complete plasma conversion were also present in separate analyses of the treatment cohorts, see Supplementary Data Table S2.
In addition, OS was significantly longer in patients with plasma conversion at week 6 compared to patients with continuous detection of the primary EGFR mutation (25.5 (95% CI could not be calculated) vs. 14.0 (95% CI 12.0–16.0) months, p = 0.003). This difference in OS was also present at week 12 (NR vs. 13.6 (95% CI 9.6–17.5) months, p < 0.001; Figure 1c,d).
Twelve (75%) of the patients with complete plasma conversion at week 6 had a partial response (PR) and four (25%) had stable disease (SD) as best radiologic response. In the case of a lack of complete plasma conversion, only five patients (39%) had a PR, six (46%) had SD, and two (15%) PD as best response (chi square p = 0.064). The share of patients with a short and long PFS in relation to plasma conversion is depicted in Figure 2.

2.5.2. Plasma Conversion to cfDNA Negative for the EGFR p.T790M Mutation

In the second line cohort (osimertinib), EGFR p.T790M was evaluated in plasma. Ten patients without plasma conversion of the primary mutation, but with loss of EGFR p.T790M in plasma at week 6 had a significant shorter PFS of 5.1 months (95% CI 4.6–5.7) compared to 11 patients with plasma conversion for both the primary EGFR and the p.T790M mutation with a PFS of 18.8 months (95% CI 7.5–30.1, p = 0.012), see Supplementary Data Figure S5.

2.5.3. Plasma Mutation Levels during Treatment

There was no correlation between baseline and progression levels of the primary EGFR mutation (i.e., variant allele frequency) or cfDNA concentrations in plasma. In most patients in the second line cohort, there was no detectable EGFR p.T790M at progression in contrast to baseline, while the primary EGFR mutation was detectable in the majority of patients, see Supplementary Data Figure S6. The allele fraction of the primary EGFR mutation was widely variable among patients with and without plasma conversion, as shown in Figure 3.

2.6. Short Responders

Thirteen patients (32%) met the definition of being a short responder (PFS < 6 months). This group included relatively fewer patients with an exon 19 primary EGFR mutation (7 cases, 54%) than in the group with a response of more than 6 months (21 out of 28 cases, 75%, NS). The 2 current smokers at presentation were both short responders, of the 15 never smokers only 2 (13%) were short responders (chi square p = 0.022). Of the patients with evaluable plasma and tissue samples (n = 33), all short responders had a TP53 mutation at baseline compared to 58% in the groups with a PFS of more than 6 months (chi square p = 0.032). Of the five patients with three other concomitant mutations, besides EGFR mutations, three (60%) were short responders, while eleven of the 15 patients without other concomitant mutations (73%) had a response >6 months (NS). Of the patients evaluable for PFS category and plasma conversion at week 6 (n = 29), only two patients (13%) reached complete plasma conversion among the short responders, opposite to 88% for patients with PFS > 6 months (chi square p = 0.009). The two short responders who did reach complete plasma conversion were a patient with cerebral oligoprogression on erlotinib, and a patient with SCLC transformation during osimertinib as second line treatment.

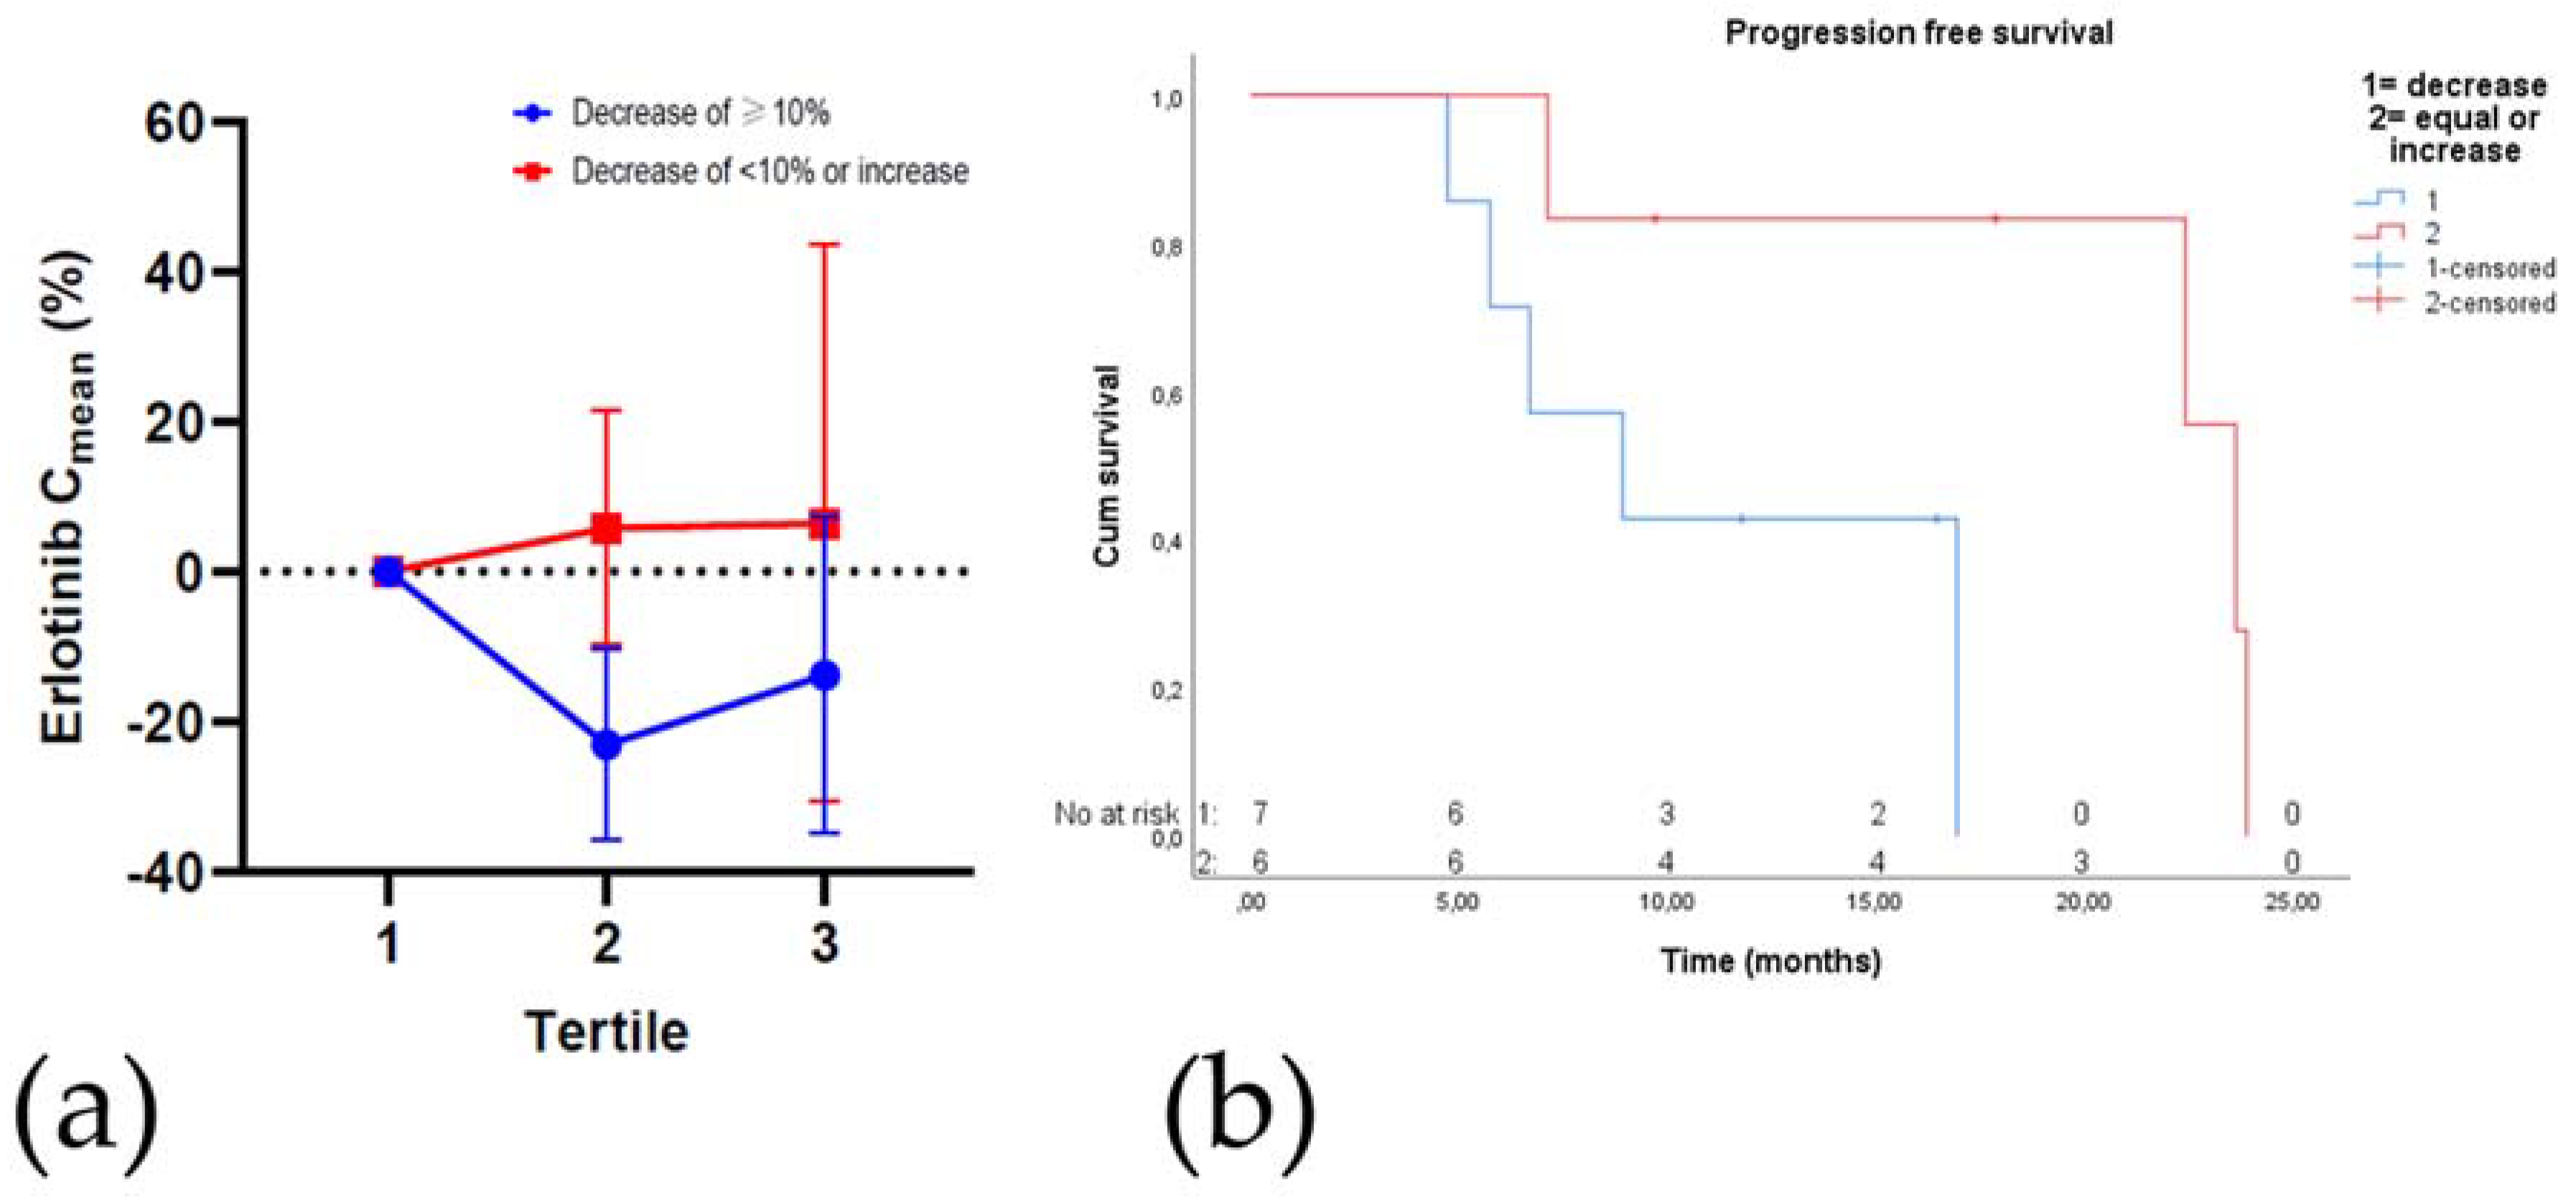
2.7. Plasma Drug Concentrations

In 15 patients treated with erlotinib and 22 treated with osimertinib, a total of 258 samples were drawn for pharmacokinetic analysis. Interestingly, a decrease in erlotinib Cmean in the second tertile was correlated with a significantly shorter PFS (median PFS 8.9 (95% CI 3.2–14.6) vs. 23.6 (21.7–25.6) months; n = 13; log-rank p = 0.037), see Figure 4. Additionally, patients treated with erlotinib who experienced a decreased Cmean two months prior to PD, compared to Cmean until six weeks after treatment initiation, had a significantly lower PFS (4.7 (95% CI could not be calculated) vs. 7.1 (95% CI 6.4–7.8) months; n = 5; p = 0.039). The average time to second tertile in patients with a decreased Cmean was 20 weeks. Notably, patients treated with erlotinib in whom the Cmean decreased in the second tertile compared to the first tertile of treatment, had a significantly shorter time until severe toxicity occurred (median 11.8 (95% CI 10.6–12.9) vs. 23.9 (95% CI could not be calculated) months; n = 13; p = 0.031). Dose reductions were, although non-significant, more frequent in this group with decreased Cmean (67% vs. 29%; p = 0.17).
Median Cmean during treatment was 1085 ng/mL for erlotinib and 190 ng/mL for osimertinib. Table 4 presents an overview of the results of the Kaplan-Meier analysis with the log-rank test to correlate (changes in) Cmean during treatment with PFS. The correlations with erlotinib and PFS were not seen in patients treated with osimertinib (all log rank p > 0.05; Table 4).

Toxicity

All reported TKI-related toxicities are presented in Table 5. Fourteen patients experienced severe toxicity; four (15%) occurred in the osimertinib-treated patients, and ten (56%) in the erlotinib-treated patients.
The occurrence of severe toxicity was not correlated with Cmean divided by median for either drug (Table 4). However, all patients who experienced osimertinib-related severe toxicity had a Cmean above the median Cmean (33 vs. 0%, chi square p = 0.062).

2.8. Brain Metastasis

At start of treatment, in the first line cohort, the one patient on gefitinib did not have CNS disease, but three patients (17%, n = 18) treated with erlotinib and five patients (19%, n = 27) in the second line cohort had intracerebral metastasis. There was no significant difference in TP53 mutational status in patients with or without baseline intracerebral metastasis (p = 0.399). Six patients were evaluable for plasma conversion status, and all six had undetectable primary mutation after 6 weeks of treatment vs. 46% who had no CNS disease at start (chi square p = 0.017). If patients had CNS disease at baseline, those treated with erlotinib had a significantly lower PFS compared to patients without CNS disease at baseline: 6.7 (95% CI 5.2–8.2) vs. 17.0 (95% CI 5.2–28.2) months, n = 18; p = 0.032.
From the eight patients with CNS disease at start of treatment, one in each treatment line had intracerebral PD. In total three patients in each cohort had (new) intracerebral disease as site of progression (17% and 11% for erlotinib and osimertinib respectively; chi square p = 0.591). Comparing the patients with and without CNS as site of PD, mean TKI concentrations in plasma did not significantly differ for neither erlotinib (1390 vs. 1016 ng/mL; p = 0.461) nor osimertinib (206 vs. 188 ng/mL; p = 0.321). There was no significant difference in presence of TP53 mutations at baseline or Cmean in the patients with or without CNS progressive disease (see Supplementary Data Table S3). Five of the six patients with CNS PD (83%) had concomitant TP53 mutations at baseline vs. 68% who had no or stable CNS disease (chi square p = 0.118). In four patients the primary mutation was detectable in plasma at baseline, but all converted to undetectable after 6 weeks (100% vs. 50%; chi square p = 0.060).

2.9. Multivariate Analysis

Multivariate analysis with Cox regression was performed for complete plasma conversion of the primary EGFR mutation at week 6 and presence of the TP53 mutation at baseline. In the total cohort, complete plasma conversion was significantly correlated with PFS; HR 0.23, 95% CI 0.07–0.77, p = 0.017. However, TP53 was not significantly correlated with PFS; HR 2.71, 95% CI 0.72–10.23, p = 0.143.

3. Discussion

The emergence of EGFR-TKIs has led to an astounding improvement in survival of patients with EGFR-mutated lung cancer. However, a minority of patients do not benefit and have no or just a short-living response. The use of liquid biopsies is promising, as it is a minimal invasive procedure, which is easily performed in clinical practice during routine outpatient clinic visits. Therefore, in this prospective study, both cfDNA and TKI drug concentrations were monitored during EGFR-TKI treatment to identify predictive markers to be used in clinical practice.
First of all, this study shows that absence of complete plasma conversion of the primary EGFR mutation at either week 6 or 12 was associated with a significantly shorter PFS and OS. This detrimental effect was demonstrated in the total EGFR cohort, as well as in the treatment cohorts. These results therefore do not only support the finding that disappearance of the primary EGFR mutation in plasma is associated with a better outcome in first line [24,25], but also confirm its predictive value in the second line for osimertinib-treated patients with EGFR p.T790M [26]. The concept of losing detectable EGFR mutations in plasma in association with better outcome was recently also demonstrated at other centers [26], but often with less sensitive techniques (e.g., Cobas®) than our NGS panel [25,27], or cross-sectional at a single time point rather than sequentially analyzed as a change in time [28,29]. In our second line cohort, isolated EGFR p.T790M loss in plasma at week 6 was associated with decreased PFS (5.1 vs. 18.8 months). This has been previously observed and may be explained by the emergence of a pre-existing resistant sub-clonal population [30,31].
Second, this study shows strong signs of the detrimental effect of a baseline concomitant TP53 mutation, despite the limited size of the study population. In patients treated with osimertinib, cases who harbored a TP53 mutation at baseline had a significantly shorter PFS than TP53 wild-type patients (8.8 vs. 18.8 months). TP53 mutations were also more common among the short responders in the total cohort. As one of the main functions of TP53 is the prevention of accumulation of genetic defects, a dysfunctional p53 could result in increased genomic instability and faster development of resistance mechanisms [32]. TP53 mutations in our cohort, as in general, do not seem to develop during treatment, for they are described to occur early in oncogenesis [33]. Worse outcome associated with EGFR-and TP53-mutated NSCLC has been well established and our findings are in line with these results [5,34]. Besides TP53 mutations, other concomitant mutations were also found. There was a relative increase in concomitant genetic aberrations between baseline and radiologic progression (more than one concomitant mutation in 27% and later 52% of samples). However, because of limited coverage of the cfDNA panel used, it was not possible to prove a relation between multiple concomitant mutations or TP53 mutational status and PFS based on plasma analysis, although this association has been previously described in tissue [5,6]. Next, the Rb1 gene, associated with SCLC histological transformation, was not covered by the NGS panel. Nevertheless, in this study the patients with SCLC transformation had a distinct mutational profile, which included TP53 and PIK3CA, already at baseline, suggesting PIK3CA might also play a role in this dedifferentiation [35].
Third, this study found evidence for a relationship between erlotinib Cmean during treatment and PFS. Patients with a decrease of Cmean of 10% or more 2 months prior to PD compared to first 6 weeks had a significantly shorter median PFS (4.7 vs. 7.1 months). This result should be interpreted with caution though, since only five patients were included in this analysis. Additionally, patients with a decrease of Cmean of 10% or more in the second tertile compared to the first tertile had an significantly lower PFS compared to patients with an equal or increased Cmean (8.9 vs. 23.6 months). This decrease could be caused by multiple factors, i.e., dose reductions due to intolerable toxicity, increase in smoking behavior, decrease in therapy adherence, or use of concomitant interacting medication [13]. The contribution of dose reductions is illustrated by a higher prevalence of dose reductions and a significant shorter median time to severe toxicity in the Cmean decreased group. Before extrapolation to clinical practice, these results should be validated in a larger cohort.
The same percentage of patients had CNS disease at start of therapy in both cohorts. However, when CNS disease progression occurred, this percentage was almost twice as high in the first line cohort compared to the second line cohort where all patients were treated with osimertinib (19% vs. 10%). These results are in line with the FLAURA study results, that conclude that patients with EGFR-mutated NSCLC and CNS disease should preferably be treated with osimertinib [3].
Additional to the advantage of being a non-invasive procedure, the difference in the number of plasma cfDNA samples vs. tissue samples at baseline (92% vs. 78%) and at progression (82% vs. 54%) in our study reflects the feasibility of blood sampling. Moreover, plasma sampling reflects the total of genomic aberrations and heterogeneity of the disease. When in the near future reliable detection of translocations and amplifications in cfDNA is possible, plasma diagnostics could replace tissue-based investigation in current daily practice in some cases.
Limitations of this work are, first the limited number of included patients which limits the power for some of the analyses. Moreover, ctDNA could not be detected in all patient samples (ctDNA detected in 31 of 38 patients). In theory, this limits the sensitivity of mutation detection in plasma. However, patients without detectable ctDNA at baseline had a lower rate of radiological progression during follow-up compared to patients with detectable ctDNA baseline. The association between detectable ctDNA at baseline and shorter PFS and OS was previously reported by Buder et al. [26]. This could be explained by a lower tumor load or intrathoracic/-cerebral localization which is associated with less shedding of cfDNA by the tumor [20,36]. Additionally, the coverage of the mutation spectrum in the Oncomine lung cfDNA panel is a limitation in the detection of the aberrations, specifically in the TP53 gene in our study. At this point, the NGS panel is more extensive for tissue than for plasma, which mostly explains the difference in detection of TP53 mutations between tissue and plasma, see Supplementary Data Table S4. Other reasons could include limited input of DNA, or absence of cfDNA in plasma, excreted by the tumor. As false negative results are an important limitation, the occurrence of “false” positive mutations derived from cfDNA is also a realistic limitation. Plasma cfDNA analysis cannot make a distinction between mutations originating from the tumor or somatic mutations from nonmalignant peripheral blood cells, known as clonal hematopoiesis [37,38]. One possibility to overcome this limitation is to concurrently sequence peripheral blood cells [37]. In our study, TP53 mutations found in plasma were matched with tissue samples. One TP53 mutation detected in plasma did not match the TP53 mutation observed in tumor tissue and was thus labeled as clonal hematopoiesis. When interpreting plasma cfDNA analysis clonal hematopoiesis should be considered in order to prevent misdiagnosis of malignancies. However, when plasma cfDNA analysis is used as a predictive and follow-up tool in EGFR-mutated NSCLC, we believe this is less relevant as mutations can be matched to tumor tissue.
This study shows multiple predictive features in plasma to identify patients with less benefit of EGFR-TKI treatment. The absence of complete plasma conversion of the primary EGFR mutation is associated with significant shorter PFS and OS, as well as EGFR p.T790M loss alone in plasma in patients treated with osimertinib in second line. Decrease of Cmean in time is also associated with shorter PFS in erlotinib treatment. The presence of TP53 mutations at baseline was associated with a shorter PFS.
After validation of these results in a larger and independent cohort, implementation to clinical practice seems practically possible when at start of EGFR-TKI treatment, cfDNA and PK samples are taken. At baseline, patients with TP53 mutations on second line osimertinib treatment could already be considered in danger of progressing early. If cfDNA levels of the primary mutation are still detectable after 6 weeks of treatment, patients are at high risk of a short PFS, which could guide the treating clinician to more close follow-up or consideration of more extensive treatment options. For erlotinib-treated patients, monitoring of plasma drug concentrations is feasible. When either a 10% or more decrease in erlotinib Cmean occurs after 20 weeks, or when treatment conditions change (for example when Cmean decreases because a dose reduction is necessary) this could indicate to a shorter PFS as well. Altogether, the treating physician could use plasma predictive features to consider if closer follow-up or more extensive treatment might be necessary to personalize treatment of patients with EGFR-mutated NSCLC.

4. Materials and Methods

The START-TKI study is a prospective, observational multicenter study in which additional blood samples are drawn to standard outpatient visits in patients treated with a TKI for driver mutation driven NSCLC. The study was approved by the medical ethical committee of the Erasmus MC, Rotterdam, The Netherlands (MEC 16-643), and initiated at two sites; Erasmus MC, Rotterdam and Amphia hospital, Breda, The Netherlands. Written informed consent was obtained from all patients prior to study enrollment.

4.1. Study Population

Patients were eligible for the EGFR cohort when harboring an activating EGFR mutation for which first or second line EGFR-TKI treatment was initiated.

4.2. Blood Collection and Processing

Blood samples were collected at baseline, prior to start of EGFR-TKI, and at every outpatient clinic visit following standard of care (i.e., every six weeks) until progressive disease (PD) or end of treatment due to toxicity. For cfDNA isolation, two Cellsave preservative 10mL vacutainer tubes (CellSearch, Menarini Silicon Biosystems, Castel Maggiore, Italy) were drawn. The cfDNA handling has been previously described [39]. Additionally, a 4.0 mL lithium-heparin tube was taken for pharmacokinetic analysis.

4.2.1. Next Generation Sequencing (NGS)

NGS was performed at baseline, at week 6 and 12 and at PD on isolated cfDNA from plasma and tissue if available [39,40]. NGS was performed by semiconductor sequencing with the Ion S5 System (Thermo Fisher Scientific) with the supplier’s materials and protocol. Libraries from tissue DNA were prepared with a custom-made primer panel. cfDNA library preparation was performed using the Oncomine Lung cfDNA Assay v1 (Thermo Fisher Scientific), coverage is available in the Supplementary Data Table S5. Standard depth of sequencing was 25.000× on average. Our NGS process including the customized tissue panel has been described in more detail earlier [39,40]. NGS on tumor tissue at diagnosis was done as part of routine clinical care.

4.2.2. Plasma Drug Concentrations

Patients were asked to delay the intake of TKI tablet until after blood withdrawal. All samples were analyzed with validated liquid chromatography-tandem mass spectrometric assays [41,42]. Additionally, samples from patients included in this study who also participated in a previous pharmacokinetic study with erlotinib were integrated [43]. Time between last intake and blood withdrawal was calculated with the patient reporting time of last intake. Concentrations from samples collected after the label’s time to reach maximum concentration (Tmax; c.q. 4 h for erlotinib and 6 h for osimertinib) were extrapolated to the trough concentration at 24 h (C24 h) after drug intake with the following equation:
C 24   h = C sample e (   T to   24 h     24     0.693 T half )
C24 h data for each patient were used to calculate the mean plasma concentration (Cmean). The Cmean of total treatment duration was analyzed with Cox regression to study the relation between drug exposure and PFS. The Cmean for the first six weeks of treatment and two months before PD were calculated. Hypothetically, a decrease in Cmean during treatment would be an explanation for PD. To further investigate whether changes in Cmean could have an influence on PFS, Cmean was calculated for every third of total treatment duration per patient (i.e., tertiles). Changes in Cmean during treatment were subtracted from these data. To compare the forthcoming changes in Cmean between tertiles, two groups have to be defined; one in which Cmean decreases and one in which no change or even increase in Cmean occurs. Additionally, Cmean was calculated for time until the occurrence of severe toxicity.

4.3. Toxicity

Toxicity was scored by the treating physician according to the Common Terminology Criteria for Adverse Events (CTCAE) grading system version 4.03 [44]. Severe toxicity was defined as CTCAE grade ≥ 3 or hospital admission, dose reduction, and treatment discontinuation or stop because of TKI-related toxicity.

4.4. Brain Metastasis

Patients who had CNS metastasis at baseline and at PD were identified. Mean TKI concentrations were compared for CNS metastasis at PD. Also the presence of TP53 mutations and complete plasma conversions was compared between patients with and without CNS metastasis.

4.5. Objectives

Main objectives were exploration of the predictive value of the presence of concomitant mutations in cfDNA at baseline and TKI plasma trough concentrations (Cmin) during treatment for PFS. In addition, the associations between change in plasma mutation levels over time and PFS and OS were analyzed. Plasma and tissue mutations were analyzed and compared between different time points.
Additionally, the correlation between TKI plasma trough concentration and occurrence of severe toxicity and the relationship between brain metastasis and pharmacokinetic parameters was explored.

4.6. Statistical Analysis

PFS was defined as time from start TKI until radiologic progression or death, OS as time from start TKI until death. Short responders were defined as a PFS < 6 months. We defined plasma conversion as the shift from detectable to undetectable mutation status in plasma. Patients who were enrolled twice (both in first and second line treatment) were included for separate analyses in treatment cohorts (1st line cohort and 2nd line cohort). For analysis of the total population, from these patients only data from the second line cohort were used.
The relationship between PFS and presence of concomitant mutations, TP53 mutations specifically, plasma mutation conversion and changes in Cmean was explored by the log-rank test on Kaplan Meier survival analysis. Kaplan Meier analysis was used for estimation of median survival times and 95% confidence intervals. In case of a limited number of events at data cut off the 95% confidence interval could not be calculated. Differences between groups were compared with Pearson chi-square tests (i.e., for prevalences) or the T-test (i.e., for mean concentrations). To correlate the influence of multiple variables on PFS, Cox regression was performed on the variables that were significantly (p < 0.05) correlated with PFS in univariate analysis in the total EGFR cohort. IBM SPSS Statistics version 25 was used for all analyses.

5. Conclusions

Not all patients treated with EGFR-TKIs benefit from a durable response, but predictive markers to identify these short responders are lacking. This prospective blood-based biomarker study, START-TKI, in EGFR-mutated NSCLC patients reports poor predictive markers based on cfDNA and TKI drug concentrations during EGFR-TKI treatment which have potential to be used in clinical practice in the future. Absence of complete plasma conversion of the primary EGFR mutation at week 6 and 12 was correlated with significantly shorter PFS and OS. Concomitant TP53 mutations at baseline also showed signs of detrimental outcome. Patients treated with erlotinib who had a decrease in mean plasma drug concentration of 10% or more during treatment had worse PFS, but in a small cohort. Validation in a larger cohort is preferred. Implementation of these plasma predictive features could aid a physician to consider for which EGFR-TKI-treated patients closer follow up or more extensive treatment might be necessary.

Supplementary Materials

The following are available online at https://www.mdpi.com/2072-6694/12/11/3179/s1. Table S1: Causes of death events in cases without radiologic progression. Table S2: PFS and plasma conversion at week 6 and 12 in treatment cohorts. Table S3: Cmean in patients with CNS progressive disease. Table S4: Coverage discrepancies of the detected mutations in our study. Table S5: Coverage of the Oncomine Lung cfDNA assay v1. Figure S1: PFS in the total EGFR cohort according to treatment line. Figure S2: PFS in presence or absence of detectable ctDNA. Figure S3: PFS in patients with concomitant mutations. Figure S4: PFS and TP53 mutational status. Figure S5: PFS and plasma conversion in the second line cohort. Figure S6: Plasma mutation levels in the second line cohort.

Author Contributions

Conceptualization, C.M.J.S., G.D.M.V., M.A.P., E.O.-d.H., S.L.W.K., R.H.N.v.S., R.H.J.M., J.G.J.V.A., H.J.D., and A.-M.C.D.; data curation, C.M.J.S., G.D.M.V., M.A.P., P.A., R.H.N.v.S., J.G.J.V.A., H.J.D., and A.-M.C.D.; formal analysis, C.M.J.S., G.D.M.V., M.A.P., E.O.-d.H., H.J.D., and A.-M.C.D.; funding acquisition, W.N.M.D., R.H.N.v.S., R.H.J.M., J.G.J.V.A., H.J.D., and A.-M.C.D.; investigation, C.M.J.S., G.D.M.V., P.A., M.S.P., C.v.d.L., J.H.v.d.T., D.C.Y.Y., S.L.W.K., R.H.N.v.S., R.H.J.M., H.J.D., and A.-M.C.D.; methodology, C.M.J.S., G.D.M.V., M.A.P., E.O.-d.H., S.L.W.K., H.J.D., and A.-M.C.D.; project administration, C.M.J.S., G.D.M.V., R.H.N.v.S., R.H.J.M., J.G.J.V.A., H.J.D., and A.-M.C.D.; resources, D.C.Y.Y., W.N.M.D., R.H.N.v.S., R.H.J.M., J.G.J.V.A., H.J.D., and A.-M.C.D.; supervision, R.H.J.M., J.G.J.V.A., H.J.D., and A.-M.C.D.; visualization, C.M.J.S., G.D.M.V., M.A.P., H.J.D., and A.-M.C.D.; writing—original draft, C.M.J.S., G.D.M.V., and M.A.P.; writing—review and editing, C.M.J.S., G.D.M.V., M.A.P., P.A., M.S.P., C.v.d.L., J.H.v.d.T., D.C.Y.Y., S.L.W.K., W.N.M.D., R.H.N.v.S., R.H.J.M., J.G.J.V.A., H.J.D., and A.-M.C.D. All authors have read and agreed to the published version of the manuscript.

Funding

This research was partly funded by unrestricted grants from AstraZeneca, grant number PO 2604226313 and 2604937054.

Conflicts of Interest

The funders had no role in the design of the study; in the collection, analyses, or interpretation of data; in the writing of the manuscript, or in the decision to publish the results. C.S. reports financial activities outside the submitted work: advisory board Boehringer Ingelheim, travel and symposia expenses from Roche, Lilly. C.L. reports financial activities outside the submitted work: BMS, Boeringer Ingelheim, MSD, Roche, Abbvie, AstraZeneca. S.K. reports financial activities outside the submitted work: lecture for Roche. W.D. reports financial activities outside the submitted work: Speakers and advisory honoraria from Roche, Bristol-Myers Squibb, Amgen, Bayer, AstraZeneca, Novartis. R.M. reports financial activities outside the submitted work: grants from The Dutch Cancer Society (KWF), Astellas, Bayer, Boehringer-Ingelheim, Cristal Therapeutics, Pamgene (and other), Pfizer, Prostakan, Novartis (and personal fees), Roche, Servier (and personal fees). J.A. reports financial activities outside the submitted work: MSD, BMS, Boehringer Ingelheim, Amphera, Eli-Lilly, Takeda, Bayer, Roche, AstraZeneca. Intellectual property: licensed patent on allogenic tumor cell lysate, pending patent on combination imunotherapy in cancer and biomarker for immunotherapy. H.D. reports grants, personal fees and non-financial support from AstraZeneca with regard to the Work Under Consideration for Publication and personal fees from AbbVie, Janssen, Pfizer, Lilly, PGDx, MSD outside the submitted work. A.D. reports financial activities outside the submitted work: Attended advisory boards and/or provided lectures for: Roche, Eli Lilly, Boehringer Ingelheim, Astra Zeneca, Pfizer, BMS, Amgen, Novartis, MSD, Takeda, Pharmamar. Received research support from BMS, AbbVie, Amgen. M.V., M.P., P.A., M.P., J.T., D.Y., E.O., and R.S. declare no conflict of interest.

References

  1. Bray, F.; Ferlay, J.; Soerjomataram, I.; Siegel, R.L.; Torre, L.A.; Jemal, A. Global cancer statistics 2018: Globocan estimates of incidence and mortality worldwide for 36 cancers in 185 countries. CA A Cancer J. Clin. 2018, 68, 394–424. [Google Scholar] [CrossRef] [PubMed] [Green Version]
  2. Ramalingam, S.S.; Vansteenkiste, J.; Planchard, D.; Cho, B.C.; Gray, J.E.; Ohe, Y.; Zhou, C.; Reungwetwattana, T.; Cheng, Y.; Chewaskulyong, B.; et al. Overall survival with osimertinib in untreated, EGFR-mutated advanced NSCLC. N. Engl. J. Med. 2020, 382, 41–50. [Google Scholar] [CrossRef] [PubMed]
  3. Soria, J.C.; Ohe, Y.; Vansteenkiste, J.; Reungwetwattana, T.; Chewaskulyong, B.; Lee, K.H.; Dechaphunkul, A.; Imamura, F.; Nogami, N.; Kurata, T.; et al. Osimertinib in untreated EGFR-mutated advanced non-small-cell lung cancer. N. Engl. J. Med. 2018, 378, 113–125. [Google Scholar] [CrossRef]
  4. Hsu, W.H.; Yang, J.C.; Mok, T.S.; Loong, H.H. Overview of current systemic management of EGFR-mutant NSCLC. Ann. Oncol. 2018, 29, i3–i9. [Google Scholar] [CrossRef]
  5. Kim, Y.; Lee, B.; Shim, J.H.; Lee, S.H.; Park, W.Y.; Choi, Y.L.; Sun, J.M.; Ahn, J.S.; Ahn, M.J.; Park, K. Concurrent genetic alterations predict the progression to target therapy in EGFR-mutated advanced NSCLC. J. Thorac. Oncol. 2019, 14, 193–202. [Google Scholar] [CrossRef] [PubMed] [Green Version]
  6. Chang, S.C.; Lai, Y.C.; Chang, C.Y.; Huang, L.K.; Chen, S.J.; Tan, K.T.; Yu, P.N.; Lai, J.I. Concomitant genetic alterations are associated with worse clinical outcome in EGFR mutant NSCLC patients treated with tyrosine kinase inhibitors. Transl. Oncol. 2019, 12, 1425–1431. [Google Scholar] [CrossRef]
  7. Jiao, X.D.; Qin, B.D.; You, P.; Cai, J.; Zang, Y.S. The prognostic value of tp53 and its correlation with EGFR mutation in advanced non-small cell lung cancer, an analysis based on cbioportal data base. Lung Cancer 2018, 123, 70–75. [Google Scholar] [CrossRef] [PubMed]
  8. Canale, M.; Petracci, E.; Delmonte, A.; Chiadini, E.; Dazzi, C.; Papi, M.; Capelli, L.; Casanova, C.; De Luigi, N.; Mariotti, M.; et al. Impact of TP53 mutations on outcome in EGFR-mutated patients treated with first-line tyrosine kinase inhibitors. Clin. Cancer Res. 2017, 23, 2195–2202. [Google Scholar] [CrossRef] [Green Version]
  9. Labbe, C.; Cabanero, M.; Korpanty, G.J.; Tomasini, P.; Doherty, M.K.; Mascaux, C.; Jao, K.; Pitcher, B.; Wang, R.; Pintilie, M.; et al. Prognostic and predictive effects of tp53 co-mutation in patients with EGFR-mutated non-small cell lung cancer (NSCLC). Lung Cancer 2017, 111, 23–29. [Google Scholar] [CrossRef]
  10. Hou, H.; Qin, K.; Liang, Y.; Zhang, C.; Liu, D.; Jiang, H.; Liu, K.; Zhu, J.; Lv, H.; Li, T.; et al. Concurrent tp53 mutations predict poor outcomes of EGFR-tki treatments in chinese patients with advanced NSCLC. Cancer Manag. Res. 2019, 11, 5665–5675. [Google Scholar] [CrossRef] [Green Version]
  11. Verheijen, R.B.; Yu, H.; Schellens, J.H.M.; Beijnen, J.H.; Steeghs, N.; Huitema, A.D.R. Practical recommendations for therapeutic drug monitoring of kinase inhibitors in oncology. Clin. Pharmacol. Ther. 2017, 102, 765–776. [Google Scholar] [CrossRef] [PubMed]
  12. Veerman, G.D.M.; Hussaarts, K.; Jansman, F.G.A.; Koolen, S.W.L.; van Leeuwen, R.W.F.; Mathijssen, R.H.J. Clinical implications of food-drug interactions with small-molecule kinase inhibitors. Lancet Oncol. 2020, 21, e265–e279. [Google Scholar] [CrossRef]
  13. Hussaarts, K.; Veerman, G.D.M.; Jansman, F.G.A.; van Gelder, T.; Mathijssen, R.H.J.; van Leeuwen, R.W.F. Clinically relevant drug interactions with multikinase inhibitors: A review. Ther. Adv. Med. Oncol. 2019, 11, 1758835918818347. [Google Scholar] [CrossRef]
  14. Brown, K.; Comisar, C.; Witjes, H.; Maringwa, J.; de Greef, R.; Vishwanathan, K.; Cantarini, M.; Cox, E. Population pharmacokinetics and exposure-response of osimertinib in patients with non-small cell lung cancer. Br. J. Clin. Pharmacol. 2017, 83, 1216–1226. [Google Scholar] [CrossRef] [Green Version]
  15. Hidalgo, M.; Siu, L.L.; Nemunaitis, J.; Rizzo, J.; Hammond, L.A.; Takimoto, C.; Eckhardt, S.G.; Tolcher, A.; Britten, C.D.; Denis, L.; et al. Phase i and pharmacologic study of osi-774, an epidermal growth factor receptor tyrosine kinase inhibitor, in patients with advanced solid malignancies. J. Clin. Oncol. 2001, 19, 3267–3279. [Google Scholar] [CrossRef] [PubMed]
  16. Lankheet, N.A.; Knapen, L.M.; Schellens, J.H.; Beijnen, J.H.; Steeghs, N.; Huitema, A.D. Plasma concentrations of tyrosine kinase inhibitors imatinib, erlotinib, and sunitinib in routine clinical outpatient cancer care. Ther. Drug Monit. 2014, 36, 326–334. [Google Scholar] [CrossRef] [PubMed]
  17. Lu, J.F.; Eppler, S.M.; Wolf, J.; Hamilton, M.; Rakhit, A.; Bruno, R.; Lum, B.L. Clinical pharmacokinetics of erlotinib in patients with solid tumors and exposure-safety relationship in patients with non-small cell lung cancer. Clin. Pharmacol. Ther. 2006, 80, 136–145. [Google Scholar] [CrossRef] [PubMed]
  18. Ahluwalia, M.S.; Becker, K.; Levy, B.P. Epidermal growth factor receptor tyrosine kinase inhibitors for central nervous system metastases from non-small cell lung cancer. Oncologist 2018, 23, 1199–1209. [Google Scholar] [CrossRef] [Green Version]
  19. Wu, Y.L.; Ahn, M.J.; Garassino, M.C.; Han, J.Y.; Katakami, N.; Kim, H.R.; Hodge, R.; Kaur, P.; Brown, A.P.; Ghiorghiu, D.; et al. Cns efficacy of osimertinib in patients with t790m-positive advanced non-small-cell lung cancer: Data from a randomized phase iii trial (aura3). J. Clin. Oncol. 2018, 36, 2702–2709. [Google Scholar] [CrossRef]
  20. Crowley, E.; Di Nicolantonio, F.; Loupakis, F.; Bardelli, A. Liquid biopsy: Monitoring cancer-genetics in the blood. Nat. Rev. Clin. Oncol. 2013, 10, 472–484. [Google Scholar] [CrossRef]
  21. Rolfo, C.; Mack, P.C.; Scagliotti, G.V.; Baas, P.; Barlesi, F.; Bivona, T.G.; Herbst, R.S.; Mok, T.S.; Peled, N.; Pirker, R.; et al. Liquid biopsy for advanced non-small cell lung cancer (NSCLC): A statement paper from the IASLC. J. Thorac. Oncol. 2018, 13, 1248–1268. [Google Scholar] [CrossRef] [Green Version]
  22. Dagogo-Jack, I.; Shaw, A.T. Tumour heterogeneity and resistance to cancer therapies. Nat. Rev. Clin. Oncol. 2018, 15, 81–94. [Google Scholar] [CrossRef]
  23. Oxnard, G.R.; Thress, K.S.; Alden, R.S.; Lawrance, R.; Paweletz, C.P.; Cantarini, M.; Yang, J.C.; Barrett, J.C.; Jänne, P.A. Association between plasma genotyping and outcomes of treatment with osimertinib (azd9291) in advanced non-small-cell lung cancer. J. Clin. Oncol. 2016, 34, 3375–3382. [Google Scholar] [CrossRef] [Green Version]
  24. Akamatsu, H.; Koh, Y.; Okamoto, I.; Fujimoto, D.; Bessho, A.; Azuma, K.; Morita, S.; Yamamoto, N.; Nakagawa, K. Clinical significance of monitoring EGFR mutation in plasma using multiplexed digital pcr in EGFR mutated patients treated with afatinib (west japan oncology group 8114LTR study). Lung Cancer 2019, 131, 128–133. [Google Scholar] [CrossRef] [Green Version]
  25. Ebert, E.B.F.; McCulloch, T.; Hansen, K.H.; Linnet, H.; Sorensen, B.; Meldgaard, P. Clearing of circulating tumour DNA predicts clinical response to first line tyrosine kinase inhibitors in advanced epidermal growth factor receptor mutated non-small cell lung cancer. Lung Cancer 2020, 141, 37–43. [Google Scholar] [CrossRef]
  26. Buder, A.; Hochmair, M.J.; Setinek, U.; Pirker, R.; Filipits, M. EGFR mutation tracking predicts survival in advanced EGFR-mutated non-small cell lung cancer patients treated with osimertinib. Transl. Lung Cancer Res. 2020, 9, 239–245. [Google Scholar] [CrossRef]
  27. Buttitta, F.; Felicioni, L.; Lorito, A.D.; Cortellini, A.; Irtelli, L.; Brocco, D.; Marino, P.D.; Traisci, D.; D’Ostilio, N.; Paolo, A.D.; et al. Early prediction of resistance to tyrosine kinase inhibitors by plasma monitoring of EGFR mutations in NSCLC: A new algorithm for patient selection and personalized treatment. Oncotarget 2020, 11, 982–991. [Google Scholar] [CrossRef] [PubMed]
  28. O’Kane, G.M.; Liu, G.; Stockley, T.L.; Shabir, M.; Zhang, T.; Law, J.H.; Le, L.W.; Sacher, A.; Shepherd, F.A.; Bradbury, P.A.; et al. The presence and variant allele fraction of EGFR mutations in ctdna and development of resistance. Lung Cancer 2019, 131, 86–89. [Google Scholar] [CrossRef]
  29. Romero, A.; Serna-Blasco, R.; Alfaro, C.; Sánchez-Herrero, E.; Barquín, M.; Turpin, M.C.; Chico, S.; Sanz-Moreno, S.; Rodrigez-Festa, A.; Laza-Briviesca, R.; et al. Ctdna analysis reveals different molecular patterns upon disease progression in patients treated with osimertinib. Transl. Lung Cancer Res. 2020, 9, 532–540. [Google Scholar] [CrossRef]
  30. Oxnard, G.R.; Hu, Y.; Mileham, K.F.; Husain, H.; Costa, D.B.; Tracy, P.; Feeney, N.; Sholl, L.M.; Dahlberg, S.E.; Redig, A.J.; et al. Assessment of resistance mechanisms and clinical implications in patients with EGFR t790m-positive lung cancer and acquired resistance to osimertinib. JAMA Oncol. 2018, 4, 1527–1534. [Google Scholar] [CrossRef] [PubMed] [Green Version]
  31. Zhao, S.; Li, X.; Zhao, C.; Jiang, T.; Jia, Y.; Shi, J.; He, Y.; Li, J.; Zhou, F.; Gao, G.; et al. Loss of t790m mutation is associated with early progression to osimertinib in chinese patients with advanced NSCLC who are harboring EGFR t790m. Lung Cancer 2019, 128, 33–39. [Google Scholar] [CrossRef] [PubMed]
  32. Muller, P.A.; Vousden, K.H. P53 mutations in cancer. Nat. Cell Biol. 2013, 15, 2–8. [Google Scholar] [CrossRef] [PubMed]
  33. Rivlin, N.; Brosh, R.; Oren, M.; Rotter, V. Mutations in the p53 tumor suppressor gene: Important milestones at the various steps of tumorigenesis. Genes Cancer 2011, 2, 466–474. [Google Scholar] [CrossRef] [Green Version]
  34. Aggarwal, C.; Davis, C.W.; Mick, R.; Thompson, J.C.; Ahmed, S.; Jeffries, S.; Bagley, S.; Gabriel, P.; Evans, T.L.; Bauml, J.M.; et al. Influence of tp53 mutation on survival in patients with advanced EGFR-mutant non-small-cell lung cancer. JCO Precis. Oncol. 2018, 2018. [Google Scholar] [CrossRef]
  35. Lu, H.Y.; Qin, J.; Han, N.; Lei, L.; Xie, F.; Li, C. EGFR, KRAS, BRAF, PTEN, and PIK3CA mutation in plasma of small cell lung cancer patients. OncoTargets Ther. 2018, 11, 2217–2226. [Google Scholar] [CrossRef] [Green Version]
  36. Seki, Y.; Fujiwara, Y.; Kohno, T.; Yoshida, K.; Goto, Y.; Horinouchi, H.; Kanda, S.; Nokihara, H.; Yamamoto, N.; Kuwano, K.; et al. Circulating cell-free plasma tumour DNA shows a higher incidence of EGFR mutations in patients with extrathoracic disease progression. ESMO Open 2018, 3, e000292. [Google Scholar] [CrossRef] [Green Version]
  37. Hu, Y.; Ulrich, B.C.; Supplee, J.; Kuang, Y.; Lizotte, P.H.; Feeney, N.B.; Guibert, N.M.; Awad, M.M.; Wong, K.K.; Jänne, P.A.; et al. False-positive plasma genotyping due to clonal hematopoiesis. Clin. Cancer Res. 2018, 24, 4437–4443. [Google Scholar] [CrossRef] [Green Version]
  38. Rolfo, C.; Cardona, A.F.; Cristofanilli, M.; Paz-Ares, L.; Diaz Mochon, J.J.; Duran, I.; Raez, L.E.; Russo, A.; Lorente, J.A.; Malapelle, U.; et al. Challenges and opportunities of cfdna analysis implementation in clinical practice: Perspective of the international society of liquid biopsy (ISLB). Crit. Rev. Oncol. Hematol. 2020, 151, 102978. [Google Scholar] [CrossRef]
  39. Steendam, C.M.J.; Atmodimedjo, P.; De Jonge, E.; Paats, M.S.; Van der Leest, C.; Oomen-de Hoop, E.; Jansen, M.P.H.M.; Del Re, M.; Von der Thüsen, J.H.; Dinjens, W.N.M.; et al. Plasma cell-free DNA testing of patients with EGFR mutant non–small-cell lung cancer: Droplet digital PCR versus next-generation sequencing compared with tissue-based results. JCO Precis. Oncol. 2019, 3, 1–9. [Google Scholar] [CrossRef]
  40. Pruis, M.A.; Geurts-Giele, W.R.R.; von der, T.J.H.; Meijssen, I.C.; Dinjens, W.N.M.; Aerts, J.; Dingemans, A.M.C.; Lolkema, M.P.; Paats, M.S.; Dubbink, H.J. Highly accurate DNA-based detection and treatment results of met exon 14 skipping mutations in lung cancer. Lung Cancer 2020, 140, 46–54. [Google Scholar] [CrossRef] [Green Version]
  41. Veerman, G.D.M.; Lam, M.H.; Mathijssen, R.H.J.; Koolen, S.L.W.; de Bruijn, P. Quantification of afatinib, alectinib, crizotinib and osimertinib in human plasma by liquid chromatography/triple-quadrupole mass spectrometry; focusing on the stability of osimertinib. J. Chromatogr. B Anal. Technol. Biomed. Life Sci. 2019, 1113, 37–44. [Google Scholar] [CrossRef]
  42. Braal, C.L.; Veerman, G.D.M.; Peric, R.; Aerts, J.; Mathijssen, R.H.J.; Koolen, S.L.W.; de Bruijn, P. Quantification of the tyrosine kinase inhibitor erlotinib in human scalp hair by liquid chromatography-tandem mass spectrometry: Pitfalls for clinical application. J. Pharm. Biomed. Anal. 2019, 172, 175–182. [Google Scholar] [CrossRef] [PubMed]
  43. Veerman, G.D.M.; Hussaarts, K.; Peric, R.; Oomen-de Hoop, E.; Landa, K.D.; van der Leest, C.H.; Broerse, S.D.; Rutten, H.B.; Belderbos, H.N.A.; Steendam, C.M.J.; et al. Influence of cow’s milk and esomeprazole on the absorption of erlotinib: A randomized, crossover pharmacokinetic study in lung cancer patients. Clin. Pharmacokinet. 2020. Epub ahead of print. [Google Scholar] [CrossRef] [PubMed]
  44. National Institute of Health. Cancer Therapy Evaluation Program, Common Terminology Criteria for Adverse Events (CTCAE). Available online: https://evs.nci.nih.gov/ftp1/CTCAE/CTCAE_4.03/CTCAE_4.03_2010-06-14_QuickReference_8.5x11.pdf (accessed on 1 December 2019).
Figure 1. Plasma conversion of the primary epidermal growth factor receptor (EGFR) mutation in relation to progression-free survival (PFS) and overall survival (OS): (a) PFS and plasma conversion at week 6; (b) PFS and plasma conversion at week 12; (c) OS and plasma conversion at week 6; (d) OS and plasma conversion at week 12.
Cancers 12 03179 g001
Figure 2. PFS category distribution and plasma conversion in time.
Cancers 12 03179 g002
Figure 3. Variant allele frequency (VAF) of the primary EGFR mutation in time, by plasma conversion status. (a) Patients with complete plasma conversion; (b) patients without complete plasma conversion.
Cancers 12 03179 g003
Figure 4. (a) Relative change in erlotinib Cmean during treatment. Treatment period is divided in tertiles; (b) progression-free survival based on the erlotinib Cmean in the second tertile compared to the first tertile. The first (red-line) group has a decrease of less than 10% or an increase in Cmean. The second (blue-line) group has a decrease of at least 10% in erlotinib Cmean. Cmean = mean plasma concentration.
Cancers 12 03179 g004
Table 1. Baseline characteristics.
Baseline Patient Characteristicsn = 41
Gender
  Male18 (44%)
  Female23 (56%)
Age (median, range)62 (42–83)
Ethnicity
  Caucasian36 (88%)
  Asian4 (10%)
  Unknown1 (2%)
Smoking status
  Current2 (5%)
  Former24 (58%)
  Never15 (37%)
Former pack years (median, range)6 (0–40)
  015 (37%)
  1–1511 (27%)
  15–309 (22%)
  ≥301 (2%)
  Unknown5 (12%)
Histology
  NSCLC; adenocarcinoma39 (95%)
  NSCLC NOS1 (2.5%)
  Unknown1 (2.5%)
Type of primary EGFR mutation
Exon 1928 (68%)
  Deletion23 (56%)
  Deletion-insertion4 (9.5%)
  Other (VUS)1 (2.5%)
Exon 21 13 (32%)
  p.L858R12 (29.5%)
  Other1 (2.5%)
Exon 20 concomitant mutation28 (68%)
  p.T790M27 (66%)
  Exon 19 + exon 201 (2.5%)
Plasma available at baseline 38 (93%)
Tissue available at baseline32 (78%)
Table 2. Treatment lines during study.
Available Treatment Lines during StudyTotal Cohort *
(n = 41)
1st Line Cohort (n = 19)2nd Line Cohort (n = 27)
Best response on treatment
  PR25 (61%)13 (68%)15 (56%)
  SD12 (29%)4 (21%)10 (37%)
  PD3 (7%)2 (11%)1 (3.5%)
  Unknown1 (3%)0 (0%)1 (3.5%)
Progression or death event28 (68%)15 (79%)18 (67%)
  Radiological progression24 (59%)13 (68%)16 (59%)
  Death without radiological progression4 (10%)2 (11%)2 (28%)
Progression free survival category
  ≤6 months13 (32%)4 (21%)9 (33%)
  >6 months28 (68%)15 (79%)18 (67%)
* To prevent bias, we only included the most recent treatment lines of the 41 individual patients, 5 treatment lines from the 1st line cohort were excluded in analyses of the total EGFR cohort. Abbreviations: PR = partial response, SD = stable disease, PD = progressive disease.
Table 3. TP53 status at baseline.
Baseline TP53 mutation present (n = 41)23 (56%)
Present in plasma (n = 23)6 (26%)
Present in tissue (n = 23)22 (96%)
No plasma sample baseline2 (9%)
No ctDNA baseline4 (17%)
Not covered by cfDNA panel6 (26%)
Covered by cfDNA panel4 (17%)
Location of mutation
 Exon 56 (26%)
 Exon 63 (13%)
 Exon 78 (35%)
 Exon 82 (9%)
 Other4 (17%)
Type of mutation
 Missense15 (65%)
 Nonsense1 (5%)
 Other7 (30%)
Table 4. Kaplan-Meier analysis to correlate (changes in) Cmean during treatment with PFS and toxicity.
VariableEventErlotinibOsimertinib
n (Events)Log-Rank
p-Value
n (Events)Log-Rank
p-Value
Cmean of total treatment PFS15 (11)0.51722 (13)0.631
Cmean first six weeks PFS12 (8)0.19720 (11)0.972
Cmean two months before PD PFS7 (7)0.77915 (9)0.221
Cmean two months before PD/Cmean first six weeks PFS5 (5)0.039*7 (7)0.561
Cmean third tertile/Cmean first tertile PFS8 (8)0.85517 (10)0.821
Cmean second tertile/Cmean first tertile PFS13 (9)0.037*17 (10)0.169
Cmean third tertile/Cmean second tertile PFS9 (9)0.41515 (8)0.517
Cmean until severe toxicity or end of study Tox15 (10)0.43022 (3)0.134
Cmean third tertile/Cmean first tertile Tox8 (4)0.43317 (2)0.705
Cmean second tertile/Cmean first tertile Tox13 (8)0.031 *17 (3)0.460
Cmean third tertile/Cmean second tertile Tox9 (5)0.78615 (2)0.564
= Variable group deviated by median; = variable group deviated by a decrease of 10% or more; * = statistically significant (p < 0.05). Abbreviations: Cmean = mean plasma drug concentration at 24 h; PFS = progression-free survival; n = number of patients; PD = progressive disease.
Table 5. Toxicity.
Table 5. Toxicity.
Erlotinib (n = 18)
Severe toxicity10 (56%)
  CTCAE grade ≥ 35 (28%)
  Hospital admission2 (11%)
  Dose reduction8 (44%)
  TKI interruption/discontinuation2 (11%)
Erlotinib specific toxicity (all grade)
  Rash12 (72%)
  Alopecia8 (44%)
  Diarrhea6 (33%)
  Sicca (dry eyes, mouth and/or skin)6 (33%)
  Paronychia5 (28%)
  Hand-Foot Syndrome1 (6%)
  Hypertrichosis1 (6%)
Osimertinib (n = 27)
Severe toxicity4 (15%)
  CTCAE grade ≥ 34 * (15%)
  Hospital admission2 (7%)
  Reduction2 (7%)
  TKI interruption/discontinuation3 (11%)
Osimertinib specific toxicity (all grade)
  CK elevation6 (22%)
  Paronychia5 (19%)
  Diarrhea4 (15%)
  Dry skin4 (15%)
  QTc prolongation4 (17%)
  Pneumonitis 3 (11%)
  Rash2 (7%)
Abbreviations: n = number of patients; CTCAE = Common Terminology Criteria for Adverse Events. = 1 rash, 1 nausea and vomitus, 1 kidney failure, 1 ALAT increase and 1 hypokalemia and pericarditis. * = 1 pneumonitis, 1 pneumonitis and skin infection and 1 CK elevation. = calculated for patients which had baseline and follow-up electro cardiograms (n = 23).
Publisher’s Note: MDPI stays neutral with regard to jurisdictional claims in published maps and institutional affiliations.

