LDOC1 Suppresses Microbe-Induced Production of IL-1β in Human Normal and Cancerous Oral Cells through the PI3K/Akt/GSK-3β Axis

 ,
, 
Simple Summary
Abstract
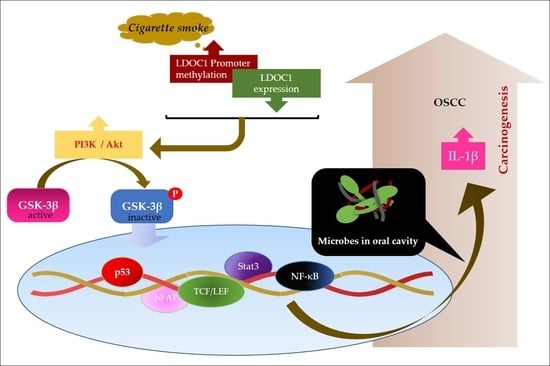
1. Introduction
2. Results
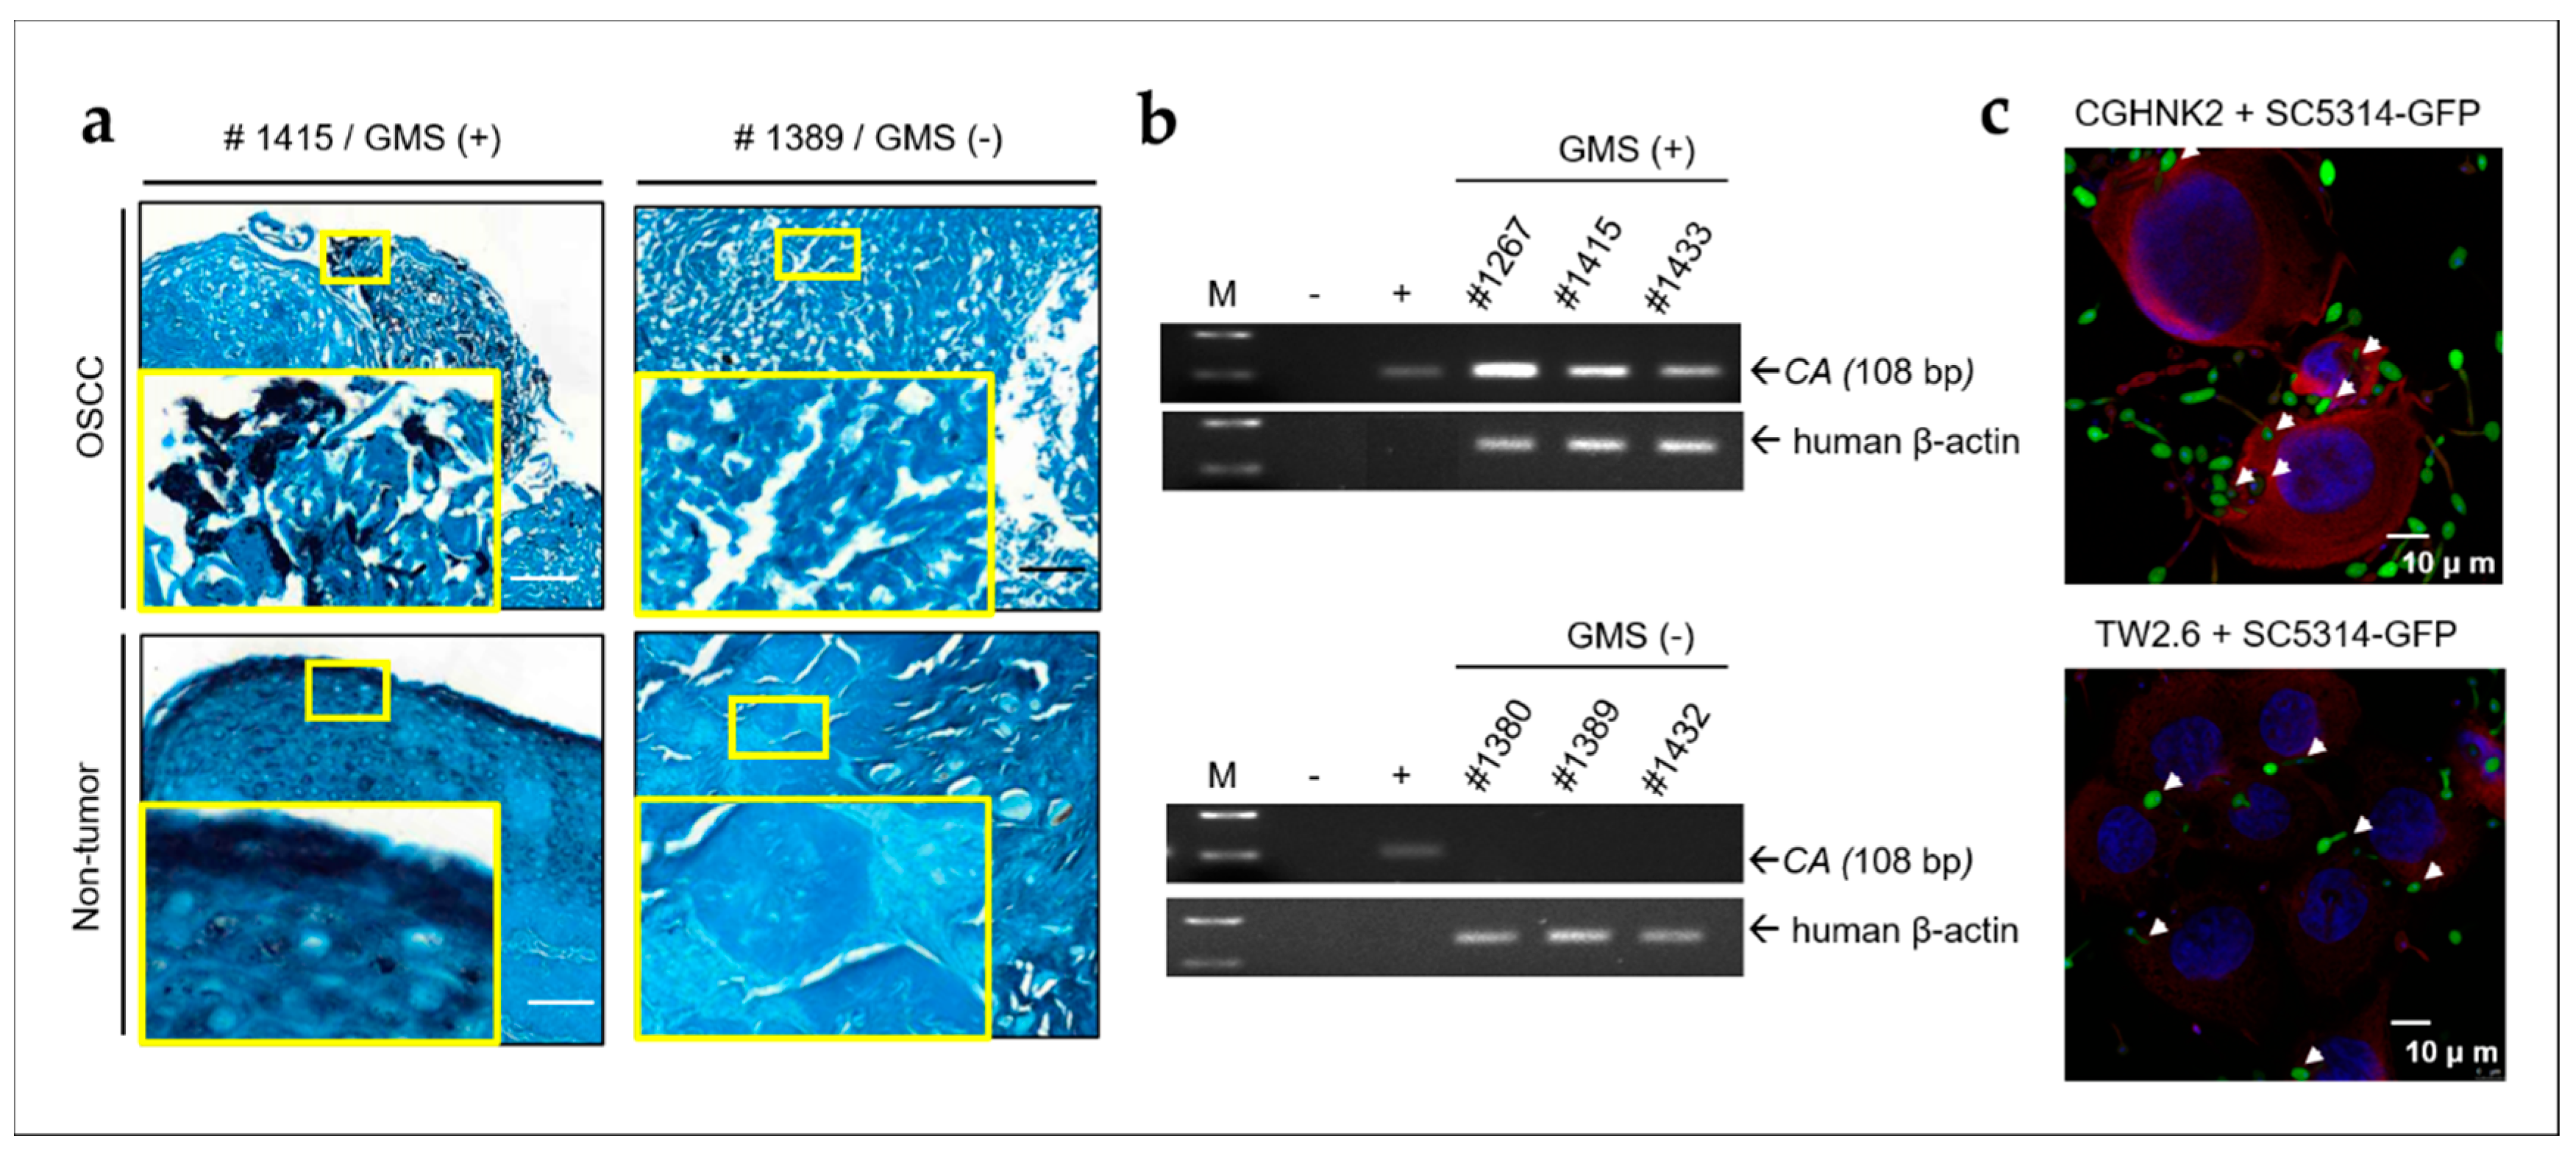
2.1. CA Is Present in OSCC Tumors and Non-Tumor Tissues and Invades Human Oral Keratinocytes and OSCC Cells
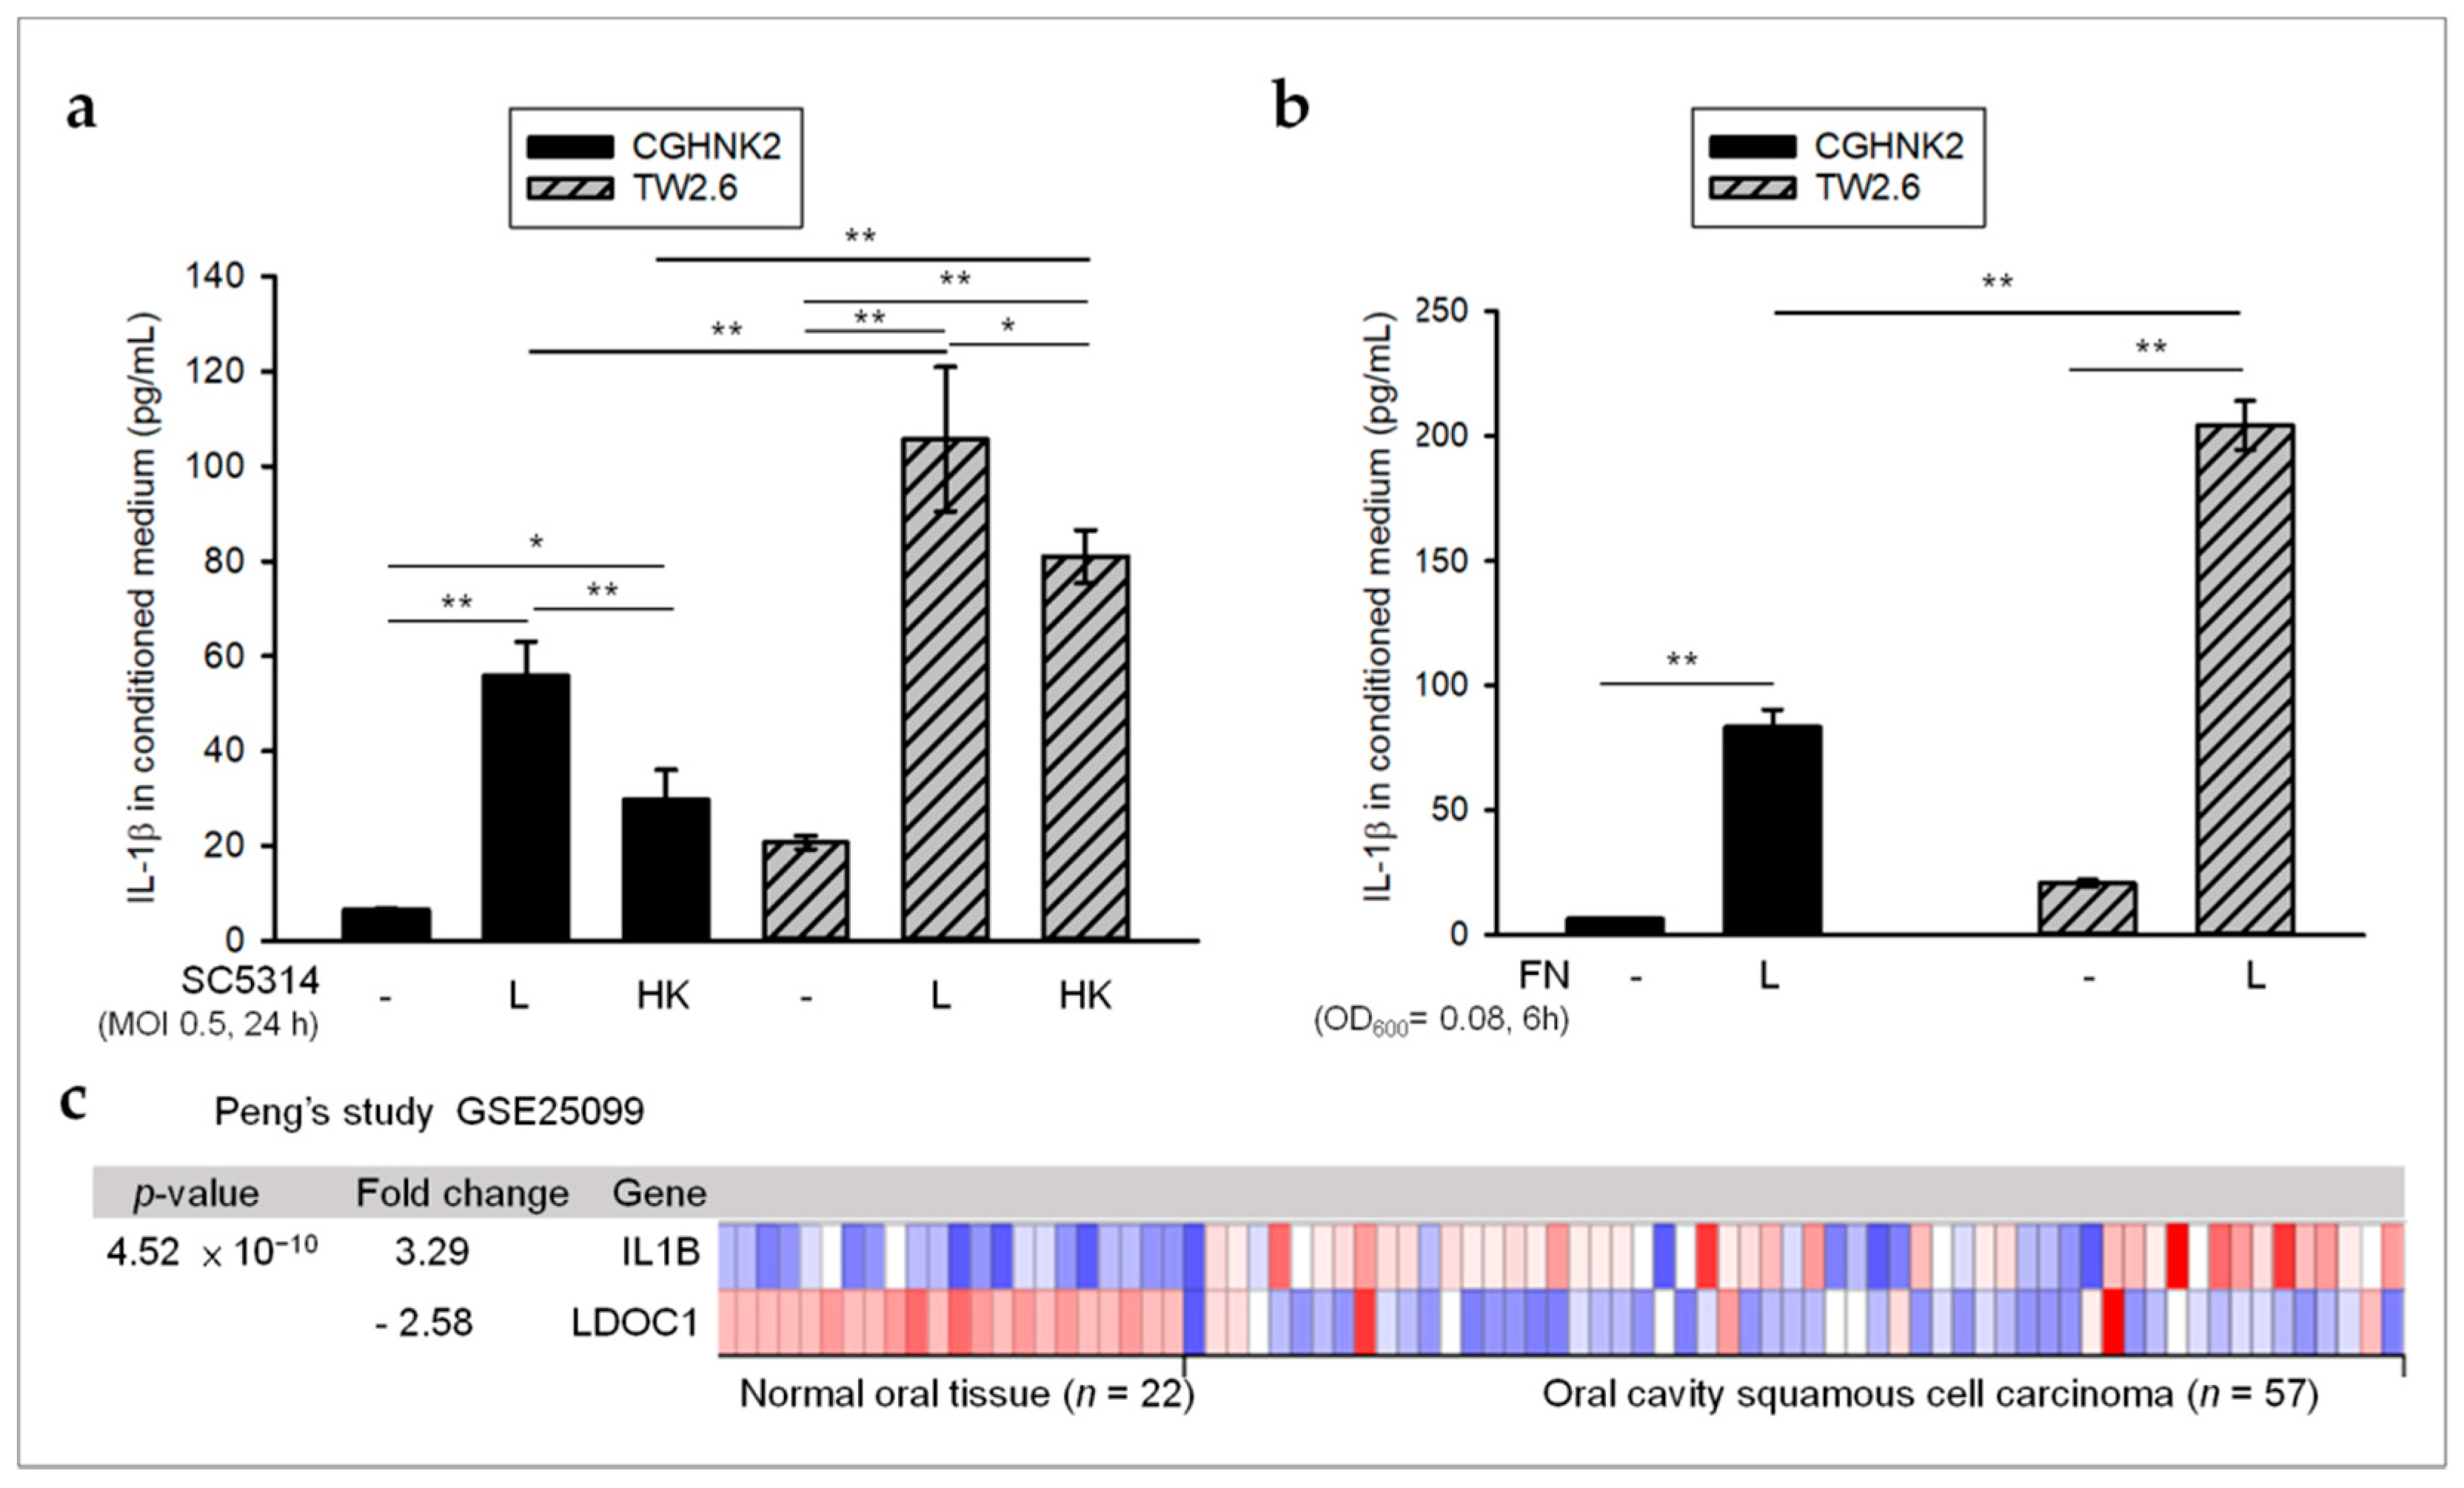
2.2. Oral Microbes May Contribute to High Levels of IL-1β in OSCC with LDOC1 Downregulation
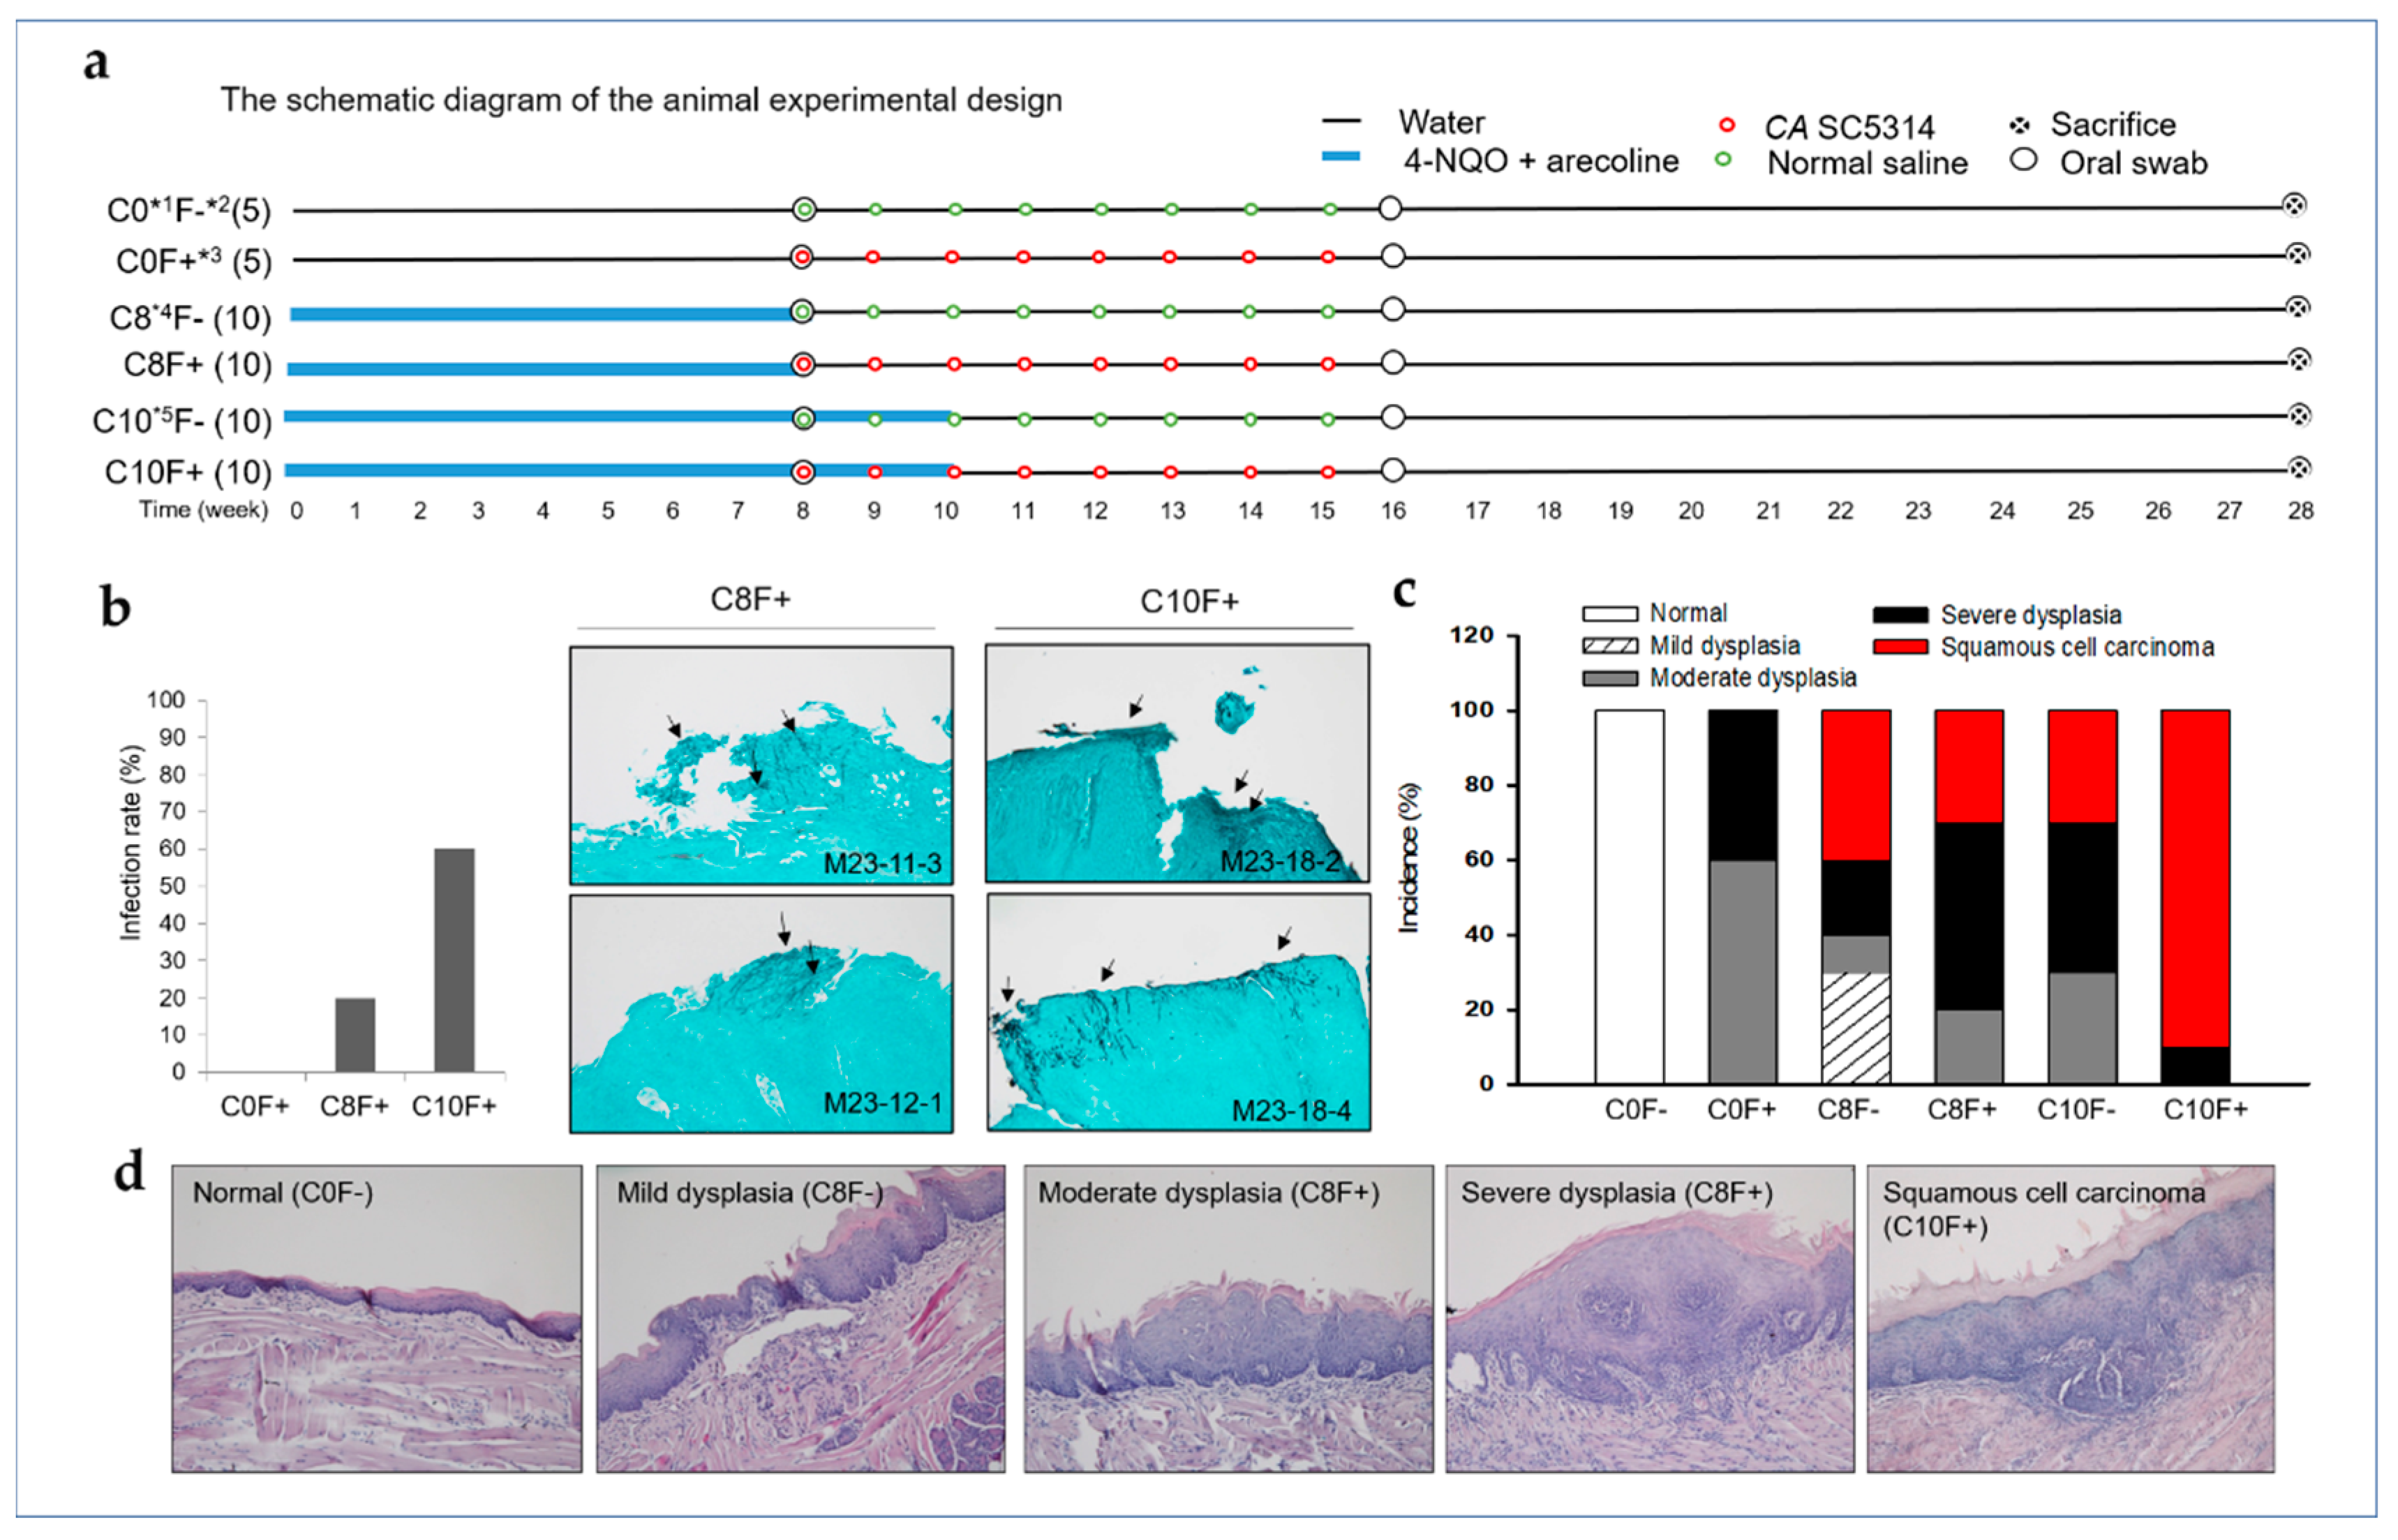
2.3. CA Infection Promoted the Development of OSCC in the Synthetic Tobacco-Related Carcinogen 4-NQO and the Areca Nut Alkaloid Arecoline-Cotreated Mice
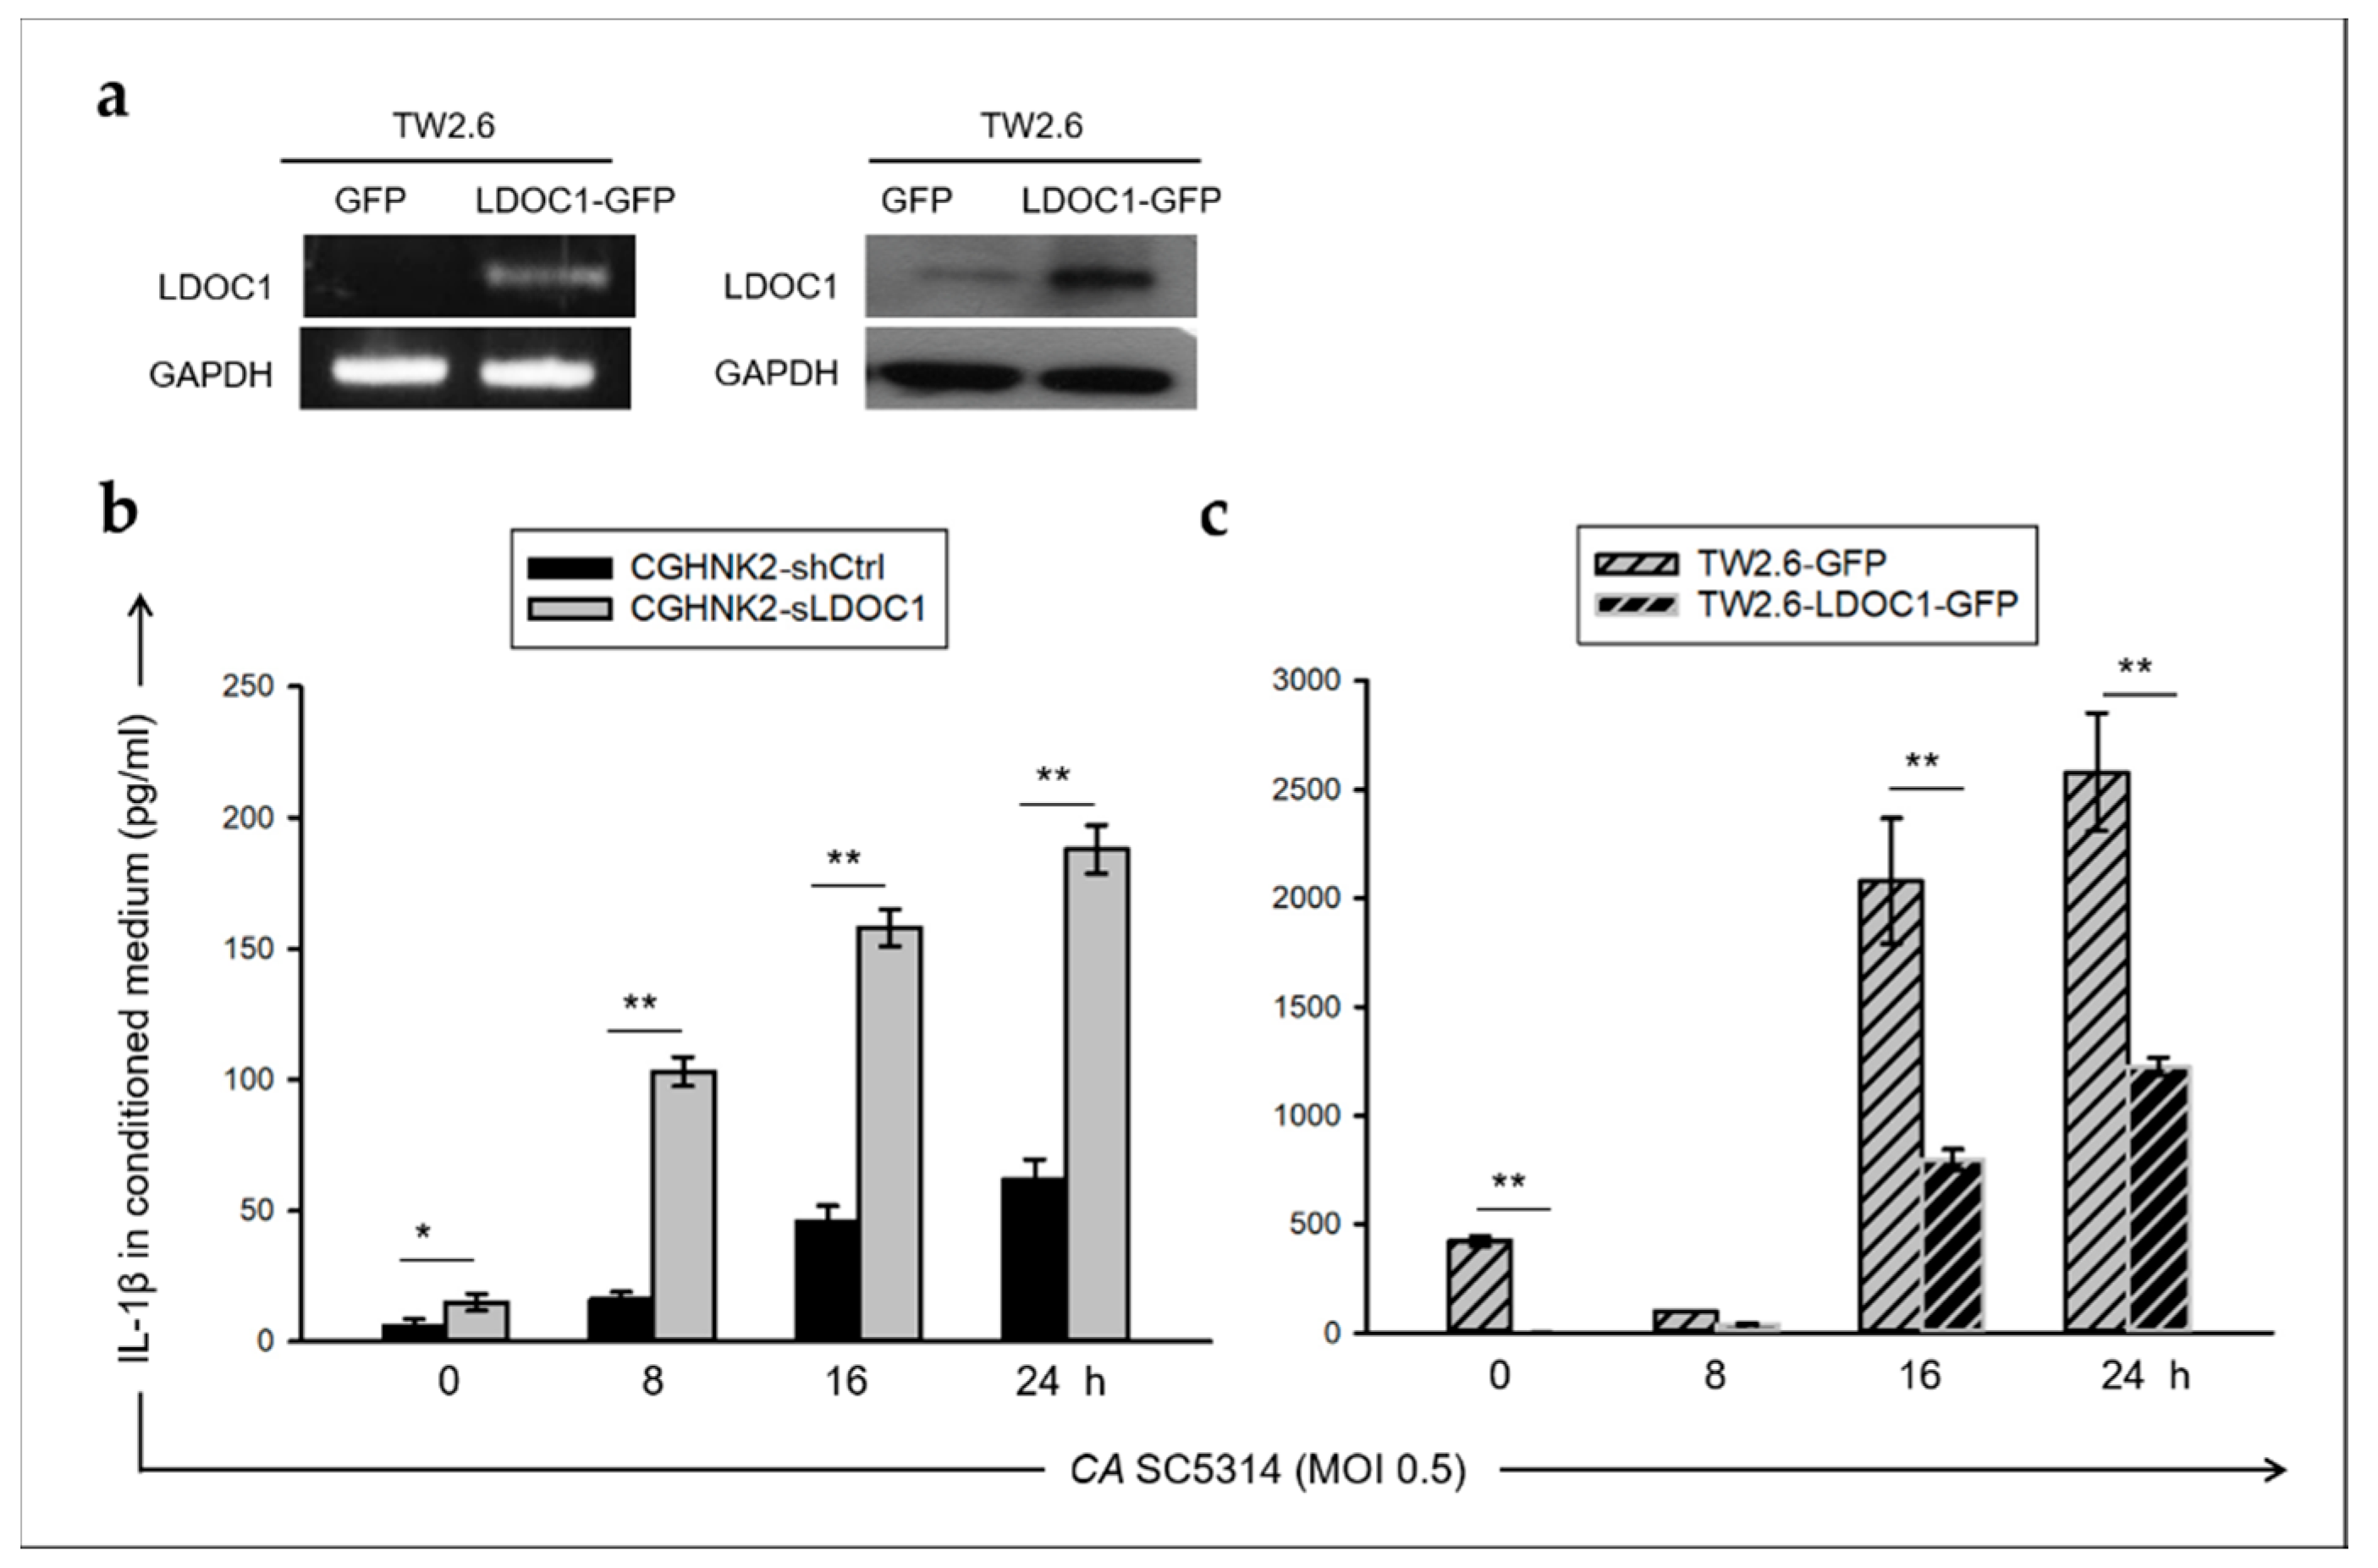
2.4. LDOC1 Is a Negative Regulator of IL-1β Production Induced by CA SC5314
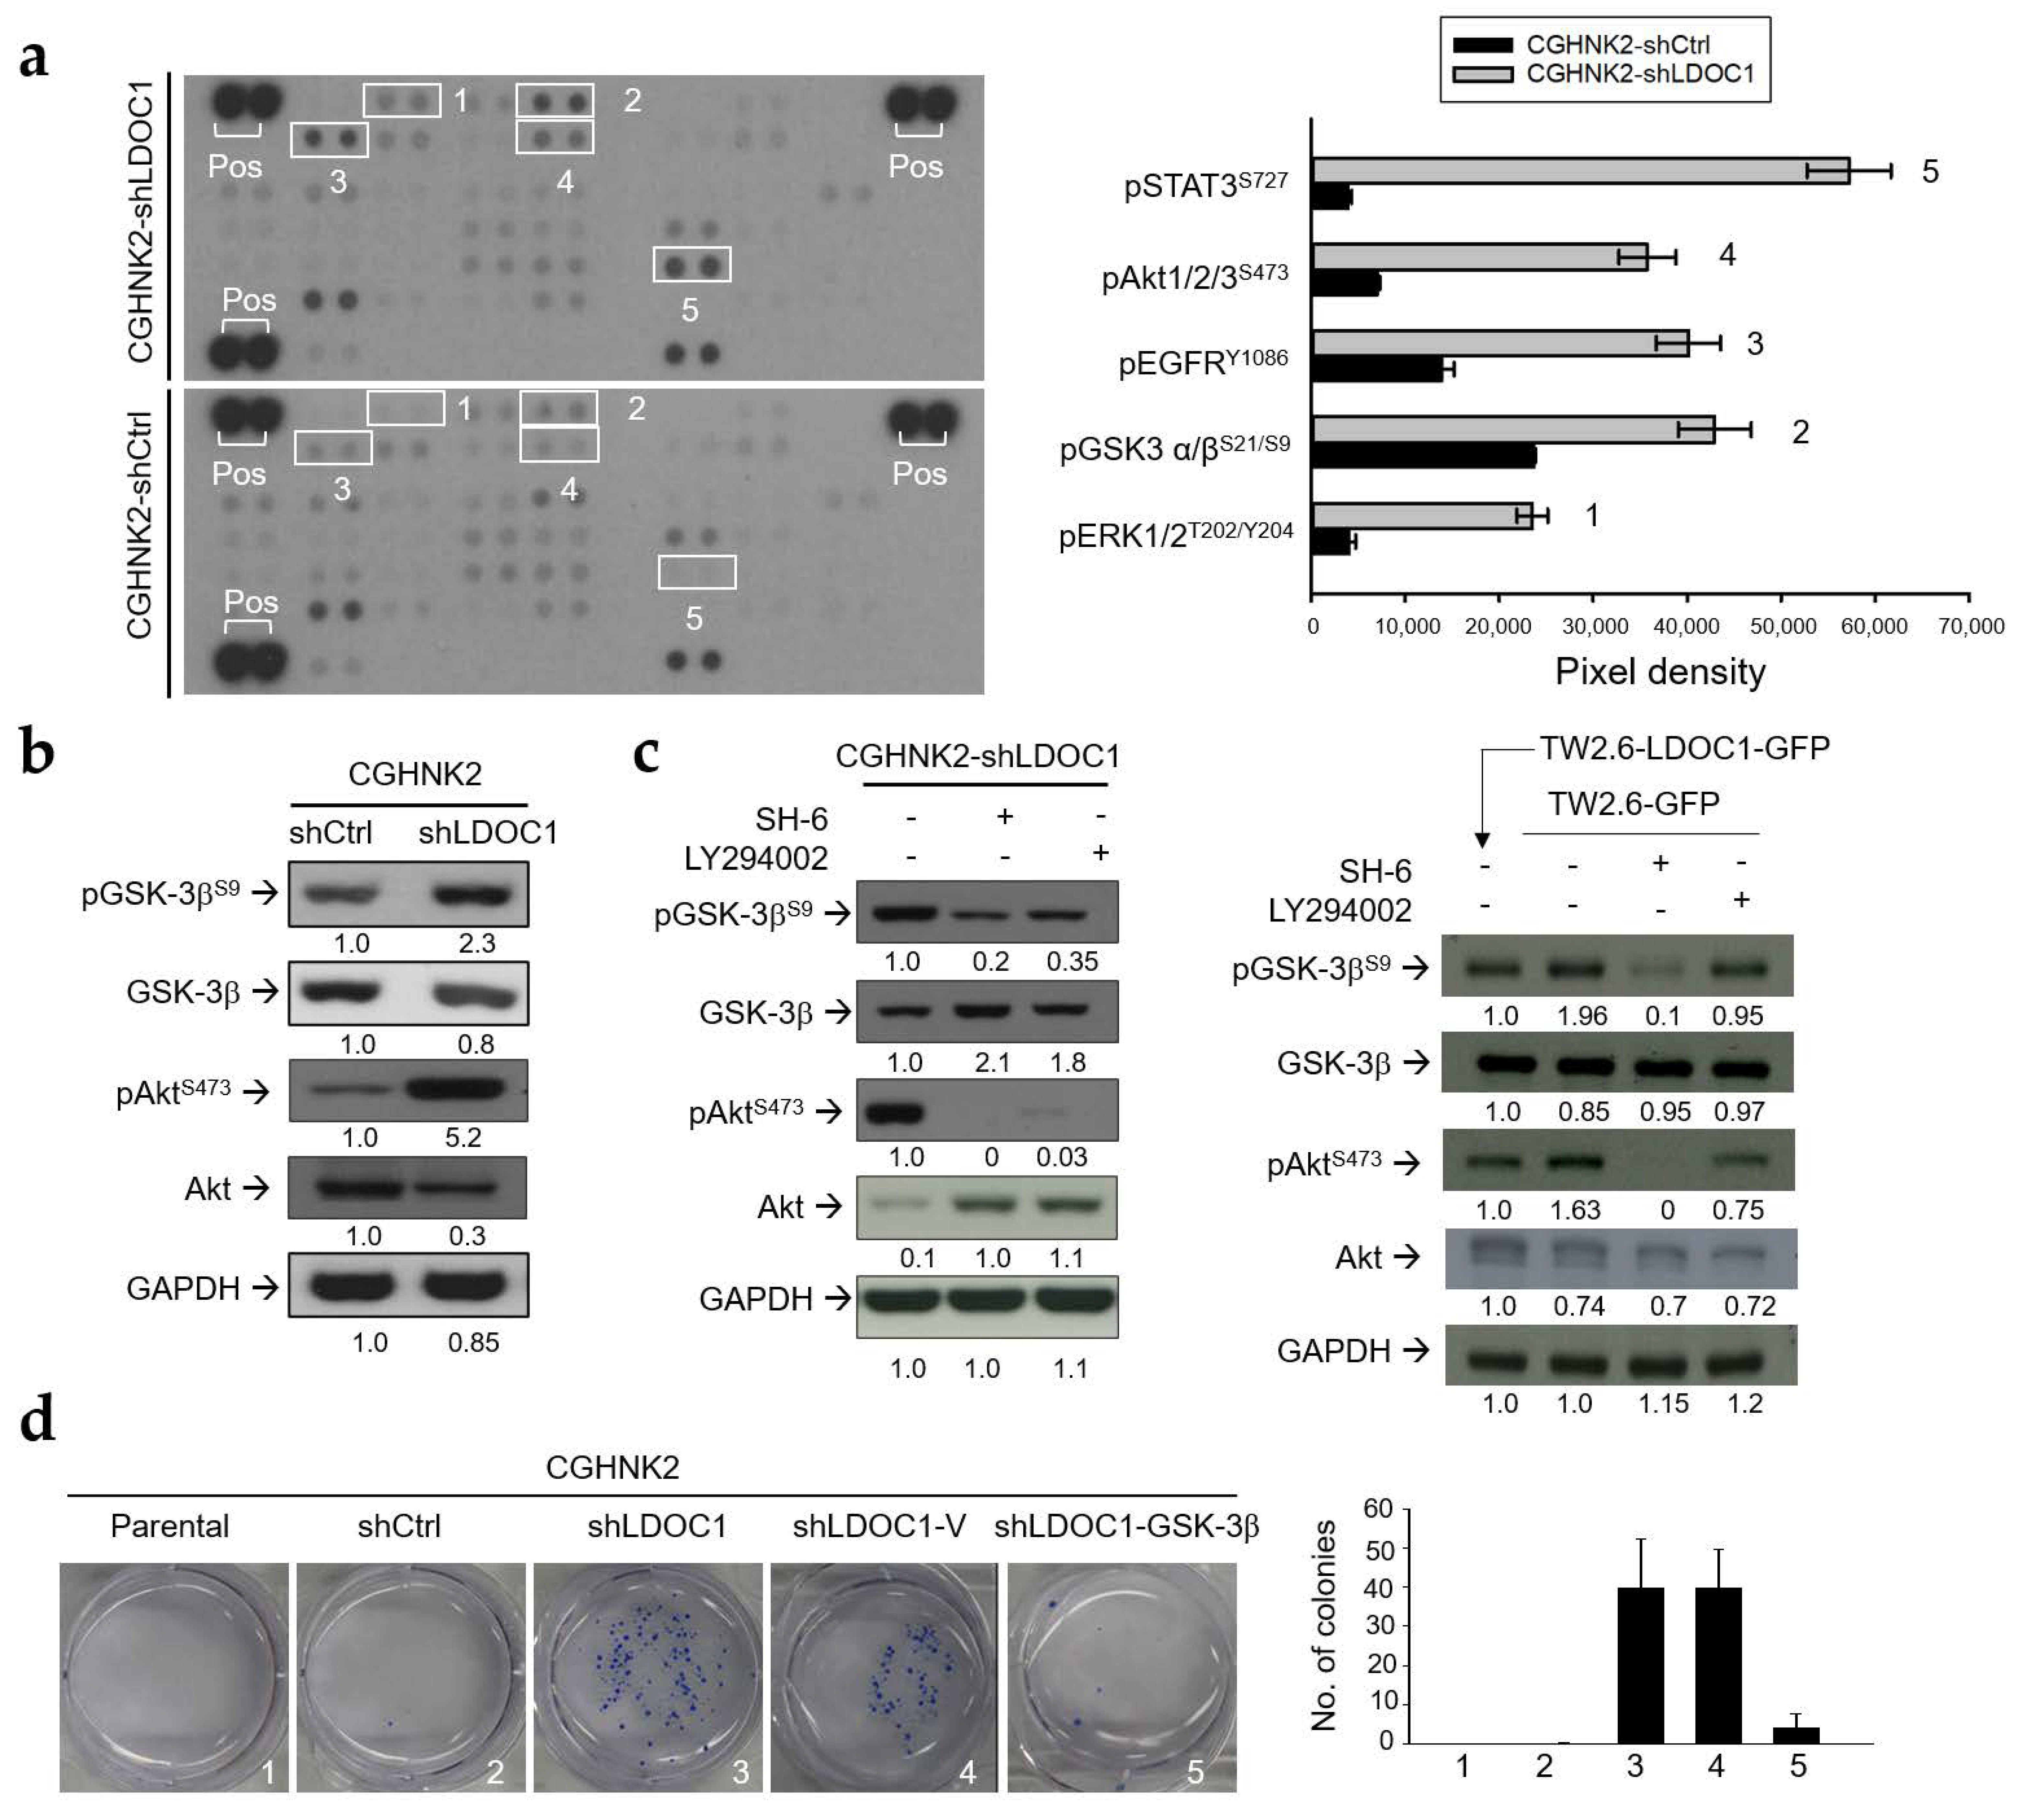
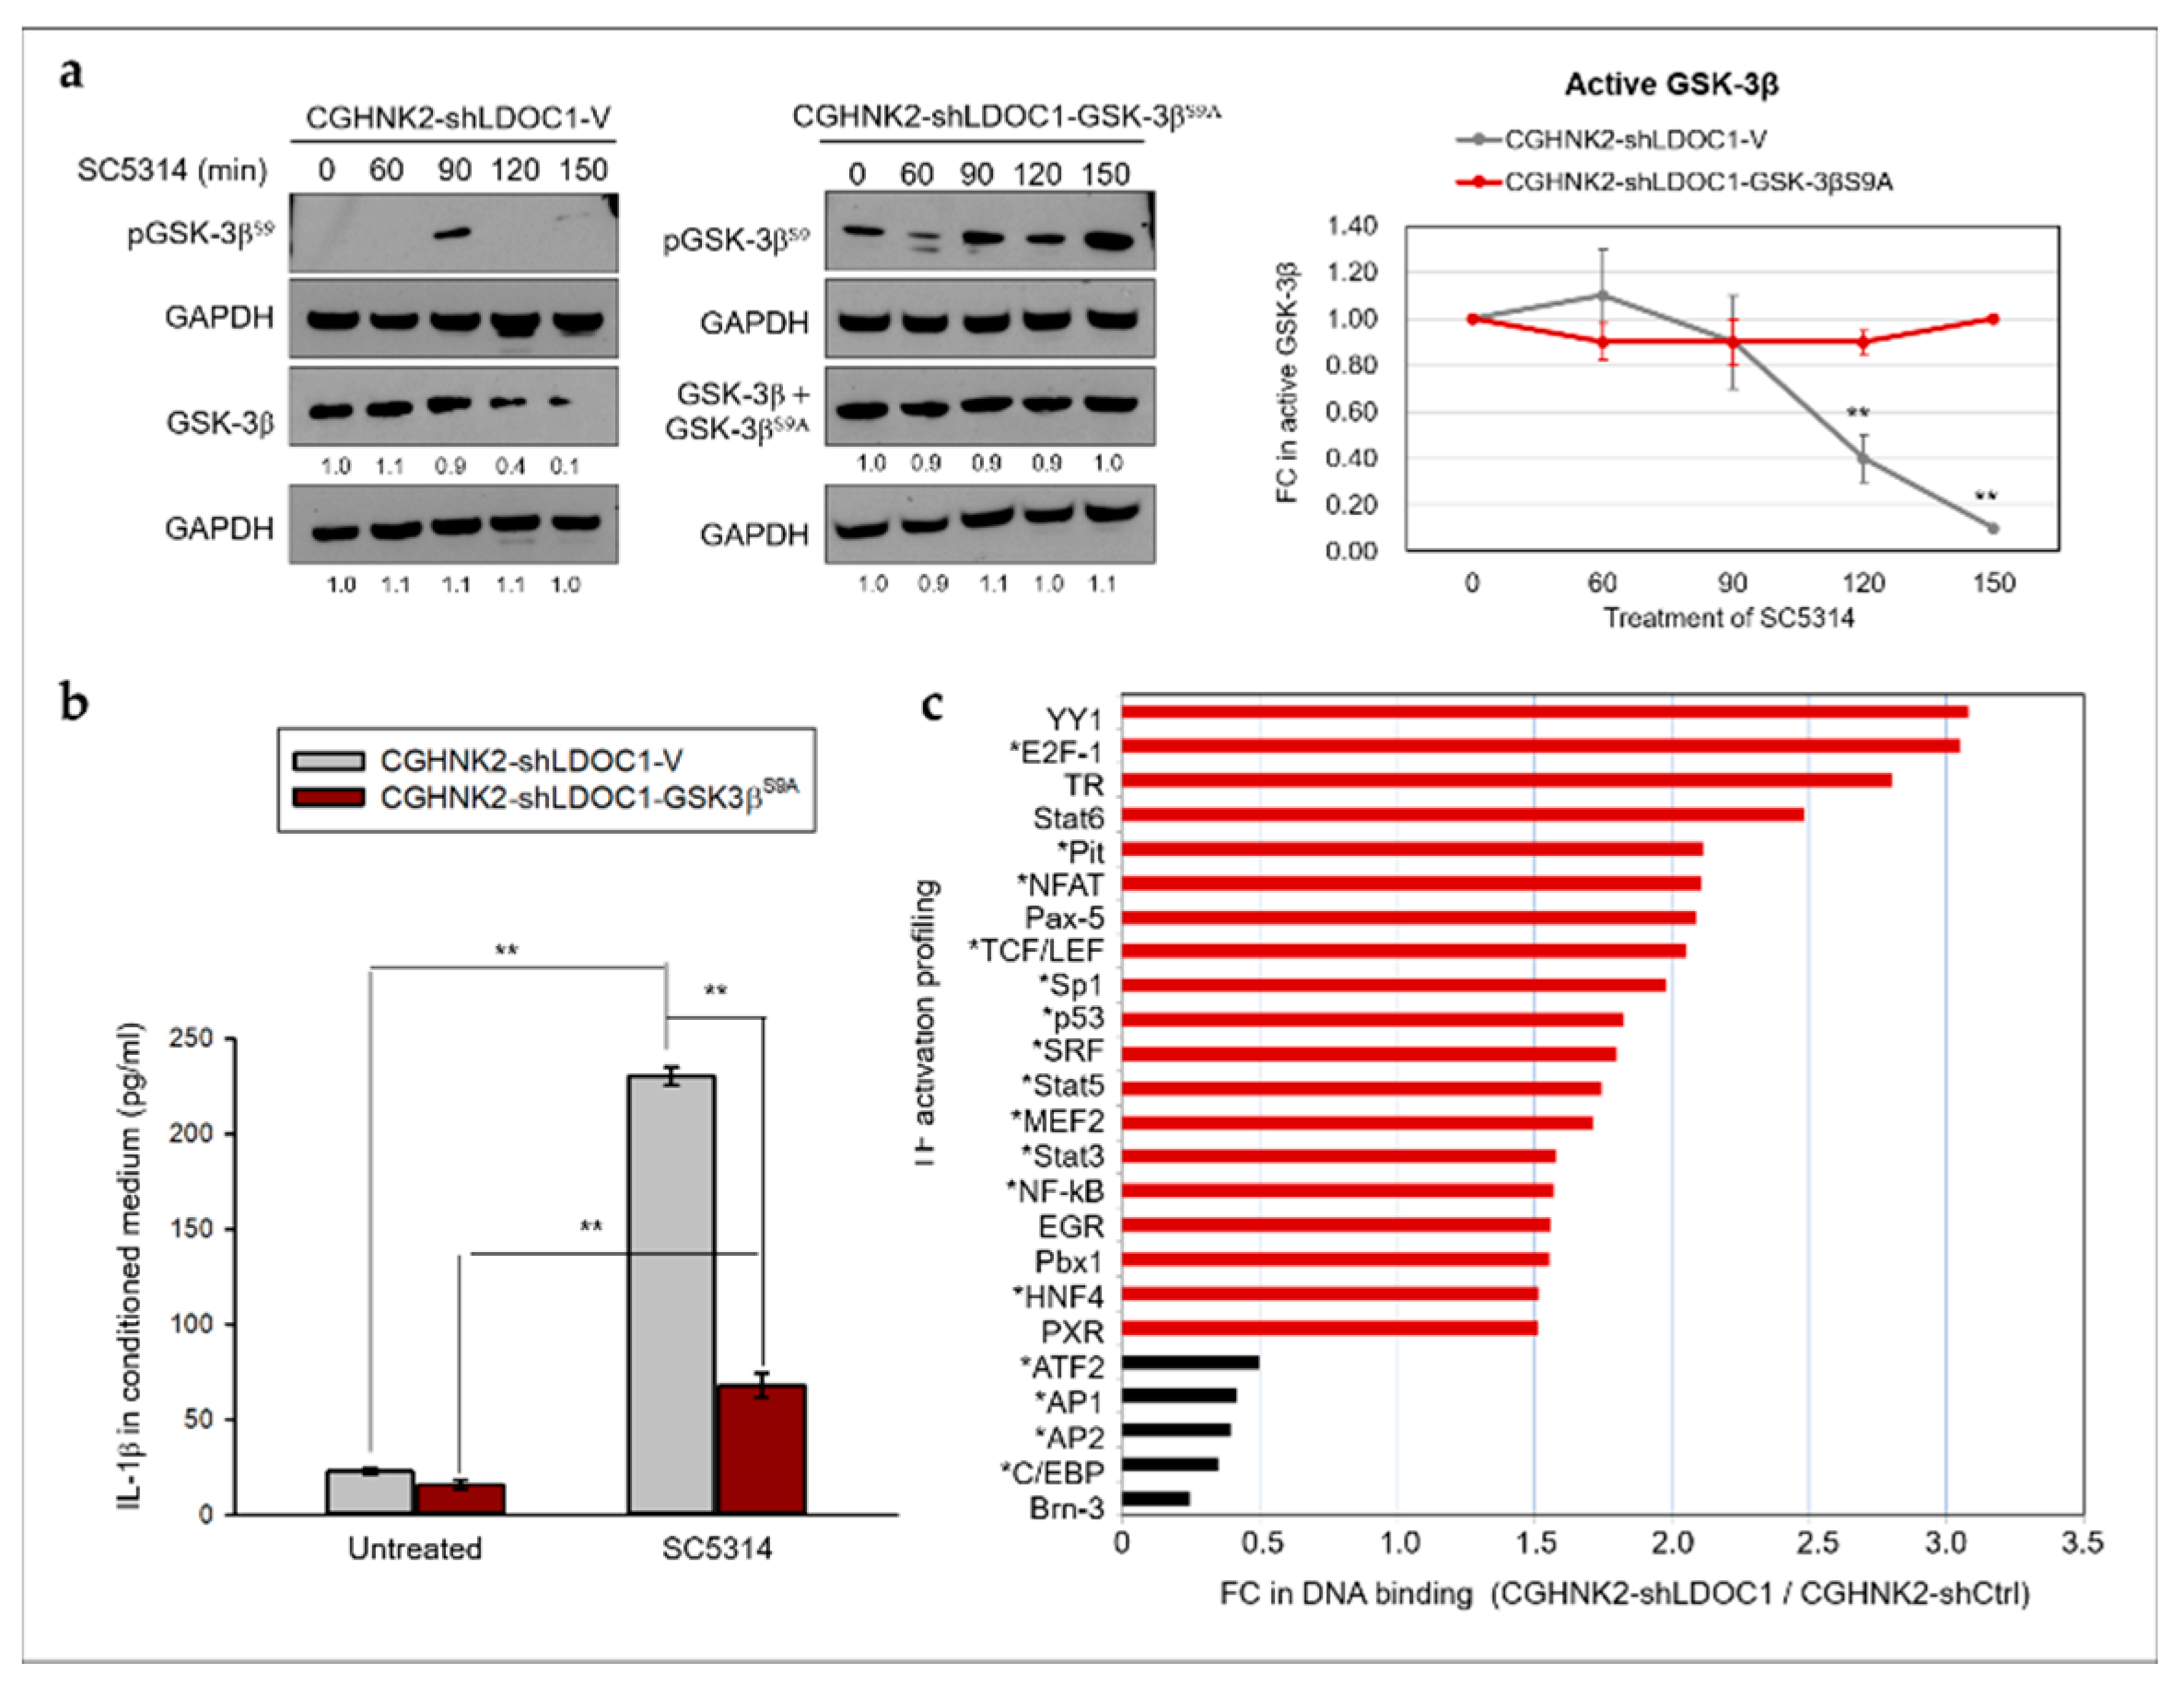
2.5. LDOC1 Deficiency Induces Inhibitory Phosphorylation of GSK-3βS9 through Akt/PI3K Activation, and Reduced GSK-3β Activity Controls the Clonogenicity of CGHNK2-shLDOC1 Cells
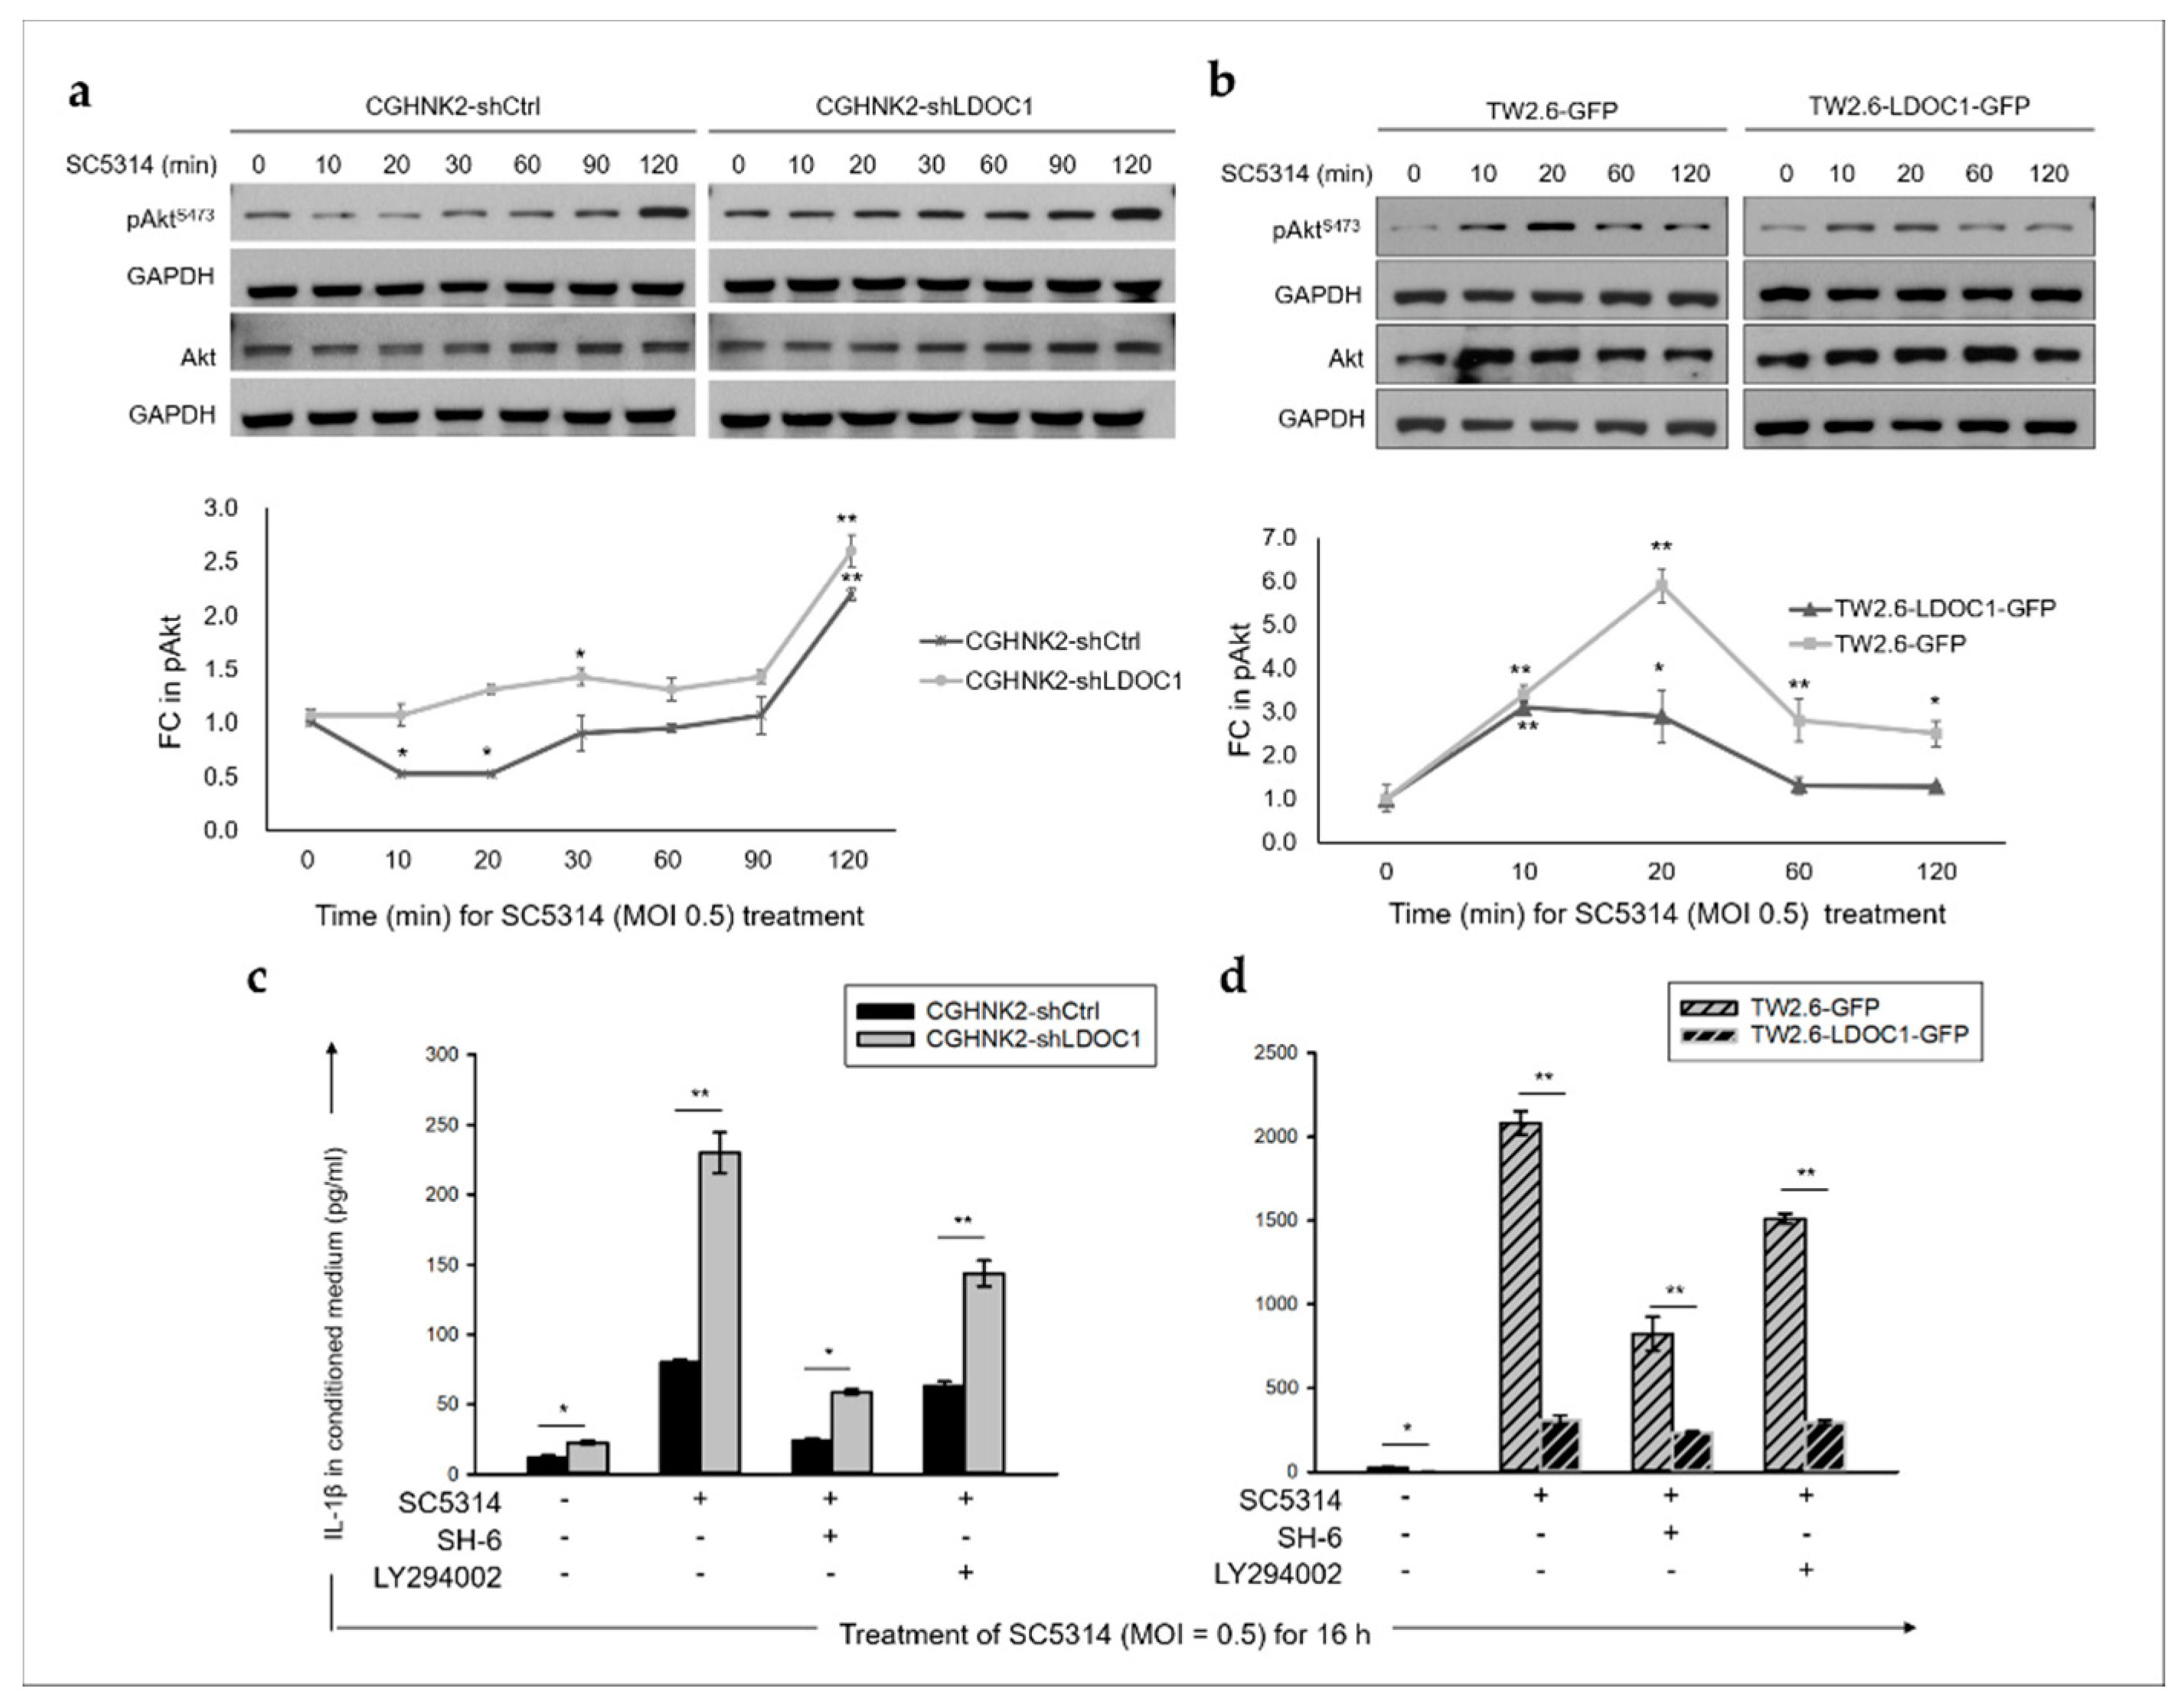
2.6. The PI3K/Akt/GSK-3β Signaling Pathway Is Involved in the CA-Stimulated IL-1β Production by LDOC1 Deficienct Oral Cells.
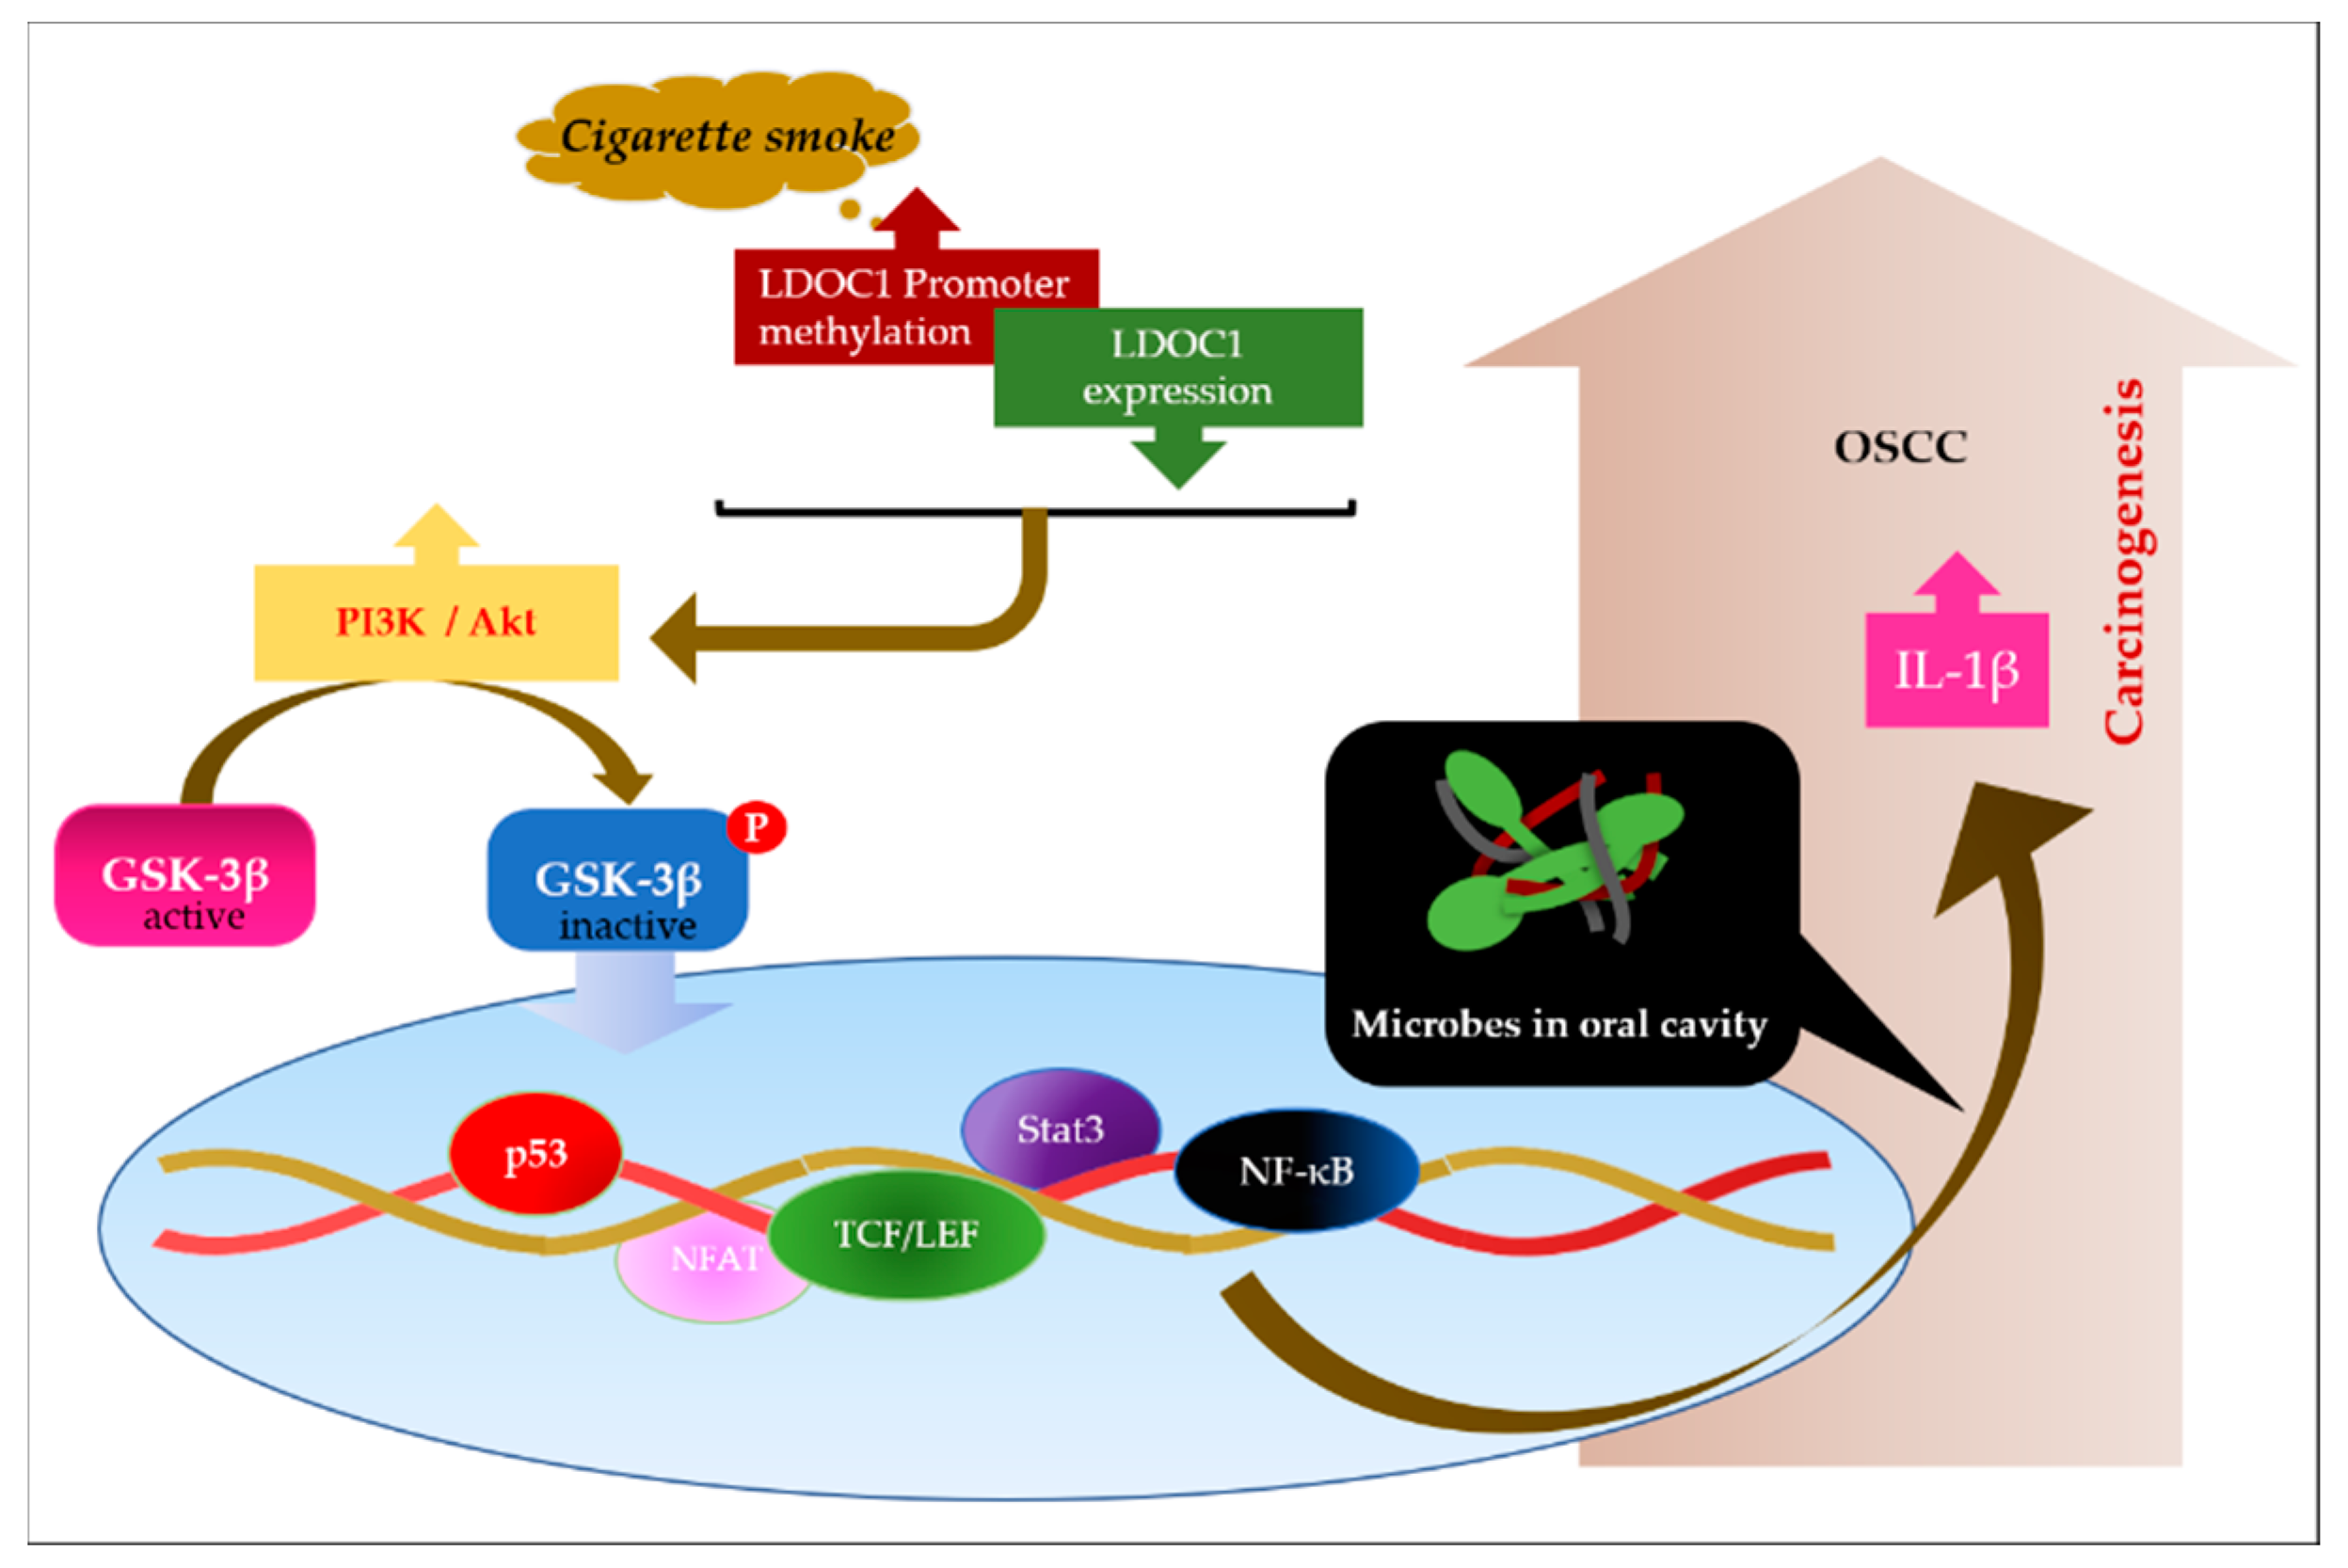
3. Discussion
4. Materials and Methods
4.1. Clinical Samples
4.2. Antibodies and Reagents
4.3. Cell Lines and Transduction
4.4. Quantitative Real-Time PCR (qPCR)
4.5. Detection of Fungal Organisms Using Grocott’s Methenamine Silver (GMS) Staining
4.6. Detection of CA DNA Using Real-Time PCR Assay
4.7. Mouse OSCC Model with CA-Infected Oral Lesions
4.8. Determination of CA Infection in Mouse Oral Lesions
4.9. Cytometric Bead Array (CBA) Analysis
4.10. Gene Expression Microarray Analysis
4.11. Human Phospho-Kinase Array Analysis
4.12. Transcription Factor (TF) Profiling Array
4.13. Soft Agar Assay
4.14. Statistics
5. Conclusions
Supplementary Materials
Author Contributions
Funding
Acknowledgments
Conflicts of Interest
References
- Ferlay, J.; Ervik, M.; Lam, F.; Colombet, M.; Mery, L.; Piñeros, M.; Znaor, A.; Soerjomataram, I.; Bray, F. Global Cancer Observatory: Cancer Today; International Agency for Research on Cancer: Lyon, France, 2018; Volume 2019. [Google Scholar]
- Warnakulasuriya, S. Global epidemiology of oral and oropharyngeal cancer. Oral Oncol. 2009, 45, 309–316. [Google Scholar] [CrossRef] [PubMed]
- Stambuk, H.E.; Karimi, S.; Lee, N.; Patel, S.G. Oral cavity and oropharynx tumors. Radiol. Clin. N. Am. 2007, 45, 1–20. [Google Scholar] [CrossRef] [PubMed]
- Ko, Y.C.; Huang, Y.L.; Lee, C.H.; Chen, M.J.; Lin, L.M.; Tsai, C.C. Betel quid chewing, cigarette smoking and alcohol consumption related to oral cancer in Taiwan. J. Oral Pathol. Med. 1995, 24, 450–453. [Google Scholar] [CrossRef]
- Lin, W.J.; Jiang, R.S.; Wu, S.H.; Chen, F.J.; Liu, S.A. Smoking, alcohol, and betel quid and oral cancer: A prospective cohort study. J. Oncol. 2011, 2011, 525976. [Google Scholar] [CrossRef] [PubMed]
- Oral and Oropharyngeal Cancer-Risk Factors and Prevention. Available online: https://www.cancer.net/cancer-types/oral-and-oropharyngeal-cancer/risk-factors-and-prevention. (accessed on 31 July 2019).
- Alnuaimi, A.D.; Wiesenfeld, D.; O’Brien-Simpson, N.M.; Reynolds, E.C.; McCullough, M.J. Oral Candida colonization in oral cancer patients and its relationship with traditional risk factors of oral cancer: A matched case-control study. Oral. Oncol. 2015, 51, 139–145. [Google Scholar] [CrossRef] [PubMed]
- Perera, M.; Al-Hebshi, N.N.; Perera, I.; Ipe, D.; Ulett, G.C.; Speicher, D.J.; Chen, T.; Johnson, N.W. A dysbiotic mycobiome dominated by Candida albicans is identified within oral squamous-cell carcinomas. J. Oral. Microbiol. 2017, 9, 1385369. [Google Scholar] [CrossRef] [PubMed]
- Delsing, C.E.; Bleeker-Rovers, C.P.; van de Veerdonk, F.L.; Tol, J.; van der Meer, J.W.; Kullberg, B.J.; Netea, M.G. Association of esophageal candidiasis and squamous cell carcinoma. Med. Mycol. Case Rep. 2012, 1, 5–8. [Google Scholar] [CrossRef]
- Paster, B.J.; Olsen, I.; Aas, J.A.; Dewhirst, F.E. The breadth of bacterial diversity in the human periodontal pocket and other oral sites. Periodontology 2000 2006, 42, 80–87. [Google Scholar] [CrossRef]
- Gao, L.; Xu, T.; Huang, G.; Jiang, S.; Gu, Y.; Chen, F. Oral microbiomes: More and more importance in oral cavity and whole body. Protein Cell 2018, 9, 488–500. [Google Scholar] [CrossRef]
- Sitheeque, M.A.; Samaranayake, L.P. Chronic hyperplastic candidosis/candidiasis (candidal leukoplakia). Crit. Rev. Oral Biol. Med. 2003, 14, 253–267. [Google Scholar] [CrossRef]
- Arzmi, M.H.; Dashper, S.; McCullough, M. Polymicrobial interactions of Candida albicans and its role in oral carcinogenesis. J. Oral Pathol. Med. 2019, 48, 546–551. [Google Scholar] [CrossRef]
- Firth, N.A.; O’Grady, J.F.; Reade, P.C. Oral squamous cell carcinoma in a young person with candidosis endocrinopathy syndrome: A case report. Int. J. Oral Maxillofac. Surg. 1997, 26, 42–44. [Google Scholar] [CrossRef]
- Krogh, P. The role of yeasts in oral cancer by means of endogenous nitrosation. Acta Odontol. Scand. 1990, 48, 85–88. [Google Scholar] [CrossRef] [PubMed]
- Lipperheide, V.; Quindós, G.; Jiménez, Y.; Pontón, J.; Bagán-Sebastián, J.V.; Aguirre, J.M. Candida biotypes in patients with oral leukoplakia and lichen planus. Candida biotypes in leukoplakia and lichen planus. Mycopathologia 1996, 134, 75–82. [Google Scholar] [CrossRef] [PubMed]
- Hsiao, J.R.; Chang, C.C.; Lee, W.T.; Huang, C.C.; Ou, C.Y.; Tsai, S.T.; Chen, K.C.; Huang, J.S.; Wong, T.Y.; Lai, Y.H.; et al. The interplay between oral microbiome, lifestyle factors and genetic polymorphisms in the risk of oral squamous cell carcinoma. Carcinogenesis 2018, 39, 778–787. [Google Scholar] [CrossRef] [PubMed]
- Wu, J.; Li, Q.; Fu, X. Fusobacterium nucleatum Contributes to the Carcinogenesis of Colorectal Cancer by Inducing Inflammation and Suppressing Host Immunity. Transl. Oncol. 2019, 12, 846–851. [Google Scholar] [CrossRef] [PubMed]
- Shang, F.M.; Liu, H.L. Fusobacterium nucleatum and colorectal cancer: A review. World J. Gastrointest. Oncol. 2018, 10, 71–81. [Google Scholar] [CrossRef]
- Wu, C.C.; Hsu, T.Y.; Chang, J.C.; Ou, C.Y.; Kuo, H.C.; Liu, C.A.; Wang, C.L.; Chuang, H.; Chen, C.P.; Yang, K.D. Paternal Tobacco Smoke Correlated to Offspring Asthma and Prenatal Epigenetic Programming. Front. Genet. 2019, 10, 471. [Google Scholar] [CrossRef]
- Prasad, G.; McCullough, M. Chemokines and cytokines as salivary biomarkers for the early diagnosis of oral cancer. Int. J. Dent. 2013, 2013, 813756. [Google Scholar] [CrossRef]
- Radhika, T.; Jeddy, N.; Nithya, S.; Muthumeenakshi, R.M. Salivary biomarkers in oral squamous cell carcinoma—An insight. J. Oral. Biol. Craniofac. Res. 2016, 6, S51–S54. [Google Scholar] [CrossRef]
- Punyani, S.R.; Sathawane, R.S. Salivary level of interleukin-8 in oral precancer and oral squamous cell carcinoma. Clin. Oral. Investig. 2013, 17, 517–524. [Google Scholar] [CrossRef] [PubMed]
- Lee, C.H.; Chang, J.S.; Syu, S.H.; Wong, T.S.; Chan, J.Y.; Tang, Y.C.; Yang, Z.P.; Yang, W.C.; Chen, C.T.; Lu, S.C.; et al. IL-1beta promotes malignant transformation and tumor aggressiveness in oral cancer. J. Cell Physiol. 2015, 230, 875–884. [Google Scholar] [CrossRef] [PubMed]
- Lee, C.H.; Syu, S.H.; Liu, K.J.; Chu, P.Y.; Yang, W.C.; Lin, P.; Shieh, W.Y. Interleukin-1 beta transactivates epidermal growth factor receptor via the CXCL1-CXCR2 axis in oral cancer. Oncotarget 2015, 6, 38866–38880. [Google Scholar] [CrossRef]
- Lee, C.H.; Wong, T.S.; Chan, J.Y.; Lu, S.C.; Lin, P.; Cheng, A.J.; Chen, Y.J.; Chang, J.S.; Hsiao, S.H.; Leu, Y.W.; et al. Epigenetic regulation of the X-linked tumour suppressors BEX1 and LDOC1 in oral squamous cell carcinoma. J. Pathol. 2013, 230, 298–309. [Google Scholar] [CrossRef] [PubMed]
- Lu, Y.C.; Chen, Y.J.; Wang, H.M.; Tsai, C.Y.; Chen, W.H.; Huang, Y.C.; Fan, K.H.; Tsai, C.N.; Huang, S.F.; Kang, C.J.; et al. Oncogenic function and early detection potential of miRNA-10b in oral cancer as identified by microRNA profiling. Cancer Prev. Res (Phila.) 2012, 5, 665–674. [Google Scholar] [CrossRef] [PubMed]
- Chang, S.E.; Foster, S.; Betts, D.; Marnock, W.E. DOK, a cell line established from human dysplastic oral mucosa, shows a partially transformed non-malignant phenotype. Int. J. Cancer 1992, 52, 896–902. [Google Scholar] [CrossRef] [PubMed]
- Kok, S.H.; Hong, C.Y.; Lin, S.K.; Lee, J.J.; Chiang, C.P.; Kuo, M.Y. Establishment and characterization of a tumorigenic cell line from areca quid and tobacco smoke-associated buccal carcinoma. Oral. Oncol. 2007, 43, 639–647. [Google Scholar] [CrossRef]
- Lee, C.H.; Pan, K.L.; Tang, Y.C.; Tsai, M.H.; Cheng, A.J.; Shen, M.Y.; Cheng, Y.M.; Huang, T.T.; Lin, P. LDOC1 silenced by cigarette exposure and involved in oral neoplastic transformation. Oncotarget 2015, 6, 25188–25201. [Google Scholar] [CrossRef]
- Lee, C.H.; Yang, J.R.; Chen, C.Y.; Tsai, M.H.; Hung, P.F.; Chen, S.J.; Chiang, S.L.; Chang, H.; Lin, P. Novel STAT3 Inhibitor LDOC1 Targets Phospho-JAK2 for Degradation by Interacting with LNX1 and Regulates the Aggressiveness of Lung Cancer. Cancers 2019, 11, 63. [Google Scholar] [CrossRef]
- Nagasaki, K.; Schem, C.; von Kaisenberg, C.; Biallek, M.; Rosel, F.; Jonat, W.; Maass, N. Leucine-zipper protein, LDOC1, inhibits NF-kappaB activation and sensitizes pancreatic cancer cells to apoptosis. Int. J. Cancer 2003, 105, 454–458. [Google Scholar] [CrossRef]
- Joehanes, R.; Just, A.C.; Marioni, R.E.; Pilling, L.C.; Reynolds, L.M.; Mandaviya, P.R.; Guan, W.; Xu, T.; Elks, C.E.; Aslibekyan, S.; et al. Epigenetic Signatures of Cigarette Smoking. Circ. Cardiovasc. Genet. 2016, 9, 436–447. [Google Scholar] [CrossRef]
- Peng, C.H.; Liao, C.T.; Peng, S.C.; Chen, Y.J.; Cheng, A.J.; Juang, J.L.; Tsai, C.Y.; Chen, T.C.; Chuang, Y.J.; Tang, C.Y.; et al. A novel molecular signature identified by systems genetics approach predicts prognosis in oral squamous cell carcinoma. PLoS ONE 2011, 6, e23452. [Google Scholar] [CrossRef] [PubMed]
- Mishra, R. Glycogen synthase kinase 3 beta: Can it be a target for oral cancer. Mol. Cancer 2010, 9, 144. [Google Scholar] [CrossRef]
- Wang, H.; Brown, J.; Martin, M. Glycogen synthase kinase 3: A point of convergence for the host inflammatory response. Cytokine 2011, 53, 130–140. [Google Scholar] [CrossRef] [PubMed]
- Cortes-Vieyra, R.; Bravo-Patino, A.; Valdez-Alarcon, J.J.; Juarez, M.C.; Finlay, B.B.; Baizabal-Aguirre, V.M. Role of glycogen synthase kinase-3 beta in the inflammatory response caused by bacterial pathogens. J. Inflamm. 2012, 9, 23. [Google Scholar] [CrossRef]
- McCubrey, J.A.; Steelman, L.S.; Bertrand, F.E.; Davis, N.M.; Abrams, S.L.; Montalto, G.; D’Assoro, A.B.; Libra, M.; Nicoletti, F.; Maestro, R.; et al. Multifaceted roles of GSK-3 and Wnt/beta-catenin in hematopoiesis and leukemogenesis: Opportunities for therapeutic intervention. Leukemia 2014, 28, 15–33. [Google Scholar] [CrossRef] [PubMed]
- McCubrey, J.A.; Steelman, L.S.; Bertrand, F.E.; Davis, N.M.; Sokolosky, M.; Abrams, S.L.; Montalto, G.; D’Assoro, A.B.; Libra, M.; Nicoletti, F.; et al. GSK-3 as potential target for therapeutic intervention in cancer. Oncotarget 2014, 5, 2881–2911. [Google Scholar] [CrossRef]
- Beurel, E.; Michalek, S.M.; Jope, R.S. Innate and adaptive immune responses regulated by glycogen synthase kinase-3 (GSK3). Trends Immunol. 2010, 31, 24–31. [Google Scholar] [CrossRef]
- Munoz-Fontela, C.; Mandinova, A.; Aaronson, S.A.; Lee, S.W. Emerging roles of p53 and other tumour-suppressor genes in immune regulation. Nat. Rev. Immunol. 2016, 16, 741–750. [Google Scholar] [CrossRef]
- Sopori, M. Effects of cigarette smoke on the immune system. Nat. Rev. Immunol. 2002, 2, 372–377. [Google Scholar] [CrossRef]
- Swatek, K.N.; Komander, D. Ubiquitin modifications. Cell Res. 2016, 26, 399–422. [Google Scholar] [CrossRef]
- Yang, W.L.; Wang, J.; Chan, C.H.; Lee, S.W.; Campos, A.D.; Lamothe, B.; Hur, L.; Grabiner, B.C.; Lin, X.; Darnay, B.G.; et al. The E3 ligase TRAF6 regulates Akt ubiquitination and activation. Science 2009, 325, 1134–1138. [Google Scholar] [CrossRef] [PubMed]
- Bae, S.; Kim, S.Y.; Jung, J.H.; Yoon, Y.; Cha, H.J.; Lee, H.; Kim, K.; Kim, J.; An, I.S.; Kim, J.; et al. Akt is negatively regulated by the MULAN E3 ligase. Cell Res. 2012, 22, 873–885. [Google Scholar] [CrossRef] [PubMed]
- Toker, A. TTC3 ubiquitination terminates Akt-ivation. Dev. Cell 2009, 17, 752–754. [Google Scholar] [CrossRef]
- Fang, D.; Liu, Y.C. Proteolysis-independent regulation of PI3K by Cbl-b-mediated ubiquitination in T cells. Nat. Immunol. 2001, 2, 870–875. [Google Scholar] [CrossRef] [PubMed]
- Wang, Z.; Dang, T.; Liu, T.; Chen, S.; Li, L.; Huang, S.; Fang, M. NEDD4L Protein Catalyzes Ubiquitination of PIK3CA Protein and Regulates PI3K-AKT Signaling. J. Biol. Chem. 2016, 291, 17467–17477. [Google Scholar] [CrossRef]
- Schroder, K.; Tschopp, J. The inflammasomes. Cell 2010, 140, 821–832. [Google Scholar] [CrossRef]
- Juliana, C.; Fernandes-Alnemri, T.; Kang, S.; Farias, A.; Qin, F.; Alnemri, E.S. Non-transcriptional priming and deubiquitination regulate NLRP3 inflammasome activation. J. Biol. Chem. 2012, 287, 36617–36622. [Google Scholar] [CrossRef]
- Py, B.F.; Kim, M.S.; Vakifahmetoglu-Norberg, H.; Yuan, J. Deubiquitination of NLRP3 by BRCC3 critically regulates inflammasome activity. Mol. Cell 2013, 49, 331–338. [Google Scholar] [CrossRef]
- Palazon-Riquelme, P.; Worboys, J.D.; Green, J.; Valera, A.; Martin-Sanchez, F.; Pellegrini, C.; Brough, D.; Lopez-Castejon, G. USP7 and USP47 deubiquitinases regulate NLRP3 inflammasome activation. EMBO Rep. 2018, 19, e44766. [Google Scholar] [CrossRef]
- Wertz, I.E.; Dixit, V.M. Signaling to NF-kappaB: Regulation by ubiquitination. Cold Spring Harb. Perspect. Biol. 2010, 2, a003350. [Google Scholar] [CrossRef]
- Pendrak, M.L.; Roberts, D.D. Ribosomal RNA processing in Candida albicans. RNA 2011, 17, 2235–2248. [Google Scholar] [CrossRef] [PubMed]


| Group (n) | No. (%) of Biopsies | ||||||
|---|---|---|---|---|---|---|---|
| Normal | Squamous Hyperplasia | Mild Dysplasia | Moderate Dysplasia | Severe Dysplasia | Squamous Cell Carcinoma | Survival * | |
| C0F− (5) | 5 (100%) | 0 | 0 | 0 | 0 | 0 | 5 (100%) |
| C0F+ (5) | 0 | 0 | 0 | 3 (60%) | 2 (40%) | 0 | 5 (100%) |
| C8F− (10) | 0 | 0 | 3 (30%) | 1 (10%) | 2 (20%) | 4 (40%) | 8 (80%) |
| C8F+ (10) | 0 | 0 | 0 | 2 (20%) | 5 (50%) | 3 (30%) | 8 (80%) |
| C10F− (10) | 0 | 0 | 0 | 3 (30%) | 4 (40%) | 3 (30%) | 9 (90%) |
| C10F+ (10) | 0 | 0 | 0 | 0 | 1 (10%) | 9 (90%) | 10 (100%) |
Publisher’s Note: MDPI stays neutral with regard to jurisdictional claims in published maps and institutional affiliations. |
© 2020 by the authors. Licensee MDPI, Basel, Switzerland. This article is an open access article distributed under the terms and conditions of the Creative Commons Attribution (CC BY) license (http://creativecommons.org/licenses/by/4.0/).
Share and Cite
Lee, C.-H.; Hung, P.-F.; Liu, K.-J.; Chung, H.-L.; Yang, W.-C.; Hsu, K.-C.; Fong, T.-H.; Lo, H.-J.; Chen, Y.-P.; Yang, J.-R.; et al. LDOC1 Suppresses Microbe-Induced Production of IL-1β in Human Normal and Cancerous Oral Cells through the PI3K/Akt/GSK-3β Axis. Cancers 2020, 12, 3148. https://doi.org/10.3390/cancers12113148
Lee C-H, Hung P-F, Liu K-J, Chung H-L, Yang W-C, Hsu K-C, Fong T-H, Lo H-J, Chen Y-P, Yang J-R, et al. LDOC1 Suppresses Microbe-Induced Production of IL-1β in Human Normal and Cancerous Oral Cells through the PI3K/Akt/GSK-3β Axis. Cancers. 2020; 12(11):3148. https://doi.org/10.3390/cancers12113148
Chicago/Turabian StyleLee, Chia-Huei, Pin-Feng Hung, Ko-Jiunn Liu, Hsuan-Lien Chung, Wen-Chan Yang, Kai-Cheng Hsu, Tsorng-Harn Fong, Hsiu-Jung Lo, Ya-Ping Chen, Ji-Rui Yang, and et al. 2020. "LDOC1 Suppresses Microbe-Induced Production of IL-1β in Human Normal and Cancerous Oral Cells through the PI3K/Akt/GSK-3β Axis" Cancers 12, no. 11: 3148. https://doi.org/10.3390/cancers12113148
APA StyleLee, C.-H., Hung, P.-F., Liu, K.-J., Chung, H.-L., Yang, W.-C., Hsu, K.-C., Fong, T.-H., Lo, H.-J., Chen, Y.-P., Yang, J.-R., & Yen, C.-Y. (2020). LDOC1 Suppresses Microbe-Induced Production of IL-1β in Human Normal and Cancerous Oral Cells through the PI3K/Akt/GSK-3β Axis. Cancers, 12(11), 3148. https://doi.org/10.3390/cancers12113148