CD73 Overexpression Promotes Progression and Recurrence of Papillary Thyroid Carcinoma

 , ,
, ,  and
and 
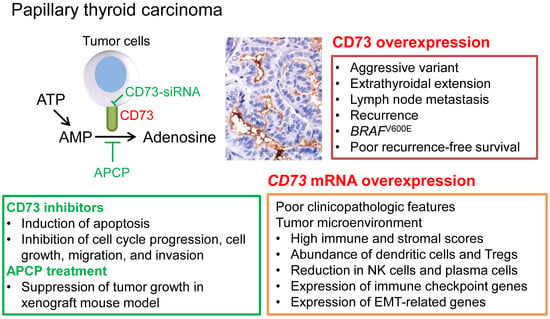
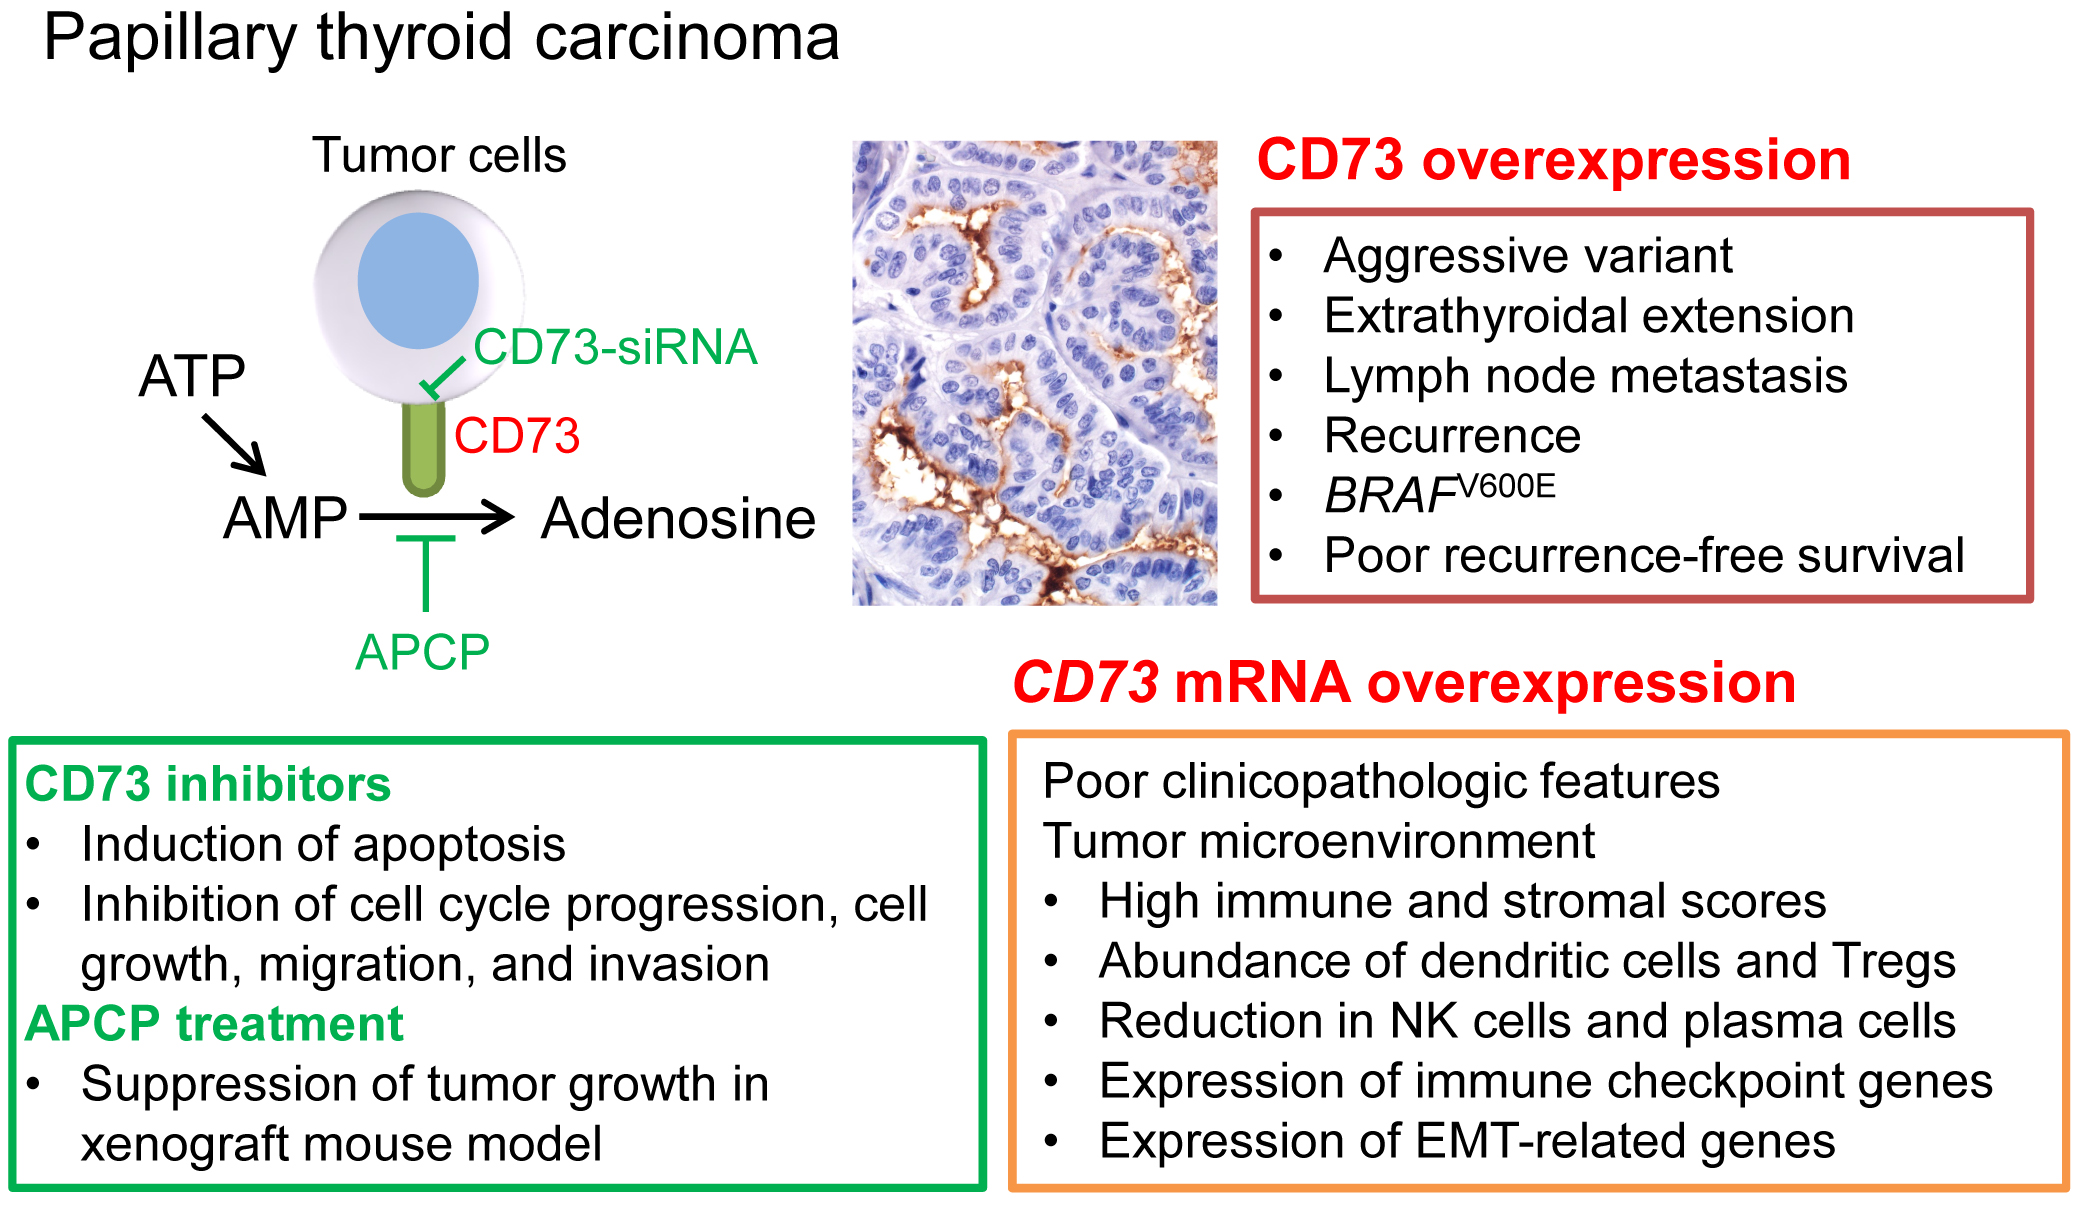
Simple Summary
Abstract
1. Introduction
2. Results
2.1. Baseline Characteristics
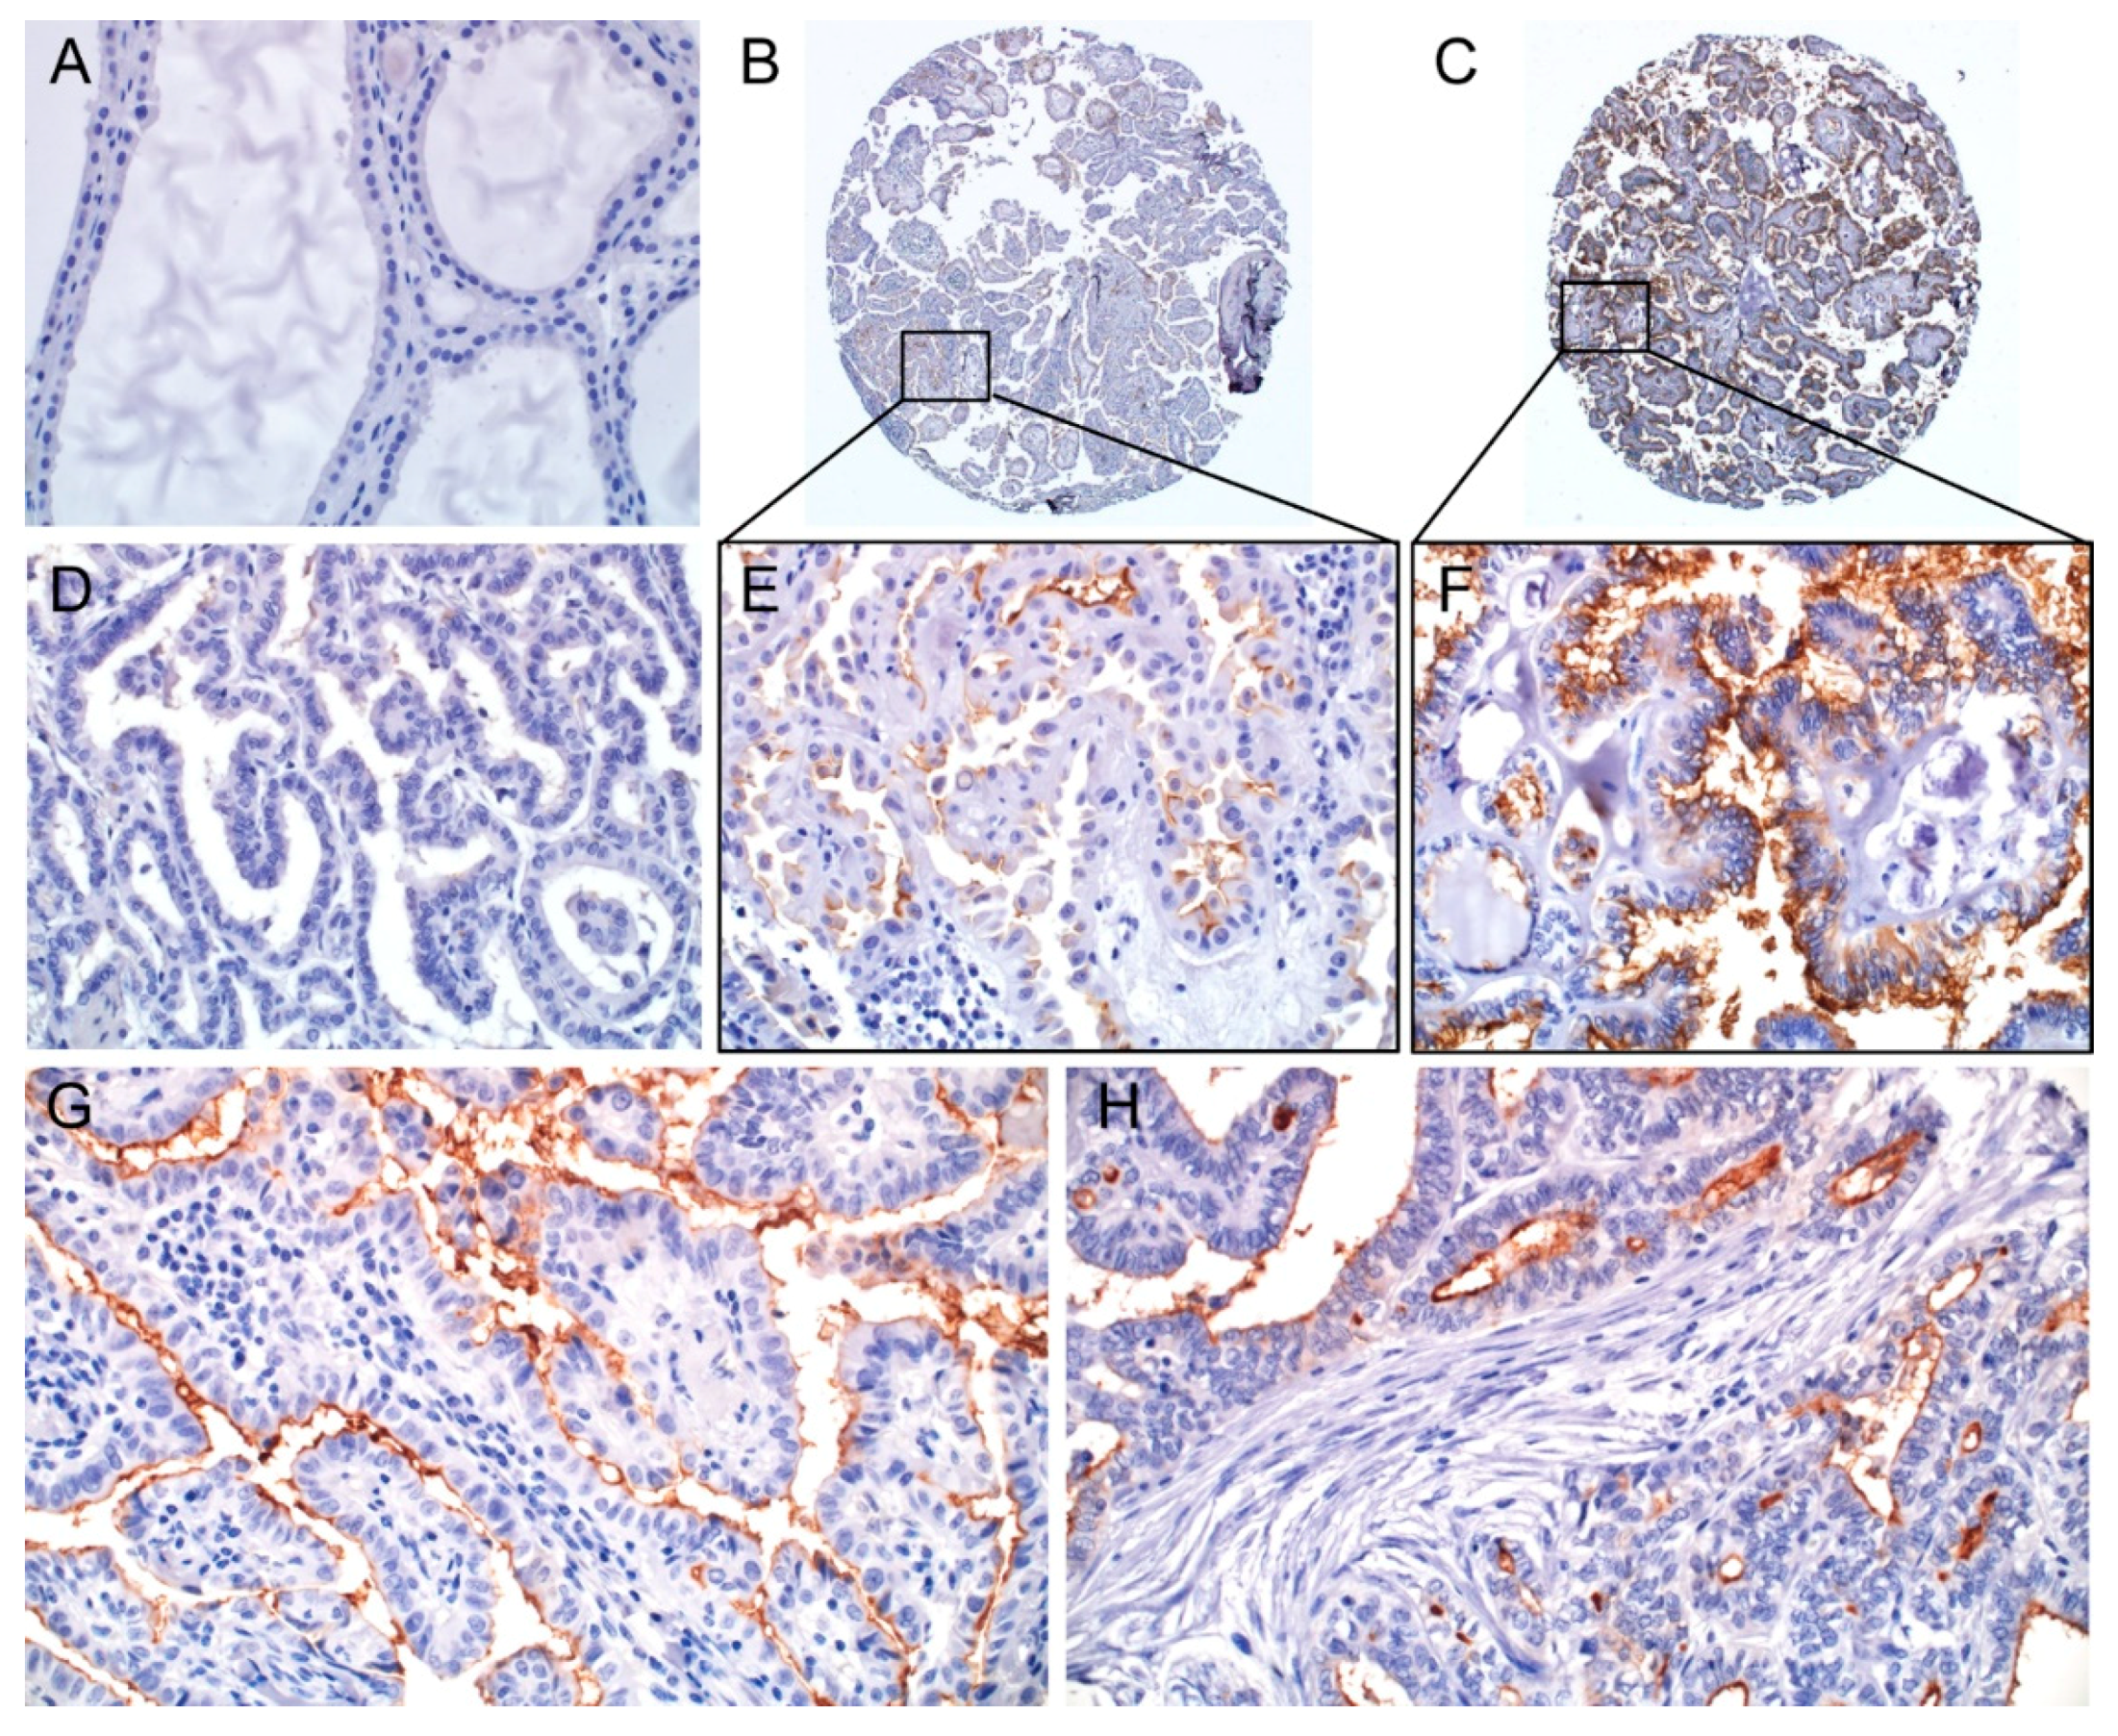
2.2. Clinicopathologic Significance of CD73 Expression
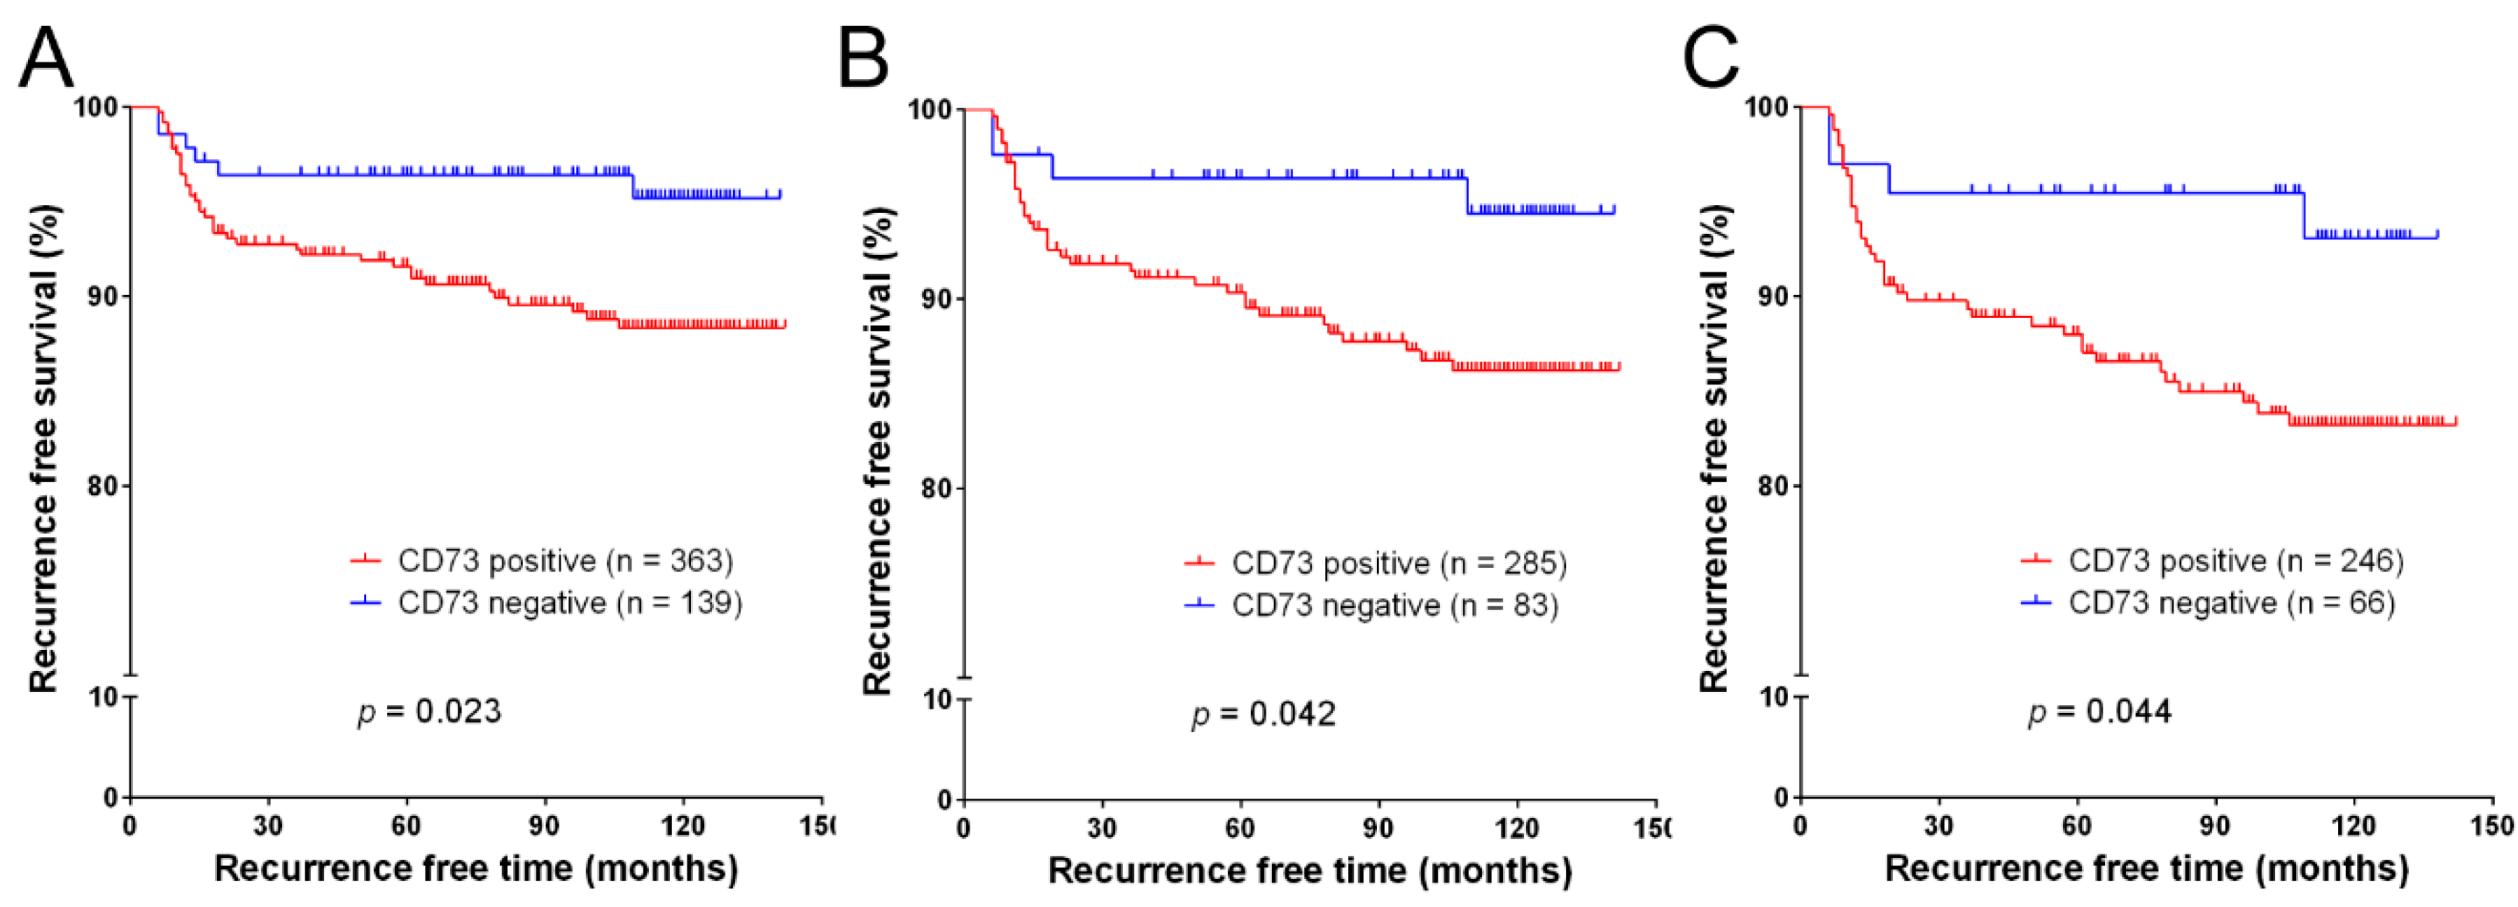
2.3. Recurrence-Free Survival
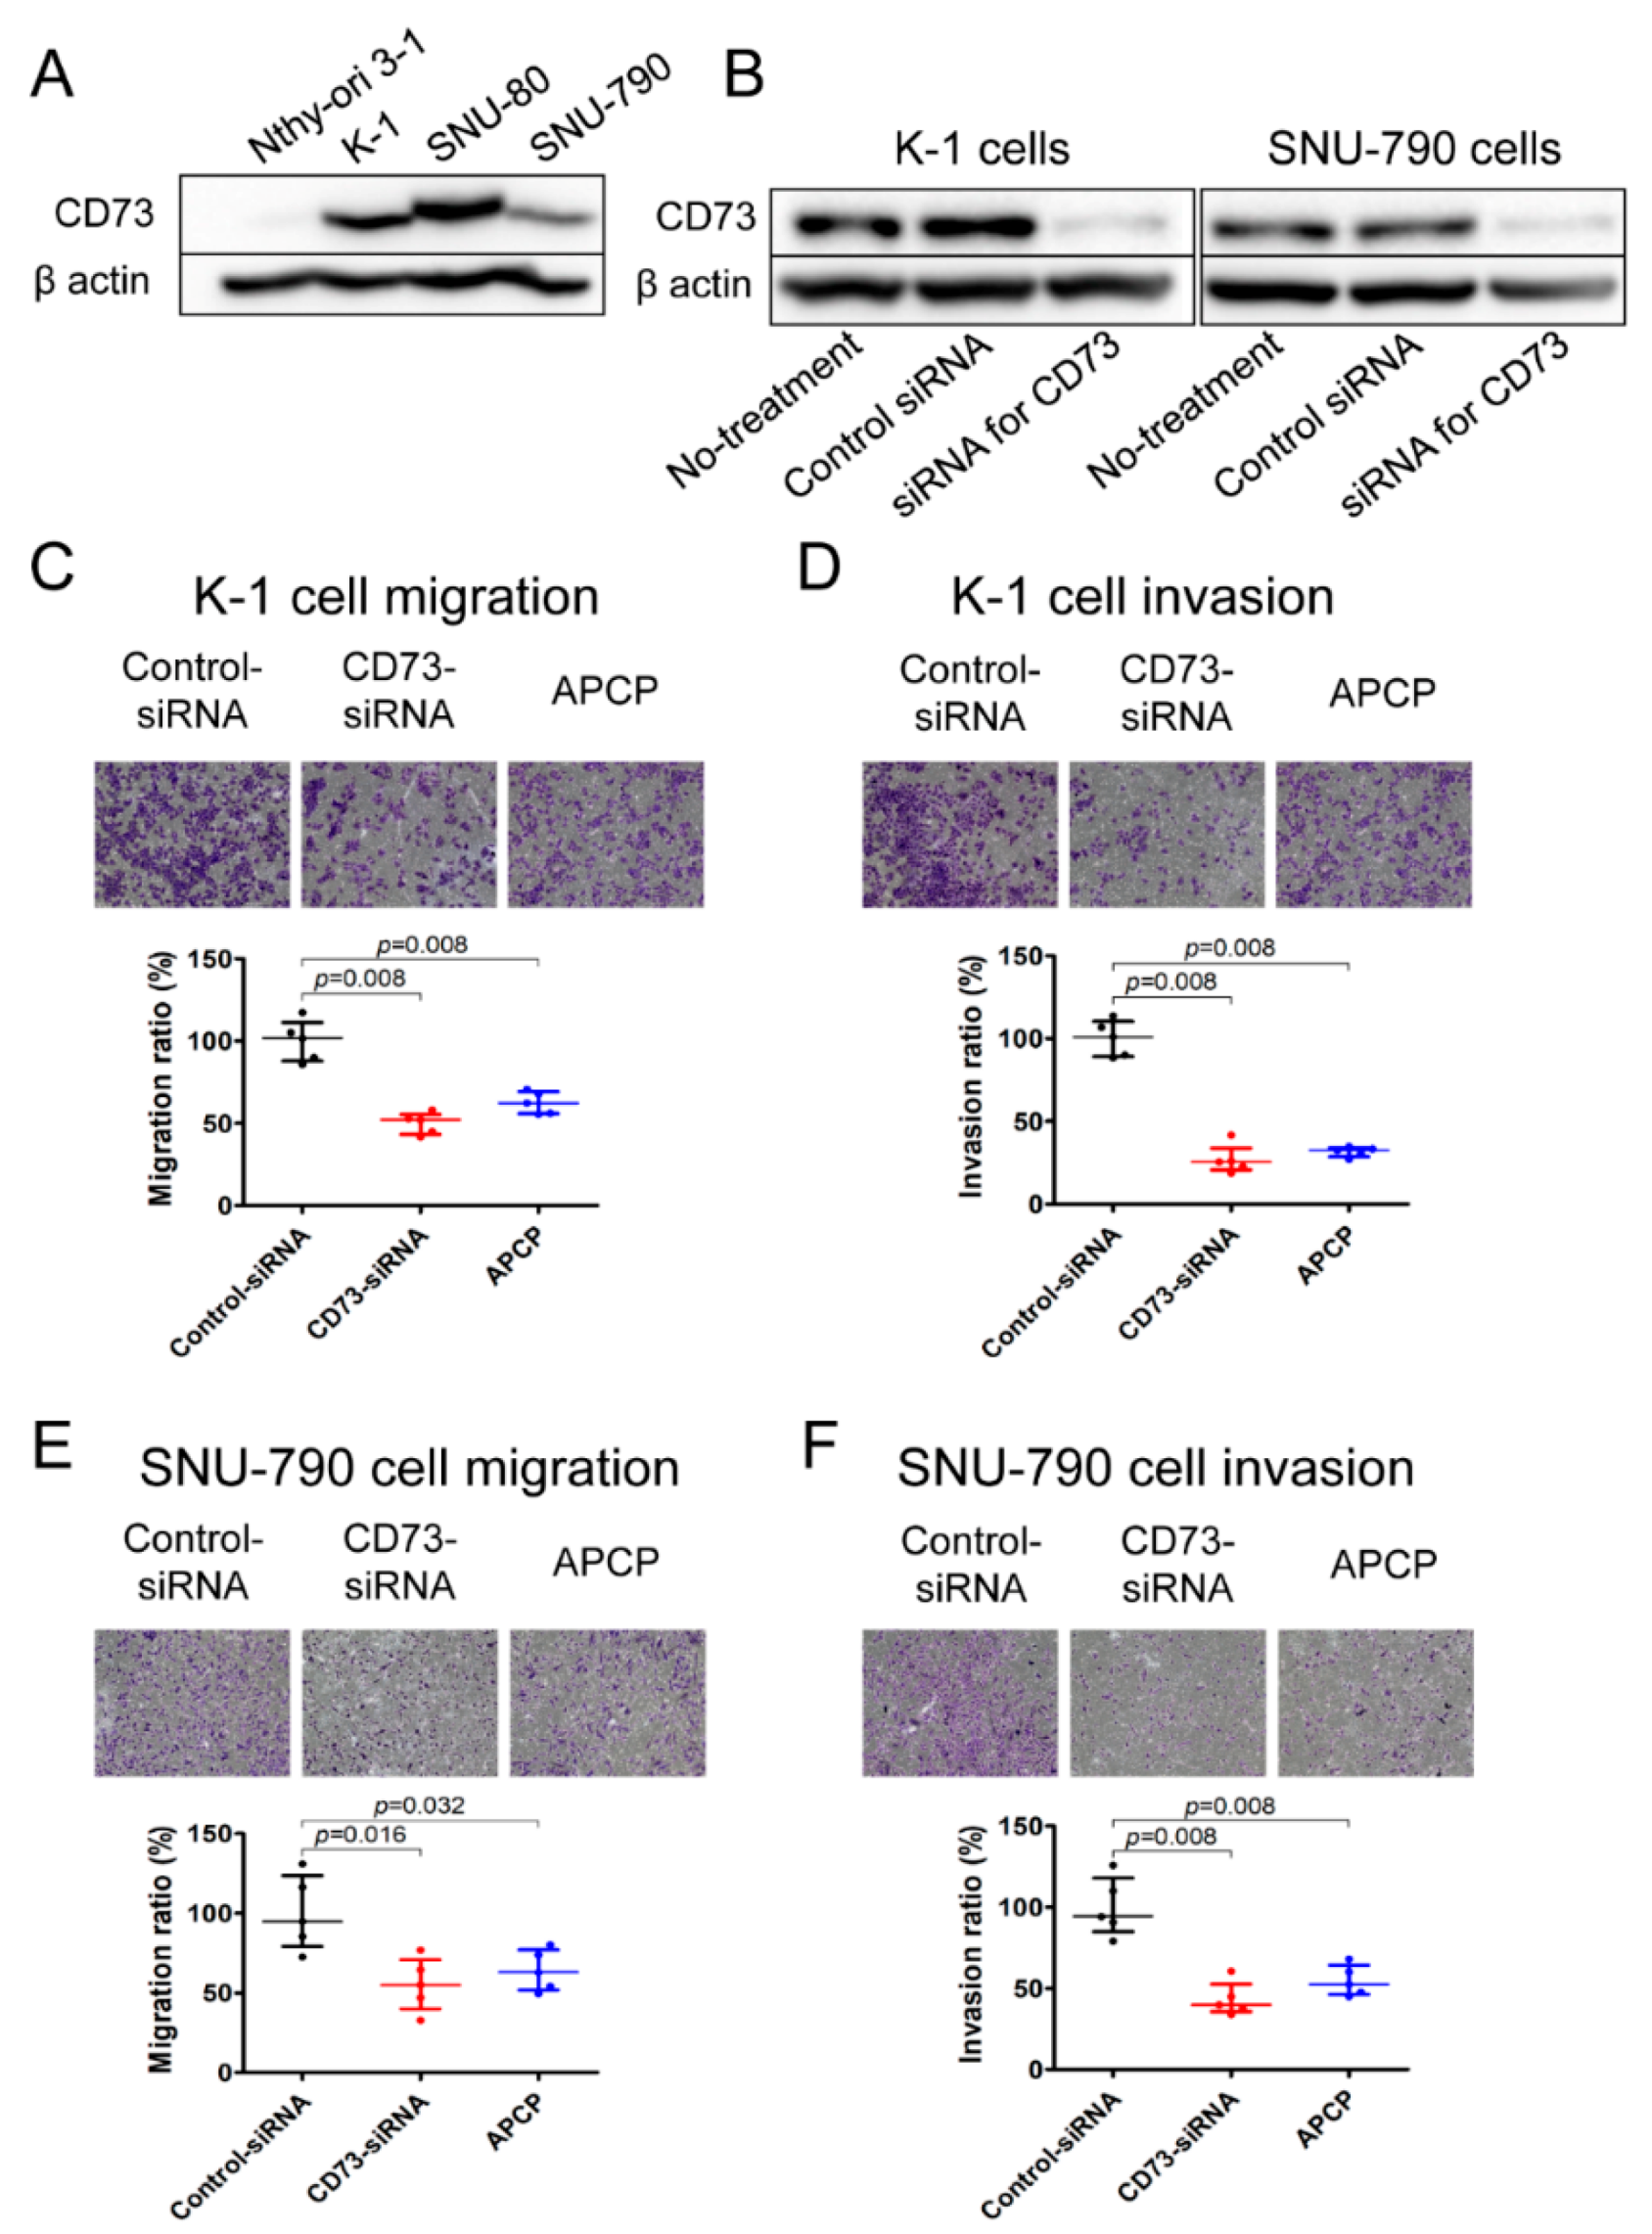
2.4. Downregulation of CD73 Reduces Migration and Invasion of PTC Cells
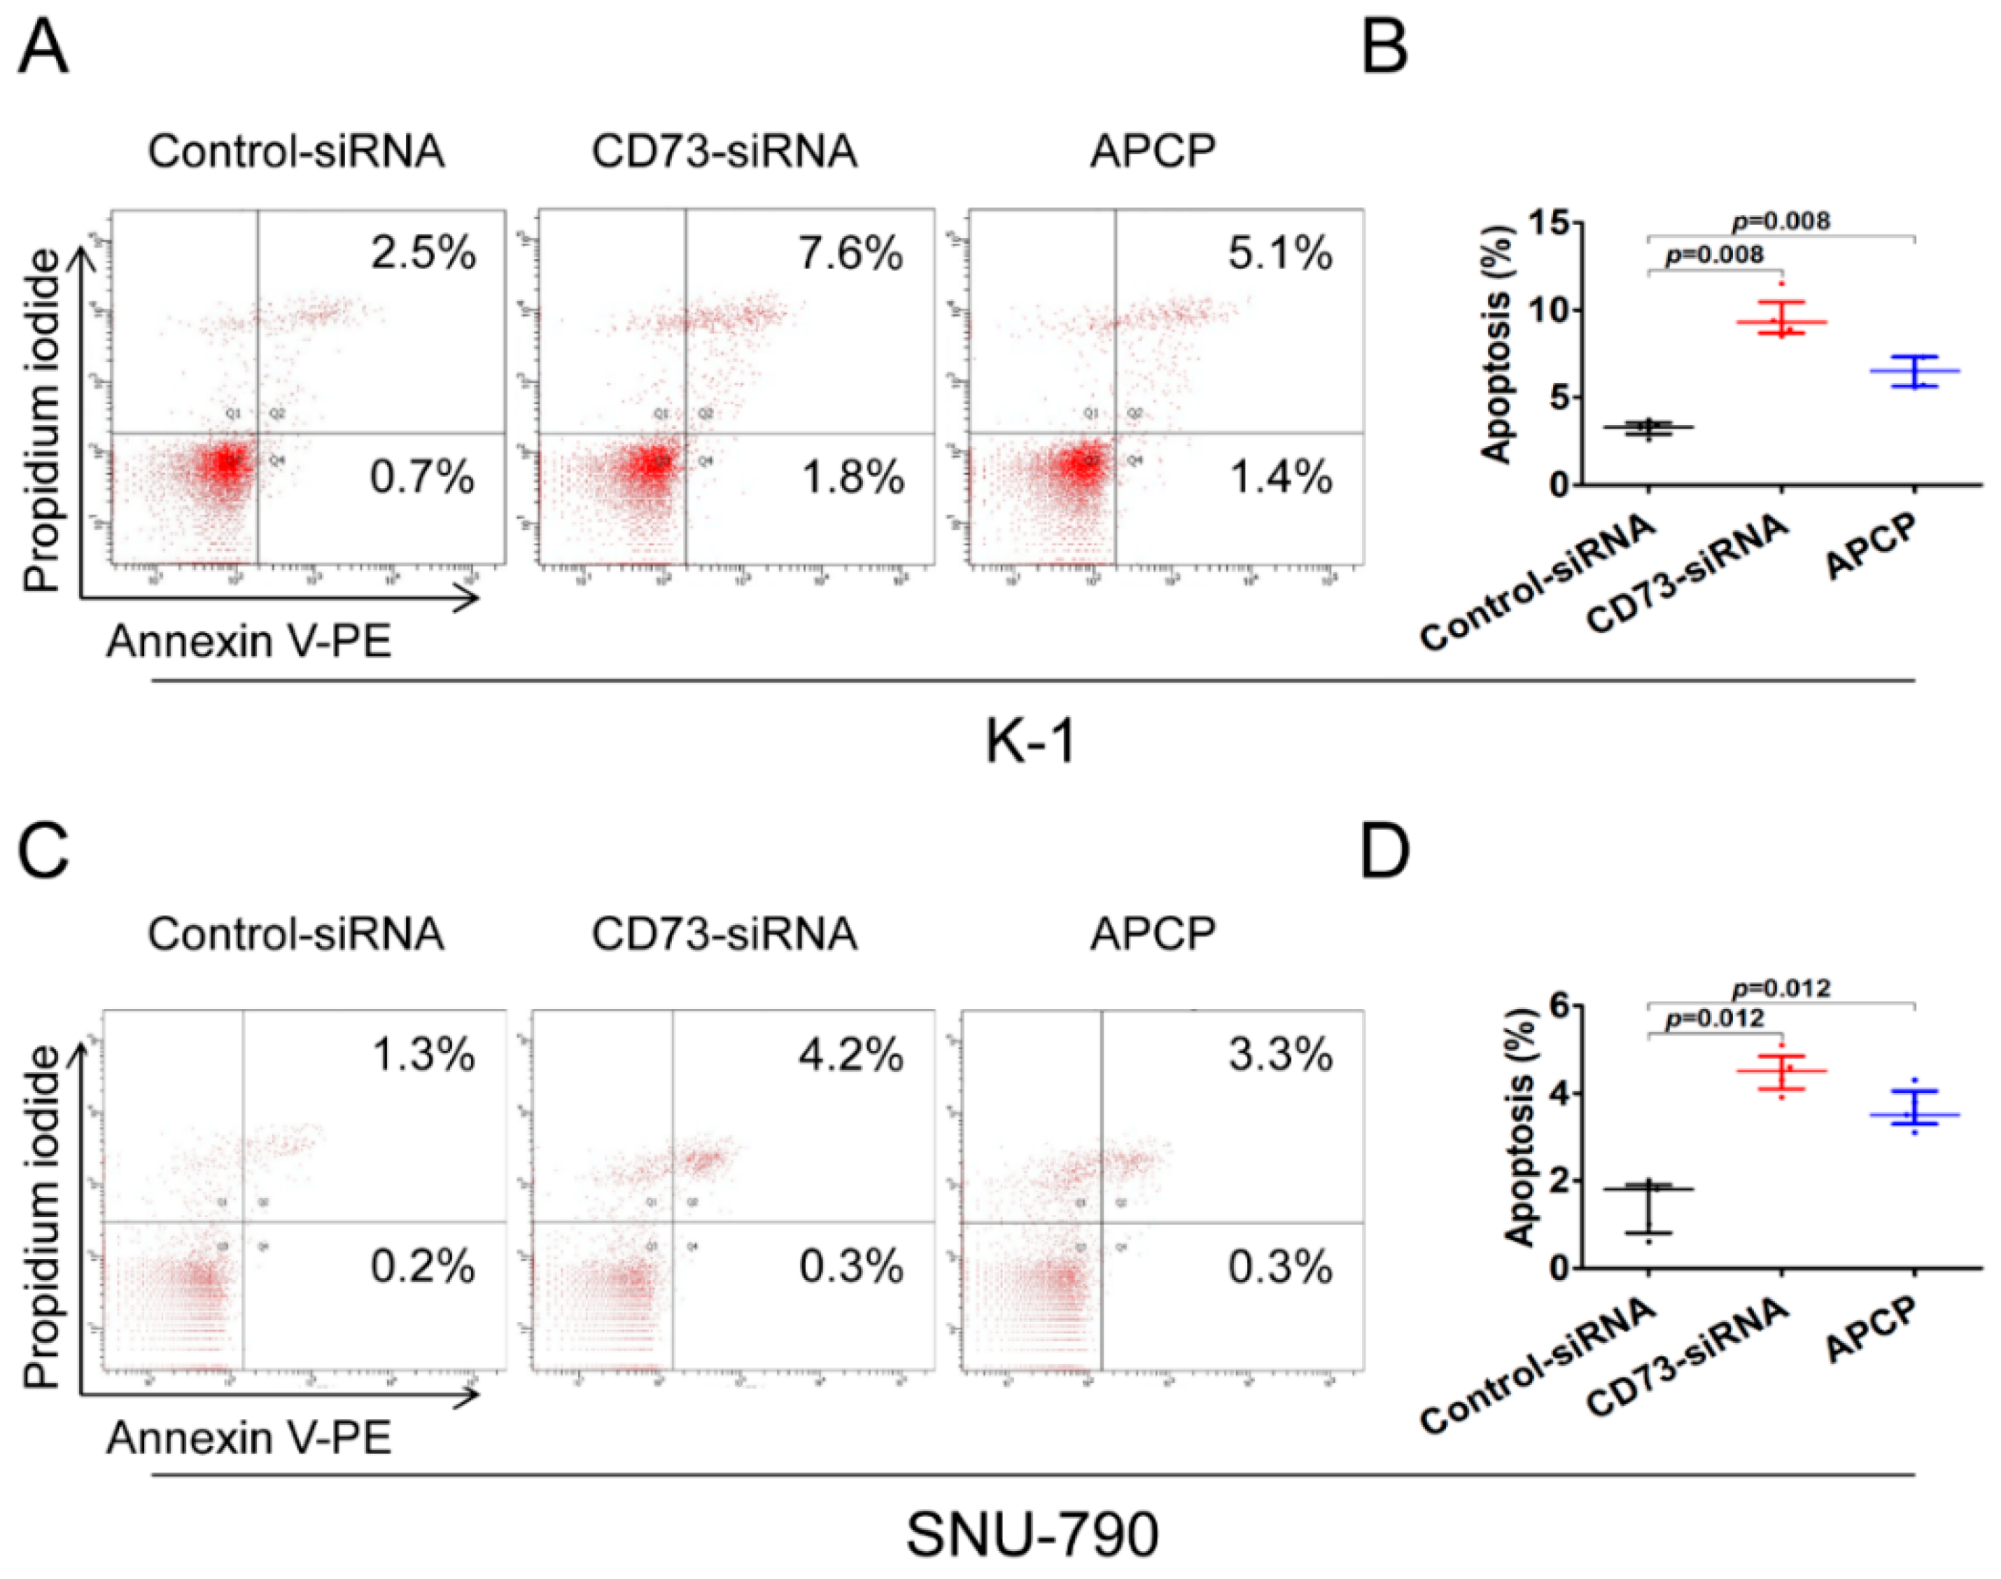
2.5. Downregulation of CD73 Expression Induces Apoptosis in PTC Cells
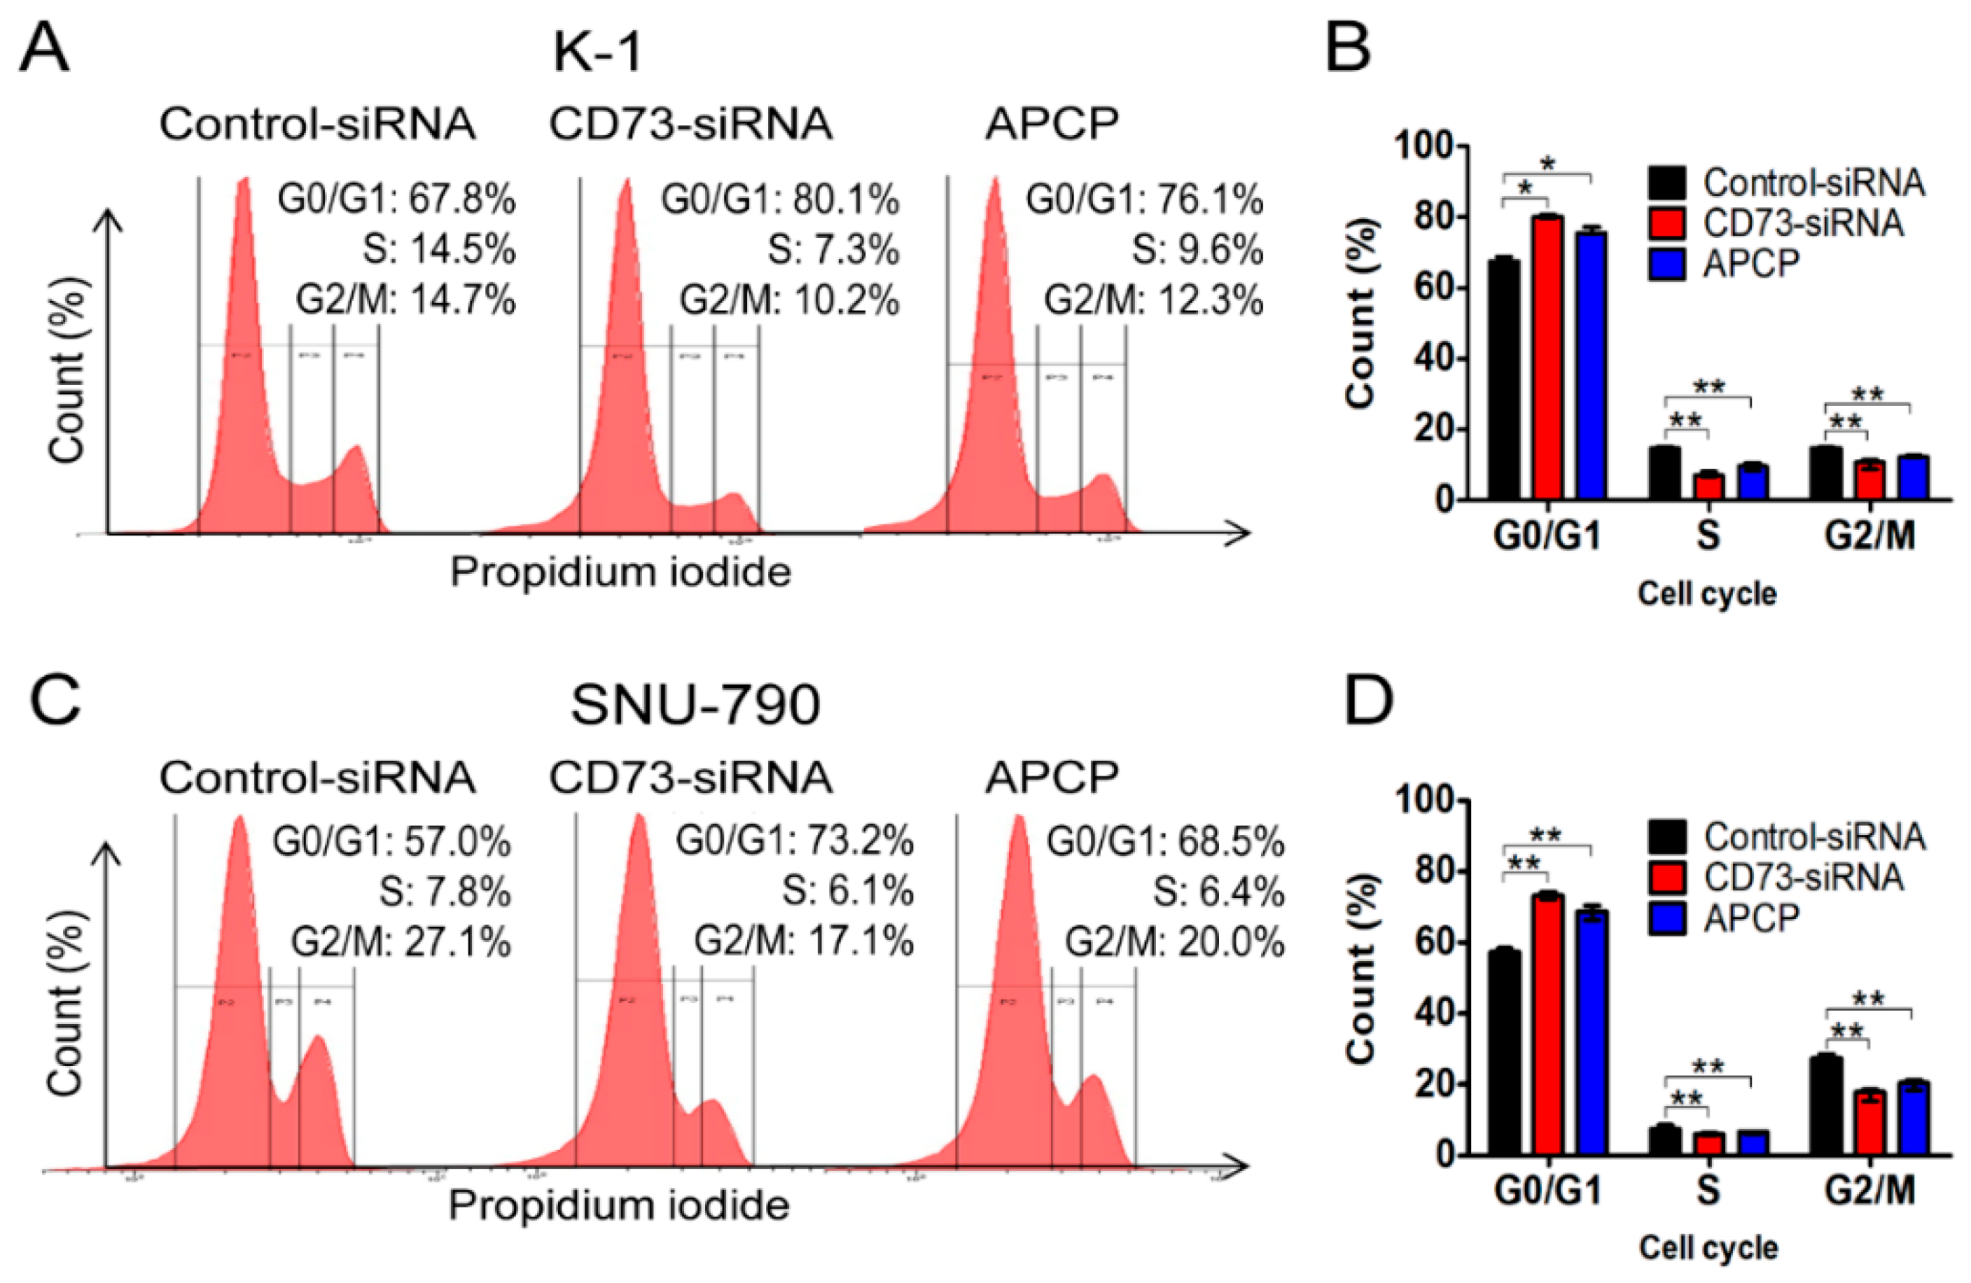
2.6. Downregulation of CD73 Arrests Cell Cycle Progression in PTC Cells
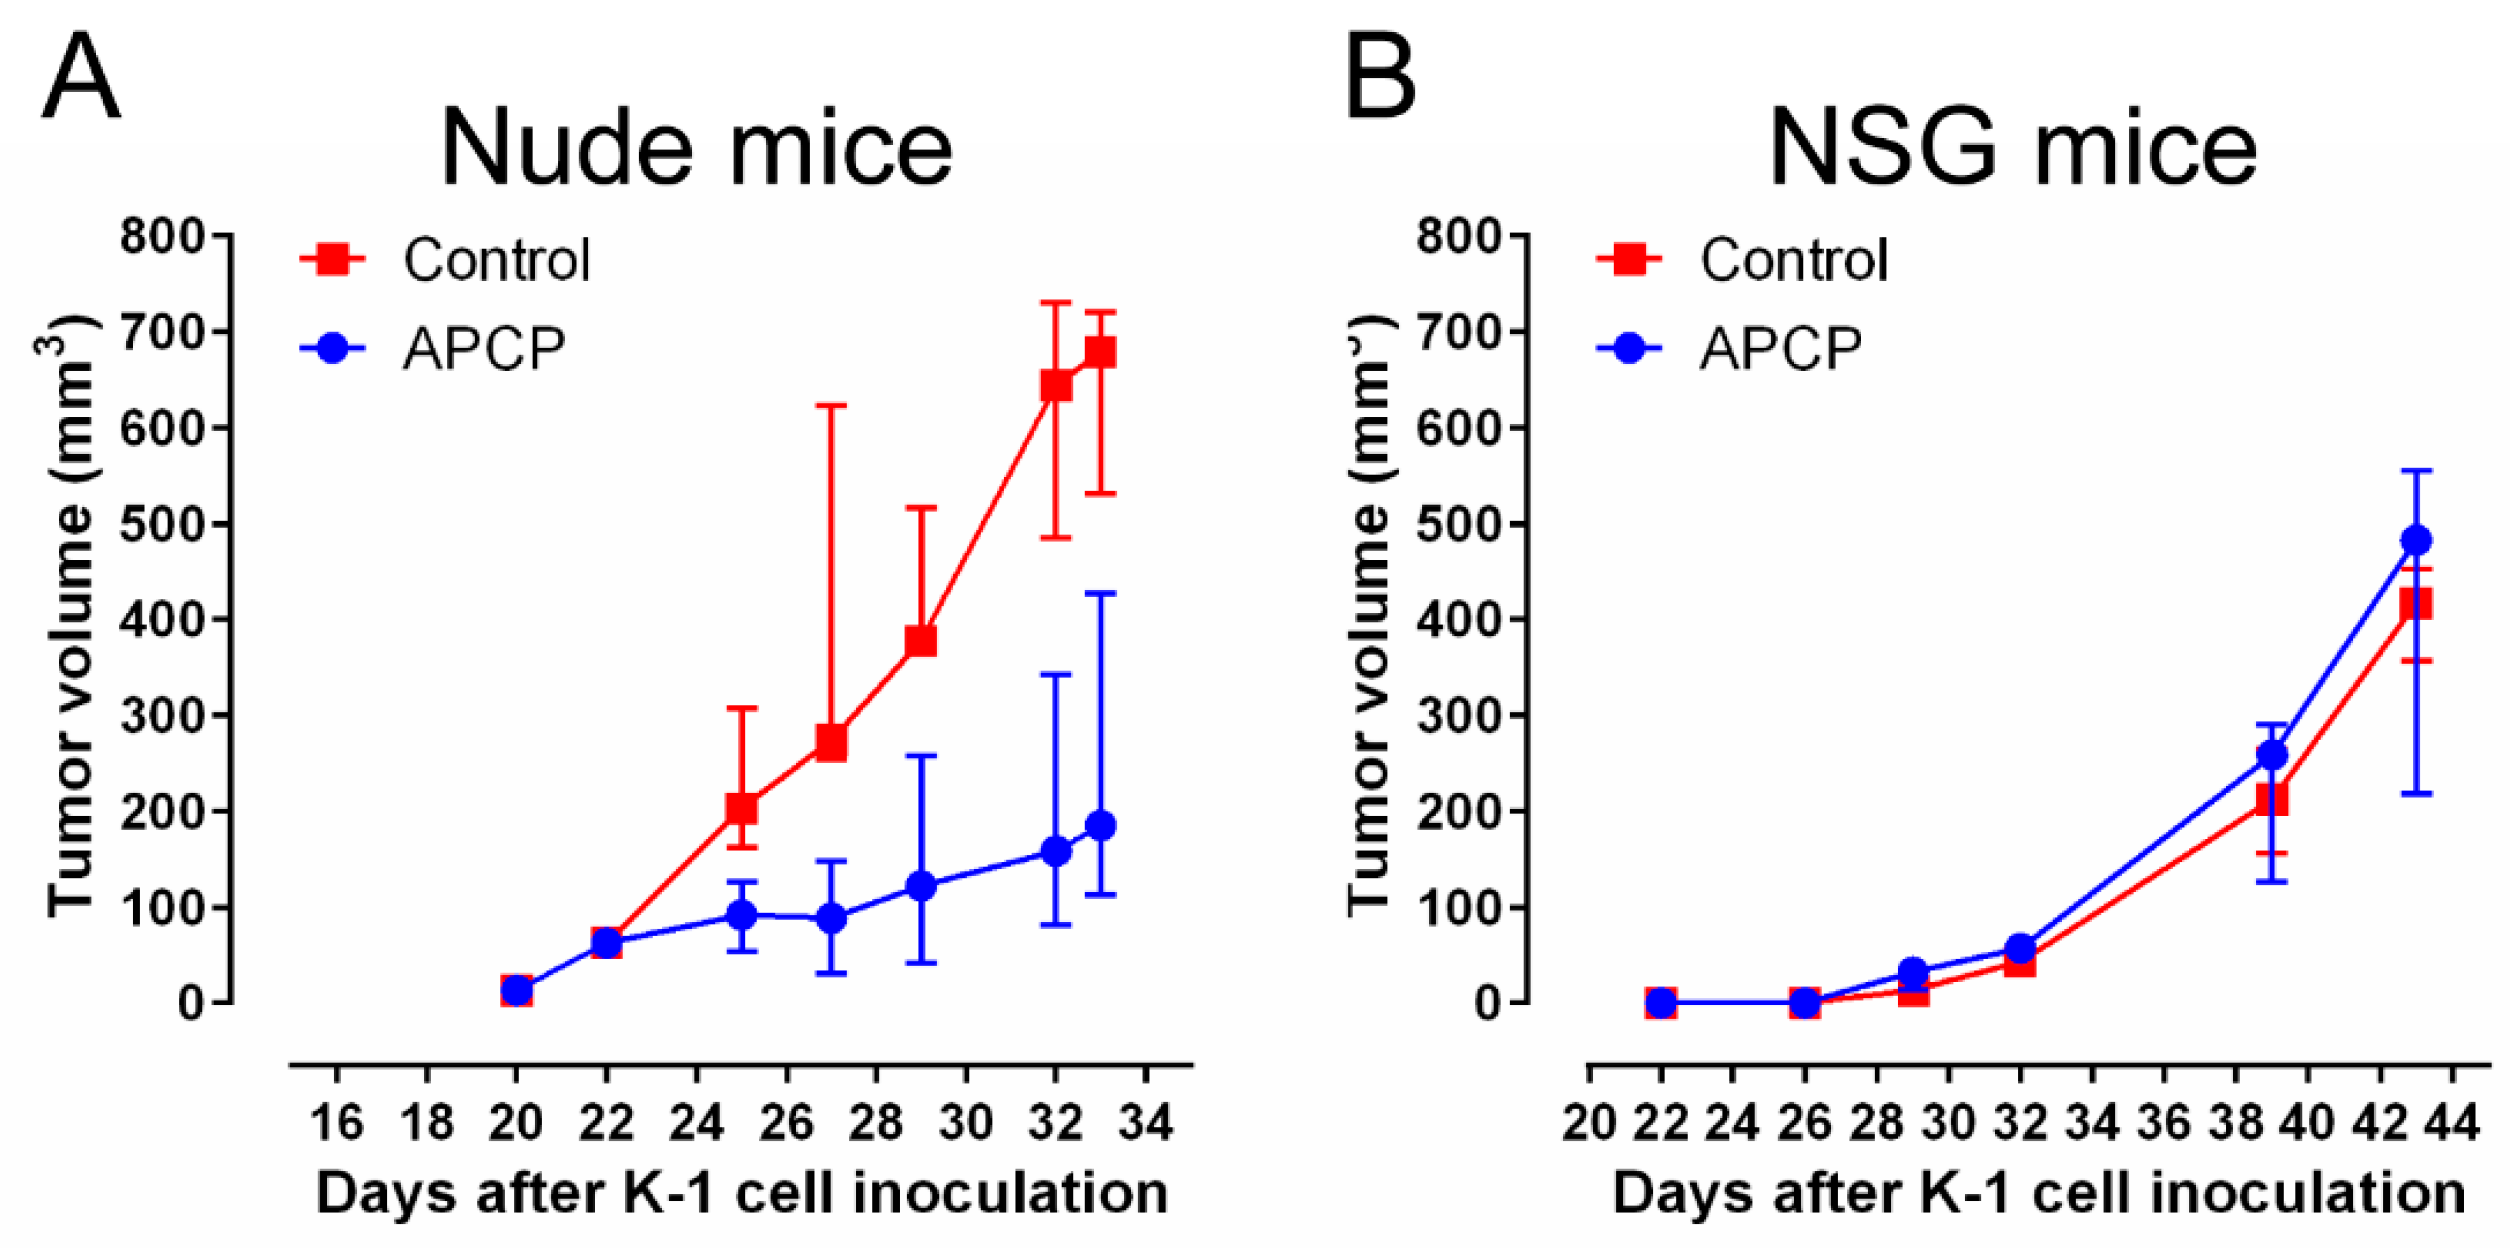
2.7. CD73 Inhibition Suppresses Growth of PTC Cell Line-Derived Xenograft in Nude Mice
2.8. Clinicopathologic Significance of CD73 (NT5E) mRNA Expression in TCGA Dataset
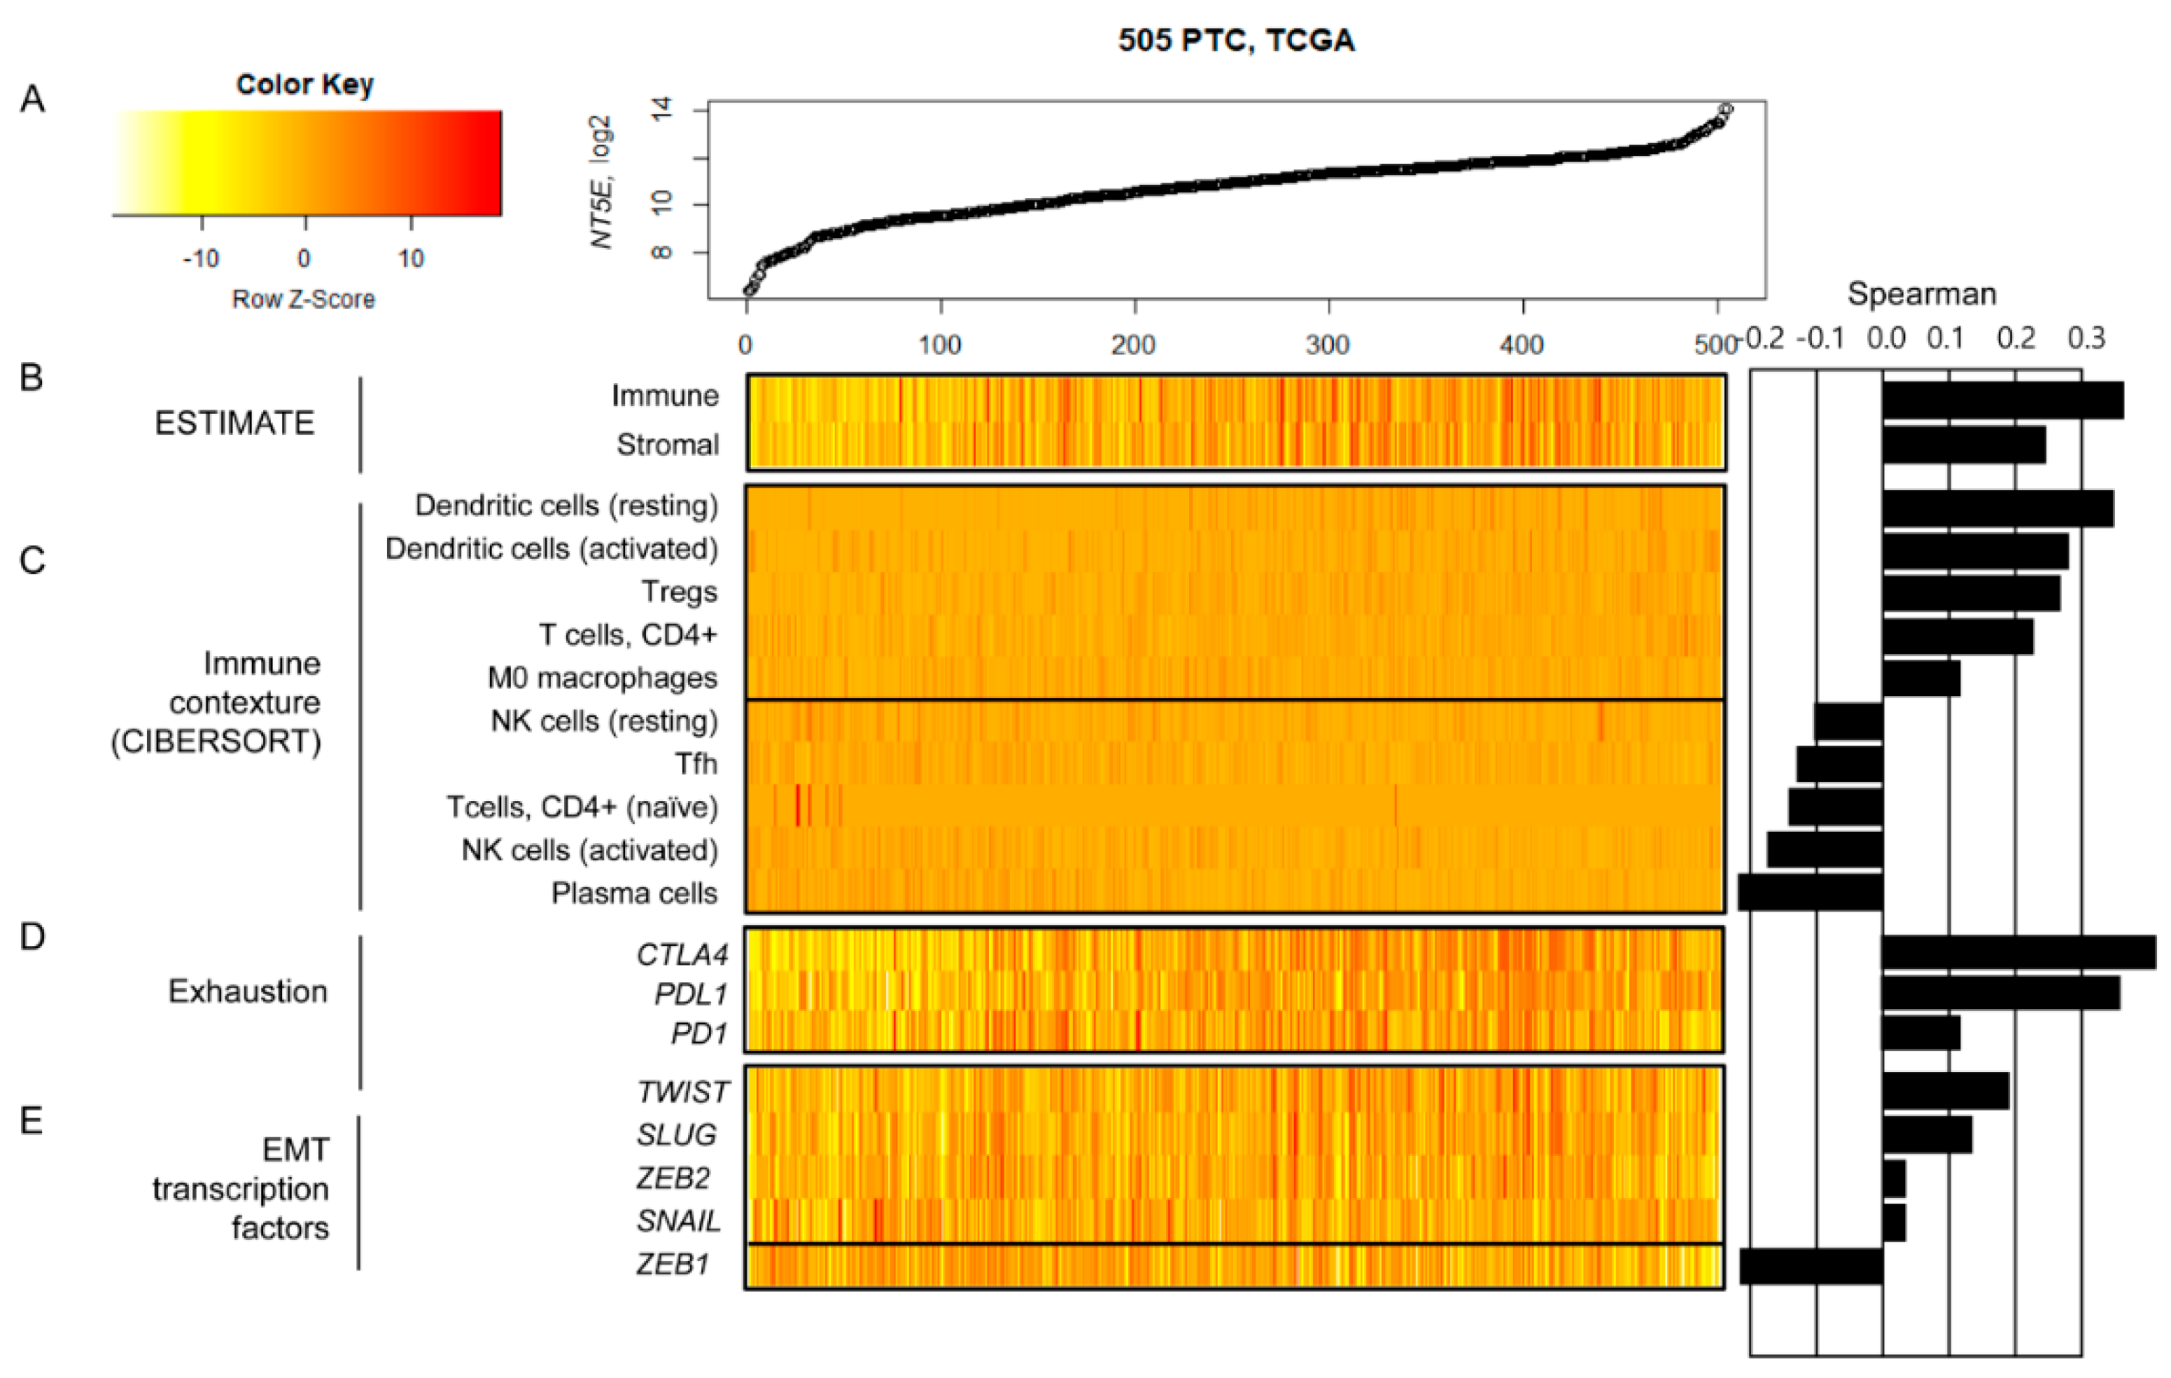
2.9. Relationship between CD73 (NT5E) mRNA Expression and Tumor Microenvironment in TCGA Dataset
3. Discussion
4. Materials and Methods
4.1. Patients
4.2. Tissue Microarray
4.3. Immunohistochemistry
4.4. BRAF Sanger Sequencing
4.5. Cell Lines and Cell Culture
4.6. Western Blot Analysis
4.7. CD73 Inhibitor and siRNA
4.8. Transwell Invasion and Migration Assays
4.9. Flow Cytometry for the Analysis of Apoptosis
4.10. Flow Cytometry Analysis for Cell Cycle
4.11. Xenograft Mice
4.12. The Cancer Genome Atlas (TCGA) Data Analysis
4.13. Statistical Analysis
5. Conclusions
Supplementary Materials
Author Contributions
Funding
Conflicts of Interest
References
- Haugen, B.R.; Alexander, E.K.; Bible, K.C.; Doherty, G.M.; Mandel, S.J.; Nikiforov, Y.E.; Pacini, F.; Randolph, G.W.; Sawka, A.M.; Schlumberger, M.; et al. 2015 American Thyroid Association Management Guidelines for Adult Patients with Thyroid Nodules and Differentiated Thyroid Cancer: The American Thyroid Association Guidelines Task Force on Thyroid Nodules and Differentiated Thyroid Cancer. Thyroid 2016, 26, 1–133. [Google Scholar] [CrossRef] [PubMed]
- Amin, M.B.; Edge, S.; Greene, F.; Byrd, D.R.; Brookland, R.K.; Washington, M.K.; Gershenwald, J.E.; Compton, C.C.; Hess, K.R.; Sullivan, D.C.; et al. AJCC Cancer Staging Manual, 8th ed.; Springer: New York, NY, USA, 2017; pp. 873–890. [Google Scholar]
- Hong, S.; Won, Y.J.; Park, Y.R.; Jung, K.W.; Kong, H.J.; Lee, E.S.; The Community of Population-Based Regional Cancer Registries. Cancer Statistics in Korea: Incidence, Mortality, Survival, and Prevalence in 2017. Cancer Res. Treat. 2020, 52, 335–350. [Google Scholar] [CrossRef] [PubMed]
- Kim, W.B.; Jeon, M.J.; Kim, W.G.; Kim, T.Y.; Shong, Y.K. Unmet Clinical Needs in the Treatment of Patients with Thyroid Cancer. Endocrinol. Metab. 2020, 35, 14–25. [Google Scholar] [CrossRef] [PubMed]
- Lucchetti, D.; Ricciardi Tenore, C.; Colella, F.; Sgambato, A. Extracellular Vesicles and Cancer: A Focus on Metabolism, Cytokines, and Immunity. Cancers 2020, 12, 171. [Google Scholar] [CrossRef]
- Korneev, K.V.; Atretkhany, K.N.; Drutskaya, M.S.; Grivennikov, S.I.; Kuprash, D.V.; Nedospasov, S.A. TLR-signaling and proinflammatory cytokines as drivers of tumorigenesis. Cytokine 2017, 89, 127–135. [Google Scholar] [CrossRef]
- Zahavi, D.J.; Weiner, L.M. Chapter Three—Tumor mechanisms of resistance to immune attack. In Progress in Molecular Biology and Translational Science; Teplow, D.B., Ed.; Elsevier: Amsterdam, The Netherlands, 2019; Volume 164, pp. 61–100. [Google Scholar]
- Su, M.-J.; Parayath, N.N.; Amiji, M.M. 11—Exosome-Mediated Communication in the Tumor Microenvironment. In Diagnostic and Therapeutic Applications of Exosomes in Cancer; Amiji, M., Ramesh, R., Eds.; Elsevier: Amsterdam, The Netherlands, 2018; pp. 187–218. [Google Scholar] [CrossRef]
- Poltavets, V.; Kochetkova, M.; Pitson, S.M.; Samuel, M.S. The Role of the Extracellular Matrix and Its Molecular and Cellular Regulators in Cancer Cell Plasticity. Front. Oncol. 2018, 8, 431. [Google Scholar] [CrossRef]
- Whiteside, T.L. Targeting adenosine in cancer immunotherapy: A review of recent progress. Expert Rev. Anticancer Ther. 2017, 17, 527–535. [Google Scholar] [CrossRef]
- Chen, X.; Shao, H.; Zhi, Y.; Xiao, Q.; Su, C.; Dong, L.; Liu, X.; Li, X.; Zhang, X. CD73 Pathway Contributes to the Immunosuppressive Ability of Mesenchymal Stem Cells in Intraocular Autoimmune Responses. Stem Cells Dev. 2016, 25, 337–346. [Google Scholar] [CrossRef]
- Aponte, P.M.; Caicedo, A. Stemness in Cancer: Stem Cells, Cancer Stem Cells, and Their Microenvironment. Stem Cells Int. 2017, 2017, 5619472. [Google Scholar] [CrossRef]
- Lupia, M.; Angiolini, F.; Bertalot, G.; Freddi, S.; Sachsenmeier, K.F.; Chisci, E.; Kutryb-Zajac, B.; Confalonieri, S.; Smolenski, R.T.; Giovannoni, R.; et al. CD73 Regulates Stemness and Epithelial-Mesenchymal Transition in Ovarian Cancer-Initiating Cells. Stem Cell Rep. 2018, 10, 1412–1425. [Google Scholar] [CrossRef]
- Lu, X.X.; Chen, Y.T.; Feng, B.; Mao, X.B.; Yu, B.; Chu, X.Y. Expression and clinical significance of CD73 and hypoxia-inducible factor-1alpha in gastric carcinoma. World J. Gastroenterol. 2013, 19, 1912–1918. [Google Scholar] [CrossRef] [PubMed]
- Wang, L.; Tang, S.; Wang, Y.; Xu, S.; Yu, J.; Zhi, X.; Ou, Z.; Yang, J.; Zhou, P.; Shao, Z. Ecto-5′-nucleotidase (CD73) promotes tumor angiogenesis. Clin. Exp. Metastasis 2013, 30, 671–680. [Google Scholar] [CrossRef] [PubMed]
- Wu, X.R.; He, X.S.; Chen, Y.F.; Yuan, R.X.; Zeng, Y.; Lian, L.; Zou, Y.F.; Lan, N.; Wu, X.J.; Lan, P. High expression of CD73 as a poor prognostic biomarker in human colorectal cancer. J. Surg. Oncol. 2012, 106, 130–137. [Google Scholar] [CrossRef] [PubMed]
- Bertoni, A.P.S.; Bracco, P.A.; de Campos, R.P.; Lutz, B.S.; Assis-Brasil, B.M.; Meyer, E.L.S.; Saffi, J.; Braganhol, E.; Furlanetto, T.W.; Wink, M.R. Activity of ecto-5′-nucleotidase (NT5E/CD73) is increased in papillary thyroid carcinoma and its expression is associated with metastatic lymph nodes. Mol Cell Endocrinol. 2019, 479, 54–60. [Google Scholar] [CrossRef] [PubMed]
- Yoshihara, K.; Shahmoradgoli, M.; Martinez, E.; Vegesna, R.; Kim, H.; Torres-Garcia, W.; Trevino, V.; Shen, H.; Laird, P.W.; Levine, D.A.; et al. Inferring tumour purity and stromal and immune cell admixture from expression data. Nat. Commun. 2013, 4, 2612. [Google Scholar] [CrossRef]
- Newman, A.M.; Liu, C.L.; Green, M.R.; Gentles, A.J.; Feng, W.; Xu, Y.; Hoang, C.D.; Diehn, M.; Alizadeh, A.A. Robust enumeration of cell subsets from tissue expression profiles. Nat. Methods 2015, 12, 453–457. [Google Scholar] [CrossRef]
- Jiang, T.; Xu, X.; Qiao, M.; Li, X.; Zhao, C.; Zhou, F.; Gao, G.; Wu, F.; Chen, X.; Su, C.; et al. Comprehensive evaluation of NT5E/CD73 expression and its prognostic significance in distinct types of cancers. BMC Cancer 2018, 18, 267. [Google Scholar] [CrossRef]
- Lambert, A.W.; Pattabiraman, D.R.; Weinberg, R.A. Emerging Biological Principles of Metastasis. Cell 2017, 168, 670–691. [Google Scholar] [CrossRef]
- Ma, X.L.; Shen, M.N.; Hu, B.; Wang, B.L.; Yang, W.J.; Lv, L.H.; Wang, H.; Zhou, Y.; Jin, A.L.; Sun, Y.F.; et al. CD73 promotes hepatocellular carcinoma progression and metastasis via activating PI3K/AKT signaling by inducing Rap1-mediated membrane localization of P110beta and predicts poor prognosis. J. Hematol. Oncol. 2019, 12, 37. [Google Scholar] [CrossRef]
- Arab, S.; Hadjati, J. Adenosine Blockage in Tumor Microenvironment and Improvement of Cancer Immunotherapy. Immune Netw. 2019, 19, e23. [Google Scholar] [CrossRef]
- Wylie, B.; Macri, C.; Mintern, J.D.; Waithman, J. Dendritic Cells and Cancer: From Biology to Therapeutic Intervention. Cancers 2019, 11, 521. [Google Scholar] [CrossRef] [PubMed]
- Novitskiy, S.V.; Ryzhov, S.; Zaynagetdinov, R.; Goldstein, A.E.; Huang, Y.; Tikhomirov, O.Y.; Blackburn, M.R.; Biaggioni, I.; Carbone, D.P.; Feoktistov, I.; et al. Adenosine receptors in regulation of dendritic cell differentiation and function. Blood 2008, 112, 1822–1831. [Google Scholar] [CrossRef] [PubMed]
- Yu, M.; Guo, G.; Huang, L.; Deng, L.; Chang, C.S.; Achyut, B.R.; Canning, M.; Xu, N.; Arbab, A.S.; Bollag, R.J.; et al. CD73 on cancer-associated fibroblasts enhanced by the A2B-mediated feedforward circuit enforces an immune checkpoint. Nat. Commun. 2020, 11, 515. [Google Scholar] [CrossRef] [PubMed]
- Neo, S.Y.; Yang, Y.; Record, J.; Ma, R.; Chen, X.; Chen, Z.; Tobin, N.P.; Blake, E.; Seitz, C.; Thomas, R.; et al. CD73 immune checkpoint defines regulatory NK cells within the tumor microenvironment. J. Clin. Investig. 2020, 130, 1185–1198. [Google Scholar] [CrossRef]
- Hardin, H.; Zhang, R.; Helein, H.; Buehler, D.; Guo, Z.; Lloyd, R.V. The evolving concept of cancer stem-like cells in thyroid cancer and other solid tumors. Lab. Investig. 2017, 97, 1142–1151. [Google Scholar] [CrossRef] [PubMed]
- Antonioli, L.; Yegutkin, G.G.; Pacher, P.; Blandizzi, C.; Haskó, G. Anti-CD73 in cancer immunotherapy: Awakening new opportunities. Trends Cancer 2016, 2, 95–109. [Google Scholar] [CrossRef] [PubMed]
- Kordass, T.; Osen, W.; Eichmuller, S.B. Controlling the Immune Suppressor: Transcription Factors and MicroRNAs Regulating CD73/NT5E. Front. Immunol. 2018, 9, 813. [Google Scholar] [CrossRef]
- Bonnin, N.; Armandy, E.; Carras, J.; Ferrandon, S.; Battiston-Montagne, P.; Aubry, M.; Guihard, S.; Meyronet, D.; Foy, J.P.; Saintigny, P.; et al. MiR-422a promotes loco-regional recurrence by targeting NT5E/CD73 in head and neck squamous cell carcinoma. Oncotarget 2016, 7, 44023–44038. [Google Scholar] [CrossRef]
- Xie, M.; Qin, H.; Luo, Q.; Huang, Q.; He, X.; Yang, Z.; Lan, P.; Lian, L. MicroRNA-30a regulates cell proliferation and tumor growth of colorectal cancer by targeting CD73. BMC Cancer 2017, 17, 305. [Google Scholar] [CrossRef]
- Zhang, F.; Luo, Y.; Shao, Z.; Xu, L.; Liu, X.; Niu, Y.; Shi, J.; Sun, X.; Liu, Y.; Ding, Y.; et al. MicroRNA-187, a downstream effector of TGFbeta pathway, suppresses Smad-mediated epithelial-mesenchymal transition in colorectal cancer. Cancer Lett. 2016, 373, 203–213. [Google Scholar] [CrossRef]
- Kim, Y.; Kim, M.H.; Jeon, S.; Kim, J.; Kim, C.; Bae, J.S.; Jung, C.K. Prognostic implication of histological features associated with EHD2 expression in papillary thyroid carcinoma. PLoS ONE 2017, 12, e0174737. [Google Scholar] [CrossRef]
- Bychkov, A.; Jung, C.K. Aberrant expression of CD20 in thyroid cancer and its clinicopathologic significance. Hum. Pathol. 2018, 71, 74–83. [Google Scholar] [CrossRef]
- Choden, S.; Keelawat, S.; Jung, C.K.; Bychkov, A. VE1 Immunohistochemistry Improves the Limit of Genotyping for Detecting BRAF(V600E) Mutation in Papillary Thyroid Cancer. Cancers 2020, 12, 596. [Google Scholar] [CrossRef]
- Oh, E.J.; Bychkov, A.; Cho, H.; Kim, T.M.; Bae, J.S.; Lim, D.J.; Jung, C.K. Prognostic Implications of CD10 and CD15 Expression in Papillary Thyroid Carcinoma. Cancers 2020, 12, 1413. [Google Scholar] [CrossRef] [PubMed]
- Lloyd, R.V.; Osamura, R.Y.; Kloppel, G.; Rosai, J. Chapter 2 Tumours of the thyroid gland. In WHO Classification of Tumours of Endocrine Organs, 4th ed.; International Agency for Research on Cancer (IARC): Lyon, France, 2017; pp. 65–143. [Google Scholar]
- Ren, Z.H.; Yuan, Y.X.; Ji, T.; Zhang, C.P. CD73 as a novel marker for poor prognosis of oral squamous cell carcinoma. Oncol. Lett. 2016, 12, 556–562. [Google Scholar] [CrossRef]
- Cho, U.; Mete, O.; Kim, M.H.; Bae, J.S.; Jung, C.K. Molecular correlates and rate of lymph node metastasis of non-invasive follicular thyroid neoplasm with papillary-like nuclear features and invasive follicular variant papillary thyroid carcinoma: The impact of rigid criteria to distinguish non-invasive follicular thyroid neoplasm with papillary-like nuclear features. Mod. Pathol. 2017, 30, 810–825. [Google Scholar] [CrossRef] [PubMed]
- The Cancer Genome Atlas Research Network. Integrated genomic characterization of papillary thyroid carcinoma. Cell 2014, 159, 676–690. [Google Scholar] [CrossRef]
- Edge, S.B.; Byrd, D.R.; Compton, C.C.; Fritz, A.G.; Greene, F.L.; Trotti, A. AJCC Cancer Staging Manual, 7th ed.; Springer: New York, NY, USA, 2010; pp. 87–96. [Google Scholar]
- Kim, K.; Jeon, S.; Kim, T.M.; Jung, C.K. Immune Gene Signature Delineates a Subclass of Papillary Thyroid Cancer with Unfavorable Clinical Outcomes. Cancers 2018, 10, 494. [Google Scholar] [CrossRef]


| Characteristic | n | CD73 Expression | p-Value | |
|---|---|---|---|---|
| High (n = 370) | Low (n = 141) | |||
| Age (years) | 511 | 0.436 | ||
| <55 | 364 | 260 (71.4%) | 104 (25.6%) | |
| ≥55 | 147 | 110 (74.8%) | 37 (25.2%) | |
| Sex | 511 | 0.047 | ||
| Female | 403 | 300 (74.4%) | 103 (25.6%) | |
| Male | 108 | 70 (64.8%) | 38 (35.2%) | |
| Histologic variant | 511 | <0.001 | ||
| Classic | 449 | 323 (71.9%) | 126 (28.1%) | |
| Follicular variant | 17 | 3 (17.6%) | 14 (82.4%) | |
| Tall cell variant | 21 | 21 (100.0%) | 0 (0.0%) | |
| Other | 24 | 23 (95.8%) | 1 (4.2%) | |
| Histologically aggressive variant 1 | 511 | 0.002 | ||
| Aggressive variant | 23 | 23 (100.0%) | 0 (0.0%) | |
| Non-aggressive variant | 488 | 347 (71.1%) | 141 (28.9%) | |
| Extrathyroidal extension 2 | 511 | <0.001 | ||
| Present | 376 | 292 (77.7%) | 84 (22.3%) | |
| Absent | 135 | 78 (57.8%) | 57 (42.2%) | |
| Gross extrathyroidal extension | 511 | 0.010 | ||
| Present | 99 | 82 (82.8%) | 17 (17.2%) | |
| Absent | 412 | 288 (69.9%) | 124 (30.1%) | |
| Pathologic (p) T category | 511 | 0.024 | ||
| pT1-2 | 409 | 287 (70.2%) | 122 (29.8%) | |
| pT3-4 | 102 | 83 (81.4%) | 19 (18.6%) | |
| pN category | 511 | <0.001 | ||
| pN0 | 195 | 120 (61.5%) | 75 (38.5%) | |
| pN1a | 211 | 165 (78.2%) | 46 (21.8%) | |
| pNb | 105 | 85 (81.0%) | 20 (19.0%) | |
| Dyscohesive cells 3 | 511 | <0.001 | ||
| Present | 346 | 276 (79.8%) | 70 (20.2%) | |
| Absent | 165 | 94 (57.0%) | 71 (43.0%) | |
| AJCC stage, 8th edition | 511 | 0.162 | ||
| Stage 1 | 419 | 298 (71.7%) | 121 (28.9%) | |
| Stage 2 | 79 | 61 (77.2%) | 18 (22.8%) | |
| Stage 3 | 9 | 8 (88.9%) | 1 (11.1%) | |
| Stage 4 | 4 | 3 (75.0%) | 1 (25.0%) | |
| Structural recurrence 4 | 511 | 0.024 | ||
| Present | 45 | 39 (86.7%) | 6 (13.3%) | |
| Absent | 457 | 324 (70.9%) | 133 (29.1%) | |
| BRAFV600E | 511 | 0.015 | ||
| Present | 428 | 319 (74.5%) | 109 (25.5%) | |
| Absent | 83 | 51 (61.4%) | 32 (38.6%) | |
| Variable | Univariate Analysis | Multivariate Analysis | ||
|---|---|---|---|---|
| HR (95% CI) | p-Value | Adjusted HR (95% CI) | p-Value | |
| Age (years) | ||||
| <55 | 1 | 1 | ||
| ≥55 | 1.357 (0.672–2.741) | 0.395 | 0.700 (0.321–1.524) | 0.369 |
| Sex | ||||
| Female | 1 | 1 | ||
| Male | 1.347 (0.696–2.609) | 0.377 | 1.186 (0.606–2.320) | 0.619 |
| Histologic subtype | ||||
| Non-aggressive | 1 | 1 | ||
| Aggressive | 0.586 (0.182–1.891) | 0.371 | 1.161 (0.352–3.824) | 0.807 |
| Gross extrathyroidal extension | ||||
| Absent | 1 | 1 | ||
| Present | 1.964 (1.045–3.691) | 0.036 | 6.489 (1.441–29.217) | 0.015 |
| Pathologic (p) T category | ||||
| pT1-2 | 1 | 1 | ||
| pT3-4 | 2.308 (1.254–4.250) | 0.007 | 10.022 (2.342–42.890) | 0.002 |
| Lymph node metastasis | ||||
| Absent | 1 | 1 | ||
| Present | 8.995 (2.788–29.021) | <0.001 | 7.480 (2.299–24.343) | 0.001 |
| CD73 expression | ||||
| Low | 1 | 1 | ||
| High | 2.603 (1.102–6.150) | 0.029 | 2.158 (0.899–5.177) | 0.085 |
| Characteristic | n | CD73 (NT5E) mRNA | p-Value | |
|---|---|---|---|---|
| High Expression (n = 223) | Low Expression (n = 231) | |||
| Age (years) | 454 | 0.116 | ||
| <45 | 211 | 112(53.1%) | 99(46.9%) | |
| ≥45 | 243 | 111(45.7%) | 132(54.3%) | |
| Sex | 454 | 0.471 | ||
| Female | 123 | 57(46.3%) | 66(53.7%) | |
| Male | 331 | 166(50.2%) | 165(49.8%) | |
| Histologic variant | 454 | 0.489 | ||
| Classic | 312 | 172(55.1%) | 140(44.9%) | |
| Follicular | 99 | 18(18.2%) | 81(81.8%) | |
| Tallcell | 34 | 27(79.4%) | 7(20.6%) | |
| Other | 9 | 6(66.7%) | 3(33.3%) | |
| Extrathyroidal extension | 441 | <0.001 | ||
| None | 309 | 130(42.1%) | 179(57.9%) | |
| Minimal(pT3) | 117 | 80(68.4%) | 37(31.6%) | |
| Moderate/advanced(pT4) | 15 | 8(53.3%) | 7(46.7%) | |
| Pathologic (p) Tcategory | 452 | 0.004 | ||
| pT1 | 131 | 52(39.7%) | 79(60.3%) | |
| pT2 | 152 | 69(45.4%) | 83(54.6%) | |
| pT3 | 151 | 91(60.3%) | 60(39.7%) | |
| pT4 | 18 | 10(55.6%) | 8(44.4%) | |
| pN category | 454 | <0.001 | ||
| pN0 | 208 | 85(40.9%) | 123(59.1%) | |
| pN1 | 201 | 122(60.7%) | 79(39.3%) | |
| pNX | 45 | 16(35.6%) | 29(64.4%) | |
| Distant metastasis | 453 | 0.025 | ||
| M0 | 242 | 130(53.7%) | 112(46.3%) | |
| M1 | 8 | 5(62.5%) | 3(37.5%) | |
| MX | 203 | 88(43.3%) | 115(56.7%) | |
| AJCC stage, 7th edition | 452 | 0.002 | ||
| Stage I | 260 | 125(48.1%) | 135(51.9%) | |
| Stage II | 49 | 14(28.6%) | 35(71.4%) | |
| Stage III | 98 | 53(54.1%) | 45(45.9%) | |
| Stage IV | 45 | 30(66.7%) | 15(33.3%) | |
| BRAF-RAS signature | 391 | <0.001 | ||
| BRAF-like | 272 | 183(67.3%) | 89(32.7%) | |
| RAS-like | 119 | 14(11.8%) | 105(88.2%) | |
| ATA recurrence risk group | 442 | <0.001 | ||
| Low | 166 | 56(33.7%) | 110(66.3%) | |
| Intermediate | 252 | 146(57.9%) | 106(42.1%) | |
| High | 24 | 13(54.2%) | 11(45.8%) | |
Publisher’s Note: MDPI stays neutral with regard to jurisdictional claims in published maps and institutional affiliations. |
© 2020 by the authors. Licensee MDPI, Basel, Switzerland. This article is an open access article distributed under the terms and conditions of the Creative Commons Attribution (CC BY) license (http://creativecommons.org/licenses/by/4.0/).
Share and Cite
Jeong, Y.M.; Cho, H.; Kim, T.-M.; Kim, Y.; Jeon, S.; Bychkov, A.; Jung, C.K. CD73 Overexpression Promotes Progression and Recurrence of Papillary Thyroid Carcinoma. Cancers 2020, 12, 3042. https://doi.org/10.3390/cancers12103042
Jeong YM, Cho H, Kim T-M, Kim Y, Jeon S, Bychkov A, Jung CK. CD73 Overexpression Promotes Progression and Recurrence of Papillary Thyroid Carcinoma. Cancers. 2020; 12(10):3042. https://doi.org/10.3390/cancers12103042
Chicago/Turabian StyleJeong, Young Mun, Haejin Cho, Tae-Min Kim, Yourha Kim, Sora Jeon, Andrey Bychkov, and Chan Kwon Jung. 2020. "CD73 Overexpression Promotes Progression and Recurrence of Papillary Thyroid Carcinoma" Cancers 12, no. 10: 3042. https://doi.org/10.3390/cancers12103042
APA StyleJeong, Y. M., Cho, H., Kim, T.-M., Kim, Y., Jeon, S., Bychkov, A., & Jung, C. K. (2020). CD73 Overexpression Promotes Progression and Recurrence of Papillary Thyroid Carcinoma. Cancers, 12(10), 3042. https://doi.org/10.3390/cancers12103042