Validating fPSA Glycoprofile as a Prostate Cancer Biomarker to Avoid Unnecessary Biopsies and Re-Biopsies

 ,
,  ,
,  , and
, and 
Simple Summary
Abstract
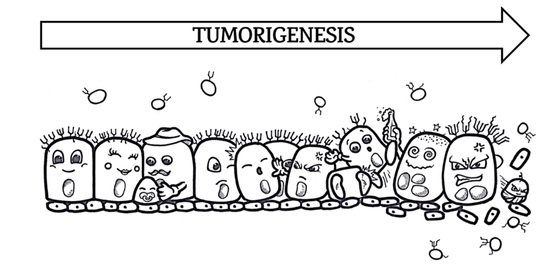
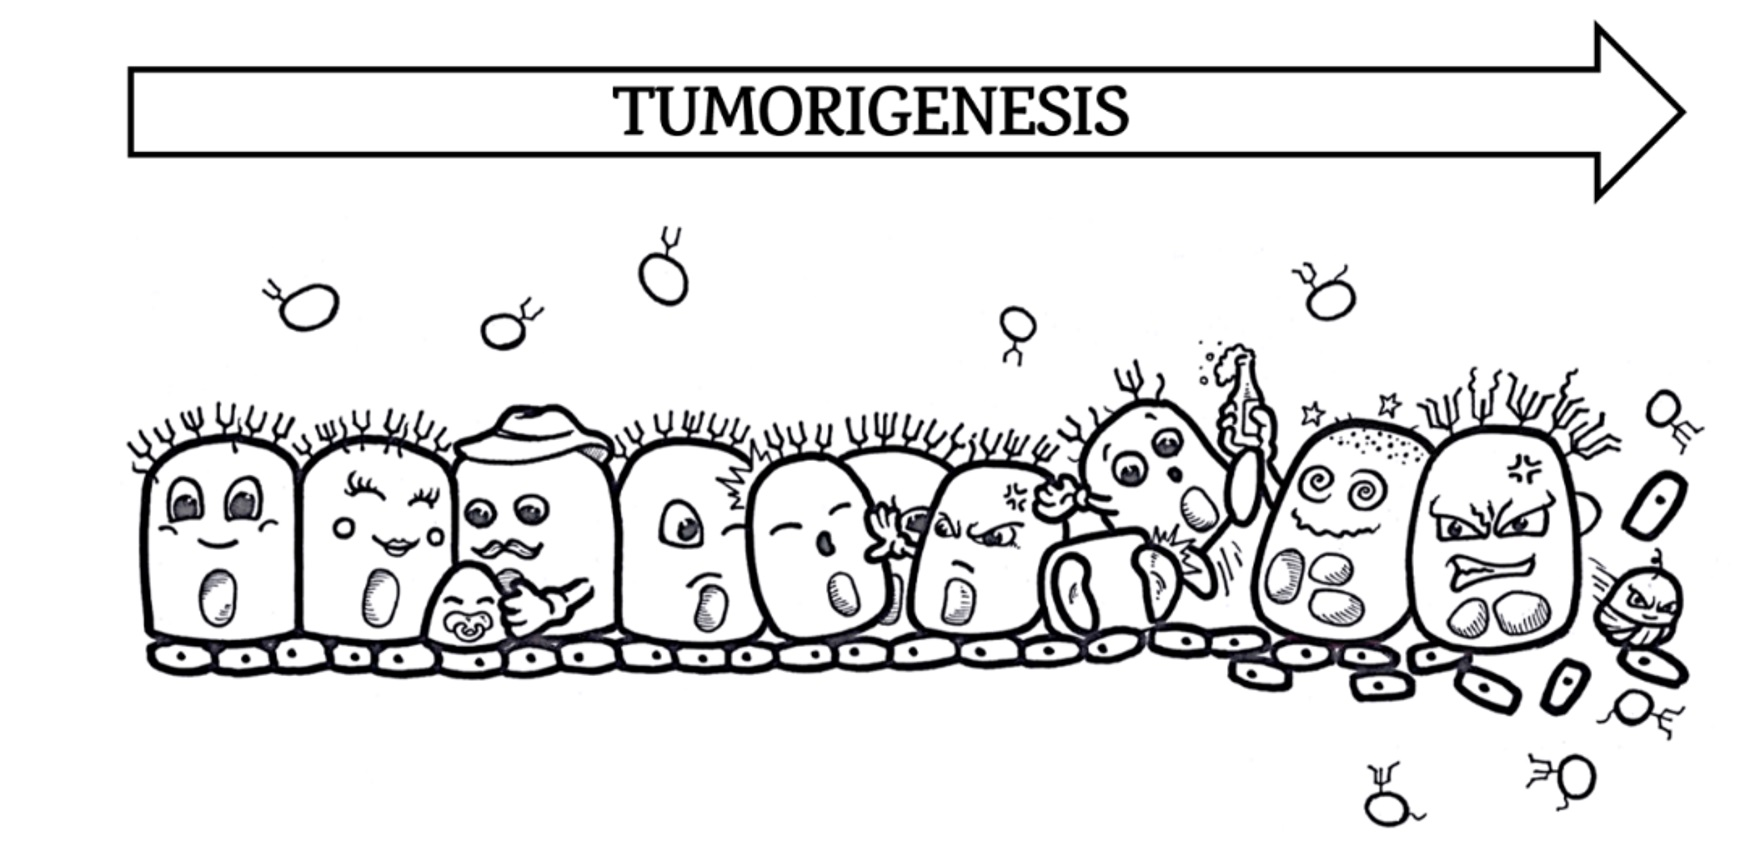
1. Introduction
2. Results
2.1. fPSA Glycans and Their Analysis
2.2. Glycan Biomarkers Outperform Total PSA and fPSA% for PCa Detection
2.3. Early Stage PCa Diagnostics
2.4. The Diagnostic Performance of PGI Compared to PHI
2.5. PGI Decreases the Number of Unnecessary Biopsies
2.6. The Prognostic Ability of Glycan Biomarkers in the Prediction of Low- and High-Grade Tumors
3. Discussion
4. Materials and Methods
4.1. Clinical Cohorts
4.2. Glycoprofiling of fPSA, Data Analysis, and Statistics
5. Conclusions
6. Patents
Supplementary Materials
Author Contributions
Funding
Conflicts of Interest
References
- Rawla, P. Epidemiology of prostate cancer. World J. Oncol. 2019, 10, 63. [Google Scholar] [CrossRef]
- Torre, L.A.; Bray, F.; Siegel, R.L.; Ferlay, J.; Lortet-Tieulent, J.; Jemal, A. Global cancer statistics, 2012. CA Cancer J. Clin. 2015, 65, 87–108. [Google Scholar] [CrossRef]
- Ferlay, J.; Soerjomataram, I.; Dikshit, R.; Eser, S.; Mathers, C.; Rebelo, M.; Parkin, D.M.; Forman, D.; Bray, F. Cancer incidence and mortality worldwide: Sources, methods and major patterns in GLOBOCAN 2012. Int. J. Cancer 2015, 136, E359–E386. [Google Scholar] [CrossRef] [PubMed]
- Tkac, J.; Bertok, T.; Hires, M.; Jane, E.; Lorencova, L.; Kasak, P. Glycomics of prostate cancer: Updates. Exp. Rev. Proteom. 2019, 16, 65–76. [Google Scholar] [CrossRef] [PubMed]
- Tkac, J.; Gajdosova, V.; Hroncekova, S.; Bertok, T.; Hires, M.; Jane, E.; Lorencova, L.; Kasak, P. Prostate-specific antigen glycoprofiling as diagnostic and prognostic biomarker of prostate cancer. Interface Focus 2019, 9, 20180077. [Google Scholar] [CrossRef] [PubMed]
- Kohaar, I.; Petrovics, G.; Srivastava, S. A rich array of prostate cancer molecular biomarkers: Opportunities and challenges. Int. J. Mol. Sci. 2019, 20, 1813. [Google Scholar] [CrossRef] [PubMed]
- Steuber, T.; Tennstedt, P.; Macagno, A.; Athanasiou, A.; Wittig, A.; Huber, R.; Golding, B.; Schiess, R.; Gillessen, S. Thrombospondin 1 and cathepsin D improve prostate cancer diagnosis by avoiding potentially unnecessary prostate biopsies. BJU Int. 2019, 123, 826–833. [Google Scholar] [CrossRef]
- Bax, C.; Taverna, G.; Eusebio, L.; Sironi, S.; Grizzi, F.; Guazzoni, G.; Capelli, L. Innovative Diagnostic Methods for Early Prostate Cancer Detection through Urine Analysis: A Review. Cancers 2018, 10, 123. [Google Scholar] [CrossRef]
- Cohen, J.D.; Li, L.; Wang, Y.; Thoburn, C.; Afsari, B.; Danilova, L.; Douville, C.; Javed, A.A.; Wong, F.; Mattox, A.; et al. Detection and localization of surgically resectable cancers with a multi-analyte blood test. Science 2018, 359, 926–930. [Google Scholar] [CrossRef]
- Murphy, K.; Murphy, B.T.; Boyce, S.; Flynn, L.; Gilgunn, S.; O’Rourke, C.J.; Rooney, C.; Stockmann, H.; Walsh, A.L.; Finn, S.; et al. Integrating biomarkers across omic platforms: An approach to improve stratification of patients with indolent and aggressive prostate cancer. Mol. Oncol. 2018, 12, 1513–1525. [Google Scholar] [CrossRef]
- Josic, D.; Martinovic, T.; Pavelic, K. Glycosylation and metastases. Electrophoresis 2019, 40, 140–150. [Google Scholar] [CrossRef]
- Rodrigues, J.G.; Balmaña, M.; Macedo, J.A.; Poças, J.; Fernandes, Â.; de-Freitas-Junior, J.C.M.; Pinho, S.S.; Gomes, J.; Magalhães, A.; Gomes, C.; et al. Glycosylation in cancer: Selected roles in tumour progression, immune modulation and metastasis. Cell. Immunol. 2018, 333, 46–57. [Google Scholar] [CrossRef]
- Ideo, H.; Kondo, J.; Nomura, T.; Nonomura, N.; Inoue, M.; Amano, J. Study of glycosylation of prostate-specific antigen secreted by cancer tissue-originated spheroids reveals new candidates for prostate cancer detection. Sci. Rep. 2020, 10, 2708. [Google Scholar] [CrossRef]
- Bertok, T.; Tkac, J. Means and Methods for Glycoprofiling of a Protein. WO2019185515A1, 2019. Available online: https://patentscope.wipo.int/search/en/detail.jsf?docId=WO2019185515 (accessed on 10 March 2020).
- Tosoian, J.J.; Alam, R.; Ball, M.W.; Carter, H.B.; Epstein, J.I. Managing high-grade prostatic intraepithelial neoplasia (HGPIN) and atypical glands on prostate biopsy. Nat. Rev. Urol. 2018, 15, 55. [Google Scholar] [CrossRef]
- Loeb, S.; Catalona, W.J. The Prostate Health Index: A new test for the detection of prostate cancer. Ther. Adv. Urol. 2014, 6, 74–77. [Google Scholar] [CrossRef]
- Klocker, H.; Golding, B.; Weber, S.; Steiner, E.; Tennstedt, P.; Keller, T.; Schiess, R.; Gillessen, S.; Horninger, W.; Steuber, T. Development and validation of a novel multivariate risk score to guide biopsy decision for the diagnosis of clinically significant prostate cancer. BJUI Compass 2020, 1, 15–20. [Google Scholar] [CrossRef]
- Dwek, M.V.; Jenks, A.; Leathem, A.J.C. A sensitive assay to measure biomarker glycosylation demonstrates increased fucosylation of prostate specific antigen (PSA) in patients with prostate cancer compared with benign prostatic hyperplasia. Clin. Chim. Acta 2010, 411, 1935–1939. [Google Scholar] [CrossRef]
- Hagiwara, K.; Tobisawa, Y.; Kaya, T.; Kaneko, T.; Hatakeyama, S.; Mori, K.; Hashimoto, Y.; Koie, T.; Suda, Y.; Ohyama, C.; et al. Wisteria floribunda Agglutinin and Its Reactive-Glycan-Carrying Prostate-Specific Antigen as a Novel Diagnostic and Prognostic Marker of Prostate Cancer. Int. J. Mol. Sci. 2017, 18, 261. [Google Scholar] [CrossRef]
- Yoneyama, T.; Ohyama, C.; Hatakeyama, S.; Narita, S.; Habuchi, T.; Koie, T.; Mori, K.; Hidari, K.I.P.J.; Yamaguchi, M.; Suzuki, T.; et al. Measurement of aberrant glycosylation of prostate specific antigen can improve specificity in early detection of prostate cancer. Biochem. Biophys. Res. Commun. 2014, 448, 390–396. [Google Scholar] [CrossRef]
- Ishikawa, T.; Yoneyama, T.; Tobisawa, Y.; Hatakeyama, S.; Kurosawa, T.; Nakamura, K.; Narita, S.; Mitsuzuka, K.; Duivenvoorden, W.; Pinthus, J.H. An automated micro-total immunoassay system for measuring cancer-associated α2, 3-linked sialyl N-glycan-carrying prostate-specific antigen may improve the accuracy of prostate cancer diagnosis. Int. J. Mol. Sci. 2017, 18, 470. [Google Scholar] [CrossRef]
- Zijlstra, C.; Stoorvogel, W. Prostasomes as a source of diagnostic biomarkers for prostate cancer. J. Clin. Investig. 2016, 126, 1144–1151. [Google Scholar] [CrossRef]
- Aigner, F.; Schäfer, G.; Steiner, E.; Jaschke, W.; Horninger, W.; Herrmann, T.R.W.; Nagele, U.; Halpern, E.J.; Frauscher, F. Value of enhanced transrectal ultrasound targeted biopsy for prostate cancer diagnosis: A retrospective data analysis. World J. Urol. 2012, 30, 341–346. [Google Scholar] [CrossRef]
- Mitterberger, M.; Horninger, W.; Aigner, F.; Pinggera, G.M.; Rehder, P.; Steiner, E.; Wiunig, C.; Reissigl, A.; Frauscher, F. Contrast-enhanced colour Doppler-targeted vs a 10-core systematic repeat biopsy strategy in patients with previous high-grade prostatic intraepithelial neoplasia. BJU Int. 2010, 105, 1660–1662. [Google Scholar] [CrossRef]
- Llop, E.; Ferrer-Batalle, M.; Barrabes, S.; Enrique Guerrero, P.; Ramirez, M.; Saldova, R.; Rudd, P.M.; Aleixandre, R.N.; Comet, J.; de Llorens, R.; et al. Improvement of Prostate Cancer Diagnosis by Detecting PSA Glycosylation-Specific Changes. Theranostics 2016, 6, 1190–1204. [Google Scholar] [CrossRef]
- Endt, K.; Goepfert, J.; Omlin, A.; Athanasiou, A.; Tennstedt, P.; Guenther, A.; Rainisio, M.; Engeler, D.S.; Steuber, T.; Gillessen, S.; et al. Development and clinical testing of individual immunoassays for the quantification of serum glycoproteins to diagnose prostate cancer. PLoS ONE 2017, 12, e0181557. [Google Scholar] [CrossRef]
- Team, R.C. R: A Language and Environment for Statistical Computing; R Foundation for Statistical Computing: Vienna. Available online: www.R-project.org (accessed on 3 June 2017).
- Carpenter, J.; Bithell, J. Bootstrap confidence intervals: When, which, what? A practical guide for medical statisticians. Stat. Med. 2000, 19, 1141–1164. [Google Scholar] [CrossRef]
- Bertok, T.; Lorencova, L.; Hroncekova, S.; Gajdosova, V.; Jane, E.; Hires, M.; Kasak, P.; Kaman, O.; Sokol, R.; Bella, V.; et al. Advanced impedimetric biosensor configuration and assay protocol for glycoprofiling of a prostate oncomarker using Au nanoshells with a magnetic core. Biosens. Bioelectron. 2019, 131, 24–29. [Google Scholar] [CrossRef]
- Bertok, T.; Lorencova, L.; Hroncekova, S.; Gajdosova, V.; Jane, E.; Hires, M.; Kasak, P.; Kaman, O.; Sokol, R.; Bella, V.; et al. Synthesis and characterization of Au nanoshells with a magnetic core and betaine derivatives. MethodsX 2019, 6, 1999–2012. [Google Scholar] [CrossRef]
- Pihikova, D.; Pakanová, Z.; Nemcovic, M.; Barath, P.; Belicky, S.; Bertok, T.; Kasak, P.; Mucha, J.; Tkáč, J. Front cover: Sweet characterisation of prostate specific antigen using electrochemical lectin-based immunosensor assay and MALDI TOF/TOF analysis: Focus on sialic acid. Proteomics 2016, 16, 3085–3095. [Google Scholar] [CrossRef]
- Chocholova, E.; Bertok, T.; Jane, E.; Lorencova, L.; Holazová, A.; Belicka, L.; Belicky, S.; Mislovičová, D.; Vikartovská, A.; Imrich, R.; et al. Glycomics meets artificial intelligence—Potential of glycan analysis for identification of seropositive and seronegative rheumatoid arthritis patients revealed. Clin. Chim. Acta 2018, 481, 49–55. [Google Scholar] [CrossRef]
- Chocholova, E.; Bertok, T.; Lorencova, L.; Holazova, A.; Farkas, P.; Vikartovska, A.; Bella, V.; Velicova, D.; Kasak, P.; Eckstein, A.A.; et al. Advanced antifouling zwitterionic layer based impedimetric HER2 biosensing in human serum: Glycoprofiling as a novel approach for breast cancer diagnostics. Sens. Actuators B Chem. 2018, 272, 626–633. [Google Scholar] [CrossRef]
- Scrucca, L. GA: A Package for Genetic Algorithms inR. J. Stat. Softw. 2013, 53, 1–37. [Google Scholar] [CrossRef]
- James, G.; Witten, D.; Hastie, T.; Tibshirani, R. An Introduction to Statistical Learning: With Applications in R; Springer Science and Business Media LLC: New York, NY, USA, 2013. [Google Scholar]
- Johnson, P.; Vandewater, L.; Wilson, W.; Maruff, P.; Savage, G.; Graham, P.; Macaulay, L.S.; Ellis, K.A.; Szoeke, C.; Martins, R.N.; et al. Genetic algorithm with logistic regression for prediction of progression to Alzheimer’s disease. BMC Bioinform. 2014, 15, S11. [Google Scholar] [CrossRef] [PubMed]


| Characteristics | Participants, n = 140 | |
|---|---|---|
| Biopsy Result | Non-Cancer 70 (50%) | Prostate Cancer 70 (50%) |
| Age Average (range) ≤60 year >60 year | 60.2 (49–77) 37 (53%) 33 (47%) | 64.1 (40–79) 27 (39%) 43 (61%) |
| tPSA (ng/mL) Average (range) ≤3 3–5 ≥5 | 5.4 (2.5–10.7) 6 (9%) 26 (37%) 38 (54%) | 5.5 (2.3–9.8) 6 (9%) 26 (37%) 38 (54%) |
| Prostate volume (mL) ≤35 35–50 >50 | 13 (19%) 17 (24%) 40 (57%) | 29 (41%) 21 (30%) 20 (29%) |
| Biopsy results Gleason score (patterns) 6 (3 + 3) 7 (3 + 4) 7 (4 + 3) 8 (3 + 5) 9 (4 + 5) 10 (5 + 5) Prostatitis Atrophy Benign hyperplasia High-grade PIN Previous biopsy Follow-up carcinoma (ReDX) | NA NA NA NA NA NA 43 (61%) 20 (29%) 28 (40%) 2 (3%) 11 (16%) 1 | 28 (40%) 27 (39%) 3 (4%) 7 (10%) 4 (6%) 1 (1%) 12 (17%) 18 (26%) 6 (9%) 3 (4%) 3 (4%) NA |
| Tumor risk groups Gleason score | ||
| Low grade GS = 6 | NA | 28 (40%) |
| Significant GS ≥ 7 | NA | 42 (60%) |
Publisher’s Note: MDPI stays neutral with regard to jurisdictional claims in published maps and institutional affiliations. |
© 2020 by the authors. Licensee MDPI, Basel, Switzerland. This article is an open access article distributed under the terms and conditions of the Creative Commons Attribution (CC BY) license (http://creativecommons.org/licenses/by/4.0/).
Share and Cite
Bertok, T.; Jane, E.; Bertokova, A.; Lorencova, L.; Zvara, P.; Smolkova, B.; Kucera, R.; Klocker, H.; Tkac, J. Validating fPSA Glycoprofile as a Prostate Cancer Biomarker to Avoid Unnecessary Biopsies and Re-Biopsies. Cancers 2020, 12, 2988. https://doi.org/10.3390/cancers12102988
Bertok T, Jane E, Bertokova A, Lorencova L, Zvara P, Smolkova B, Kucera R, Klocker H, Tkac J. Validating fPSA Glycoprofile as a Prostate Cancer Biomarker to Avoid Unnecessary Biopsies and Re-Biopsies. Cancers. 2020; 12(10):2988. https://doi.org/10.3390/cancers12102988
Chicago/Turabian StyleBertok, Tomas, Eduard Jane, Aniko Bertokova, Lenka Lorencova, Peter Zvara, Bozena Smolkova, Radek Kucera, Helmut Klocker, and Jan Tkac. 2020. "Validating fPSA Glycoprofile as a Prostate Cancer Biomarker to Avoid Unnecessary Biopsies and Re-Biopsies" Cancers 12, no. 10: 2988. https://doi.org/10.3390/cancers12102988
APA StyleBertok, T., Jane, E., Bertokova, A., Lorencova, L., Zvara, P., Smolkova, B., Kucera, R., Klocker, H., & Tkac, J. (2020). Validating fPSA Glycoprofile as a Prostate Cancer Biomarker to Avoid Unnecessary Biopsies and Re-Biopsies. Cancers, 12(10), 2988. https://doi.org/10.3390/cancers12102988