Predicting Survival in Glioblastoma Patients Using Diffusion MR Imaging Metrics—A Systematic Review

 ,
,  ,
,  and
and 
Simple Summary
Abstract
1. Introduction
2. Materials and Methods
2.1. Search Strategy and Selection Criteria
2.2. Planning and Conducting the Review
2.3. Quality Assessment
3. Results
3.1. Study Selection
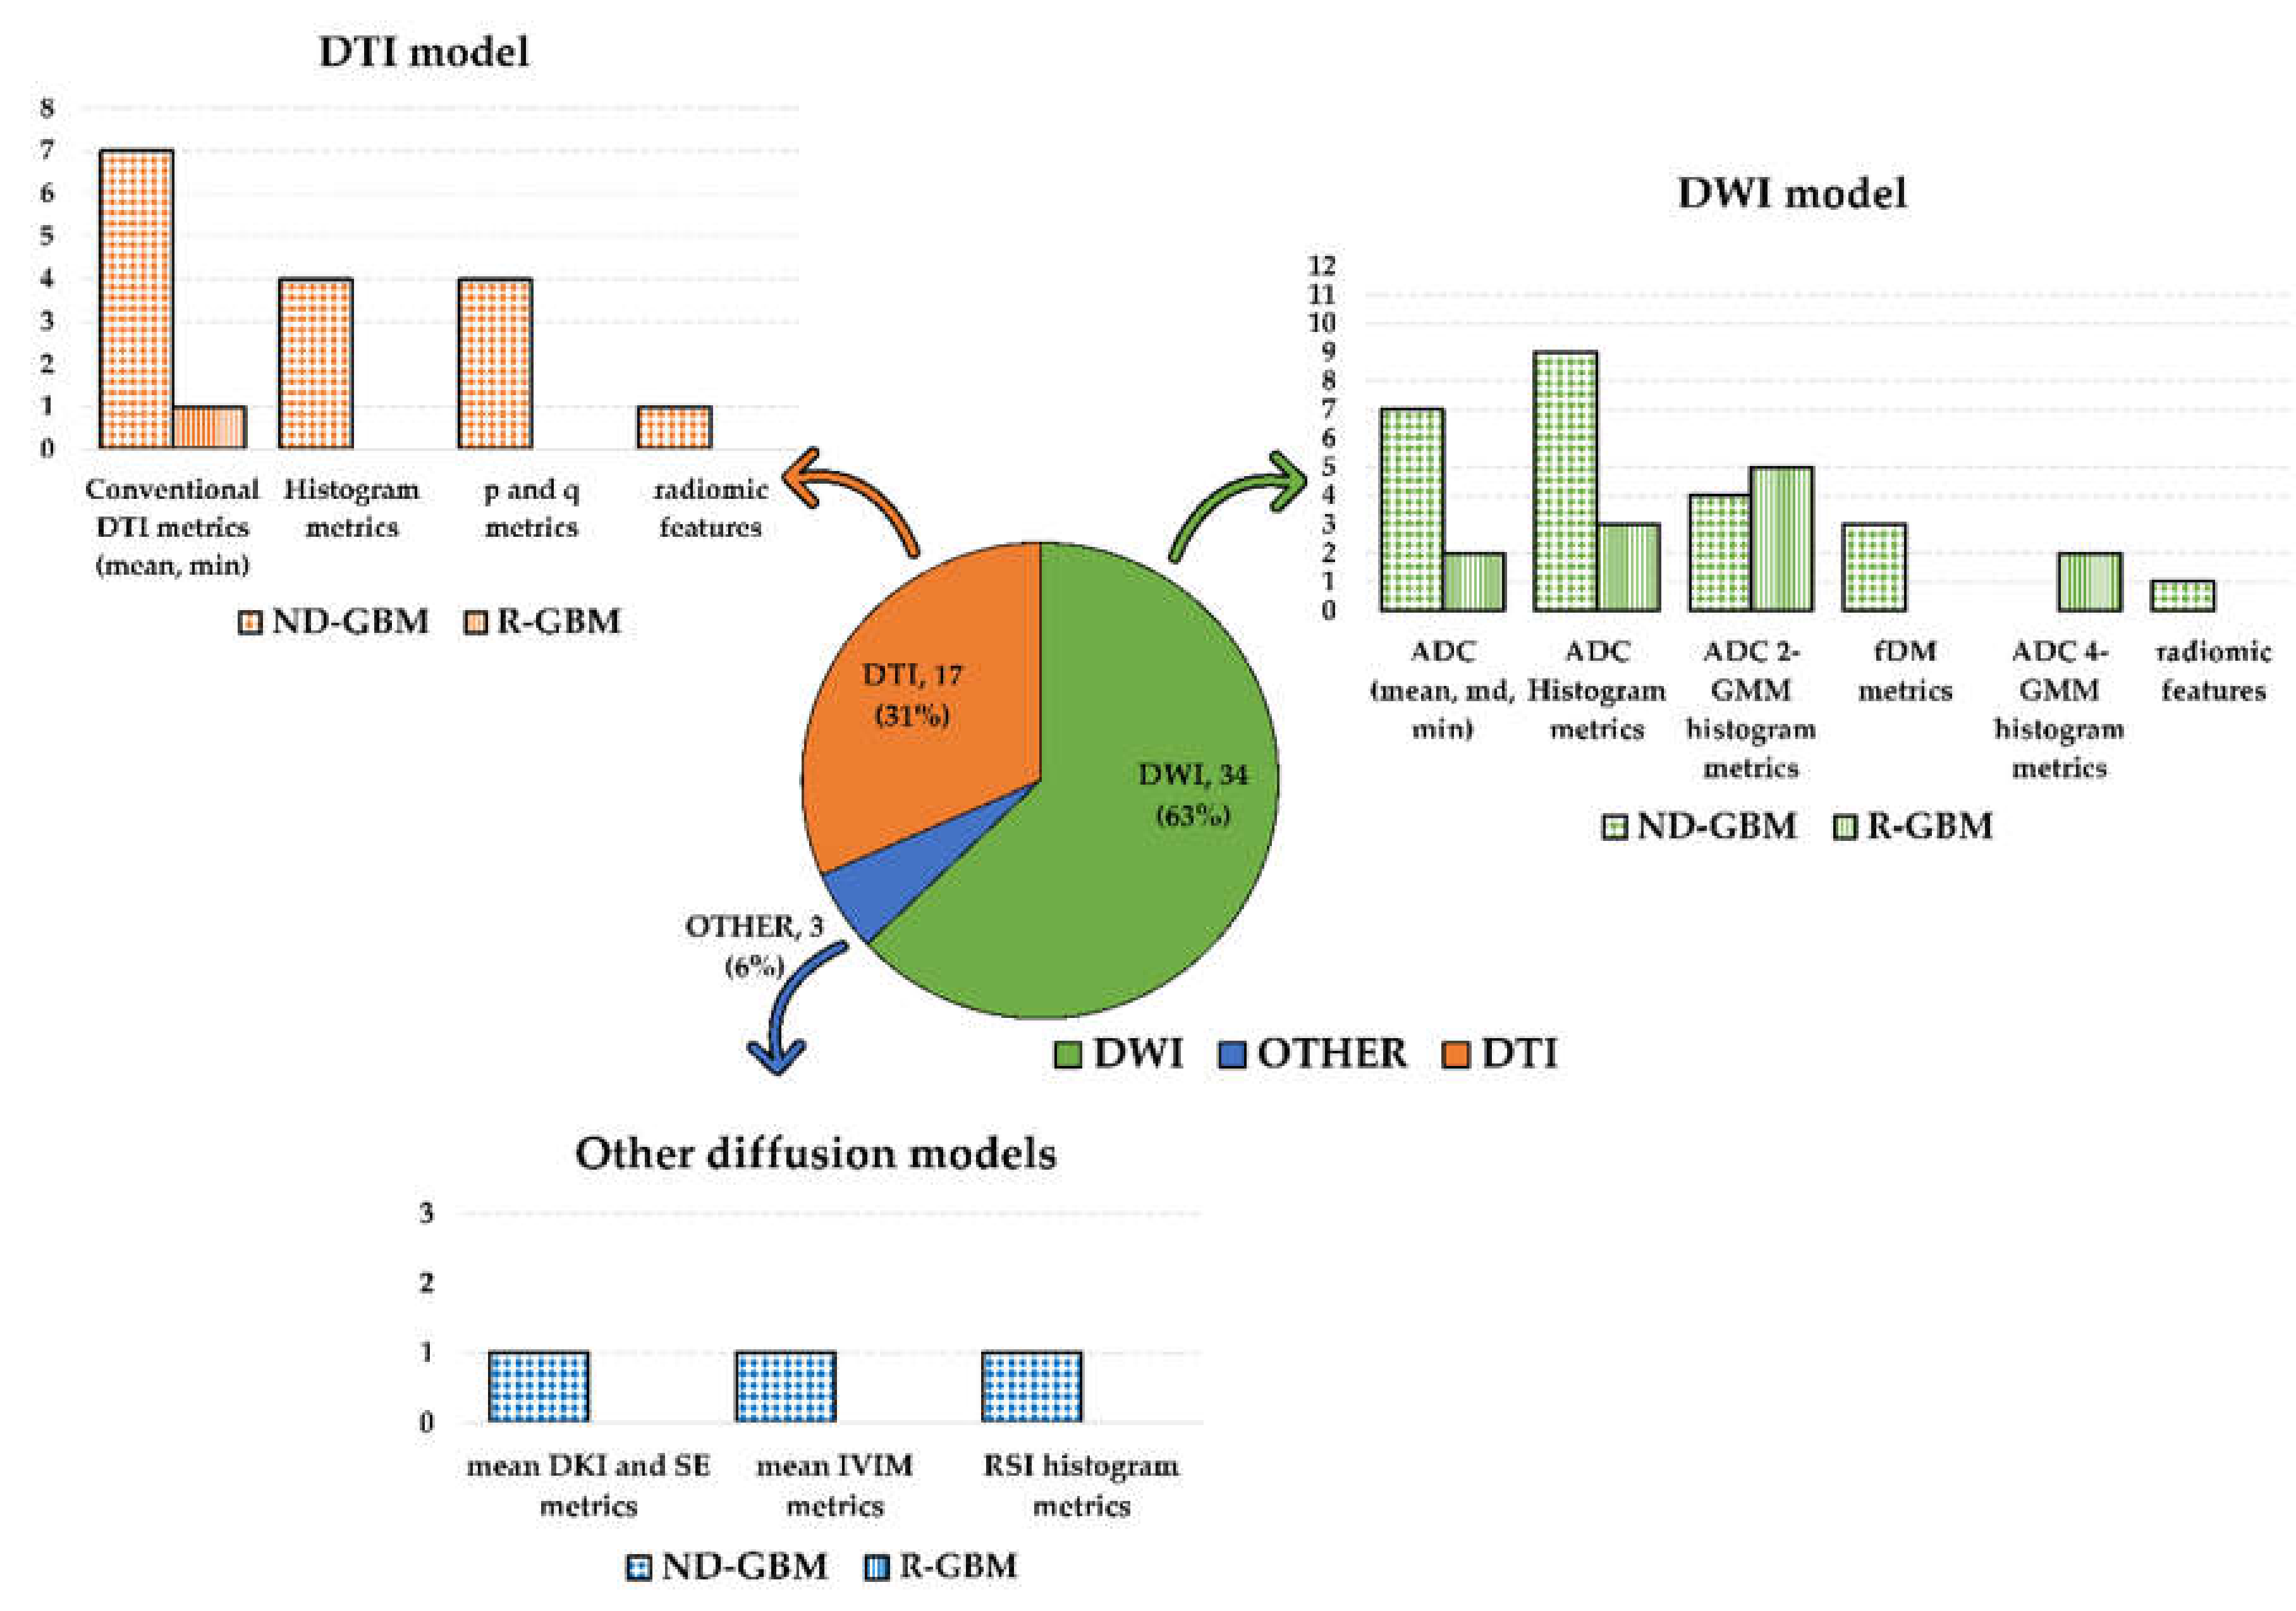
3.2. Characteristics of the Included Studies
3.3. Association of Diffusion MR Imaging Metrics with OS and PFS
3.3.1. DWI Metrics
3.3.2. DTI Metrics
3.3.3. Other Models Metrics
3.4. Quality Assessment
4. Discussions
5. Conclusions
Supplementary Materials
Author Contributions
Funding
Conflicts of Interest
References
- Louis, D.N.; Perry, A.; Reifenberger, G.; von Deimling, A.; Figarella-Branger, D.; Cavenee, W.K.; Ohgaki, H.; Wiestler, O.D.; Kleihues, P.; Ellison, D.W. The 2016 World Health Organization Classification of Tumors of the Central Nervous System: A summary. Acta Neuropathol. 2016, 131, 803–820. [Google Scholar] [CrossRef]
- Ohgaki, H.; Kleihues, P. The Definition of Primary and Secondary Glioblastoma. Clin. Cancer Res. 2013, 19, 764–772. [Google Scholar] [CrossRef]
- Davis, M. Glioblastoma: Overview of Disease and Treatment. CJON 2016, 20, S2–S8. [Google Scholar] [CrossRef]
- Stupp, R.; Mason, W.P.; van den Bent, M.J.; Weller, M.; Fisher, B.; Taphoorn, M.J.B.; Belanger, K.; Brandes, A.A.; Marosi, C.; Bogdahn, U.; et al. Radiotherapy plus Concomitant and Adjuvant Temozolomide for Glioblastoma. N. Engl. J. Med. 2005, 352, 987–996. [Google Scholar] [CrossRef]
- Mallick, S.; Benson, R.; Hakim, A.; Rath, G.K. Management of glioblastoma after recurrence: A changing paradigm. J. Egypt. Natl. Cancer Inst. 2016, 28, 199–210. [Google Scholar] [CrossRef]
- Seystahl, K.; Hentschel, B.; Loew, S.; Gramatzki, D.; Felsberg, J.; Herrlinger, U.; Westphal, M.; Schackert, G.; Thon, N.; Tatagiba, M.; et al. Bevacizumab versus alkylating chemotherapy in recurrent glioblastoma. J. Cancer Res. Clin. Oncol. 2020, 146, 659–670. [Google Scholar] [CrossRef]
- Huang, R.Y.; Neagu, M.R.; Reardon, D.A.; Wen, P.Y. Pitfalls in the Neuroimaging of Glioblastoma in the Era of Antiangiogenic and Immuno/Targeted Therapy—Detecting Illusive Disease, Defining Response. Front. Neurol. 2015, 6. [Google Scholar] [CrossRef]
- Alexander, B.M.; Cloughesy, T.F. Adult Glioblastoma. J. Clin. Oncol. 2017, 35, 2402–2409. [Google Scholar] [CrossRef]
- Zhao, Y.-H.; Wang, Z.-F.; Pan, Z.-Y.; Péus, D.; Delgado-Fernandez, J.; Pallud, J.; Li, Z.-Q. A Meta-Analysis of Survival Outcomes Following Reoperation in Recurrent Glioblastoma: Time to Consider the Timing of Reoperation. Front. Neurol. 2019, 10, 286. [Google Scholar] [CrossRef]
- Rossignol, J.; Srinageshwar, B.; Dunbar, G.L. Current Therapeutic Strategies for Glioblastoma. Brain Sci. 2019, 10, 15. [Google Scholar] [CrossRef]
- Saksena, S.; Jain, R.; Narang, J.; Scarpace, L.; Schultz, L.R.; Lehman, N.L.; Hearshen, D.; Patel, S.C.; Mikkelsen, T. Predicting survival in glioblastomas using diffusion tensor imaging metrics. J. Magn. Reson. Imaging 2010, 32, 788–795. [Google Scholar] [CrossRef]
- Coban, G.; Mohan, S.; Kural, F.; Wang, S.; O’Rourke, D.M.; Poptani, H. Prognostic Value of Dynamic Susceptibility Contrast-Enhanced and Diffusion-Weighted MR Imaging in Patients with Glioblastomas. Am. J. Neuroradiol. 2015, 36, 1247–1252. [Google Scholar] [CrossRef]
- Madsen, H.; Hellwinkel, J.E.; Graner, M.W. Clinical Trials in Glioblastoma—Designs and Challenges. In Molecular Considerations and Evolving Surgical Management Issues in the Treatment of Patients with a Brain Tumor; Lichtor, T., Ed.; InTech: New York, NY, USA, 2015; ISBN 978-953-51-2031-5. [Google Scholar]
- Gonçalves, F.G.; Chawla, S.; Mohan, S. Emerging MRI Techniques to Redefine Treatment Response in Patients with Glioblastoma: MRI Treatment Response in Glioblastoma. J. Magn. Reson. Imaging 2020. [Google Scholar] [CrossRef]
- Aum, D.J.; Kim, D.H.; Beaumont, T.L.; Leuthardt, E.C.; Dunn, G.P.; Kim, A.H. Molecular and cellular heterogeneity: The hallmark of glioblastoma. FOC 2014, 37, E11. [Google Scholar] [CrossRef]
- Friedmann-Morvinski, D. Glioblastoma Heterogeneity and Cancer Cell Plasticity. Crit. Rev. Oncog. 2014, 19, 327–336. [Google Scholar] [CrossRef]
- Mansoor, N.M.; Thust, S.; Militano, V.; Fraioli, F. PET imaging in glioma: Techniques and current evidence. Nucl. Med. Commun. 2018, 39, 1064–1080. [Google Scholar] [CrossRef]
- Van Dijken, B.R.J.; van Laar, P.J.; Smits, M.; Dankbaar, J.W.; Enting, R.H.; van der Hoorn, A. Perfusion MRI in treatment evaluation of glioblastomas: Clinical relevance of current and future techniques. J. Magn. Reson. Imaging 2019, 49, 11–22. [Google Scholar] [CrossRef]
- Shukla, G.; Alexander, G.S.; Bakas, S.; Nikam, R.; Talekar, K.; Palmer, J.D.; Shi, W. Advanced magnetic resonance imaging in glioblastoma: A review. Chin. Clin. Oncol. 2017, 6, 40. [Google Scholar] [CrossRef]
- Drake-Pérez, M.; Boto, J.; Fitsiori, A.; Lovblad, K.; Vargas, M.I. Clinical applications of diffusion weighted imaging in neuroradiology. Insights Imaging 2018, 9, 535–547. [Google Scholar] [CrossRef]
- Yanagihara, T.K.; Wang, T.J.C. Diffusion-weighted imaging of the brain for glioblastoma: Implications for radiation oncology. Appl. Radiat. Oncol. 2014, 9, 5–13. [Google Scholar]
- Schmainda, K.M. Diffusion-weighted MRI as a biomarker for treatment response in glioma. CNS Oncol. 2012, 1, 169–180. [Google Scholar] [CrossRef]
- Salama, G.R.; Heier, L.A.; Patel, P.; Ramakrishna, R.; Magge, R.; Tsiouris, A.J. Diffusion Weighted/Tensor Imaging, Functional MRI and Perfusion Weighted Imaging in Glioblastoma—Foundations and Future. Front. Neurol. 2018, 8, 660. [Google Scholar] [CrossRef]
- Li, C.; Wang, S.; Yan, J.-L.; Piper, R.J.; Liu, H.; Torheim, T.; Kim, H.; Zou, J.; Boonzaier, N.R.; Sinha, R.; et al. Intratumoral Heterogeneity of Glioblastoma Infiltration Revealed by Joint Histogram Analysis of Diffusion Tensor Imaging. Neurosurgery 2019, 85, 524–534. [Google Scholar] [CrossRef]
- Puig, J.; Sánchez-González, J.; Blasco, G.; Daunis-i-Estadella, P.; Federau, C.; Alberich-Bayarri, Á.; Biarnes, C.; Nael, K.; Essig, M.; Jain, R.; et al. Intravoxel Incoherent Motion Metrics as Potential Biomarkers for Survival in Glioblastoma. PLoS ONE 2016, 11, e0158887. [Google Scholar] [CrossRef]
- Chakhoyan, A.; Woodworth, D.C.; Harris, R.J.; Lai, A.; Nghiemphu, P.L.; Liau, L.M.; Pope, W.B.; Cloughesy, T.F.; Ellingson, B.M. Mono-exponential, diffusion kurtosis and stretched exponential diffusion MR imaging response to chemoradiation in newly diagnosed glioblastoma. J. Neurooncol. 2018, 139, 651–659. [Google Scholar] [CrossRef]
- Khan, U.A.; Rennert, R.C.; White, N.S.; Bartsch, H.; Farid, N.; Dale, A.M.; Chen, C.C. Diagnostic utility of restriction spectrum imaging (RSI) in glioblastoma patients after concurrent radiation-temozolomide treatment: A pilot study. J. Clin. Neurosci. 2018, 58, 136–141. [Google Scholar] [CrossRef]
- Krishnan, A.P.; Karunamuni, R.; Leyden, K.M.; Seibert, T.M.; Delfanti, R.L.; Kuperman, J.M.; Bartsch, H.; Elbe, P.; Srikant, A.; Dale, A.M.; et al. Restriction Spectrum Imaging Improves Risk Stratification in Patients with Glioblastoma. Am. J. Neuroradiol. 2017, 38, 882–889. [Google Scholar] [CrossRef]
- Holland, E.; Ene, C. Personalized Medicine for Gliomas. Surg. Neurol. Int. 2015, 6, 89. [Google Scholar] [CrossRef]
- Nuzzo, S.; Brancato, V.; Affinito, A.; Salvatore, M.; Cavaliere, C.; Condorelli, G. The Role of RNA and DNA Aptamers in Glioblastoma Diagnosis and Therapy: A Systematic Review of the Literature. Cancers 2020, 12, 2173. [Google Scholar] [CrossRef]
- Zhang, P.; Liu, B. Differentiation among Glioblastomas, Primary Cerebral Lymphomas, and Solitary Brain Metastases Using Diffusion-Weighted Imaging and Diffusion Tensor Imaging: A PRISMA-Compliant Meta-analysis. ACS Chem. Neurosci. 2020, 11, 477–483. [Google Scholar] [CrossRef]
- Suh, C.H.; Kim, H.S.; Jung, S.C.; Park, J.E.; Choi, C.G.; Kim, S.J. MRI as a diagnostic biomarker for differentiating primary central nervous system lymphoma from glioblastoma: A systematic review and meta-analysis: Differentiating PCNSL from Glioblastoma. J. Magn. Reson. Imaging 2019, 50, 560–572. [Google Scholar] [CrossRef]
- Lu, X.; Xu, W.; Wei, Y.; Li, T.; Gao, L.; Fu, X.; Yao, Y.; Wang, L. Diagnostic performance of DWI for differentiating primary central nervous system lymphoma from glioblastoma: A systematic review and meta-analysis. Neurol. Sci. 2019, 40, 947–956. [Google Scholar] [CrossRef]
- Hayden, J.A.; Côté, P.; Bombardier, C. Evaluation of the Quality of Prognosis Studies in Systematic Reviews. Ann. Intern. Med. 2006, 144, 427. [Google Scholar] [CrossRef]
- Hayden, J.A.; van der Windt, D.A.; Cartwright, J.L.; Côté, P.; Bombardier, C. Assessing bias in studies of prognostic factors. Ann. Intern. Med. 2013, 158, 280–286. [Google Scholar] [CrossRef]
- Yamasaki, F.; Sugiyama, K.; Ohtaki, M.; Takeshima, Y.; Abe, N.; Akiyama, Y.; Takaba, J.; Amatya, V.J.; Saito, T.; Kajiwara, Y.; et al. Glioblastoma treated with postoperative radio-chemotherapy: Prognostic value of apparent diffusion coefficient at MR imaging. Eur. J. Radiol. 2010, 73, 532–537. [Google Scholar] [CrossRef]
- Ellingson, B.M.; Cloughesy, T.F.; Lai, A.; Mischel, P.S.; Nghiemphu, P.L.; Lalezari, S.; Schmainda, K.M.; Pope, W.B. Graded functional diffusion map-defined characteristics of apparent diffusion coefficients predict overall survival in recurrent glioblastoma treated with bevacizumab. Neuro Oncol. 2011, 13, 1151–1161. [Google Scholar] [CrossRef]
- Deike, K.; Wiestler, B.; Graf, M.; Reimer, C.; Floca, R.O.; Bäumer, P.; Kickingereder, P.; Heiland, S.; Schlemmer, H.-P.; Wick, W.; et al. Prognostic value of combined visualization of MR diffusion and perfusion maps in glioblastoma. J. Neurooncol. 2016, 126, 463–472. [Google Scholar] [CrossRef]
- Zolal, A.; Juratli, T.A.; Linn, J.; Podlesek, D.; Sitoci Ficici, K.H.; Kitzler, H.H.; Schackert, G.; Sobottka, S.B.; Rieger, B.; Krex, D. Enhancing tumor apparent diffusion coefficient histogram skewness stratifies the postoperative survival in recurrent glioblastoma multiforme patients undergoing salvage surgery. J. Neurooncol. 2016, 127, 551–557. [Google Scholar] [CrossRef]
- Patel, K.S.; Everson, R.G.; Yao, J.; Raymond, C.; Goldman, J.; Schlossman, J.; Tsung, J.; Tan, C.; Pope, W.B.; Ji, M.S.; et al. Diffusion Magnetic Resonance Imaging Phenotypes Predict Overall Survival Benefit from Bevacizumab or Surgery in Recurrent Glioblastoma with Large Tumor Burden. Neurosurgery 2020, nyaa135. [Google Scholar] [CrossRef]
- Li, Y.; Lupo, J.M.; Polley, M.-Y.; Crane, J.C.; Bian, W.; Cha, S.; Chang, S.; Nelson, S.J. Serial analysis of imaging parameters in patients with newly diagnosed glioblastoma multiforme. Neuro Oncol. 2011, 13, 546–557. [Google Scholar] [CrossRef]
- Pope, W.B.; Lai, A.; Mehta, R.; Kim, H.J.; Qiao, J.; Young, J.R.; Xue, X.; Goldin, J.; Brown, M.S.; Nghiemphu, P.L.; et al. Apparent Diffusion Coefficient Histogram Analysis Stratifies Progression-Free Survival in Newly Diagnosed Bevacizumab-Treated Glioblastoma. Am. J. Neuroradiol. 2011, 32, 882–889. [Google Scholar] [CrossRef]
- Ellingson, B.M.; Cloughesy, T.F.; Zaw, T.; Lai, A.; Nghiemphu, P.L.; Harris, R.; Lalezari, S.; Wagle, N.; Naeini, K.M.; Carrillo, J.; et al. Functional diffusion maps (fDMs) evaluated before and after radiochemotherapy predict progression-free and overall survival in newly diagnosed glioblastoma. Neuro Oncol. 2012, 14, 333–343. [Google Scholar] [CrossRef]
- Romano, A.; Calabria, L.F.; Tavanti, F.; Minniti, G.; Rossi-Espagnet, M.C.; Coppola, V.; Pugliese, S.; Guida, D.; Francione, G.; Colonnese, C.; et al. Apparent diffusion coefficient obtained by magnetic resonance imaging as a prognostic marker in glioblastomas: Correlation with MGMT promoter methylation status. Eur. Radiol. 2013, 23, 513–520. [Google Scholar] [CrossRef]
- Pope, W.B.; Qiao, X.J.; Kim, H.J.; Lai, A.; Nghiemphu, P.; Xue, X.; Ellingson, B.M.; Schiff, D.; Aregawi, D.; Cha, S.; et al. Apparent diffusion coefficient histogram analysis stratifies progression-free and overall survival in patients with recurrent GBM treated with bevacizumab: A multi-center study. J. Neurooncol. 2012, 108, 491–498. [Google Scholar] [CrossRef]
- Paldino, M.J.; Desjardins, A.; Friedman, H.S.; Vredenburgh, J.J.; Barboriak, D.P. A change in the apparent diffusion coefficient after treatment with bevacizumab is associated with decreased survival in patients with recurrent glioblastoma multiforme. BJR 2012, 85, 382–389. [Google Scholar] [CrossRef]
- Zikou, A.K.; Alexiou, G.A.; Kosta, P.; Goussia, A.; Astrakas, L.; Tsekeris, P.; Voulgaris, S.; Malamou-Mitsi, V.; Kyritsis, A.P.; Argyropoulou, M.I. Diffusion tensor and dynamic susceptibility contrast MRI in glioblastoma. Clin. Neurol. Neurosurg. 2012, 114, 607–612. [Google Scholar] [CrossRef]
- Sunwoo, L.; Choi, S.H.; Park, C.-K.; Kim, J.W.; Yi, K.S.; Lee, W.J.; Yoon, T.J.; Song, S.W.; Kim, J.E.; Kim, J.Y.; et al. Correlation of apparent diffusion coefficient values measured by diffusion MRI and MGMT promoter methylation semiquantitatively analyzed with MS-MLPA in patients with glioblastoma multiforme. J. Magn. Reson. Imaging 2013, 37, 351–358. [Google Scholar] [CrossRef]
- Ellingson, B.M.; Cloughesy, T.F.; Lai, A.; Nghiemphu, P.L.; Liau, L.M.; Pope, W.B. Quantitative probabilistic functional diffusion mapping in newly diagnosed glioblastoma treated with radiochemotherapy. Neuro Oncol. 2013, 15, 382–390. [Google Scholar] [CrossRef]
- Nakamura, H.; Murakami, R.; Hirai, T.; Kitajima, M.; Yamashita, Y. Can MRI-derived factors predict the survival in glioblastoma patients treated with postoperative chemoradiation therapy? Acta Radiol. 2013, 54, 214–220. [Google Scholar] [CrossRef]
- Mohsen, L.A.; Shi, V.; Jena, R.; Gillard, J.H.; Price, S.J. Diffusion tensor invasive phenotypes can predict progression-free survival in glioblastomas. Br. J. Neurosurg. 2013, 27, 436–441. [Google Scholar] [CrossRef]
- Ellingson, B.M.; Sahebjam, S.; Kim, H.J.; Pope, W.B.; Harris, R.J.; Woodworth, D.C.; Lai, A.; Nghiemphu, P.L.; Mason, W.P.; Cloughesy, T.F. Pretreatment ADC Histogram Analysis Is a Predictive Imaging Biomarker for Bevacizumab Treatment but Not Chemotherapy in Recurrent Glioblastoma. Am. J. Neuroradiol. 2014, 35, 673–679. [Google Scholar] [CrossRef]
- Omuro, A.; Beal, K.; Gutin, P.; Karimi, S.; Correa, D.D.; Kaley, T.J.; DeAngelis, L.M.; Chan, T.A.; Gavrilovic, I.T.; Nolan, C.; et al. Phase II Study of Bevacizumab, Temozolomide, and Hypofractionated Stereotactic Radiotherapy for Newly Diagnosed Glioblastoma. Clin. Cancer Res. 2014, 20, 5023–5031. [Google Scholar] [CrossRef]
- Rahman, R.; Hamdan, A.; Zweifler, R.; Jiang, H.; Norden, A.D.; Reardon, D.A.; Mukundan, S.; Wen, P.Y.; Huang, R.Y. Histogram analysis of apparent diffusion coefficient within enhancing and nonenhancing tumor volumes in recurrent glioblastoma patients treated with bevacizumab. J. Neurooncol. 2014, 119, 149–158. [Google Scholar] [CrossRef]
- Wen, Q.; Jalilian, L.; Lupo, J.M.; Molinaro, A.M.; Chang, S.M.; Clarke, J.; Prados, M.; Nelson, S.J. Comparison of ADC metrics and their association with outcome for patients with newly diagnosed glioblastoma being treated with radiation therapy, temozolomide, erlotinib and bevacizumab. J. Neurooncol. 2015, 121, 331–339. [Google Scholar] [CrossRef]
- Elson, A.; Bovi, J.; Siker, M.; Schultz, C.; Paulson, E. Evaluation of absolute and normalized apparent diffusion coefficient (ADC) values within the post-operative T2/FLAIR volume as adverse prognostic indicators in glioblastoma. J. Neurooncol. 2015, 122, 549–558. [Google Scholar] [CrossRef]
- Lee, E.K.; Choi, S.H.; Yun, T.J.; Kang, K.M.; Kim, T.M.; Lee, S.-H.; Park, C.-K.; Park, S.-H.; Kim, I.H. Prediction of Response to Concurrent Chemoradiotherapy with Temozolomide in Glioblastoma: Application of Immediate Post-Operative Dynamic Susceptibility Contrast and Diffusion-Weighted MR Imaging. Korean J. Radiol. 2015, 16, 1341. [Google Scholar] [CrossRef]
- Zhang, M.; Gulotta, B.; Thomas, A.; Kaley, T.; Karimi, S.; Gavrilovic, I.; Woo, K.M.; Zhang, Z.; Arevalo-Perez, J.; Holodny, A.I.; et al. Large-volume low apparent diffusion coefficient lesions predict poor survival in bevacizumab-treated glioblastoma patients. Neuro Oncol. 2016, 18, 735–743. [Google Scholar] [CrossRef]
- Jamjoom, A.A.B.; Rodriguez, D.; Rajeb, A.T.; Manita, M.A.; Shah, K.A.; Auer, D.P. Magnetic resonance diffusion metrics indexing high focal cellularity and sharp transition at the tumour boundary predict poor outcome in glioblastoma multiforme. Clin. Radiol. 2015, 70, 1400–1407. [Google Scholar] [CrossRef]
- Wen, Q.; Jalilian, L.; Lupo, J.M.; Li, Y.; Roy, R.; Molinaro, A.M.; Chang, S.M.; Prados, M.; Butowski, N.; Clarke, J.; et al. Association of Diffusion and Anatomic Imaging Parameters with Survival for Patients with Newly Diagnosed Glioblastoma Participating in Two Different Clinical Trials. Transl. Oncol. 2015, 8, 446–455. [Google Scholar] [CrossRef]
- Chang, W.; Pope, W.B.; Harris, R.J.; Hardy, A.J.; Leu, K.; Mody, R.R.; Nghiemphu, P.L.; Lai, A.; Cloughesy, T.F.; Ellingson, B.M. Diffusion MR Characteristics Following Concurrent Radiochemotherapy Predicts Progression-Free and Overall Survival in Newly Diagnosed Glioblastoma. Tomography 2015, 1, 37–43. [Google Scholar] [CrossRef]
- Burth, S.; Kickingereder, P.; Eidel, O.; Tichy, D.; Bonekamp, D.; Weberling, L.; Wick, A.; Löw, S.; Hertenstein, A.; Nowosielski, M.; et al. Clinical parameters outweigh diffusion- and perfusion-derived MRI parameters in predicting survival in newly diagnosed glioblastoma. Neuro Oncol. 2016, 18, 1673–1679. [Google Scholar] [CrossRef]
- Shankar, J.J.S.; Bata, A.; Ritchie, K.; Hebb, A.; Walling, S. Normalized Apparent Diffusion Coefficient in the Prognostication of Patients with Glioblastoma Multiforme. Can. J. Neurol. Sci. 2016, 43, 127–133. [Google Scholar] [CrossRef]
- Van der Hoorn, A.; Yan, J.-L.; Larkin, T.J.; Boonzaier, N.R.; Matys, T.; Price, S.J. Posttreatment Apparent Diffusion Coefficient Changes in the Periresectional Area in Patients with Glioblastoma. World Neurosurg. 2016, 92, 159–165. [Google Scholar] [CrossRef]
- Chang, K.; Zhang, B.; Guo, X.; Zong, M.; Rahman, R.; Sanchez, D.; Winder, N.; Reardon, D.A.; Zhao, B.; Wen, P.Y.; et al. Multimodal imaging patterns predict survival in recurrent glioblastoma patients treated with bevacizumab. Neuro Oncol. 2016, 18, 1680–1687. [Google Scholar] [CrossRef]
- Choi, Y.S.; Ahn, S.S.; Kim, D.W.; Chang, J.H.; Kang, S.-G.; Kim, E.H.; Kim, S.H.; Rim, T.H.; Lee, S.-K. Incremental Prognostic Value of ADC Histogram Analysis over MGMT Promoter Methylation Status in Patients with Glioblastoma. Radiology 2016, 281, 175–184. [Google Scholar] [CrossRef]
- Huber, T.; Bette, S.; Wiestler, B.; Gempt, J.; Gerhardt, J.; Delbridge, C.; Barz, M.; Meyer, B.; Zimmer, C.; Kirschke, J.S. Fractional Anisotropy Correlates with Overall Survival in Glioblastoma. World Neurosurg. 2016, 95, 525–534.e1. [Google Scholar] [CrossRef]
- Yan, J.-L.; van der Hoorn, A.; Larkin, T.J.; Boonzaier, N.R.; Matys, T.; Price, S.J. Extent of resection of peritumoral diffusion tensor imaging–detected abnormality as a predictor of survival in adult glioblastoma patients. JNS 2017, 126, 234–241. [Google Scholar] [CrossRef]
- Kondo, M.; Uchiyama, Y. Apparent diffusion coefficient histogram analysis for prediction of prognosis in glioblastoma. J. Neuroradiol. 2018, 45, 236–241. [Google Scholar] [CrossRef]
- Ellingson, B.M.; Gerstner, E.R.; Smits, M.; Huang, R.Y.; Colen, R.; Abrey, L.E.; Aftab, D.T.; Schwab, G.M.; Hessel, C.; Harris, R.J.; et al. Diffusion MRI Phenotypes Predict Overall Survival Benefit from Anti-VEGF Monotherapy in Recurrent Glioblastoma: Converging Evidence from Phase II Trials. Clin. Cancer Res. 2017, 23, 5745–5756. [Google Scholar] [CrossRef]
- Galla, N.; Chiang, G.; Chakraborty, S.; Singh, R.; John Tsiouris, A.; Boockvar, J.; Kovanlikaya, I. Apparent diffusion coefficient changes predict survival after intra-arterial bevacizumab treatment in recurrent glioblastoma. Neuroradiology 2017, 59, 499–505. [Google Scholar] [CrossRef]
- Boonzaier, N.R.; Larkin, T.J.; Matys, T.; van der Hoorn, A.; Yan, J.-L.; Price, S.J. Multiparametric MR Imaging of Diffusion and Perfusion in Contrast-enhancing and Nonenhancing Components in Patients with Glioblastoma. Radiology 2017, 284, 180–190. [Google Scholar] [CrossRef]
- Heiland, D.H.; Simon-Gabriel, C.P.; Demerath, T.; Haaker, G.; Pfeifer, D.; Kellner, E.; Kiselev, V.G.; Staszewski, O.; Urbach, H.; Weyerbrock, A.; et al. Integrative Diffusion-Weighted Imaging and Radiogenomic Network Analysis of Glioblastoma multiforme. Sci. Rep. 2017, 7, 43523. [Google Scholar] [CrossRef]
- Bae, S.; Choi, Y.S.; Ahn, S.S.; Chang, J.H.; Kang, S.-G.; Kim, E.H.; Kim, S.H.; Lee, S.-K. Radiomic MRI Phenotyping of Glioblastoma: Improving Survival Prediction. Radiology 2018, 289, 797–806. [Google Scholar] [CrossRef]
- Rulseh, A.M.; Vymazal, J. Whole brain apparent diffusion coefficient measurements correlate with survival in glioblastoma patients. J. Neurooncol. 2020, 146, 157–162. [Google Scholar] [CrossRef]
- Kim, B.S.; Kim, S.T.; Kim, J.H.; Seol, H.J.; Nam, D.-H.; Shin, H.J.; Lee, J.-I.; Kong, D.-S. Apparent Diffusion Coefficient as a Predictive Biomarker for Survival in Patients with Treatment-Naive Glioblastoma Using Quantitative Multiparametric Magnetic Resonance Profiling. World Neurosurg. 2019, 122, e812–e820. [Google Scholar] [CrossRef]
- Buemi, F.; Guzzardi, G.; Del Sette, B.; Sponghini, A.P.; Matheoud, R.; Soligo, E.; Trisoglio, A.; Carriero, A.; Stecco, A. Apparent diffusion coefficient and tumor volume measurements help stratify progression-free survival of bevacizumab-treated patients with recurrent glioblastoma multiforme. Neuroradiol. J. 2019, 32, 241–249. [Google Scholar] [CrossRef]
- Petrova, L.; Korfiatis, P.; Petr, O.; LaChance, D.H.; Parney, I.; Buckner, J.C.; Erickson, B.J. Cerebral blood volume and apparent diffusion coefficient–Valuable predictors of non-response to bevacizumab treatment in patients with recurrent glioblastoma. J. Neurol. Sci. 2019, 405, 116433. [Google Scholar] [CrossRef]
- Flores-Alvarez, E.; Durand-Muñoz, C.; Cortes-Hernandez, F.; Muñoz-Hernandez, O.; Moreno-Jimenez, S.; Roldan-Valadez, E. Clinical Significance of Fractional Anisotropy Measured in Peritumoral Edema as a Biomarker of Overall Survival in Glioblastoma: Evidence Using Correspondence Analysis. Neurol. India 2019, 67, 1074. [Google Scholar] [CrossRef]
- Li, C.; Wang, S.; Serra, A.; Torheim, T.; Yan, J.-L.; Boonzaier, N.R.; Huang, Y.; Matys, T.; McLean, M.A.; Markowetz, F.; et al. Multi-parametric and multi-regional histogram analysis of MRI: Modality integration reveals imaging phenotypes of glioblastoma. Eur. Radiol. 2019, 29, 4718–4729. [Google Scholar] [CrossRef]
- Mohan, S.; Wang, S.; Coban, G.; Kural, F.; Chawla, S.; O’Rourke, D.M.; Poptani, H. Detection of occult neoplastic infiltration in the corpus callosum and prediction of overall survival in patients with glioblastoma using diffusion tensor imaging. Eur. J. Radiol. 2019, 112, 106–111. [Google Scholar] [CrossRef]
- Yan, J.-L.; Li, C.; Boonzaier, N.R.; Fountain, D.M.; Larkin, T.J.; Matys, T.; van der Hoorn, A.; Price, S.J. Multimodal MRI characteristics of the glioblastoma infiltration beyond contrast enhancement. Adv. Neurol. Disord. 2019, 12. [Google Scholar] [CrossRef]
- Park, J.E.; Kim, H.S.; Jo, Y.; Yoo, R.-E.; Choi, S.H.; Nam, S.J.; Kim, J.H. Radiomics prognostication model in glioblastoma using diffusion- and perfusion-weighted MRI. Sci. Rep. 2020, 10, 4250. [Google Scholar] [CrossRef]
- Song, J.; Kadaba, P.; Kravitz, A.; Hormigo, A.; Friedman, J.; Belani, P.; Hadjipanayis, C.; Ellingson, B.M.; Nael, K. Multiparametric MRI for early identification of therapeutic response in recurrent glioblastoma treated with immune checkpoint inhibitors. Neuro Oncol. 2020, noaa066. [Google Scholar] [CrossRef]
- Ellingson, B.M.; Wen, P.Y.; van den Bent, M.J.; Cloughesy, T.F. Pros and cons of current brain tumor imaging. Neuro Oncol. 2014, 16, vii2–vii11. [Google Scholar] [CrossRef]
- Nam, J.Y.; de Groot, J.F. Treatment of Glioblastoma. JOP 2017, 13, 629–638. [Google Scholar] [CrossRef]
- Norvell, D. Study types and bias—Don’t judge a study by the abstract’s conclusion alone. Evid. Based Spine-Care J. 2010, 1, 7–10. [Google Scholar] [CrossRef]
- Wang, Q.; Lei, D.; Yuan, Y.; Xiong, N. Accuracy of ADC derived from DWI for differentiating high-grade from low-grade gliomas: Systematic review and meta-analysis. Medicine 2020, 99, e19254. [Google Scholar] [CrossRef]
- Oltra-Sastre, M.; Fuster-Garcia, E.; Juan-Albarracin, J.; Sáez, C.; Perez-Girbes, A.; Sanz-Requena, R.; Revert-Ventura, A.; Mocholi, A.; Urchueguia, J.; Hervas, A.; et al. Multi-parametric MR Imaging Biomarkers Associated to Clinical Outcomes in Gliomas: A Systematic Review. CMIR 2019, 15, 933–947. [Google Scholar] [CrossRef]
- Pujol, S.; Wells, W.; Pierpaoli, C.; Brun, C.; Gee, J.; Cheng, G.; Vemuri, B.; Commowick, O.; Prima, S.; Stamm, A.; et al. The DTI Challenge: Toward Standardized Evaluation of Diffusion Tensor Imaging Tractography for Neurosurgery: The DTI Challenge on Tractography for Neurosurgery. J. Neuroimaging 2015, 25, 875–882. [Google Scholar] [CrossRef]
- Langen, K.-J.; Galldiks, N.; Hattingen, E.; Shah, N.J. Advances in neuro-oncology imaging. Nat. Rev. Neurol. 2017, 13, 279–289. [Google Scholar] [CrossRef]
- Zacharaki, E.I.; Morita, N.; Bhatt, P.; O’Rourke, D.M.; Melhem, E.R.; Davatzikos, C. Survival Analysis of Patients with High-Grade Gliomas Based on Data Mining of Imaging Variables. Am. J. Neuroradiol. 2012, 33, 1065–1071. [Google Scholar] [CrossRef]
- Nie, D.; Zhang, H.; Adeli, E.; Liu, L.; Shen, D. 3D Deep Learning for Multi-modal Imaging-Guided Survival Time Prediction of Brain Tumor Patients. In Medical Image Computing and Computer-Assisted Intervention–MICCAI 2016; Ourselin, S., Joskowicz, L., Sabuncu, M.R., Unal, G., Wells, W., Eds.; Lecture Notes in Computer Science; Springer International Publishing: Cham, Switzerland, 2016; Volume 9901, pp. 212–220. ISBN 978-3-319-46722-1. [Google Scholar]


| Author | Year | Np | Study Design (P/R) | Diagnosis (ND/R) | Treatment | MRI Timepoints | Diffusion Model/s | Diffusion Acquisition Details | Diffusion Metrics Investigated | SO | ROI Info | Survival Analysis | Main Findings |
|---|---|---|---|---|---|---|---|---|---|---|---|---|---|
| Saksena et al. [11] | 2010 | 34 | R | ND | Surgery/biopsy; RT; Chemotherapy | Preoperative | DTI | FS = 3 T, Seq.= EPI, FOV = 128 × 128 mm, TR = 17 ms, TE = 84.3 ms, ST = 5 mm, no gape, NEX = 1, gradients applied in 25 non collinear directions, b = 0, 1000 s/mm2 | FA, ADC, CL, CP, and CS (mean and min) | PFS | ROIs on FLAIR signal abnormality in CEL and NEL; manual segmentation. | Kaplan–Meier survival curves; univariate and multivariate Cox proportional hazards models adjusted for age, KPS, EOR. | Univariate analysis showed that min values of FA, MD, CP, CS were associated with PFS rate. The multivariate analysis demonstrated that only min CP was a PFS predictor. |
| Li et al. [41] | 2011 | 64 | P | ND | Surgery/biopsy; RT; Chemotherapy: 23 TMZ, 29 TMZ with tarceva, 10 poly ICLC, 2 R115777 | Postoperative: pre-treatment, post-treatment | DWI | FS = 3 T or 1.5T, Directions: 3–6, Seq. = EPI, TR/TE = 5000–10,000/63–110 ms, matrix 128 × 128 or 256 × 256, ST 3–5 mm, 21–40 slices, b 0–1000 s/mm2. | nADC median and percentiles (pre-RT, changes between preRT and post-RT) | OS, PFS | ROIs on NAWM, CEL, T2 hyperintensity lesions, and the NE lesion; automatic segmentation | Kaplan–Meier survival curves; Univariate and multivariate Cox proportional hazards models adjusted for age and field strength. | No diffusion parameters associated with OS or PFS in univariate analysis; lower nADC in CEL and higher nADC in T2 hyperintensity lesion and NEL associated with worse OS in multivariate analysis. |
| Pope et al. [42] | 2011 | 121 | R | ND | Surgery/biopsy; RT; Chemotherapy post resection: 59 TMZ and BV, 62 TMZ. Chemotherapy on recurrence: 34 add BV. | Preoperative | DWI | FS = 1.5 T, Seq. = EPI, section thickness of 3–5 mm, FOV of 24 cm, matrix size: 256 × 256 for most patients. b = 0, 1000 s/mm2. | ADC_L (2-GMM histogram) | OS, PFS | ROIs on T1CEL; semiautomatic segmentation. | Kaplan–Meier with log-rank and Wilcoxon test; uni- and multivariate Cox regression models with RPA class and MGMT methylation status | ADC values did not stratify OS and PFS in the control group; pretreatment ADC histogram analysis can stratify PFS in BV-treated patients with newly diagnosed GBM. |
| Ellingson et al. [43] | 2012 | 143 | R | ND | Surgery/biopsy; RT; Chemotherapy: TMZ | Postoperative: pretreatment, posttreatment | DWI | FS = 1.5 T, Seq. = EPI, TE/TR = 102.2/8000 ms, NEX = 1, ST = 5 mm, gap = 1 mm, matrix size = 128 × 128, FOV = 24 cm using a twice-refocused epi, b = 0 s/mm2 and b = 1000 s/mm2 | fDM metrics | OS, PFS | ROIs on regions of FLAIR signal abnormality and T1 CEL; segmentation method not specified | Log-rank analysis of Kaplan–Meier curves; Cox-regression analysis adjusted for age and KPS | Patients exhibiting a large volume of tissue with decreased ADC are statistically more likely to have a short PFS and OS. |
| Romano et al. [44] | 2012 | 47 | R | ND | Surgery; RT; Chemotherapy: TMZ following by adjuvant tmz therapy. | Preoperative | DWI | FS = 1.5 T, Seq. = EPI, b-values 0, 500, and 1000 s/mm2, ST = 5 mm; TR= 3000 ms; TE = 84 ms; gap, = 0.3mm; matrix = 256 × 256 mm, acquisition time = 1.40 min. | ADC min | OS, PFS | ROIs on T1CEL; semiautomatic segmentation. | Kaplan–Meier, log rank, uni- and multivariate Cox regression models with MGMT methylation status | patients with high ADCmin values have higher OS and PFS than patients with low ADCmin values. |
| Pope et al. [45] | 2012 | 97 | R | R | Treatments pre-recurrence: RT and TMZ; Chemotherapy on recurrence: BV or BV and CPT-11 (Irinotecan) | Pretreatment | DWI | NR | ADC_L and LCP (2-GMM histogram) | 6-PFS, overall PFS, OS | ROIs on T1CEL; semiautomatic segmentation. | The Kaplan–Meier method with log-rank test, uni- and multivariate Cox models adjusted for age and enhancing tumour volume at recurrence | ADC-L was predictive for 6-PFS, OS and PFS. LCP alone was only predictive of 6-PFS. |
| Paldino et al. [46] | 2012 | 15 | P | R | Treatments pre-recurrence: RT and TMZ; Chemotherapy on recurrence: BV and Irinotecan | Pretreatment, posttreatment | DTI | FS = 1.5 T, Seq. = EPI, TR/TE = 6000/100 ms; flip angle, 90 degrees; 4 NEX; matrix = 128 × 128; voxel size 1.72 × 1.72 × 5 mm | Changes in MD and FA mean | OS, PFS | ROIs on T1 CEL and abnormalities on FLAIR images; semiautomatic segmentation | Cox proportional hazard model. | Patients with a change in MD within FLAIR signal abnormality region had significantly shorter OS and PFS than those with no change. |
| Zikou et al. [47] | 2012 | 17 | P | ND | Surgery; RT; Chemotherapy: TMZ. | Preoperative | DTI | FS = 1.5 T, Seq. = EPI, TR:9807 ms, TE:131 ms, FOV:230 mm, acquisition matrix: 128 × 128, slice thickness: 3 mm, max b-value: 700 s/mm2, 16 non-collinear diffusion directions | normalized MD and FA | OS | ROIs on T1CEL; manual segmentation | Log-rank analysis of Kaplan–Meier curves; Multivariate Cox regression analysis not performed due to statistical non-significance. | No significant correlation was found between MD, FA and OS. |
| Sunwoo et al. [48] | 2013 | 26 | R | ND | Surgery/biopsy; RT; Chemotherapy: TMZ. | Preoperative | DWI | FS = 1.5 T, TR/TE = 6000/63 (at b 0 and 1000 s/mm2, 25 sections, bandwidth of 1953Hz/voxel, ST 5 mm, gap 1, FOV = 240 × 240 mm, a matrix = 160 × 160, voxel resolution 1.5 × 1.5 × 5.0 mm, directions 3. | ADC mean, ADC 5th percentile (histogram) | PFS | ROIs on T1CEL; manual segmentation | Kaplan–Meier | A positive significant relationship was demonstrated between PFS and the mean ADC. 5th percentile was not significantly associated with PFS. |
| Ellingson et al. [49] | 2013 | 143 | R | ND | Surgery/biopsy; RT; Chemotherapy: TMZ | Postoperative: pretreatment, posttreatment | DWI | FS = 1.5 T, TE/TR = 102.2 ms/8000 ms, NEX = 1, ST = 5 mm, gap = 1, matrix size = 128 × 128, FOV = 24 cm using a twice-refocused EPI, b 1000 s/mm2 and b 0 s/mm2. | prob-fDM metrics | OS, PFS | ROIs on regions of FLAIR signal abnormality; semiautomatic segmentation | Log-rank analysis of Kaplan–Meier curves | Patients with a large volume fraction of tumour showing a decrease in ADC through prob-fDM had a significantly shorter PFS and OS. |
| Nakamura et al. [50] | 2013 | 138 | R | ND | Surgery/biopsy; RT; Chemotherapy | Preoperative | DWI | FS = 1.5 T, Seq. = EPI, TE/TR = 3600/81 ms, ST = 5, gap = 1 mm, 128 × 128 matrix, 230 mm FOV, one acquisition, b = 1000 s/mm2 | ADC min | OS, PFS | ROIs on T1CEL; manual segmentation | Log-rank analysis of Kaplan–Meier curves; multivariate Cox regression analysis with age, KPS and surgery/biopsy | Tumours with low ADC min are associated with low PFS and OS. |
| Mohsen et al. [51] | 2013 | 25 | R | ND | Surgery; RT; Chemotherapy: TMZ. | Preoperative or immediately postoperative | DTI | FS = 1.5 T, Seq. = EPI, TR/TE: 12 k/95 ms, ST/inter-slice gap: 4/4 mm, resolution 256 × 256, 25 directions, two b = 0, 1000 s/mm2 FOV: 24 × 24 cm. | p and q maps pattern (diffuse, localised or minimally invasive | PFS | ROIs on the visible abnormality on p and q maps; manual segmentation | Log-rank analysis of Kaplan–Meier curves; univariate Cox regression analysis | Invasiveness of DTI pattern was associated with PFS. A minimal invasive pattern predicts a higher PFS. |
| Ellingson et al. [52] | 2013 | 132 | R | R | Chemotherapy: 89 patients BV; 43 variety of chemotherapies but never exposed to BV | Pretreatment | DWI | FS = 1.5 or 3 T, Seq. = EPI, TE/TR = 80–110 ms/4–10 s, 1 average, section thickness = 5 mm with gap = 1 mm, matrix size = 128 × 128, and FOV = 22–25 cm, b = 1000 and b 0 s/mm2. | ADC_L (2-GMM histogram) | OS, PFS | ROIs on T1CEL; semiautomatic segmentation | Log-rank analysis of Kaplan–Meier curves; univariate and multivariate Cox regression analysis adjusted for age, treatment cohort | Patients with lower ADC_L had a significantly longer PFS and OS compared with those having higher ADC_L. |
| Omuro et al. [53] | 2014 | 40 | P | ND | Surgery/biopsy; RT; Chemotherapy: TMZ and BV | Postoperative (pretreatment) | DWI | NR | nADC mean | PFS, 1y-OS | ROIs on T1 CEL; manual segmentation | Log-rank analysis of Kaplan–Meier curves | Lower baseline ADC was associated with prolonged OS, but not PFS. |
| Rahman et al. [54] | 2014 | 91 | R | R | Treatments pre-recurrence: standard radiation and TMZ therapy; Chemotherapy on recurrence: BV | Pretreatment | DWI | FS = 1.5, Seq. = monopolar EPI, TE/TR = 80–110 ms/4–10 ms, ST = 5 mm, gap = 1 mm, matrix size = 128 × 128 mm, FOV = 22–25 cm, b value 1000 and 0 s/mm2 | %ADC_L, %ADC_H, and ADC_L/ADC_M (4-GMM histogram) | OS, PFS | ROIs on T1 CEL NE T2/FLAIR abnormality; automatic segmentation | Kaplan–Meier curves; uni- and multivariable analysis with Cox proportional hazards model adjusted for clinical variables | Baseline ADC_L/ADC_M within NE T2/FLAIR volume and ADC_H within T1 CEL can stratify OS and PFS. |
| Wen at al. [55] | 2015 | 36 | R | ND | Surgery/biopsy; RT; Chemotherapy: TMZ, erlotinib and BV. | Postoperative: pretreatment and posttreatment at 1 month, 2 months and every 2 months (up to a maximum of 14 months) | DWI | FS = 3 T, b = 1000 (dir = 6, NEX = 4) and ADC maps were calculated using in-house developed software. | ADC percentiles (histogram); 2-GMM histogram metrics; fDM metrics | OS, PFS | ROIs on T1 CEL and T2/FLAIR hyperintensity; semiautomatic segmentation | Kaplan–Meier curves; Univariate and multivariate Cox regression analysis adjusted for age, KPS, EOR | ADC10% within the T2L at 2 months was strongly associated with OS and PFS. fDM metrics showed an association with OS and PFS within the CEL when considered by univariate analysis, but not in the T2L. |
| Coban et al. [12] | 2015 | 58 | R | ND | Surgery; RT; Chemotherapy | Preoperative | DWI | FS = 3 T, Seq. = EPI, acceleration factor of 2, FOV = 22 × 22 cm2; b 0, 1000 s/mm2, section thickness = 3 mm; number of sections = 40; acquisition time = 8 min. | ADC min | 15 months OS | ROIs on T1 CEL and visually low ADC; manual segmentation | ROC analysis, Kaplan–Meier curves | ADC min was not useful for differentiating patients having short or long survival. |
| Elson et al. [56] | 2015 | 52 | R | ND | Surgery; RT; Chemotherapy | Postoperative | DWI | NR | ADCmean, ADCmin, nADCmean, nADCmin | OS, PFS | ROIs on hyperintense T2/FLAIR; manual segmentation | Log-rank analysis on Kaplan–Meier data; multivariate Cox regression analysis adjusted for age, EOR, KPS | Regression analysis indicated that normalized ADC values provide the strongest association with PFS and OS. |
| Lee et al. [57] | 2015 | 24 | R | ND | Surgery; RT; Chemotherapy: TMZ | Postoperative | DWI | FS = 3 T, Seq. = EPI, b-values of 0 and 1000 s/mm2, three orthogonal directions. | nADC (histogram metrics) | PFS | ROIs on T1 CEL; manual segmentation | Log-rank analysis on Kaplan–Meier data | nADC not associated with PFS |
| Zhang et al. [58] | 2015 | 52 | R | R | Treatments pre-recurrence: surgical resection + RT + TMZ; Chemotherapy on recurrence: BV | Pretreatment; 2 posttreatment scans | DWI | FS = 1.5 or 3 T, Seq. = EPI, b = 0 and 3 diffusion-weighted acquisitions with b 1000 s/mm2 | low-ADC volume and percent change, normalized 5th percentile low ADC values and percent changes | OS | ROIs on T1 CEL and FLAIR hyperintense abnormality corresponding to low ADC signal; manual segmentation | Kaplan–Meier curves; uni- and multivariate Cox regression analysis with clinical and imaging metrics | At the second post-BV scan, the volume of the low-ADC lesion was inversely associated with OS. Normalized 5th percentile low-ADC value and its percent change were not associated with OS. |
| Jamjoom et al. [59] | 2015 | 46 | R | ND | No surgery; 4 treatment groups | Preoperative | DTI | FS = 3 T, Seq. = EPI, Acceleration factor of 2, b = 0 and b = 1000, six directions, TR = 2435–4813 ms, TE = 48–62 ms, voxel size 1.6 × 1.6 × 5 mm, FOV = 230 × 180 × 159 mm. 15 directions, TR = 3175–8000 ms, TE = 57–90 ms, voxel size 2 × 2 × 3.3 mm, FOV 224 × 224 × 105 mm | MDmin (from MD map); histogram metrics (from MD gradient maps) | OS | ROIs on T1 CEL that visually appeared dark on the MD maps; semiautomatic segmentation | Univariate and multivariate Cox regression analysis adjusted for treatment protocol and gender | Lower minMD and higher MD gradient values for the 10th and 75th percentile of the tumour boundary predict short OS. |
| Wen at al. [60] | 2015 | 75 | R | ND | Surgery/biopsy; 44 RT; Chemotherapy: TMZ and enzastaur, 31 TMZ + erlotinib and BV | Postoperative: pretreatment, posttreatment (after 1, 2 and 4 months) | DTI | FS = 3 T, six-directional, Seq. = DWI, b = 1000 s/mm2, number of excitations = 4. | MD, FA and longitudinal and radial eigenvalues (histogram metrics) | OS, PFS | ROIs on T1 CEL and T2 hyperintense lesions; manual segmentation | Log-rank analysis on Kaplan–Meier data; multivariate Cox regression analysis adjusted for age, EOR, KPS | For the TMZ + enza cohort: volumes of regions with low MD values at 1-month scan associated with OS and at 2-month scan associated with PFS. For the TMZ + erl + bev cohort, volumetric diffusion parameters and MD and EVrad were associated with OS and PFS at different timepoints. |
| Chang et al. [61] | 2015 | 120 | R | ND | Surgery/biopsy; RT; Chemotherapy: TMZ following by adjuvant tmz therapy. | Postoperative | DWI | FS = 1.5 T, TE/TR = 80–120 ms/5000 ms, matrix size = 128 128, ST = 3 mm with no interslice gap, and b-values of 0 and 1000 s/mm2 in three orthogonal directions. | ADC_L, ADC_H (2-GMM histogram) | OS, PFS | ROIs on CEL on T1 subtraction images; segmentation method not specified | Log-rank analysis on Kaplan–Meier data and multivariate Cox regression analysis adjusted for age | Patients with lower ADC_L have shorter OS and PFS. ADC_H was not predictive. |
| Burth et al. [62] | 2016 | 125 | R | ND | Surgery/biopsy; Radiotherapy and Chemotherapy: 5 different treatment regimens | Preoperative | DWI | FS = 3 T, TR = 5300 ms, TE = 90 ms, b 0 and b 1200, pixel size 1.769 mm/1.769 mm, image matrix 130 × 130, ST 5 mm, flip angle 908, FoV = 229 × 229 mm. | ADC histogram metrics | OS, PFS | ROIs on T1 CEL and T2/FLAIR hyperintensity; semiautomatic segmentation | Univariate and multivariable Cox regression analyses including age, sex, EOR, KPS, rCBV | Univariate analysis showed that 10th percentile ADC in CEL and T2/FLAIR were significantly associated with OS, but not with PFS. In multivariable analysis diffusion-derived MRI parameters did not predict survival. |
| Shankar et al. [63] | 2016 | 84 | R | ND | Surgery/biopsy; RT; Chemotherapy: TMZ | Preoperative | DWI | FS = 1.5 T, Seq. = EPI. TR = 8000 ms, TE = 73.6 ms, FOV = 260 mm, matrix size = 160 × 192, section ST = 5 mm, gap = 1.5 mm, b = 0 and b = 1000 in three orthogonal directions. | nADC min | OS | Whole tumour volume identified on T1 CEL and FLAIR; restricted diffusion ROIs identified on ADC map; manual segmentation | Log-rank analysis on Kaplan–Meier data and multivariate Cox regression analysis | Positive association between nADC min and OS. |
| Van der Hoorn et al. [64] | 2016 | 14 | R | ND | Surgery; RT; Chemotherapy: TMZ and adjuvant TMZ | Postoperative: preradiotherapy, postradiotherapy | DWI | FS = 1.5 T, Seq. = EPI, TR/TE = 6000–12,500/64–108 ms; flip angle 90°; FOV 220–300 × 220–300 mm; 52–66 slices; 0–4 mm slice gap; voxel size 0.86–1.2 × 0.86–1.2 × 4–5 mm, b-value of 0 and 1000 s/mm2, scanned in 3–25 directions. | nADC histogram metrics | OS, PFS | ROIs automatically segmented in periresectional area and manually adjusted. | Univariate and multivariate Cox regression analysis adjusted for age and MGMT methylation status | The increase in ADC value postradiotherapy in comparison to preradiotherapy did not predict an increase in PFS or OS neither in univariate nor multivariate analysis. |
| Chang et al. [65] | 2016 | 126 | R | R | Treatments pre-recurrence: surgical resection + RT + TMZ; Chemotherapy on recurrence: BV | Pretreatment, posttreatment | DWI | Seq. = Monopolar EPI, TE/TR = 80–110 ms/4–10 s, section thickness = 5 mm, gap = 1 mm, matrix size = 128 × 128 mm, FOV= 22–25 cm, b-value 1000 and 0 s/mm2. | ADC (texture, 4-GMM histogram metrics) | OS, PFS | ROIs on T1 CEL, T2/FLAIR; semiautomatic segmentation | Machine-learning predictive model based on random-forest and including conventional MRI and DWI metrics | Model based on multiparametric MRI imaging metrics (of which DWI) was able to predict OS |
| Zolal et al. [39] | 2016 | 31 | R | R | Surgery; RT; Chemotherapy: TMZ | Preoperative (prior to second surgery) | DWI | FS = 1.5 T, b = 0 and 1000 s/mm2, ST of 5 mm, and voxel sizes between 0.9 and 2 mm. | ADC histogram metrics | OS, PFS, Survival after 2nd surgery | ROIs in T1 CEL (manual selection or semi-automated adaptive thresholding) | Log-rank analysis on Kaplan–Meier data and multivariate Cox regression analysis including also age, EOR, tumour size | ADC histogram skewness associated with OS and PFS in univariate analysis and with survival after 2nd surgery in multivariate analysis. |
| Choi et al. [66] | 2016 | 112 | R | ND | Surgery; RT; Chemotherapy: TMZ. | Preoperative | DTI | FS = 3 T, b values of 600 s/mm2 and 0 s/mm2, 32 directions, FOV = 8413.4/77; 220 mm; section thickness = 2 mm, matrix = 112 × 3 × 112. | MD histogram metrics | 12-OS, 16-OS, 12-PFS | ROIs on T1 CEL; semiautomatic segmentation | Log-rank analysis on Kaplan–Meier data and multivariate Cox regression analysis with MGMT methylation status, age, KPS, EOR | At univariate analysis, lower MD histogram parameters were significant predictors of poor OS and PFS; Multivariable models with MD parameters had significantly higher performances that those without MD parameters for OS and PFS prediction. |
| Huber et al. [67] | 2016 | 122 | R | ND | Surgery; RT; Chemotherapy: TMZ. | Preoperative | DTI | FS = 3 T, DTI direction 15 or 6 directions | mean ADC, FA | OS | ROIs in the CEL, central region (CR), and the FLAIR-hyperintense NE peritumoral region | Kaplan–Meier curves; multivariate Cox regression analysis with age, KPS, tumour volume, infiltration | Patients with low FA values in CEL showed a significantly improved OS in univariate analysis. In multivariate analysis FA values could not be identified as independent prognostic parameters besides clinical factors. |
| Yan et al. [68] | 2016 | 31 | R | ND | Surgery; Chemotherapy: TMZ. | Preoperative, postoperative | DTI | FS = 3 T, Seq. = EPI, TR/TE = 8300/98 ms; flip angle 90°; FOV 192 × 192 mm; 63 slices; no slice gap; and voxel size 2 × 2 × 2 mm, b-values = 0, 350, 650, 1000, 1300, and 1600 s/mm2, 13 directions. | EOR (extent of resection) based on p and q maps | OS, PFS | ROIs representing EOR manually placed on T1 | Univariate and multivariate Cox regression analysis including age, MGMT methylation status, IDH-1 mutation, tumour volume and location | larger residual abnormal q volume predicted significantly shorter PFS; larger resection of abnormal q area improved OS. |
| Puig et al. [25] | 2016 | 15 | P | ND | Surgery; RT; Chemotherapy: TMZ | Preoperative | IVIM MRI | FS = 1.5, Seq. = EPI, slice = 24, TR = 3000 ms, TE = 76 ms, EPI factor was 41, FOV = 200 mm, section thickness = 5 mm, matrix = 96 × 77 mm, pixel size = 2.4 × 2.9 × 5 mm.13 b-values: 0, 10, 20, 30, 50, 100, 150, 200, 350, 500, 650, 800, and 1000 s/mm2, acquisition time was 3 min 48 s per patient. | D, D*, f | OS | ROIs in T1 CEL and NEL; manual segmentation | Kaplan–Meier curves; multivariate Cox regression analysis with clinical and DSC metrics | f and D* in CEL are associated with 6 months survival |
| Kondo et al. [69] | 2017 | 76 | R | ND | NS | Preoperative | DWI | NR | L-ADC_L, B-ADC_L, B&L-ADC_L (2-GMM histogram) | OS, PFS | ROIs in T1 CEL manual segmentation | Kaplan–Meier curves; univariate Cox regression analysis | B&L-ADCL was strongly associated with poor PFS and OS |
| Krishnan et al. [28] | 2017 | 45 | R | ND | Surgery | Postoperative (pretreatment) | DWI, RSI | FS = 3 T, Seq. = EPI, TE/TR = 96 ms/17 ms, FOV = 24 cm, matrix = 96 × 966 × 48, voxel size = 2.5 mm, 4 b-values (b 0, 500, 1500, and 4000 s/mm2, 6 and 15 unique diffusion directions for each nonzero b-value, respectively 8 min scan time. | ADC and RSI volume fraction, 10th and 90th percentile | OS, PFS | 3D ROIs on T1 CEL and FLAIR hyperintensity; semiautomatic segmentation | Univariate and multivariate Cox regression analysis combined with age, gender and resection type | No ADC metrics were associated with PFS and OS. RSI volume fraction was associated with PFS and OS, RSI 90th percentile associated with OS. |
| Ellingson et al. [70] | 2017 | 258 | R | R | Chemotherapy: 5 different regimens | Pretreatment | DWI | FS = 1.5 or 3 T, Seq. = monopolar EPI, TE/TR = 80–110 ms/4–10 s, NEX = 1, ST = 5 with 0–1 mm interslice gap, matrix size = 128 × 128, FOV = 220–256 mm. b = 0 and b = 1000 s/mm2. | ADC_L (2-GMM histogram) | OS | 3D ROIs on T1 subtraction maps; semiautomatic segmentation | Log-rank analysis and multivariate Cox regression analysis including age, enhancing tumour volume | Pretreatment ADC_L was an independent predictive biomarker for OS in anti-VEGF therapies, but not in lomustine. |
| Galla et al. [71] | 2017 | 65 | R | R | Chemotherapy: BV | Pretreatment, posttreatment | DWI | FS = 3 T, Seq. = EPI, FOV= 24 × 24 cm2, b= 0, 1000 s/mm2, ST = 5 mm. | changes in nADC mean and min | OS | ROIs on ADC maps corresponding to the T1 CEL and NEL; manual segmentation | Cox regression analysis adjusted for age, tumour size, prior treatments | The change in mean ADC was significantly associated with OS. The change in min ADC in the NEL was not associated with OS |
| Boonzaier et al. [72] | 2017 | 43 | R | ND | Surgery; RT; Chemotherapy | Preoperative | DTI | FS = 3 T, Seq. EPI, TR/TE = 8300/98; flip angle = 90°; FOV = 192 × 3 × 192 mm; 63 sections; no section gap; voxel size = 2.0 × 3.2 × 3.2 mm; b values 0–1000 s/mm2. | volumetric analysis: ADC low volume | OS, PFS | ROIs in CEL and NEL regions based on ADC-rCBV maps; manual segmentation | Log-rank analysis and multivariate Cox regression accounting for age, CE volume, IDH-1 mutation, MGMT methylation status, EOR | Volumetric analysis of ADC-rCBV ROIs in NEL helps in stratifying PFS and OS |
| Heiland et al. [73] | 2017 | 21 | P | ND | Surgery | Preoperative | DTI | NR | AD, RD, mean MD and FA | OS, PFS | ROIs on the whole CEL; manual segmentation | The Kaplan–Meier, univariate Cox-Regression tests | Patients with high MD in the contrast-enhancing region had a significantly better OS. Patients with low FA in the contrast-enhancing region had a significantly better OS. |
| Chakhoyan et al. [26] | 2018 | 23 | P | ND | Surgery; RT; Chemotherapy: TMZ | Postoperative: pretreatment, posttreatment | DWI, DKI, SE | FS = 3 T, Seq. EPI, TR/TE = 13,400/103 ms, a flip angle of 90°, 52 contiguous slices, ST = 3 mm, no inter-slice gap, an in-plane resolution of 2 mm × 2 mm, matrix = 128 × 128 mm, b values: 0, 50, 100, 250, 500, 750, 1000, 2500, 3500 and 5000 s/mm2. The total acquisition time for the DWI scan was 6 min. | ADC, K, D, DDC, alpha | OS | ROIs placed in NAWM and CEL; semiautomatic segmentation | Log-rank analysis on Kaplan–Meier curves and multivariate Cox regression analysis including age, MGMT status, tumour volume at baseline | ADC show significant value in predicting OS. DKI and SE metrics did not show significant value in OS prediction. |
| Li et al. [24] | 2018 | 115 | P | ND | Surgery; Adjuvant therapy postoperative | Preoperative | DTI | NR | Joint histogram features from Normalized DTI-p and q maps | OS, PFS | ROIs in CEL and NEL; manual segmentation | Kaplan–Meier, Cox regression accounting for IDH-1 mutation, MGMT methylation status, sex, age, EOR | joint histogram features were associated with OS and PFS and improved survival model performance. |
| Bae et al. [74] | 2018 | 217 | R | ND | Surgery; RT; Chemotherapy: TMZ | Preoperative | DTI | FS = 3 T, b values 600 and 0 s/mm2, 32 directions, FOV = 8413.4/77; 220 mm; section thickness = 2 mm; matrix 112 × 3 × 112. | Radiomic features | OS, PFS | ROIs in necrosis, CEL, NEL on T2/FLAIR; semiautomatic segmentation | Random Survival Forest prediction model from multiparametric MRI | Radiomic prediction model including clinical and multiparametric MRI metrics (of which DTI metrics) was able to predict OS and PFS |
| Rulseh et al. [75] | 2019 | 43 | R | ND | Surgery; RT; Chemotherapy: TMZ | Preoperative | DWI | NR | ADC histogram metrics | OS, PFS | Whole-brain masks generated using FSL | The Kaplan–Meier, univariate Cox-Regression analysis | Median ADC was the best variablefor PFS prediction, while p85 was the best variable for OS prediction. |
| Kim et al. [76] | 2019 | 93 | R | ND | Surgery/biopsy; RT; Chemotherapy: TMZ | Preoperative | DWI | FS = 1.5 T, Seq. = EPI, TR/TE 3000 ms/80 ms; FOV = 240 × 240 mm; matrix = 164 × 162; ST = 5 mm; gap = 1 mm, b value 0 and 1000 s/mm2. | ADC histogram metrics | OS | ROIs on T1CE and FLAIR; manual segmentation | Log-rank test on Kaplan–Meier curves, unsupervised K-means clustering | ADC histogram parameters demonstrated a significant association with OS. |
| Buemi et al. [77] | 2019 | 17 | R | R | Chemotherapy: 13 BV, 4 fotemustine and BV | Pretreatment, posttreatment | DWI | FS = 1.5 T, Seq = EPI, TE/TR = 90 ms/1000 ms, NEX 2, slice thickness 5 mm with 1 mm interslice distance, matrix size = 320 × 320 mm, and FOV = RL 240 mm, AP 282 mm, FH 131 mm, b = 0 and b = 1000 s/mm2. | ADC_L, ADC_H (2-GMM histogram) | OS, PFS | ROIs on T1 CEL and T2/FLAIR abnormalities; semiautomatic segmentation | Kaplan–Meier with log-rank test, multivariate Cox regression adjusted for clinical variables | In univariate analysis, ADC_L in CEL was significantly predictive of PFS and OS. In multivariate analysis, the ADC_L was predictive for PSF but not OS. |
| Petrova et al. [78] | 2019 | 54 | R | R | Chemotherapy: RT and TMZ Chemotherapy on recurrence: BV | Pretreatment | DWI | FS = 1.5 T or 3 T, b = 0 and b = 1000, matrix = 128 × 128, FOV = 22–24 cm with a ST of 5 mm. | ADC histogram metrics | OS, 6PFS | ROIs on T1 CE; manual segmentation | 6 machine learning classifiers | Diffusion and perfusion imaging using an SVM was able to predict 6PFS. Less power was shown to predict OS. |
| Flores-Alvarez et al. [79] | 2019 | 36 | R | ND | Surgery; RT; Chemotherapy | Preoperative | DTI | FS = 3 T, FOV of 22 × 22 mm2, b-value of 1000 s/mm2, 25 directions, TR = 10.000 ms, TE = 101.8 ms, ST of 3 mm and a Matrix array of 112 × 112. | FA | OS | ROIs in necrosis, CEL, oedema, normal controlateral, peritumoral oedema; manual segmentation | Log-rank test on Kaplan–Meier curves | Significant association between the peritumoral oedema measurement of FA with intervals of OS. |
| Li et al. [80] | 2019 | 80 | P | ND | Surgery/biopsy; RT (17.4%, 20/115); Chemotherapy: TMZ (73.0%, 84); Best supportive care (9.6%, 11/115); | Preoperative | DTI | NR | histogram analysis of normalized DTI-p and q maps | OS, PFS | ROIs in CEL and NEL; manual segmentation | Kaplan–Meier and Cox regression accounting for IDH-1, mutation, MGMT methylation status, sex, age, EOR, tumour volume | A higher mean value of anisotropic diffusion (q) in NE region was associated with worse OS and PFS. 5 p and q histogram metrics showed significantly incremental value in predicting 12-month OS and PFS. |
| Mohan et al. [81] | 2019 | 48 | R | ND | Surgery; RT; Chemotherapy: TMZ. Other therapies: BV (8 patients) | Preoperative | DTI | FS = 3 T, Seq. = Epi, parallel acquisition (GRAPPA), acceleration factor of 2.30 Directions, a b-value of 1000 s/mm2, a total acquisition time of 8 min, TR/TE 5000/86 ms, NEX = 3, FOV = 22 × 22 cm2, slice thickness = 3 mm, number of sections = 40. | mean FA, MD | OS | ROIs in CC if there were CE lesions on T1 or signal abnormality on T2 and FLAIR; manual segmentation | Kaplan–Meier with log-rank test, multivariate Cox regression adjusted for clinical variables | FA from the invaded CC was positively correlated with OS. |
| Yan et al. [82] | 2019 | 51 | R | ND | Surgery; RT; Chemotherapy: TMZ. | Preoperative, postoperative | DTI | FS = 3 T, Seq. = EPI, TR/TE = 8300/98 ms; flip angle 90°; FOV = 192 mm2; 63 slices; no slice gap; voxel size 2 mm3, b values (0, 350, 650, 1000, 1300 and 1600 s/mm2), scanned in 12 directions. | EOR (extent of resection) based on p and q maps | OS, PFS | ROIs representing EOR on pre-MR; manual segmentation | Kaplan–Meier with log-rank test | Larger abnormal q regions showed better PFS and OS |
| Park et al. [83] | 2020 | 248 | R | ND | Surgery; RT; 60 Gy Chemotherapy: TMZ | Preoperative | DWI | FS = 3 T, Seq. = EPI, TR/TE = 3000/56 ms; b = 0 and b = 1000 s/mm2, FOV= 25 cm; ST/gap = 5 mm/2 mm; matrix = 256 × 256; acquisition time, 39 s. | radiomic features | OS | ROIs on T1 CEL; semiautomatic segmentation | Log-rank test on Kaplan–Meier curves; radiomics predictive models | Multiparametric MR model (incorporating also ADC features) was able to predict OS |
| Song et al. [84] | 2020 | 19 | R | R | Before recurrence: RT + TMZ Chemotherapy on recurrence: immune checkpoint inhibitors (ICIs) | Pretreatment, posttreatment | DWI | FS = 3 T, Seq. = EPI, TR/TE = 4025/82 ms, b value 0 and 1000 s/mm2. | nADC, changes between pre and post treatment | PFS6 | ROIs on T1 CEL; semiautomatic segmentation | Univariate analysis | nADC was able to assess PFS6 |
| Patel et al. [40] | 2020 | 67 | R | R | 35 treated with BV; 35 repeated surgery Chemotherapy: 19% BV monotherapy; 81% BV + TMZ and small molecular inhibitors. | Pretreatment | DWI | FS = 1.5 or 3 T, Seq. = EPI, ST = 3 mm with no interslice gap, b-values of 0, 500 and 1000 s/mm2) or diffusion tensor imaging with 64 directions. | ADC_L (2-GMM histogram) | OS | ROIs on T1 CEL; manual segmentation | Log-rank analyses on Kaplan–Meier data and Cox proportional hazard models adjusted for age, tumour volume | ADCL was an independent predictor of OS in the BV cohort, but not the surgical cohort. |
© 2020 by the authors. Licensee MDPI, Basel, Switzerland. This article is an open access article distributed under the terms and conditions of the Creative Commons Attribution (CC BY) license (http://creativecommons.org/licenses/by/4.0/).
Share and Cite
Brancato, V.; Nuzzo, S.; Tramontano, L.; Condorelli, G.; Salvatore, M.; Cavaliere, C. Predicting Survival in Glioblastoma Patients Using Diffusion MR Imaging Metrics—A Systematic Review. Cancers 2020, 12, 2858. https://doi.org/10.3390/cancers12102858
Brancato V, Nuzzo S, Tramontano L, Condorelli G, Salvatore M, Cavaliere C. Predicting Survival in Glioblastoma Patients Using Diffusion MR Imaging Metrics—A Systematic Review. Cancers. 2020; 12(10):2858. https://doi.org/10.3390/cancers12102858
Chicago/Turabian StyleBrancato, Valentina, Silvia Nuzzo, Liberatore Tramontano, Gerolama Condorelli, Marco Salvatore, and Carlo Cavaliere. 2020. "Predicting Survival in Glioblastoma Patients Using Diffusion MR Imaging Metrics—A Systematic Review" Cancers 12, no. 10: 2858. https://doi.org/10.3390/cancers12102858
APA StyleBrancato, V., Nuzzo, S., Tramontano, L., Condorelli, G., Salvatore, M., & Cavaliere, C. (2020). Predicting Survival in Glioblastoma Patients Using Diffusion MR Imaging Metrics—A Systematic Review. Cancers, 12(10), 2858. https://doi.org/10.3390/cancers12102858