Article

Overexpression of PSAT1 Gene is a Favorable Prognostic Marker in Lower-Grade Gliomas and Predicts a Favorable Outcome in Patients with IDH1 Mutations and Chromosome 1p19q Codeletion

1
Department of Neurology, Po-Jen General Hospital, Taipei 105, Taiwan
2
Genomics Research Center, Academia Sinica, Taipei 11529, Taiwan
3
Graduate Institute of Clinical Medicine, College of Medicine, Taipei Medical University, Taipei 110, Taiwan
4
Department of Law, School of Law, Ming Chuan University, Taipei 111, Taiwan
5
Department of Obstetrics and Gynecology, Chang Gung Memorial Hospital Linkou Medical Center, College of Medicine, Chang Gung University, Taoyuan 33305, Taiwan
6
Cell Physiology and Molecular Image Research Center, Wan Fang Hospital, Taipei Medical University, Taipei 116, Taiwan
*
Author to whom correspondence should be addressed.
These authors contributed equally to this work.
Cancers 2020, 12(1), 13; https://doi.org/10.3390/cancers12010013
Submission received: 30 October 2019 / Revised: 9 December 2019 / Accepted: 11 December 2019 / Published: 18 December 2019

Abstract

:
Patients with lower-grade gliomas (LGGs) have highly diverse clinical outcomes. Although histological features and molecular markers have been used to predict prognosis, the identification of new biomarkers for the accurate prediction of patient outcomes is still needed. The serine synthesis pathway (SSP) is important in cancer metabolism. There are three key regulators, including phosphoglycerate dehydrogenase (PHGDH), phosphoserine phosphatase (PSPH), and phosphoserine aminotransferase 1 (PSAT1), in SSP. However, their clinical importance in LGGs is still unknown. In this study, we used the bioinformatics tool in the Gene Expression Profiling Interactive Analysis (GEPIA) website to examine the prognostic significance of PHGDH, PSPH, and PSAT1 genes in LGGs. PSAT1 gene expression was then identified as a potential biomarker candidate for LGGs. Datasets from The Cancer Genome Atlas (TCGA) and the Chinese Glioma Genome Atlas (CGGA) were further used to explore the prognostic role of PSAT1 gene. Our results demonstrated that PSAT1 overexpression is a favorable prognostic marker of LGGs and significantly correlated with patient age ≤40, and a lower WHO histological grade, as well as mutations in IDH1, TP53 and ATRX, but not with chromosome 1p19q codeletions. More importantly, LGG patients with isocitrate dehydrogenase 1 (IDH1) mutations, chromosome 1p19q codeletions, and PSAT1 overexpression may have the best overall survival (five-year survival rate: 100%). Finally, we observed a coordinated biological reaction between IDH1 mutations and PSAT1 overexpression, and suggested overexpression of PSAT1 might enhance the function of mutant IDH1 to promote a favorable outcome in LGG patients. In conclusion, our study confirmed the importance of identifying the overexpression of PSAT1 as a favorable prognostic marker of LGGs, which may compensate for the limitation of IDH1 mutations and chromosome 1p19q codeletion in the prognostication of LGGs.

1. Introduction

Glioma is a major aggressive type of malignant brain tumors [1]. Glioma shows histological features similar to those of glial cells such as astrocytes, oligodendrocytes and ependymal cells. The 2016 World Health Organization (WHO) classification of tumors of the central nervous system (CNS) classified diffuse gliomas by both histological and molecular features such as IDH1 (isocitrate dehydrogenase 1)-mutant and wild-type glioblastoma, IDH1-mutant and chromosome 1p/19q codeleted oligodendrogliomas, and other gliomas [2]. Glioblastoma multiforme (GBM), defined as grade IV glioma, is the most common glioma with the poorest prognosis in the adult population [3]. Lower-grade gliomas (LGGs) are less aggressive and slow-growing tumors, which are defined as grade II and III gliomas [4,5]. LGG patients have highly diverse clinical outcomes. Although IDH1 mutations and chromosome 1p/19q codeletions have been identified as favorable prognostic biomarkers of LGGs, a new biomarker is still needed that could further predict the outcomes of LGG patients with IDH1 mutations and chromosome 1p/19q codeletion.
Serine is a major one-carbon source in cancer cells, and contributes to amino acid metabolism, nucleotide synthesis and the generation of reducing agents such as NADPH [6,7]. Moreover, serine is a nonessential amino acid and is in high demand in the brain. However, the serine obtained from a normal diet is insufficient to recruit in the brain due to poor transportation across the blood–brain barrier (BBB) [8]. Patients with serine deficiency may have severe neurological syndromes, such as seizures, severe psychomotor retardation and congenital microcephaly. In cancer cells, the nutrient deprivation of glucose activates the serine synthesis pathway (SSP), which recruits nucleic acid synthesis and cell cycle progression, and increases the antioxidant capacity. Hence, serine is an important substrate of nucleotide and glutathione synthesis to facilitate cancer cell survival and proliferation [9].
There are three key regulators in the SSP: 3-phosphoglycerate dehydrogenase (PHGDH), phosphoserine aminotransferase 1 (PSAT1), and phosphoserine phosphatase (PSPH). PHGDH protein is significantly expressed in pancreatic tumor tissues compared to the adjacent normal tissues, and regulated cyclin B1 and cyclin D1, which are involved in cell proliferation and migration [10]. PHGDH overexpression has been found in breast cancer samples, especially in those with the estrogen receptor-negative (ER: negative) phenotype [11]. PSPH is responsible for removing phosphate to form serine. PSPH is a c-Myc-mediated enzyme and increases as hepatocellular carcinoma progression to a malignant clinical stage [12]. Moreover, overexpression of PSPH is also a poor prognostic marker in colorectal cancer [13].
PSAT1 is a pivotal enzyme that governs the production of two metabolites, serine and α-ketoglutarate (α-KG), which are involved in one carbon metabolism and the TCA cycle, respectively. PSAT1 was regarded as a poor prognostic marker in non-small cell lung cancer [14], esophageal squamous cell carcinoma [15], breast cancer [16] and colorectal cancer [17] and contributes to cancer cell proliferation and metastasis. In contrast, maintenance of PSAT1 protein at a high level has been identified as a marker for a favorable outcome in GBM with regorafenib treatment [18].
Although PHGDH, PSAT1 and PSPH have been identified as prognostic biomarkers of a variety of cancers, including GBMs, if they can serve as potential biomarkers of LGGs has not been extensively studied before. Due to the lack of studies exploring the role of PHGDH, PSAT1, and PSPH genes in the prognostication of LGGs, we utilized a bioinformatics tool (GEPIA) to compare their gene expression profiles in LGGs, other tumors and normal tissues. We finally chose PSAT1 as a biomarker candidate and carefully examined its prognostic significance in LGG patients using The Cancer Genome Atlas (TCGA) LGG dataset. The prognostic significance of PSAT1 in LGGs was further validated using Chinese Glioma Genome Atlas (CGGA) dataset and the REMBRANDT (Repository for Molecular Brain Neoplasia Data) cohort. Our results confirmed that overexpression of PSAT1 is a potential biomarker for a favorable outcome in LGG patients. More importantly, our results also demonstrated that LGG patients with IDH1 mutations, chromosome 1p/19q codeletion and overexpression of PSAT1 could have the best overall survival of all patients.

2. Results

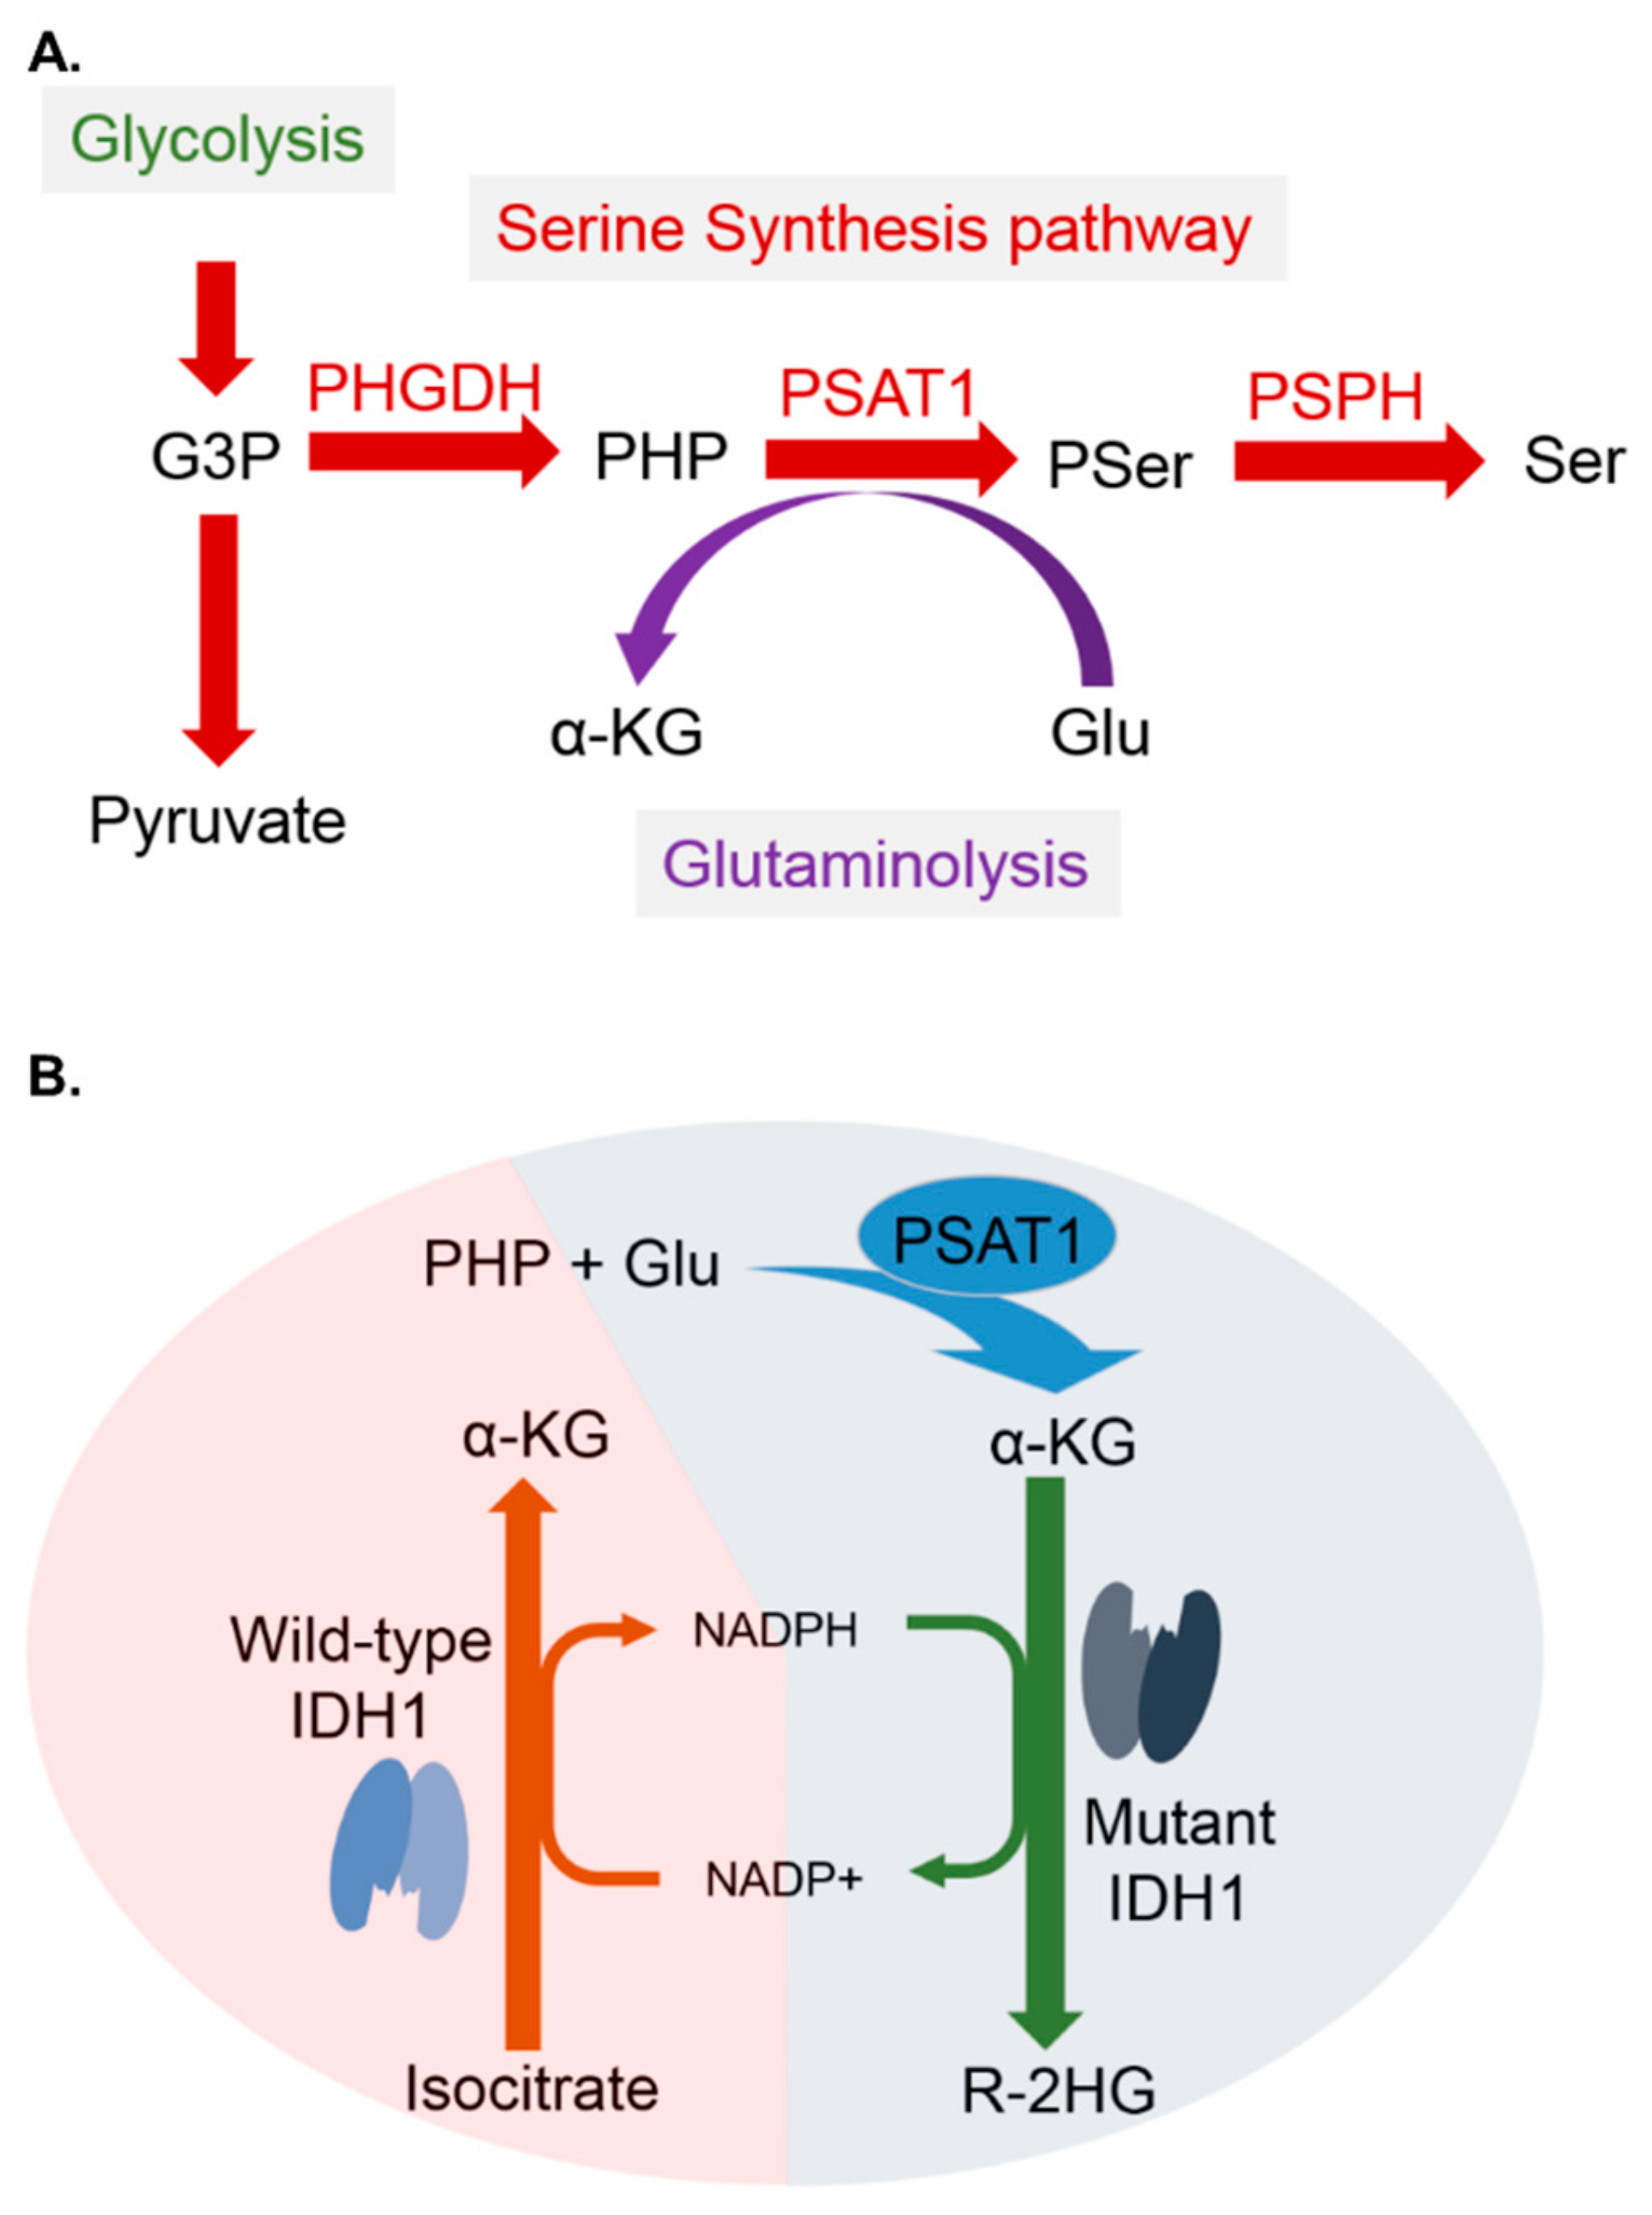
2.1. PHGDH, PSPH, and PSAT1 Are Important Regulators of the SSP and Have Certain Prognostic Significance in Various Cancers

PHGDH, PSPH and PSAT1 are important regulators of the SSP. From a literature review, overexpression of PHGDH, PSPH and PSAT1 proteins are known to lead to poor outcomes in various cancers (Table 1). The first serine-synthetic enzyme PHGDH was reported to promote pancreatic [10] and breast cancer [11]. Overexpression of PSPH was found in hepatocellular cancer [12] and colorectal cancer [13]. PSAT1 mediates carbon metabolism and the TCA cycle, which provides energy and increases biomass in non-small cell lung cancer (NSCLC) [14], breast cancer [16] and colorectal cancer [17]. However, the prognostic roles of these three genes in LGGs are still unknown.

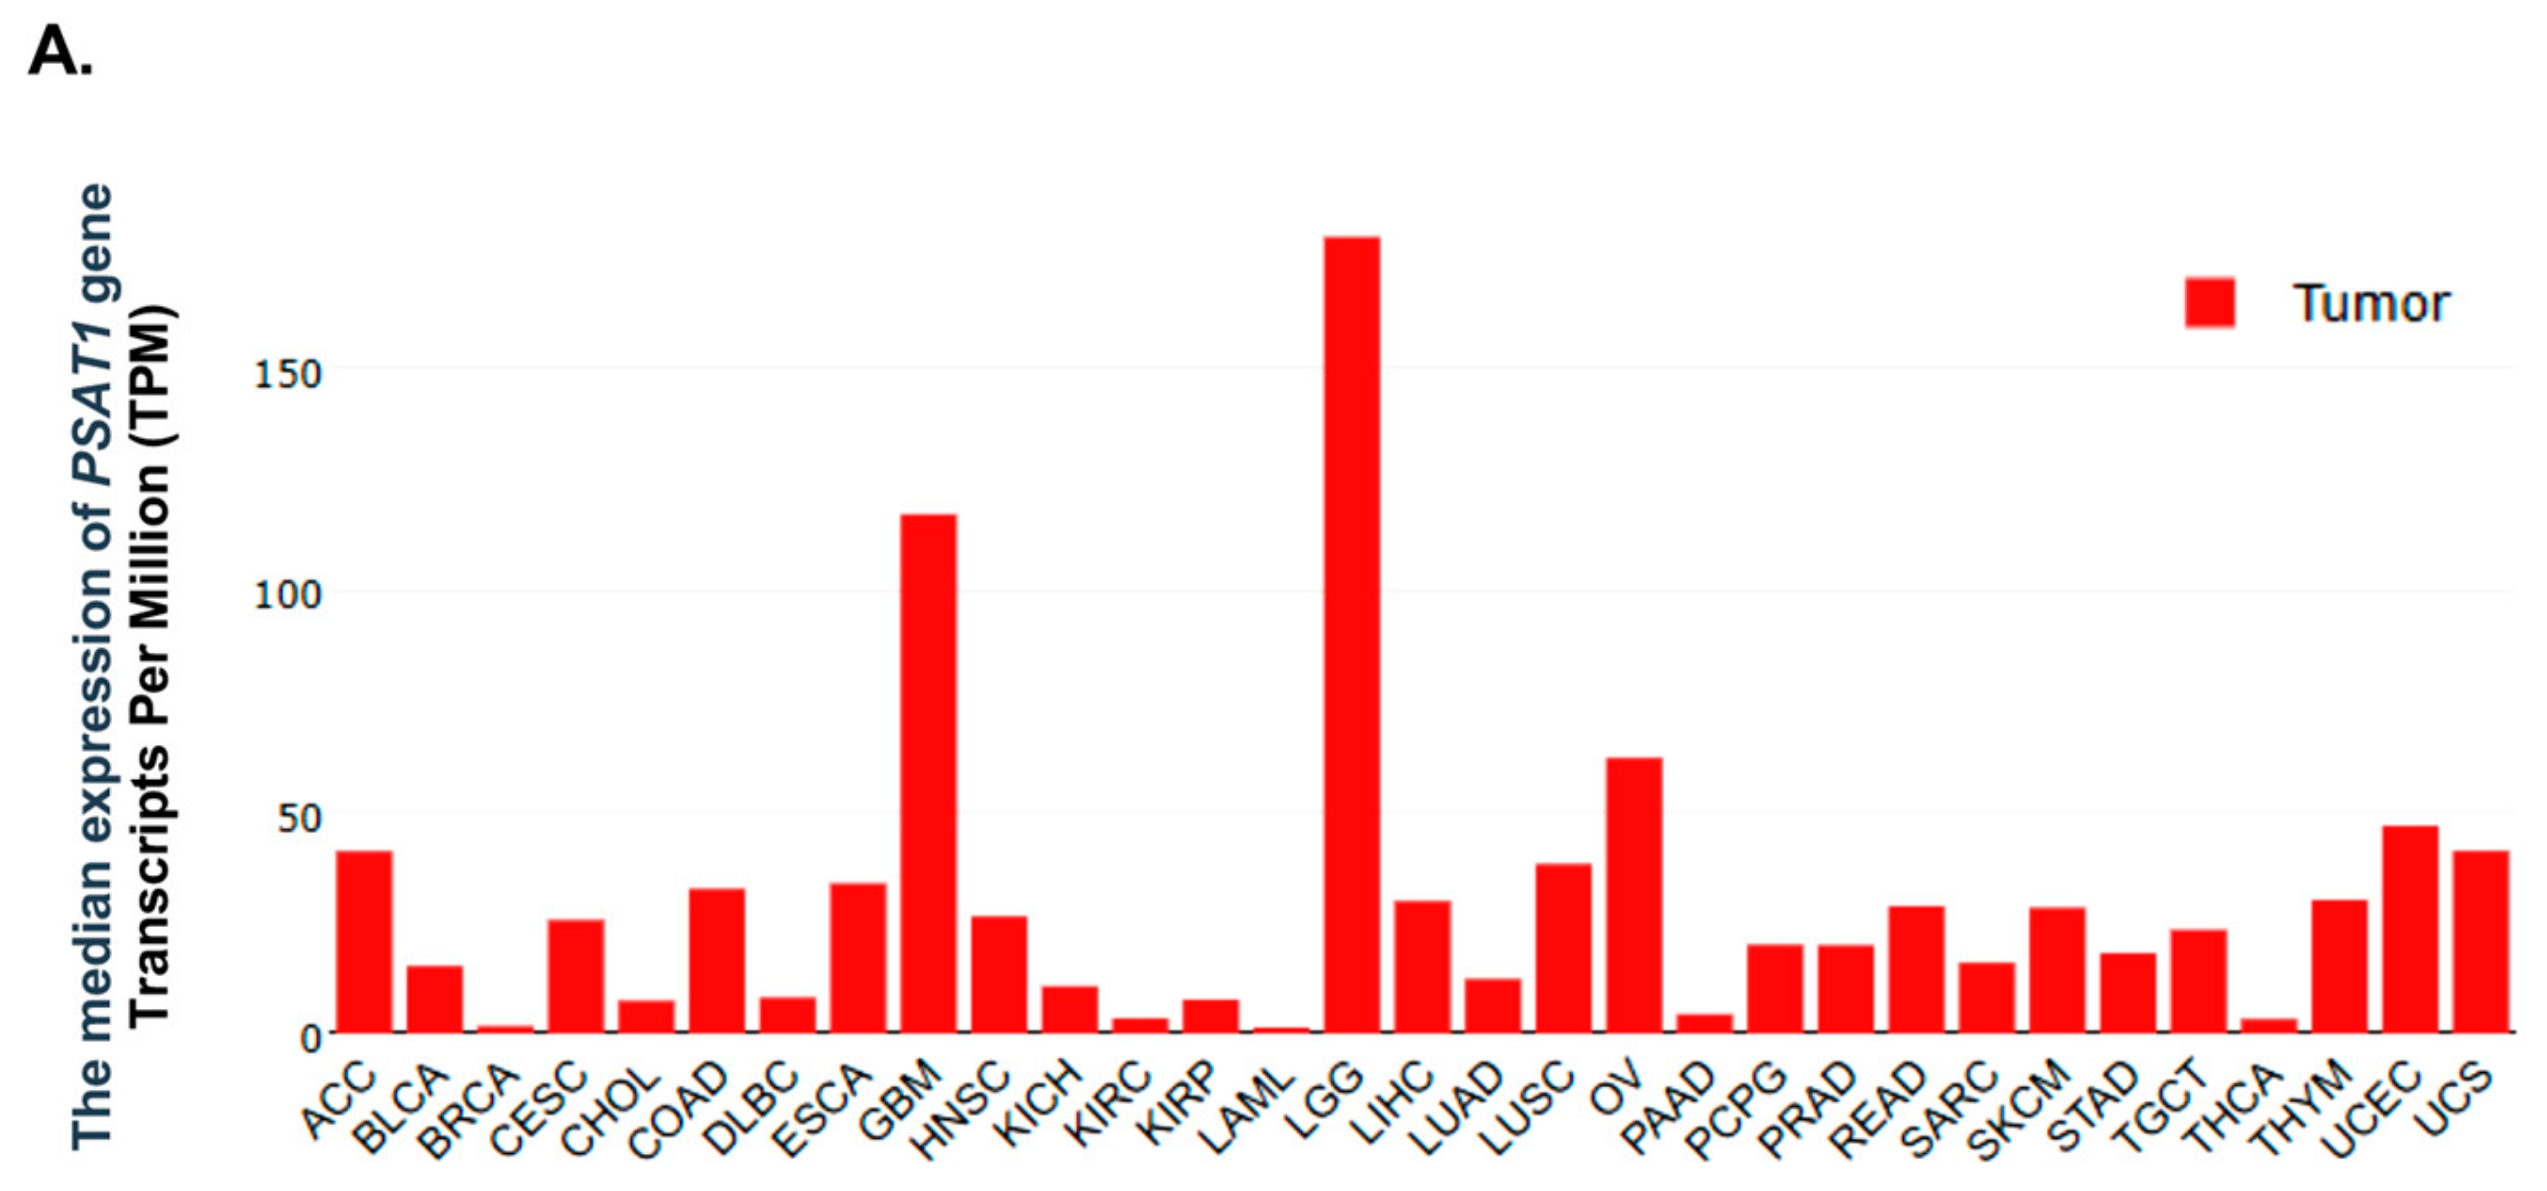
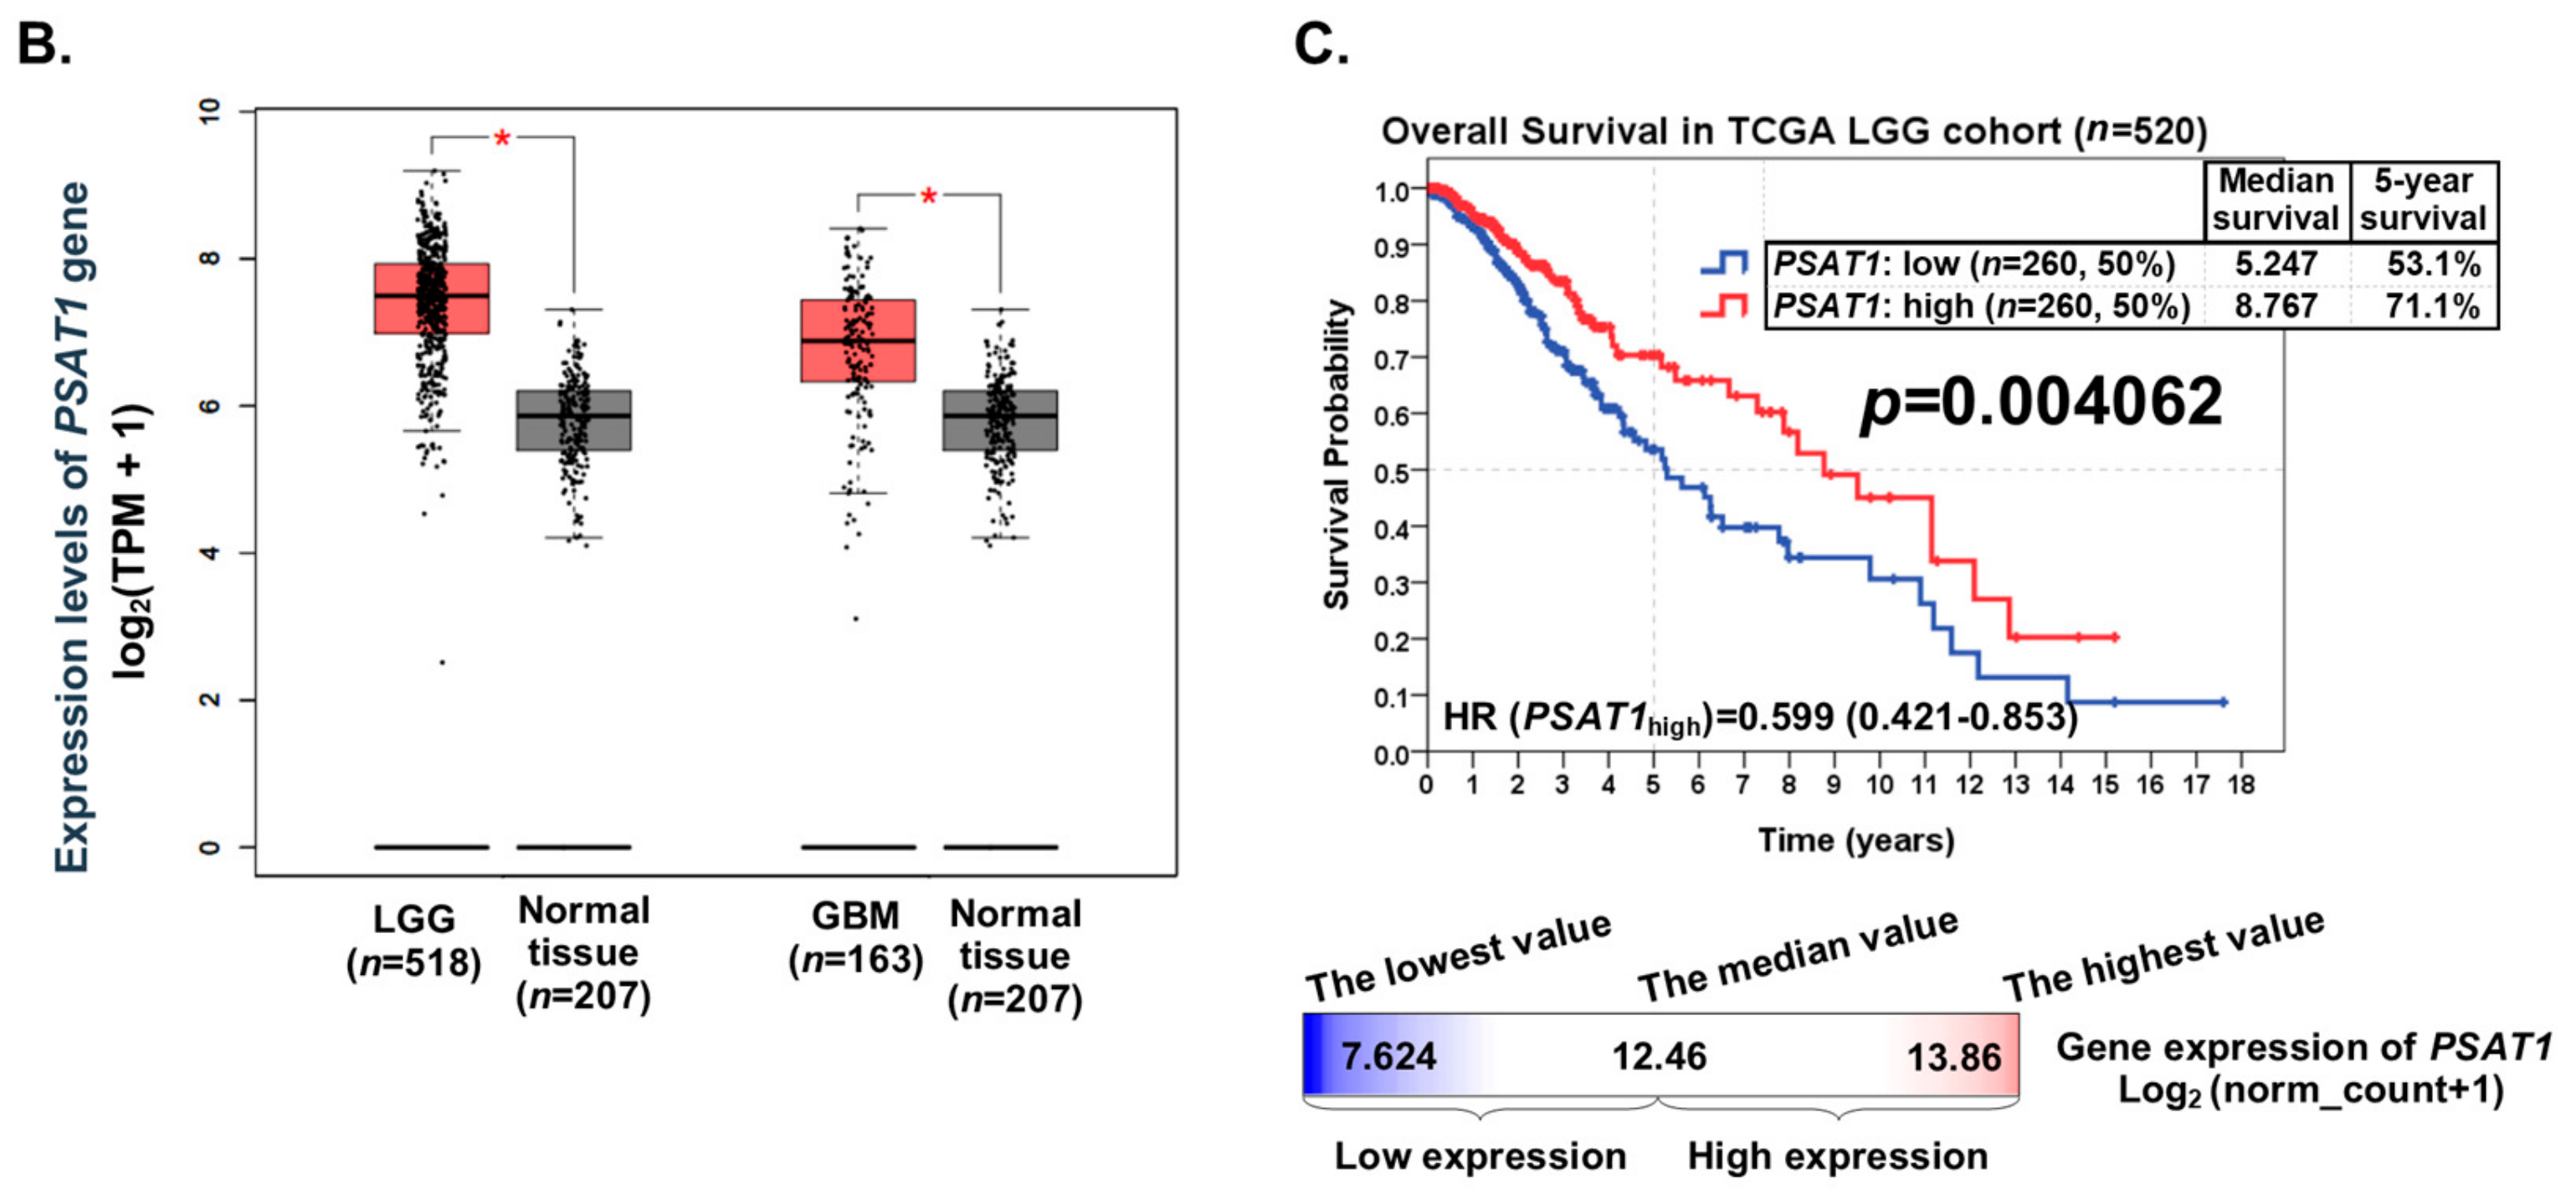
2.2. PSAT1 Is Highly Expressed and Significantly Prognostic in Lower-Grade Gliomas and Could Be a Potential Biomarker Candidate

To explore the expression status of the PHGDH, PSAT1, and PSPH genes in various cancers, a bioinformatics tool website was used in this study. The expression levels of PHGDH, PSAT1 and PSPH in tumors and normal tissues were explored using the bioinformatics website GEPIA (http://gepia.cancer-pku.cn). The results showed that PSAT1 was highly expressed in gliomas, including LGGs and GBMs. More interestingly, its expression in LGGs was the highest among various cancers (Figure 1A). The PHGDH gene was also highly expressed in LGGs (Figure S1A), but PSPH was highly expressed in GBMs, but not in LGGs (Figure S2A).
The expression levels of PSAT1 were significantly higher in tumors (LGGs and GBMs) than in normal tissues (Figure 1B). The expression levels of PHGDH were significantly higher in LGGs than in normal tissues, but not significantly higher in GBMs than in normal tissues (Figure S1B). The expression levels of PSPH were significantly higher in tumors (LGGs and GBMs) than in normal tissues, but the significance was more prominent in GBMs than in LGGs (Figure S2B). When comparing the prognostic significance of PHGDH, PSPH and PSAT1 genes in the TCGA LGG cohort, patients were classified into two groups according to the expression levels of above genes. Patients with a high expression of PSAT1 had significantly better overall survival (OS) (median survival: 8.767 years; five-year survival rate: 71.1%) than those with a low expression of PSAT1 (median survival: 5.247 years; five-year survival rate: 53.1%) (Figure 1C). However, the gene expression of PHGDH and PSPH had no prognostic significance in LGGs (Figures S1 and S2). Therefore, PSAT1 rather than PHGDH and PSPH was chosen as a biomarker candidate for further analyses.

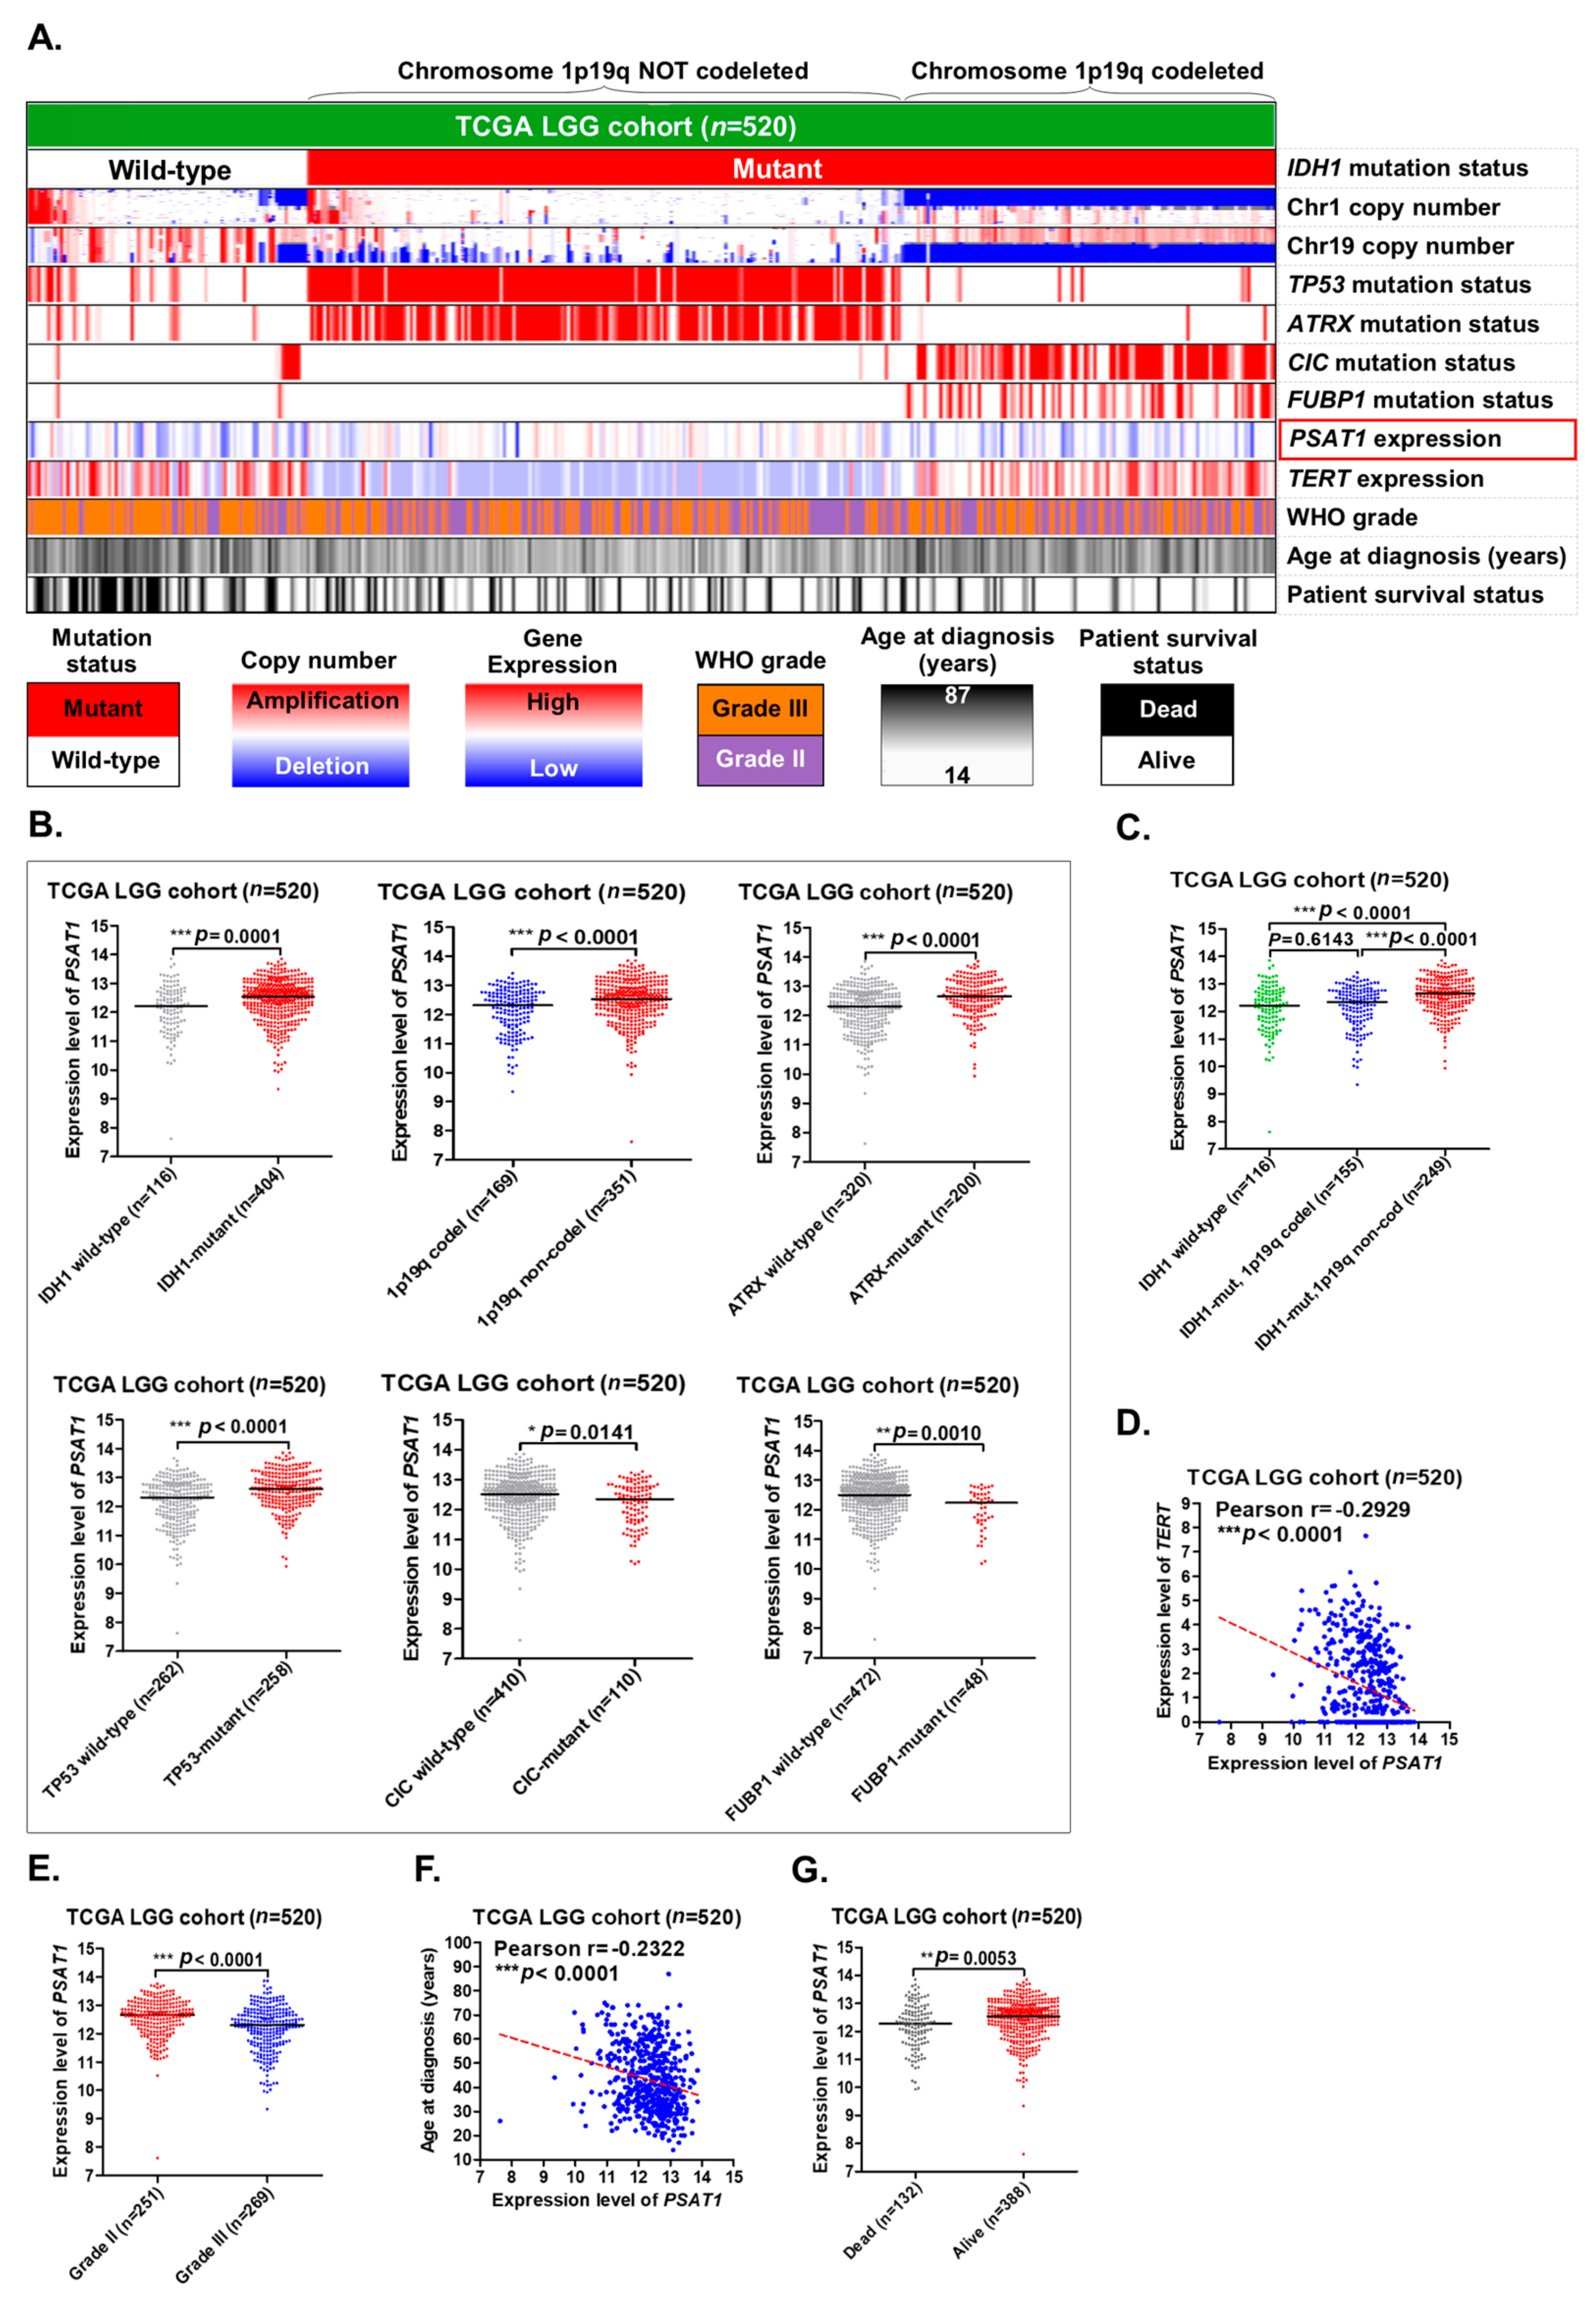
2.3. Overexpression of PSAT1 Correlates with Mutations in IDH1, ATRX and TP53 and a Lower Grade of LGGs, and Is Enriched in IDH1-Mutant LGGs without 1p19q Codeletion

The 2016 WHO classification of tumors of the CNS suggests the use of IDH1 mutation status and chromosome 1p19q codeletion status to predict the prognosis of LGG patients [12]. According to the guidelines of the 2016 WHO classification of CNS tumors, patients in the TCGA LGG cohort (n = 520) were classified into three groups for further analyses, including IDH1 wild-type, IDH1 mutations with 1p19q codeletion, and IDH1 mutations without 1p19q codeletion (Figure 2A). PSAT1 appeared to be highly expressed in the group that had mutations in IDH1 without 1p19q codeletion. Consistent with previously published literature [19,20,21], mutations in TP53 and ATRX, as well as low expression of the TERT gene, were also enriched in the IDH1 mutations without 1p19q codeletion group (Figure 2A).
The expression levels of PSAT1 were significantly higher in the group of LGGs with IDH1 mutations, with 1p19q noncodeletion, with ATRX mutations, with TP53 mutations, with wild-type CIC, and with wild-type FUBP1 (Figure 2B). When LGG patients were classified into three groups according to the IDH1 mutation status and chromosome 1p19q codeletion status, the expression levels of PSAT1 were significantly higher in the group of LGGs with IDH1 mutations without chromosome 1p19q codeletion (Figure 2C).
In addition, the expression level of PSAT1 was significantly and negatively correlated with that of TERT (Figure 2D). IDH1 mutations are known to be a favorable prognostic marker of LGGs and more enriched in grade II gliomas compared to grade III gliomas. Similarly, the expression levels of PSAT1 were also shown to be significantly higher in grade II gliomas than in grade III gliomas (Figure 2E). Moreover, the expression levels of PSAT1 were significantly and negatively correlated with patient age (Figure 2F) and significantly higher in LGG patients with an alive status than in those with a dead status (Figure 2G).
Our results confirmed that the overexpression of the PSAT1 gene correlates with mutations in IDH1, ATRX and TP53, a lower WHO grade of LGGs, as well as wild-type CIC and wild-type FUBP1, but not with chromosome 1p19q codeletion. In addition, overexpression of PSAT1, as well as mutations in ATRX and TP53, and low expression of TERT are enriched in IDH1-mutant LGGs without 1p19q codeletion.

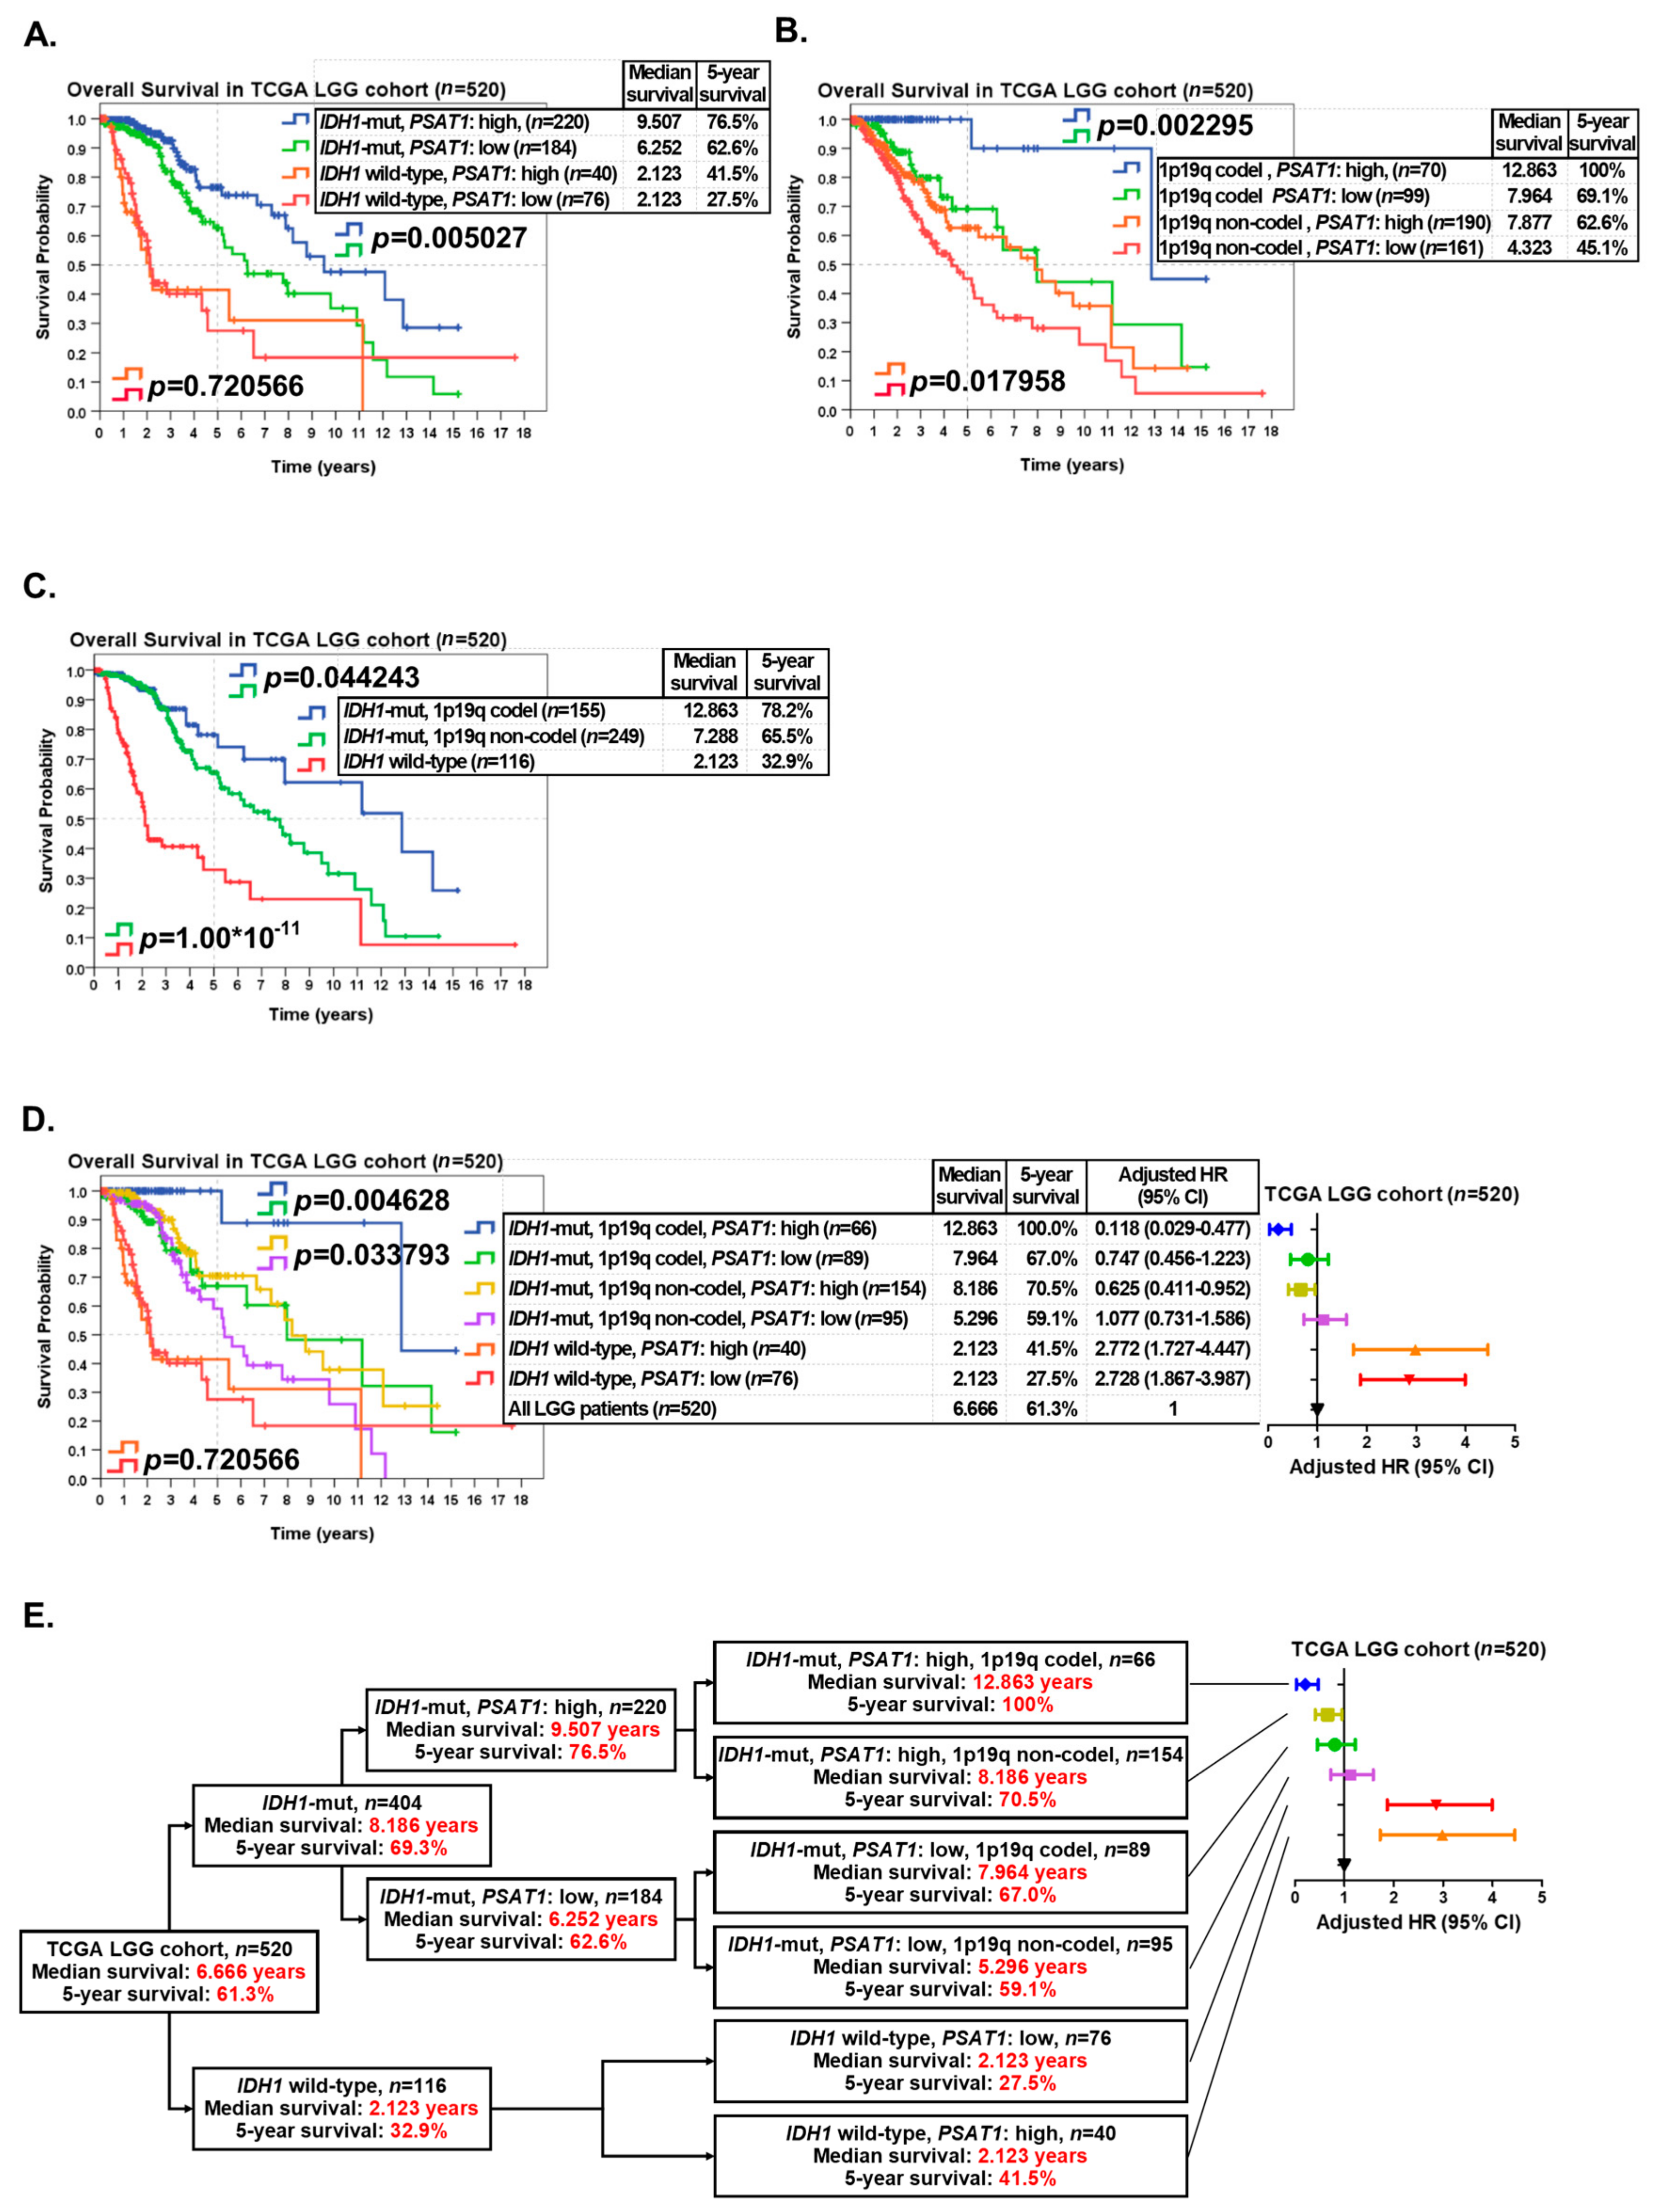
2.4. PSAT1 Expression Is Significantly Prognostic in IDH1-Mutant, 1p19q Codeleted or 1p19q Not-Codeleted LGGs and LGGs Patients with IDH1 Mutations, Chromosome 1p19q Codeletion and Overexpression of PSAT1 Have the Best Overall Survival

IDH1 mutation status and chromosome 1p19q codeletion status are the most important markers in LGGs. When LGG patients in the TCGA dataset (n = 520) were classified into two groups according to IDH1 mutation status, the group with IDH1 mutations (n = 404) had better OS (median survival: 8.186 years; five-year survival rate: 69.3%) than the group of IDH1 wild-type (n = 116) (median survival: 2.123 years; five-year survival rate: 32.9%) (Figure S3A). In addition, the prognostic value of 1p19q codeletion status in LGGs was also shown to be highly significant (Figure S3A). When LGG patients were classified into four groups according to IDH1 mutation status and PSAT1 expression status, high expression of PSAT1 was shown to be a significantly favorable prognostic marker in IDH1-mutant LGGs, but not in IDH1 wild-type LGGs (Figure 3A). When LGG patients were classified into four groups according to chromosome 1p19q codeletion status and PSAT1 expression status, high expression of PSAT1 was shown to be a significantly favorable prognostic marker both in 1p19q codeleted and 1p19q not-codeleted LGGs (Figure 3B). When LGG patients were classified into three groups (IDH1 wild-type, IDH1 mutations with 1p19q codeletion, and IDH1 mutations without 1p19q codeletion) according to the guideline of the 2016 WHO classification of CNS tumors, the group of IDH1 wild-type (n = 116) had the worst OS (median survival: 2.123 years; five-year survival rate: 32.9%), and the group with IDH1 mutations and chromosome 1p19q codeletion (n = 155) had the best OS (median survival: 12.863 years; five-year survival rate: 78.2%) (Figure 3C).
To provide a more accurate prognosis prediction of LGGs, the expression status of the PSAT1 gene was incorporated with IDH1 mutation status and chromosome 1p19q codeletion status to stratify LGG patients into six subgroups (Figure 3D). When PSAT1 expression was incorporated, LGG patients with IDH1 mutations and chromosome 1p19q codeletion (n = 155) were significantly stratified into two clinically distinct subgroups depending on PSAT1 expression (p = 0.004628). LGG patients with IDH1 mutations, chromosome 1p19q codeletion, and a high expression of PSAT1 (n = 66) had significantly better OS (median survival: 12.863 years; five-year survival rate: 100%) than those with a low expression of PSAT1 (n = 89) (median survival: 7.964 years; five-year survival rate: 67.0%). In addition, by incorporating PSAT1 expression, LGG patients with IDH1 mutations but not chromosome 1p19q codeletion (n = 249) were stratified into two distinct subgroups significantly (p = 0.033793). LGG patients with IDH1 mutations and a high expression of PSAT1, but not chromosome 1p19q codeletion (n = 154) had significantly better OS (median survival: 8.186 years; five-year survival rate: 70.5%) than those with a low expression of PSAT1 (n = 95) (median survival: 5.296 years; five-year survival rate: 59.1%) (Figure 3D). However, when LGG patients with wild-type IDH1 (n = 116) were stratified into two subgroups depending on PSAT1 expression, the difference in OS between the two subgroups was not statistically significant (five-year survival rate: 41.5% vs. 27.5%, p = 0.720566) (Figure 3D).
Since the group with IDH1 mutations and a high expression of PSAT1, but not chromosome 1p19q codeletion (n = 154), had better OS (median survival: 8.186 years; five-year survival rate: 70.5%) than the group with IDH1 mutations, chromosome 1p19q codeletion and a low expression of PSAT1 (n = 89) (median survival: 7.964 years; five-year survival rate: 67.0%) (Figure 3D), we then tried to set up a new algorithm by incorporating PSAT1 expression with IDH1 mutation status (Figure 3E). PSAT1 expression significantly (p = 0.005027) separated LGG patients with IDH1 mutations into more distinct subgroups (Figure 3A) compared to chromosome 1p19q codeletion status (p = 0.044243) (Figure 3C). Based on our results, we suggest a new algorithm for classifying LGG patients into more clinically relevant subgroups depending on IDH1 mutation status, the expression status of PSAT1 and chromosome 1p19q codeletion status (Figure 3E).
Our results suggested that gene expression of PSAT1 may be incorporated with IDH1 mutation status and chromosome 1p19q codeletion status to provide a more accurate prognosis prediction in LGGs. Although PSAT1 expression was relatively lower in LGGs with 1p19q codeletion, the stratification of combining IDH1 mutations, chromosome 1p19q codeletion and PSAT1 overexpression predicted the best OS in the TCGA LGG patients (median survival: 12.863 years; five-year survival rate: 100.0%; adjusted Hazard Ratio = 0.118) (Figure 3D,E).

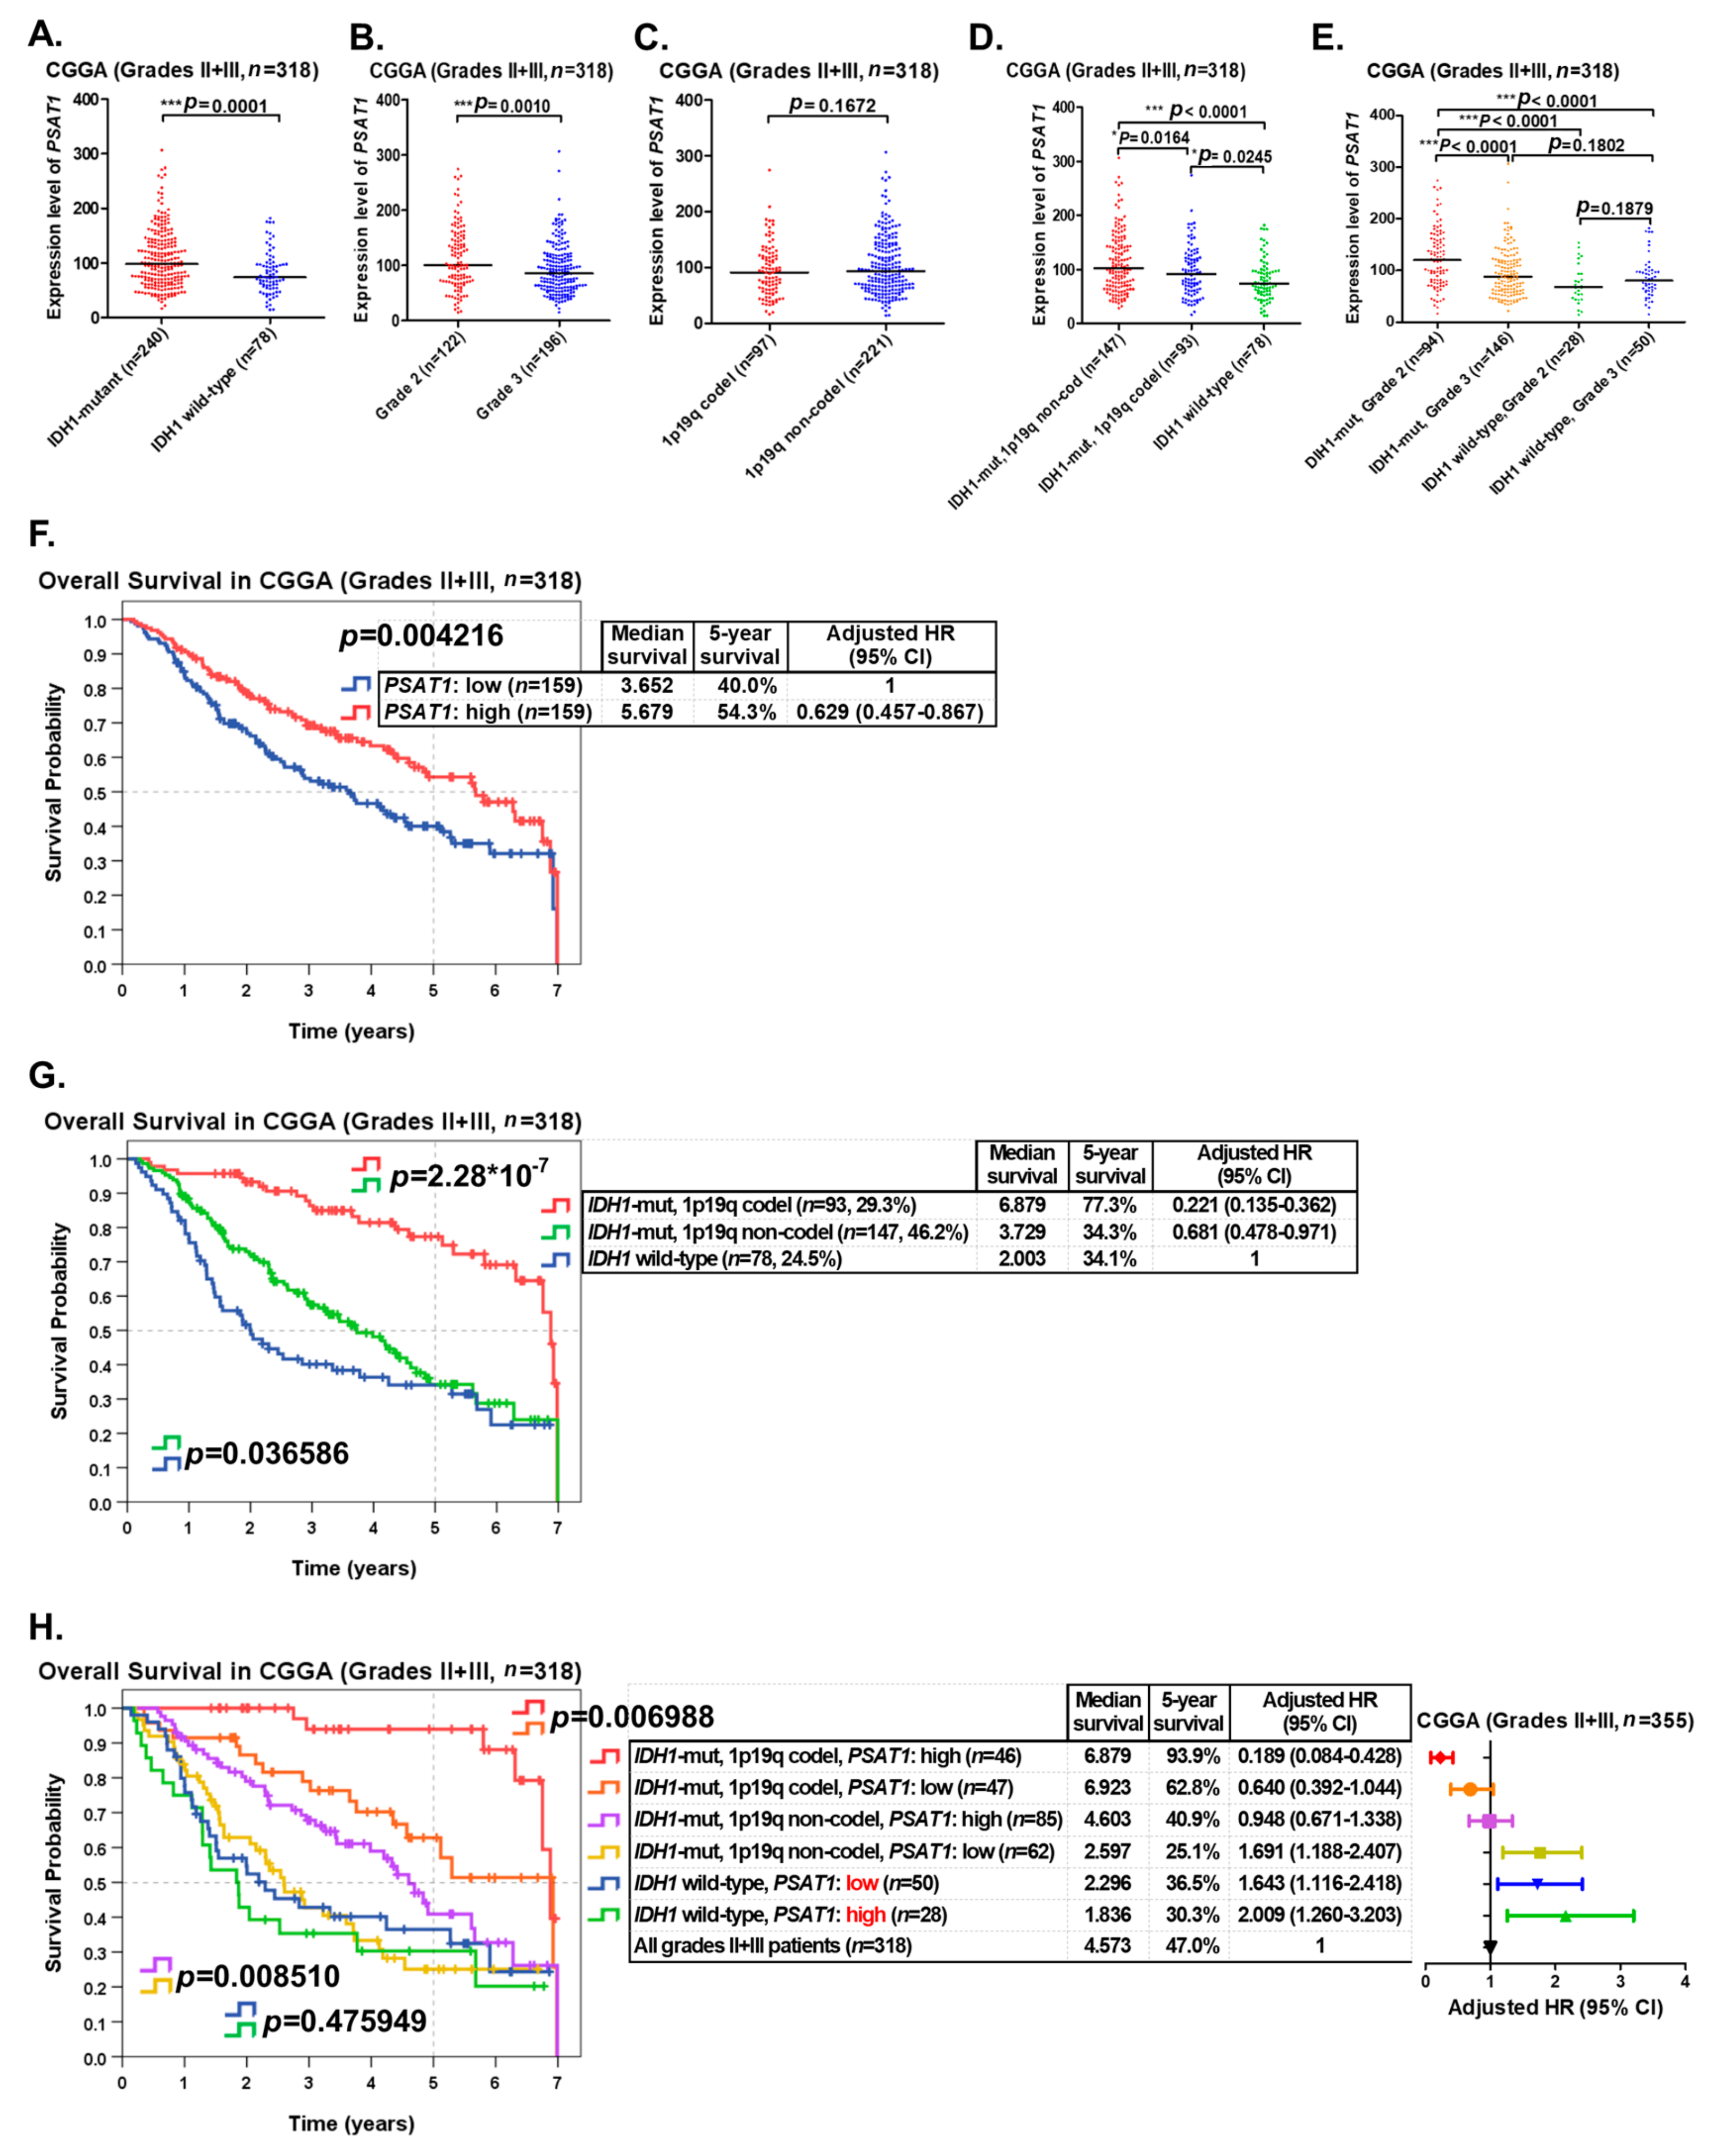
2.5. Validating the Prognostic Significance of PSAT1 in Grade II and III Gliomas Using the CGGA Dataset

To validate the prognostic significance of the PSAT1 gene, LGG (grade II and III gliomas) patients (n = 318) in the CGGA dataset were used as a validation cohort. In our results, the expression levels of PSAT1 were also significantly higher in grade II and III gliomas with IDH1 mutations than in those of IDH1 wild-type (Figure 4A), and significantly higher in grade II gliomas than in grade III gliomas (Figure 4B). However, the expression levels of PSAT1 were not significantly distinct between 1p19q codeleted and 1p19q not-codeleted LGGs (Figure 4C). When LGG patients were classified into three groups (IDH1 wild-type, IDH1 mutations with 1p19q codeletion and IDH1 mutations without 1p19q codeletion) according to the guideline of the 2016 WHO classification of CNS tumors, the expression levels of PSAT1 were highest in the LGG group with IDH1 mutations but not chromosome 1p19q codeletion. And the expression levels of PSAT1 were significantly distinct among the 3 LGG groups (Figure 4D). When LGG patients in the CGGA dataset were classified into 4 groups according to the WHO grade and IDH1 mutation status, the expression levels of PSAT1 were highest in the group of grade II gliomas with IDH1 mutations, which was supposed to be the group with the best prognosis in LGGs (Figure 4E).
The prognostic significance of IDH1 mutation status and 1p19q codeletion status in LGGs in the CGGA dataset were shown to be highly significant (Figure S3B). When LGG patients in the CGGA dataset were classified into two groups according to PSAT1 expression for survival analysis, patients with a high expression of PSAT1 were shown to have significantly (p = 0.004216) better OS (median survival: 5.679 years; five-year survival rate: 54.3%; adjusted HR = 0.629) than those with a low expression of PSAT1 (median survival: 3.652 years; five-year survival rate: 40.0%) (Figure 4F). When LGG patients were classified into three groups according to the guideline of the 2016 WHO classification of CNS tumors, patients with IDH1 mutations and 1p19q codeletion had the best OS (median survival: 6.879 years; five-year survival rate: 77.3%; adjusted HR = 0.221), but those with wild-type IDH1 had the worst OS (median survival: 2.003 years; five-year survival rate: 34.1%) (Figure 4G).
When LGG patients in the CGGA dataset were classified into 6 groups according to IDH1 mutation status, 1p19q codeletion status and the expression status of PSAT1, the group with IDH1 mutations, 1p19q codeletion and a high expression of PSAT1 had the best OS (median survival: 6.879 years; five-year survival rate: 93.9%; adjusted HR = 0.189), but the group with wild-type IDH1 and a high expression of PSAT1 had the worst OS (median survival: 1.836 years; five-year survival rate: 30.3%; adjusted HR = 2.009) (Figure 4H). Overexpression of PSAT1 was shown to be a significantly favorable prognostic marker in IDH1-mutant LGGs with 1p19q codeletion (p = 0.006988) as well as in IDH1-mutant LGGs without 1p19q codeletion (p = 0.008510) in the CGGA cohort (Figure 4H).
Our results confirmed that overexpression of the PSAT1 gene correlates with IDH1 mutations, a lower tumor grade, and a better outcome in LGGs in the CGGA dataset. Furthermore, LGG patients with IDH1 mutations, 1p19q codeletion and overexpression of PSAT1 had the best prognosis of all patients. Another LGG cohort (the REMBRANT cohort, n = 329) was used for further validation and the result revealed that overexpression of PSAT1 is a significantly favorable prognostic marker of LGGs (Figure S4).

3. Discussion

Our study is the first to identify overexpression of the PSAT1 gene as a favorable prognostic marker of LGGs. In our results, we demonstrated that overexpression of PSAT1 predicted a favorable outcome of LGG patients in the TCGA dataset (Figure 1C). In addition, overexpression of the PSAT1 gene is significantly correlated with alive patient status, patient age ≤ 40, a lower WHO histological grade, IDH1 mutations, TP53 mutations, ATRX mutations, wild-type FUBP1, low expression of TERT and chromosome 1p19q noncodeletion, but not with wild-type CIC (Table 2). The correlations of PSAT1 overexpression with IDH1 mutations, a lower WHO grade and a favorable outcome of LGG patients were also validated in the CGGA dataset (Figure 4A,B,F) and the REMBRANT cohort (Figure S4). The correlations between the promoter methylation status of PSAT1 and other parameters in LGGs were also assessed Figure S5A). There was a significant correlation between the promoter methylation status and gene expression of PSAT1 (Figure S5B). There were also significant correlations between the promoter methylation status of PSAT1 and other parameters (Figure S5C–I). And the high promoter methylation status of the PSAT1 gene was shown to be a significantly favorable prognostic marker in the TCGA LGG cohort (Figure S5J).
Although the 2016 WHO classification of CNS tumors suggested using IDH1 mutation status and chromosome 1p19q codeletion status to stratify LGG patients into clinically distinct subgroups, this classification still remains limited in prognosis predictions. For example, even though IDH1 mutations and chromosome 1p19q codeletions are both favorable prognostic markers, some LGG patients with those favorable prognostic markers still died rapidly. Due to the limitations of current biomarkers and classification tools, we identified PSAT1 overexpression as a favorable prognostic marker, which may be incorporated with IDH1 mutation status and chromosome 1p19q codeletion status to stratify LGG patients into more clinically relevant subgroups and provide a more accurate prognosis prediction in LGG patients. In this study, we demonstrated that in LGG patients with IDH1 mutations and chromosome 1p19q codeletions, those with PSAT1 overexpression may have significantly (p = 0.004628) better OS (median survival: 12.863 years; five-year survival rate: 100%) than those with low PSAT1 expression (median survival: 7.964 years; five-year survival rate: 67.0%) (Figure 3D). Our study confirmed the importance of identifying the overexpression of PSAT1 as a favorable prognostic marker in LGGs, which may compensate for the limitation of IDH1 mutations and chromosome 1p19q codeletions in the prognostication of LGGs.
An underlying mechanism that explains how overexpression of the PSAT1 gene contributes to a favorable outcome in LGG patients remains unclear. A number of studies have suggested overexpression of PSAT1 protein as a poor prognostic marker in colorectal cancer [17], esophageal squamous cell carcinoma [15], NSCLC [14] and ER(−) breast cancer [16]. However, a recent study suggested that a high level of PSAT1 protein could be a favorable prognostic marker for regorafenib-induced GBM suppression [18]. From literature review and our analyses, we conclude that the prognostic role of PSAT1 overexpression in gliomas, including LGGs and GBM, might be different from that in other cancer types.
IDH1 is a metabolic gene that encodes an enzyme named isocitrate dehydrogenase 1. This enzyme normally converts isocitrate to α-KG [22]. When IDH1 is mutated, there will be loss of its normal enzymatic function, the production of α-KG. In addition, there will be gain of a new function, the production of R-2-hydroxyglutarate (R-2-HG) (Figure 5B). The mutation in the IDH1 gene was first described in cancers by Sjöblom et al. [23] and further identified to have clinical impact on GBM by Parsons et al. [24]. To date, IDH1 mutations have been identified in a number of cancer types, especially in gliomas and acute myelogenous leukemia (AML). IDH1 mutation is the most well-known prognostic biomarker of LGGs. LGG patients with IDH1 mutations will have a better prognosis and therapeutic response than those with wild-type IDH1. Mutations in the IDH1 gene are commonly present in more than 70% of LGGs and secondary glioblastomas [25], which is consistent with our data (404/520 = 77.7%) (Figure 2B and Figure 3A). However, the definite mechanism by which IDH1 mutations promote a favorable outcome in patients with LGGs is still not well elucidated.
In our results, we observed a strong and significant correlation between IDH1 mutations and high expression of the PSAT1 gene (Figure 2B and Figure 4A) (Table 2). More importantly, overexpression of PSAT1 was shown to be a favorable prognostic marker specifically in IDH1-mutant LGGs, but not in IDH1 wild-type LGGs (Figure 3A and Figure 4H). Based on our findings, we hypothesized that there might be a strong connection between IDH1 mutations and PSAT1 overexpression to promote a favorable outcome of LGG patients. From literature review, we noticed that in the serine synthesis pathway, PSAT1 converts glutamate to α-KG (Figure 5A). In the TCA cycle, wild-type IDH1 converts isocitrate to α-KG, which is the same with the product of PSAT1 in the serine synthesis pathway. Conversely, mutant IDH1 converts α-KG to R-2-hydroxyglutarate (R-2HG) (Figure 5B). This finding is compatible with our hypothesis that overexpression of the PSAT1 gene increases the production of α-KG which could be the substrate for mutant IDH1 to convert NADPH to NADP+ and gain R-2HG (Figure 5B). The reduction of NADPH results in the less regeneration of reduced glutathione, which plays an important role in antioxidation in mammalian cells and probably promotes resistance to chemotherapy or radiation induced apoptosis in LGGs [26,27]. In this study, we observed a strong and significant correlation between IDH1 mutations and high expression of PSAT1. In addition, overexpression of PSAT1 was shown to be favorably prognostic only in IDH1-mutant LGGs, but not in IDH1 wild-type LGGs. From the literature review, we noticed there might be a coordinated biological reaction between IDH1 mutations and a high expression of PSAT1. Our results suggested that overexpression of the PSAT1 gene contributes to a favorable outcome in patients with LGGs, which is probably related to therapeutic resistance induced by IDH1 mutations, and overexpression of PSAT1 promote α-KG synthesis, which could enhance the function of mutant IDH1.
In summary, our findings concluded that overexpression of the PSAT1 gene could be a potential biomarker for a favorable outcome in patients with LGGs. And overexpression of PSAT1 could be incorporated with IDH1 mutations and chromosome 1p19q codeletion to classify LGG patients and predict those with the best overall survival. Our results also suggested the coordinated biological reaction between IDH1 mutations and overexpression of PSAT1, which may contribute to a favorable outcome in patients with LGGs.

4. Materials and Methods

4.1. Clinical Data and Gene Expression Profiles of LGG Patients from the TCGA Website

The TCGA website (http://xena.ucsc.edu/welcome-to-ucsc-xena/) provides a LGG (grade II and III gliomas) data for free download. The clinicopathological data, including age at diagnosis, WHO grade, overall survival time, and survival status, of patients deposited in the TCGA LGG dataset (n = 520) was collected from the aforementioned website.
The gene expression profiles, such as gene expression levels, mutation status of specific genes (e.g., IDH1, TP53, ATRX, CIC, and FUBP1) and copy number variation in specific chromosomes, of the TCGA LGG cohort were also downloaded from the above TCGA website (Table S1).

4.2. Clinical Data and Gene Expression Profiles of LGG Patients from the CGGA Website

The CGGA (Chinese Glioma Genome Atlas) dataset was used as a validation cohort. The clinical information and gene expression profiles of LGG patients in the CGGA dataset (n = 318), including IDH1 mutation status, chromosome 1p19q codeletion status, the WHO histological grade, expression levels of PSAT1, overall survival time, and survival status were collected from the CGGA website (http://www.cgga.org.cn/) (Table S2).

4.3. Classifying LGG Patients Into Distinct Subgroups for Further Analyses

LGG patients (n = 520) were divided into two distinct subgroups for further analyses according to age, WHO histological grade, survival status of patients, expression status of PSAT1 and TERT, and the mutation status of IDH1, TP53, ATRX, CIC, and FUBP1. For the age factor, 40 years was determined as the cut-off age in this study because the age of 40 years separated LGG patients into two groups with similar numbers (Table 2). For gene expression of PSAT1, patients were ranked according to their expression levels of PSAT1 and the median value of PSAT1 expression levels was determined as the cut-off value to separate patients into two equal subgroups (n = 260).

4.4. Statistical Analyses

SPSS version 20.0 software (SPSS, Chicago, IL, USA) was employed to perform all statistical analyses. Pearson’s Chi-square test was used to analyze associations between the expression status of PSAT1 and clinicopathological features. The median overall survival time, five-year survival rate, hazard ratio (HR) and survival curves were obtained and analyzed by using the Kaplan–Meier analysis, and differences in survival were determined by the log-rank test. The scatter plots and box plots were drawn using Prism 5 software (GraphPad Software Inc., San Diego, CA, USA) and Student’s t-Test was used to analyze differences in the gene expression levels of PSAT1 between different subgroups of patients with LGGs. For all analyses, a p-Value of <0.05 was considered to be statistically significant. The symbols *, ** and *** denote p < 0.05, p < 0.01 and p < 0.001, respectively.

5. Conclusions

Our findings suggest that overexpression of the PSAT1 gene severs as a favorable prognostic marker of LGGs, which could assist the limitation of IDH1 mutations and chromosome 1p19q codeletion in the prognostication of LGGs clinically.

Supplementary Materials

The following are available online at https://www.mdpi.com/2072-6694/12/1/13/s1. Figure S1: The expression status of the PHGDH gene in various tumor samples and normal tissues, and its prognostic role in LGGs, Figure S2: The expression status of the PSPH gene in various tumor samples and normal tissues, and its prognostic role in LGGs, Figure S3: The prognostic significance of IDH1 mutations and 1p19q codeletions in LGGs in the TCGA and CGGA datasets, Figure S4: Validating the prognostic significance of PSAT1 overexpression in the Repository for Molecular Brain Neoplasia Data (REMBRANDT) cohort, Figure S5: The correlations of PSAT1 promoter methylation status with PSAT1 expression and other parameters, and the prognostic significance of PSAT1 promoter methylation status in the TCGA LGG cohort, Table S1: The clinicopathological results for TCGA cohort, Table S2: The clinicopathological results for CCGA cohort.

Author Contributions

S.-P.H. and Y.-F.L. designed and convinced the study; S.-P.H., Y.-C.C. and S.-Y.H. drafted the manuscript; Y.-F.L. edited the manuscript; S.-P.H., Y.-C.C. and Y.-F.L. commented on the manuscript. All authors have read and agreed to the published version of the manuscript.

Funding

This study was supported by the Ministry of Science and Technology, Taiwan (MOST-108-2320-B-038 -017-MY3 to Y.-F.L.).

Conflicts of Interest

The authors declare no conflict of interest.

References

  1. Ostrom, Q.T.; Gittleman, H.; Liao, P.; Vecchione-Koval, T.; Wolinsky, Y.; Kruchko, C.; Barnholtz-Sloan, J.S. CBTRUS Statistical Report: Primary brain and other central nervous system tumors diagnosed in the United States in 2010–2014. Neuro Oncol. 2017, 19, v1–v88. [Google Scholar] [CrossRef] [PubMed] [Green Version]
  2. Louis, D.N.; Perry, A.; Reifenberger, G.; Von Deimling, A.; Figarella-Branger, D.; Cavenee, W.K.; Ohgaki, H.; Wiestler, O.D.; Kleihues, P.; Ellison, D.W. The 2016 World Health Organization Classification of Tumors of the Central Nervous System: A summary. Acta Neuropathol. 2016, 131, 803–820. [Google Scholar] [CrossRef] [PubMed] [Green Version]
  3. Nizamutdinov, D.; Stock, E.M.; Dandashi, J.A.; Vasquez, E.A.; Mao, Y.; Dayawansa, S.; Zhang, J.; Wu, E.; Fonkem, E.; Huang, J.H. Prognostication of Survival Outcomes in Patients Diagnosed with Glioblastoma. World Neurosurg. 2018, 109, e67–e74. [Google Scholar] [CrossRef] [PubMed]
  4. Zhang, X.; Lu, X.; Liu, Z.; Guan, R.; Wang, J.; Kong, X.; Chen, L.; Bo, C.; Tian, K.; Xu, S.; et al. Integrating multiple-level molecular data to infer the distinctions between glioblastoma and lower-grade glioma. Int. J. Cancer 2019, 145, 952–961. [Google Scholar] [CrossRef]
  5. Chammas, M.; Saadeh, F.; Maaliki, M.; Assi, H. Therapeutic Interventions in Adult Low-Grade Gliomas. J. Clin. Neurol. 2019, 15, 1–8. [Google Scholar] [CrossRef]
  6. Yang, M.; Vousden, K.H. Serine and one-carbon metabolism in cancer. Nat. Rev. Cancer 2016, 16, 650–662. [Google Scholar] [CrossRef]
  7. Sowers, M.L.; Herring, J.; Zhang, W.; Tang, H.; Ou, Y.; Gu, W.; Zhang, K. Analysis of glucose-derived amino acids involved in one-carbon and cancer metabolism by stable-isotope tracing gas chromatography mass spectrometry. Anal Biochem. 2019, 566, 1–9. [Google Scholar] [CrossRef]
  8. De Koning, T.J.; Klomp, L.W. Serine-deficiency syndromes. Curr. Opin. Neurol. 2004, 17, 197–204. [Google Scholar] [CrossRef]
  9. Labuschagne, C.F.; Van Den Broek, N.J.; Mackay, G.M.; Vousden, K.H.; Maddocks, O.D. Serine, but not glycine, supports one-carbon metabolism and proliferation of cancer cells. Cell Rep. 2014, 7, 1248–1258. [Google Scholar] [CrossRef] [Green Version]
  10. Song, Z.; Feng, C.; Lu, Y.; Lin, Y.; Dong, C. PHGDH is an independent prognosis marker and contributes cell proliferation, migration and invasion in human pancreatic cancer. Gene 2018, 642, 43–50. [Google Scholar] [CrossRef]
  11. Possemato, R.; Marks, K.M.; Shaul, Y.D.; Pacold, M.E.; Kim, D.; Birsoy, K.; Sethumadhavan, S.; Woo, H.K.; Jang, H.G.; Jha, A.K.; et al. Functional genomics reveal that the serine synthesis pathway is essential in breast cancer. Nature 2011, 476, 346–350. [Google Scholar] [CrossRef] [PubMed] [Green Version]
  12. Sun, L.; Song, L.; Wan, Q.; Wu, G.; Li, X.; Wang, Y.; Wang, J.; Liu, Z.; Zhong, X.; He, X.; et al. cMyc-mediated activation of serine biosynthesis pathway is critical for cancer progression under nutrient deprivation conditions. Cell Res. 2015, 25, 429–444. [Google Scholar] [CrossRef] [PubMed] [Green Version]
  13. Li, X.; Xun, Z.; Yang, Y. Inhibition of phosphoserine phosphatase enhances the anticancer efficacy of 5-fluorouracil in colorectal cancer. Biochem. Biophys. Res. Commun. 2016, 477, 633–639. [Google Scholar] [CrossRef] [PubMed]
  14. Yang, Y.; Wu, J.; Cai, J.; He, Z.; Yuan, J.; Zhu, X.; Li, Y.; Li, M.; Guan, H. PSAT1 regulates cyclin D1 degradation and sustains proliferation of non-small cell lung cancer cells. Int. J. Cancer 2015, 136, E39–E50. [Google Scholar] [CrossRef] [PubMed]
  15. Liu, B.; Jia, Y.; Cao, Y.; Wu, S.; Jiang, H.; Sun, X.; Ma, J.; Yin, X.; Mao, A.; Shang, M. verexpression of Phosphoserine Aminotransferase 1 (PSAT1) Predicts Poor Prognosis and Associates with Tumor Progression in Human Esophageal Squamous Cell Carcinoma. Cell Physiol. Biochem. 2016, 39, 395–406. [Google Scholar] [CrossRef]
  16. Gao, S.; Ge, A.; Xu, S.; You, Z.; Ning, S.; Zhao, Y.; Pang, D. PSAT1 is regulated by ATF4 and enhances cell proliferation via the GSK3β/β-catenin/cyclin D1 signaling pathway in ER-negative breast cancer. J. Exp. Clin. Cancer Res. 2017, 36, 179. [Google Scholar] [CrossRef] [Green Version]
  17. Fang, Y.; Liang, X.; Xu, J.; Cai, X. miR-424 targets AKT3 and PSAT1 and has a tumor-suppressive role in human colorectal cancer. Cancer Manag. Res. 2018, 10, 6537–6547. [Google Scholar] [CrossRef] [Green Version]
  18. Jiang, J.; Zhang, L.; Chen, H.; Lei, Y.; Zhang, T.; Wang, Y.; Jin, P.; Lan, J.; Zhou, L.; Huang, Z.; et al. Regorafenib induces lethal autophagy arrest by stabilizing PSAT1 in glioblastoma. Autophagy 2019, 1–17. [Google Scholar] [CrossRef]
  19. Eckel-Passow, J.E.; Lachance, D.H.; Molinaro, A.M.; Walsh, K.M.; Decker, P.A.; Sicotte, H.; Pekmezci, M.; Rice, T.; Kosel, M.L.; Smirnov, I.V.; et al. Glioma Groups Based on 1p/19q, IDH, and TERT Promoter Mutations in Tumors. N. Engl. J. Med. 2015, 372, 2499–2508. [Google Scholar] [CrossRef] [Green Version]
  20. Cancer Genome Atlas Research Network. Comprehensive, Integrative Genomic Analysis of Diffuse Lower-Grade Gliomas. N. Engl. J. Med. 2015, 372, 2481–2498. [Google Scholar] [CrossRef] [Green Version]
  21. Foote, M.B.; Papadopoulos, N.; Diaz, L.A., Jr. Genetic Classification of Gliomas: Refining Histopathology. Cancer Cell 2015, 28, 9–11. [Google Scholar] [CrossRef] [PubMed] [Green Version]
  22. Vatrinet, R.; Leone, G.; De Luise, M.; Girolimetti, G.; Vidone, M.; Gasparre, G.; Porcelli, A.M. The alpha-ketoglutarate dehydrogenase complex in cancer metabolic plasticity. Cancer Metab. 2017, 5, 3. [Google Scholar] [CrossRef] [PubMed] [Green Version]
  23. Sjöblom, T.; Jones, S.; Wood, L.D.; Parsons, D.W.; Lin, J.; Barber, T.D.; Mandelker, D.; Leary, R.J.; Ptak, J.; Silliman, N.; et al. The consensus coding sequences of human breast and colorectal cancers. Science 2006, 314, 268–274. [Google Scholar] [CrossRef] [PubMed]
  24. Parsons, D.W.; Jones, S.; Zhang, X.; Lin, J.C.H.; Leary, R.J.; Angenendt, P.; Mankoo, P.; Carter, H.; Siu, I.M.; Gallia, G.L.; et al. An integrated genomic analysis of human glioblastoma multiforme. Science 2008, 321, 1807–1812. [Google Scholar] [CrossRef] [PubMed] [Green Version]
  25. Yan, H.; Parsons, D.W.; Jin, G.; McLendon, R.; Rasheed, B.A.; Yuan, W.; Kos, I.; Batinic-Haberle, I.; Jones, S.; Riggins, G.J.; et al. IDH1 and IDH2 mutations in gliomas. N. Engl. J. Med. 2009, 360, 765–773. [Google Scholar] [CrossRef] [PubMed]
  26. Labussiere, M.; Sanson, M.; Idbaih, A.; Delattre, J.Y. IDH1 gene mutations: A new paradigm in glioma prognosis and therapy? Oncologist 2010, 15, 196–199. [Google Scholar] [CrossRef] [Green Version]
  27. Lee, S.M.; Koh, H.J.; Park, D.C.; Song, B.J.; Huh, T.L.; Park, J.W. Cytosolic NADP(+)-dependent isocitrate dehydrogenase status modulates oxidative damage to cells. Free Radic. Biol. Med. 2002, 32, 1185–1196. [Google Scholar] [CrossRef]
Figure 1. Identification of the PSAT1 gene as a biomarker candidate of lower-grade gliomas. The expression status of PSAT1 in tumors and normal tissues were obtained from the bioinformatics website, GEPIA. (A) The expression levels of PSAT1 in various tumors. Gene levels of PSAT1 were highly expressed in LGGs and GBMs. (B) The expression levels of PSAT1 in LGGs, GBMs and normal tissues. The expression levels of PSAT1 were significantly higher in tumors (LGGs and GBMs) than in normal tissues. (C) The prognostic significance of PSAT1 expression in the TCGA LGG cohort. Patients were divided into two subgroups according to PSAT1 expression for survival analysis.
Cancers 12 00013 g001aCancers 12 00013 g001b
Figure 2. The correlations between PSAT1 expression and other clinico-molecular parameters in LGGs in The Cancer Genome Atlas (TCGA) dataset. (A) A gene expression heatmap was constructed to show the correlations of PSAT1 expression with other parameters in LGGs. LGG patients in the TCGA dataset (n = 520) were classified into three subgroups according to the 2016 World Health Organization (WHO) classification of central nervous system (CNS) tumors (IDH1 wild-type, IDH1 mutations with chromosome 1p19q codeletion, and IDH1 mutations without chromosome 1p19q codeletion). (B) The correlations of PSAT1 expression with IDH1 mutations, chromosome 1p19q codeletion, ATRX mutations, TP53 mutations, CIC mutations, and FUBP1 mutations. (C) The expression levels of PSAT1 in the three subgroups of LGGs classified according to the 2016 WHO classification of CNS tumors. (D) The correlation between PSAT1 expression and TERT expression. (E) The expression levels of PSAT1 in grade II and III gliomas. (F) The correlation between PSAT1 expression and patient age. (G) The expression levels of PSAT1 in dead and alive LGG patients. The symbols *, ** and *** denote p < 0.05, p < 0.01 and p < 0.001, respectively.
Cancers 12 00013 g002
Figure 3. PSAT1 expression status was incorporated with IDH1 mutation status and chromosome 1p19q codeletion status to provide a better prognosis prediction in LGGs in the TCGA dataset. (A) The expression status of PSAT1 was incorporated with IDH1 mutation status to separate LGG patients into four subgroups for survival analysis. (B) The expression status of PSAT1 was incorporated with chromosome 1p19q codeletion status to separate LGG patients into four subgroups for survival analysis. (C) LGG patients were divided into three subgroups according to IDH1 mutation status and chromosome 1p19q codeletion status for survival analysis. (D) The expression status of PSAT1 was incorporated with IDH1 mutation status and chromosome 1p19q codeletion status to stratify LGG patients into six subgroups for survival analysis. (E) A suggested algorithm for classifying LGG patients with the combined use of IDH1 mutation status, the expression status of PSAT1 and chromosome 1p19q codeletion status.
Cancers 12 00013 g003
Figure 4. Validating the prognostic role of PSAT1 overexpression in the CGGA dataset. LGG (grade II and III gliomas) patients (n = 318) in the CGGA (Chinese Glioma Genome Atlas) dataset were used as a validation cohort. (A) The expression levels of PSAT1 in IDH1-mutant and IDH1 wild-type LGGs. (B) The expression levels of PSAT1 in grade II and grade III gliomas. (C) The expression levels of PSAT1 in chromosome 1p19q codeleted and not-codeleted LGGs. (D) The expression levels of PSAT1 in the three subgroups of LGGs classified according to the 2016 WHO classification of CNS tumors. (E) The expression levels of PSAT1 in the four subgroups of LGGs classified according to IDH1 mutation status and the WHO grade. (F) LGG patients were divided into two subgroups according to PSAT1 expression fur survival analysis. (G) LGG patients were classified into three subgroups according to the guideline of the 2016 WHO classification of CNS tumors for survival analysis. (H) The expression status of PSAT1 was incorporated with IDH1 mutation status and 1p19q codeletion status to separate LGG patients into six subgroups for survival analysis. The symbols *, ** and *** denote p < 0.05, p < 0.01 and p < 0.001, respectively.
Cancers 12 00013 g004
Figure 5. A coordinated biological reaction between IDH1 mutations and PSAT1 overexpression in LGGs. (A) PSAT1 overexpression promotes α-KG synthesis. (B) Mutant IDH1 converts α-KG to R-2HG. PSAT1 overexpression promotes α-KG synthesis, which could enhance the function of mutant IDH1.
Cancers 12 00013 g005
Table 1. Key regulators in the serine synthesis pathway.
EnzymeClassificationSubstrateProductPrognostic Roles in Cancers
PHGDHOxidoreductase3-phosphoglycerate; NAD+3-phosphohydroxypyruvate; NADH; H+A poor prognostic marker in Pancreatic cancer [10] and Breast cancer [11]
PSPHPhosphatase3-PhosphoserineSerine; phosphate ionA poor prognostic marker in Hepatocellular cancer [12] and Colorectal cancer [13]
PSAT1Amino transferase3-phosphohydroxypyruvate; glutamate3-Phosphoserine;
α-ketoglutarate
A poor prognostic marker in NSCLC [14], Esophageal Squamous Cell carcinoma [15], ER (-) Breast cancer [16] and Colorectal cancer [17]
A favorable prognostic marker in Glioblastoma with regorafenib treatment [18]
NAD+: an oxidized nicotinamide adenine dinucleotide.
Table 2. Correlations of PSAT1 expression with the clinicopathological features of patients in the TCGA LGG cohort.
Clinicopathological FeatureNPSAT1 Expression, N (%)p
520Low, n = 260 (50.0)High, n = 260 (50.0)
Overall survival indicator *** 0.000286
1 (dead)13284 (63.6)48 (36.4)
0 (alive)388176 (45.4)212 (54.6)
Chromosome 1p19q status * 0.011473
Codeleted16998 (58.0)71 (42.0)
Not-codeleted351162 (46.2)189 (53.8)
Age ** 0.001172
>40265151 (57.0)114 (43.0)
≤40255109 (42.7)146 (57.3)
WHO histological Grade *** 2.246 × 10⁻⁷
Grade III269164 (61.0)105 (39.0)
Grade II25196 (38.2)155 (61.8)
IDH1 status *** 0.000149
Wild-type11676 (65.5)40 (34.5)
Mutant404184 (45.5)220 (54.5)
TP53 status *** 0.000055
Wild-type262154 (58.8)108 (41.2)
Mutant258106 (41.1)152 (58.9)
ATRX status *** 1.713 × 10⁻⁷
Wild-type320189 (59.1)131 (40.9)
Mutant20071 (35.5)129 (64.5)
CIC status 0.053261
Mutant11064 (58.2)46 (41.8)
Wild-type410196 (47.8)214 (52.2)
FUBP1 status ** 0.006392
Mutant4833 (68.8)15 (31.3)
Wild-type472227 (48.1)245 (51.9)
TERT expression *** 0.000026
High260154 (59.2)106 (40.8)
Low260106 (40.8)154 (59.2)
The symbols *, ** and *** denote p < 0.05, p < 0.01 and p < 0.001, respectively.

