Article

Should Tumor Infiltrating Lymphocytes, Androgen Receptor, and FOXA1 Expression Predict the Clinical Outcome in Triple Negative Breast Cancer Patients?

1
Functional Biomorphology Laboratory, IRCCS Istituto Tumori “Giovanni Paolo II” of Bari, 70124 Bari, Italy
2
Unit of Biostatistics and Clinical Trials, Istituto Scientifico Romagnolo per lo Studio e la Cura dei Tumori (IRST) IRCCS, 47014 Meldola (FC), Italy
3
Pathology Department, IRCCS Istituto Tumori “Giovanni Paolo II” of Bari, 70124 Bari, Italy
4
Medical Oncology Unit, IRCCS-Istituto Tumori “Giovanni Paolo II” of Bari, 70124 Bari, Italy
5
Department of Biomedical Sciences and Human Oncology, University of Bari ‘Aldo Moro’ of Bari, 70124 Bari, Italy
*
Authors to whom correspondence should be addressed.
Contributed equally.
Cancers 2019, 11(9), 1393; https://doi.org/10.3390/cancers11091393
Submission received: 7 August 2019 / Revised: 28 August 2019 / Accepted: 9 September 2019 / Published: 18 September 2019
(This article belongs to the Special Issue New Insights into Breast and Endometrial Cancer)

Abstract

:
Tumor-infiltrating lymphocytes (TILs) are a valuable indicator of the immune microenvironment that plays the central role in new anticancer drugs. TILs have a strong prognostic role in triple negative breast cancer (TNBC). Little is known about the interaction with the androgen receptor (AR) and forkhead box A1 (FOXA1). We analyzed the relationships between TIL levels, AR, and FOXA1 expression and their clinical significance in TNBC patients. Further, we investigated their interaction with other biomarkers like programmed cell death ligand-1 (PD-L1), breast cancer type 1 susceptibility protein (BRCA1), poly (ADP-Ribose) polymerase 1 (PARP1), and Na+/H+ exchanger regulatory factor 1 (NHERF1). The expression of the proteins was evaluated by immunohistochemistry in 124 TNBC samples. TILs were performed adhering to International TILs Working Group 2014 criteria. Cox proportional hazards models were also used to identify risk factors associated with poor prognosis. Multivariate analysis identified TILs as independent prognostic factor of disease free survival (DFS; p = 0.045). A Kaplan–Meyer analysis revealed that the patients with high TILs had a better DFS compared to patients with low TILs (p = 0.037), and the phenotypes TILs−/AR+ and TILs−/FOXA1− had a worse DFS (p = 0.032, p = 0.001 respectively). AR was associated with FOXA1 expression (p = 0.007), and the tumors FOXA1+ presented low levels of TILs (p = 0.028). A poor DFS was observed for AR+/FOXA1+ tumors compared to other TNBCs (p = 0.0117). Low TILs score was associated with poor patients’ survival, and TILs level in combination with AR or FOXA1 expression affected patient’s clinical outcome. In addition, AR+/FOXA1+ phenotype identified a specific subgroup of TNBC patients with poor prognosis. These data may suggest new ways of therapeutic intervention to support current treatments.
Keywords:
TILs; TNBC; AR; FOXA1; prognosis

1. Introduction

Triple-negative breast cancer (TNBC) is characterized by a lack of the estrogen receptor (ER), progesterone receptor (PgR), and human epidermal growth factor receptor 2 (Her2) expression and/or amplification [1]. TNBC constitutes 15–20% of all breast cancers (BCs), having worse prognosis and a more aggressive clinical behavior respect to non-TNBCs [2,3,4]. Chemotherapy for TNBCs remains still the standard treatment for the lack of specific molecular targets [5]. Therefore, there is an urgent need to identify new therapeutic approaches for the management of these patients. In the landscape of possible therapies new targets are emerging next to conventional treatment.
The importance of the immunologic control on cancers has long been recognized, as well as the immune-escape resulting from different factors. These remarks are true for all cancer types as much as for TNBCs [6,7]. High tumor infiltrating lymphocytes (TILs) density has been associated to a better prognosis also in TNBCs and to an enhanced pathological complete response [8]. Now seems clear that high TILs presence makes a more favorable tumor microenvironment, affecting tumor progression also in an adverse subset of tumors such as TNBCs [9]. Observations of TILs in cancer [10,11] and their association with a favorable prognosis have changed the view about this disease [12]. Current studies give hope that a thorough knowledge of the interaction between tumor cells and the immune system might lead to clinically useful biomarkers. Among these are TILs and biomarkers related to the immune/tumor interaction, such as programmed cell death ligand-1 (PD-L1). TNBCs present more mutations that are involved in the synthesis of abnormal proteins; these can act as cancer neoantigens and trigger the antitumor immune response [13]. A recent in vitro study demonstrated the therapeutic efficacy of targeting PD-L1 with specific monoclonal antibodies (mAbs) in TNBCs, showing after the treatment a down-regulation of genes promoting cell migration, invasion and metastasis, epithelial-mesenchymal transition, cell growth, survival, and hypoxia. Conversely, an up-regulation of DNA repair genes was reported [14]. Further, Raninga and colleagues proved that a therapeutic combination treatment with anti-PD-L1 antibody reduced the tumor growth in a mouse model [15]. Therefore, TNBCs can be considered an interesting subset for the development of immunotherapy.
These data underline the pivotal role of the immune system in cancer progression and therapy response, by supporting the use of tumor immune system biomarkers in clinical practice and the immunotherapy as a promising treatment strategy for this subtype of patients.
In addition, to immune checkpoint markers, whose role has become increasingly important, other biomarkers have assumed considerable significance, such as the androgen receptor (AR) and forkhead box A1 (FOXA1). In the TNBC subgroup the co-expression of AR and FOXA1 has a prognostic value [16]. AR modulates the transcription of different genes by DNA-binding-dependent and independent mechanisms [17], including immune response genes [18]. Its expression is reported both in BC and in specific in TNBC [19], but the clinical significance of AR is still an open question. Recently AR has been associated to cancer cell growth and survival in TNBC cell lines and chemo-resistance in breast cancer models in vitro and in vivo [20,21,22]. Further, it is well-known that AR regulates transcriptional activity by different collaborative transcription factors, including FOXA1 [23] (Figure 1). FOXA1 has been identified as a transcriptional regulator of some liver-specific genes. It is expressed in different tumors, including BC and can bind to the promoters of more than hundred genes associated with regulation of cell signaling and the cell cycle, including ER. However, its role is unclear, some studies reported that FOXA1 and ERα constitute a major proliferative and survival axis for BC [24,25,26,27]. A recent research found that breast cancer type 1 susceptibility protein (BRCA1) was related with the suppression of FOXA1 expression in BC cell lines and that BRCA1 mutation was linked to FOXA1 promoter methylation and silencing in BCs [28]. BRCA1 is a suppressor gene, whose dysfunction is linked to a higher risk of developing cancer, such as inhibition of DNA repair enzymes poly (ADP-Ribose) polymerase 1 (PARP1) [29]. Moreover, our team has shown in TNBC tumors that the association between nuclear PARP1 and cytoplasmic NHERF1 (Na+/H+ exchanger regulatory factor 1) expression, a scaffolding protein with oncogenic activity [30], identified a subgroup of patients with a shorter survival [31].
In this study, we explored the significance of TILs, AR, and FOXA1 expression and their impact on the clinical outcome of primary TNBC patients. Furthermore, we investigated their correlation with immunological (PD-L1), DNA repair (BRCA1, and PARP1), and progression (NHERF1) biomarkers expression.

2. Results

2.1. Protein Expression Profiling of AR, FOXA1, PD-L1, BRCA1, PARP1, and NHERF1

The expression of AR, FOXA1, PD-L1, BRCA1, PARP1, and NHERF1 was evaluated according to their specific cut-off as described in the Material and Methods section.
AR and FOXA1 expression was evaluated at the nuclear level in the whole cohort. Among the stained BC samples, AR was present in 87% (108/124) of tumors and the 14.8% (16/108) of these tumors were AR+. The RNAscope assay confirmed the immunohistochemistry data, showing AR mRNA expression in the same tumor samples (Figure 2A).
FOXA1 was present in 91.1% (113/124) of tumor samples and it was overexpressed in 32.7% (37/113) of them. The PD-L1 reaction remained confined to the cell membrane. In 90.3% of the tumors (112/124) PD-L1 expressing the percentage of PD-L1 positive tumor cells was 25.9% (29/112). BRCA1 expression was assessed in 106/124 (85%) of the tumors and it was positive in 60/106 (56.6%) of cases. PARP1 expression was assessed in 107/124 (86.3%) of tumor samples, and it was positive in 20/107 (18.7%) of the tumors. NHERF1 expression was detected in the apical membrane, cytoplasm, and nucleus of tumor cells. These different localizations were scored separately and their significance was evaluated. Positive membranous NHERF1 (mNHERF1) was present in 35.6% (42/118), cytoplasmic NHERF1 (cNHERF1) in 52% (61/118), and nuclear NHERF1 (nNHERF1) in 17% (20/118) of cases.
Some examples of FOXA1, PD-L1, BRCA1, PARP1, and NHERF1 staining patterns and tissue samples with low and high TILs presence are shown in Figure 2B,C respectively.

2.2. Relationship Between Tumor Markers Expression and Clinicopathological Features

A summary of significant associations between tumor marker expressions and clinicopathological features is listed in Table S1a,b. Negative FOXA1 expression showed a significant association with higher tumor histological grade (p = 0.016) in 88.2% of tumors. In addition, negative PD-L1 was observed in 95.2% of invasive ductal carcinomas (p = 0.048) and all positive PD-L1 cases were significantly associated with high proliferative activity (p = 0.041). High nNHERF1 expression was present in 75% of older patients (p = 0.004), while the lack of nNHERF1 was noticeably associated with pre-menopausal status (p = 0.004) in 73.5% of cases.

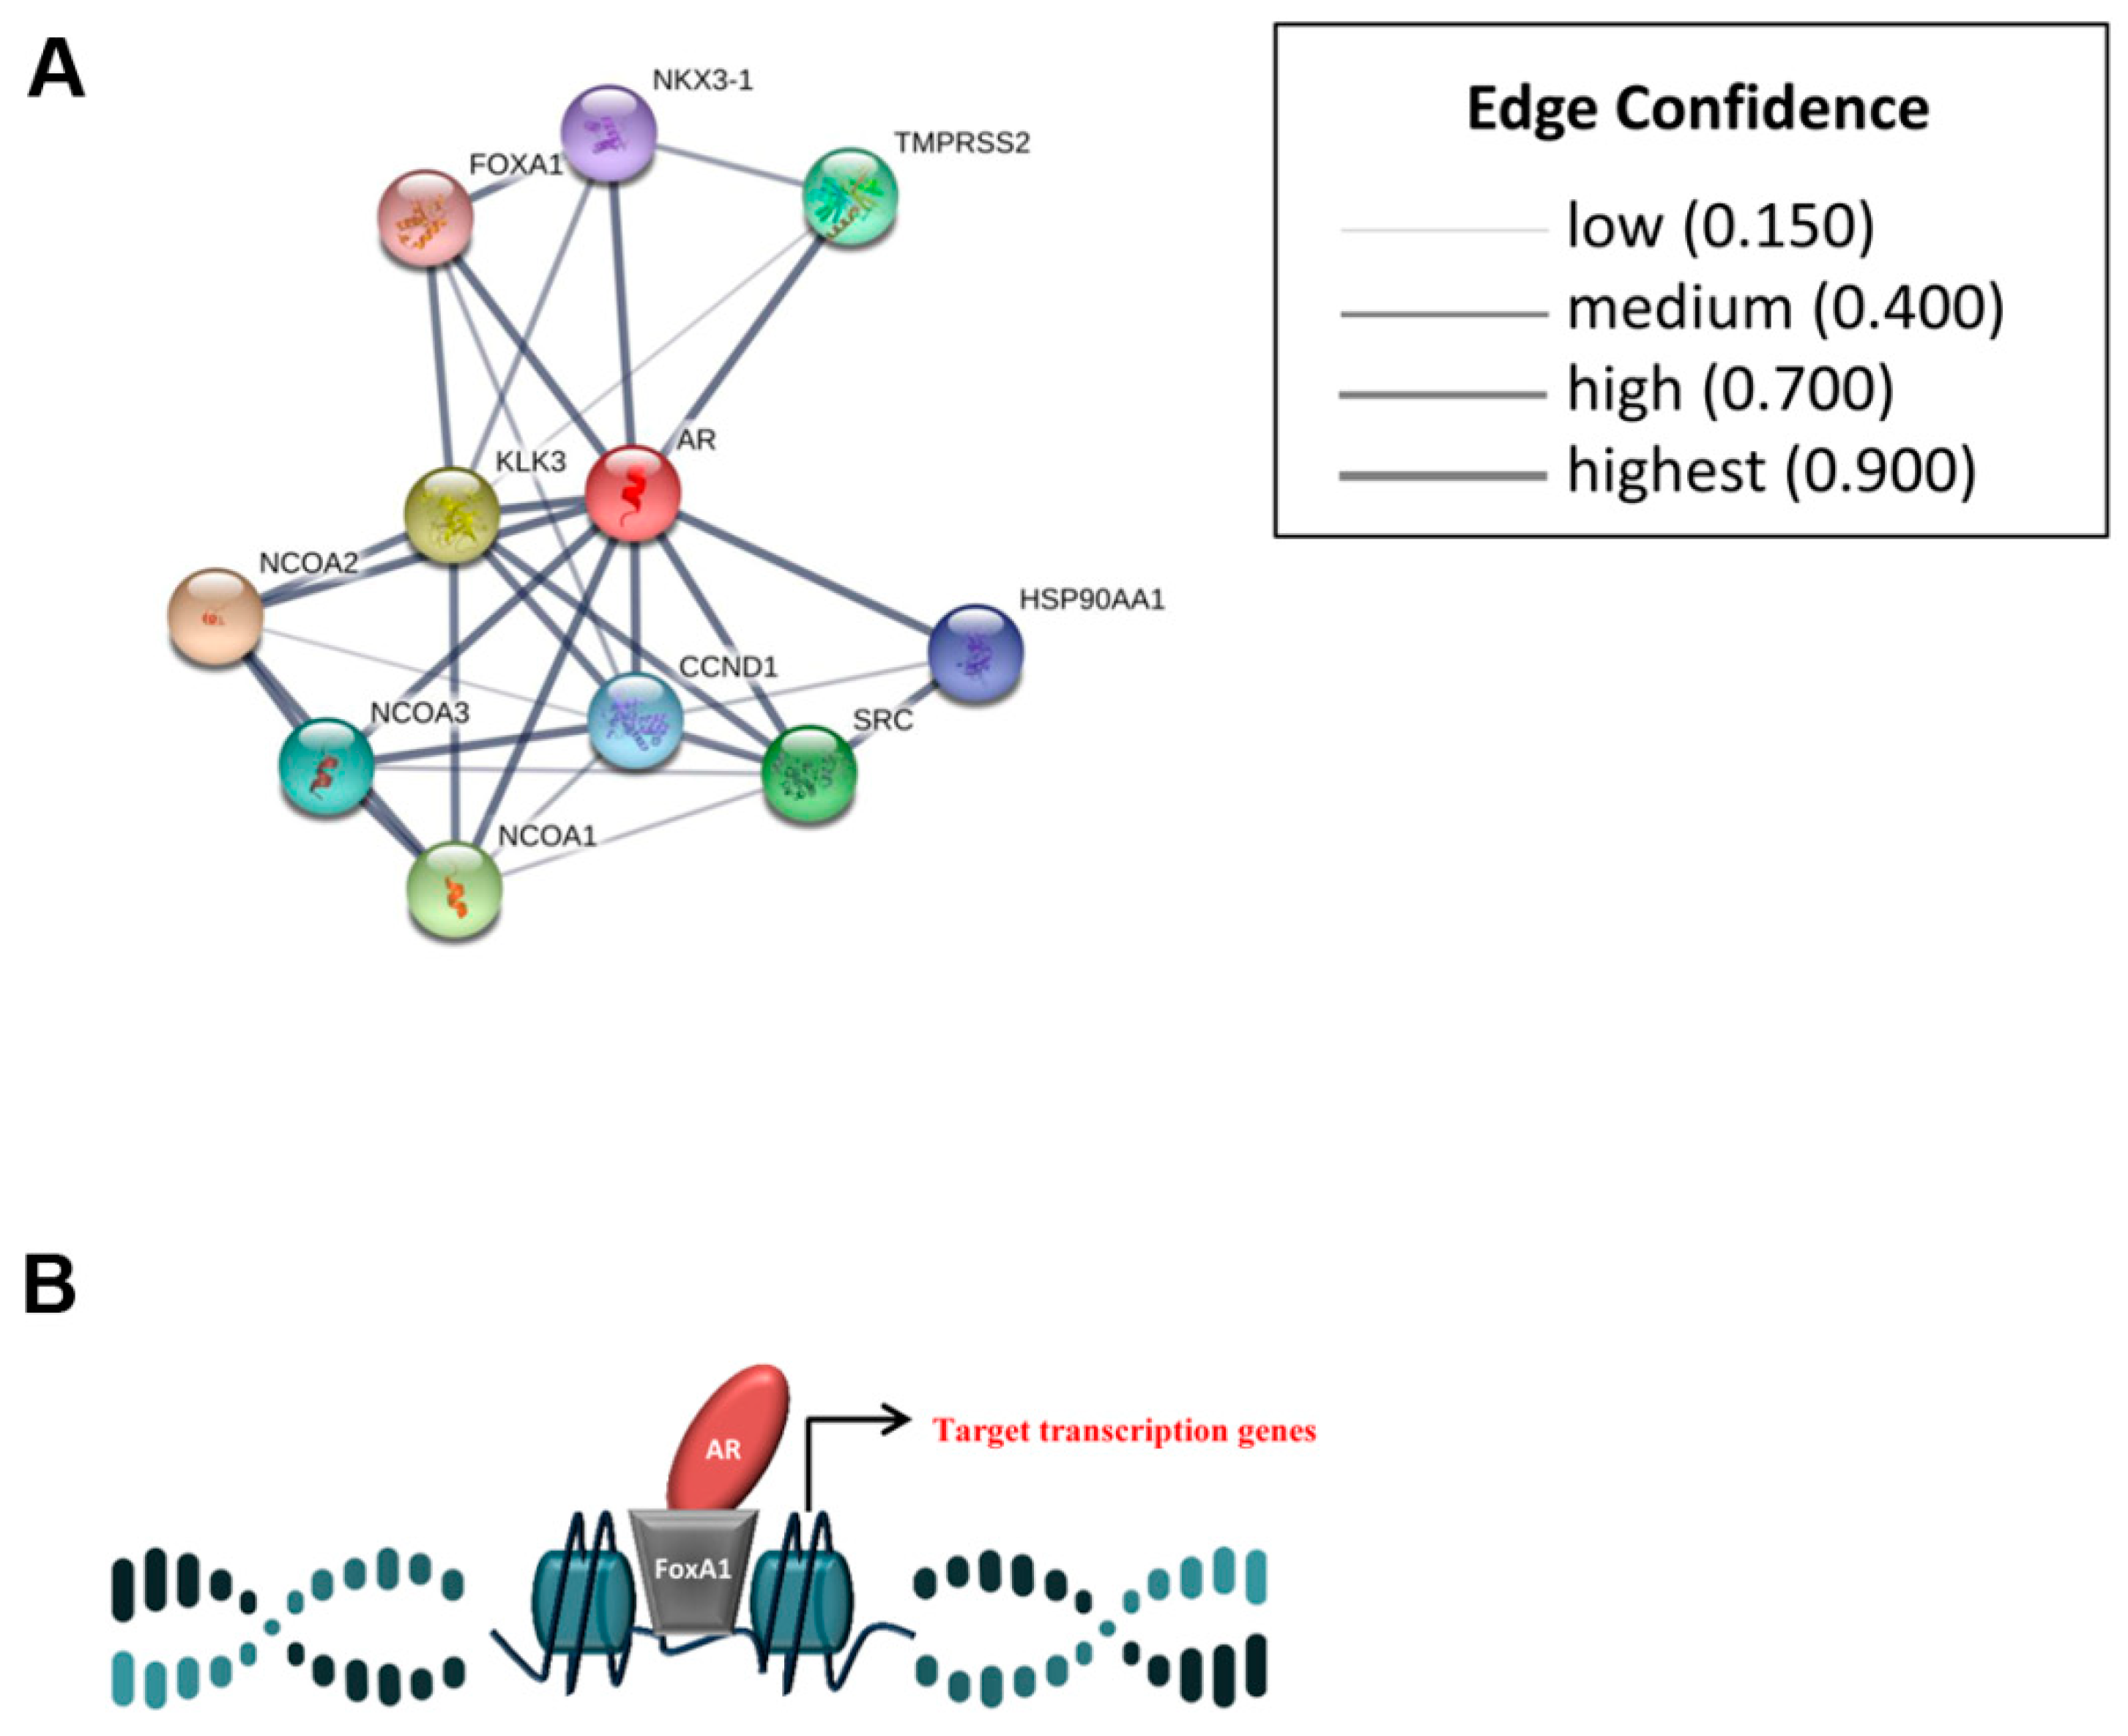
2.3. Association Between Protein Expressions Analyzed

We also analyzed the association among the tumor biomarkers. The statistical analyses, using continuous variables, showed a direct significant association between AR and FOXA1 (τ = 0.354; p < 0.001) and cNHERF1 expression (τ = 0.241; p = 0.002). BRCA1 was directly correlated to PARP1 expression (τ = 0.248; p = 0.001), and PARP1 was directly linked to nNHERF1 (τ = 0.297; p < 0.001) and inversely to mNHERF1 expression (τ = −0.242; p = 0.003). When we analyzed TILs correlation, there was a direct relation comparing TILS with PD-L1 and cNHERF1 expression (τ = 0.259; p = 0.001; τ = 0.199; p = 0.004 respectively) and inverse relation between TILS and BRCA1 expression (τ = −0.172; p = 0.020). Statistical analysis and its relative heatmap are shown in Figure 3 and Table 1. These results were also confirmed by dichotomized variables.

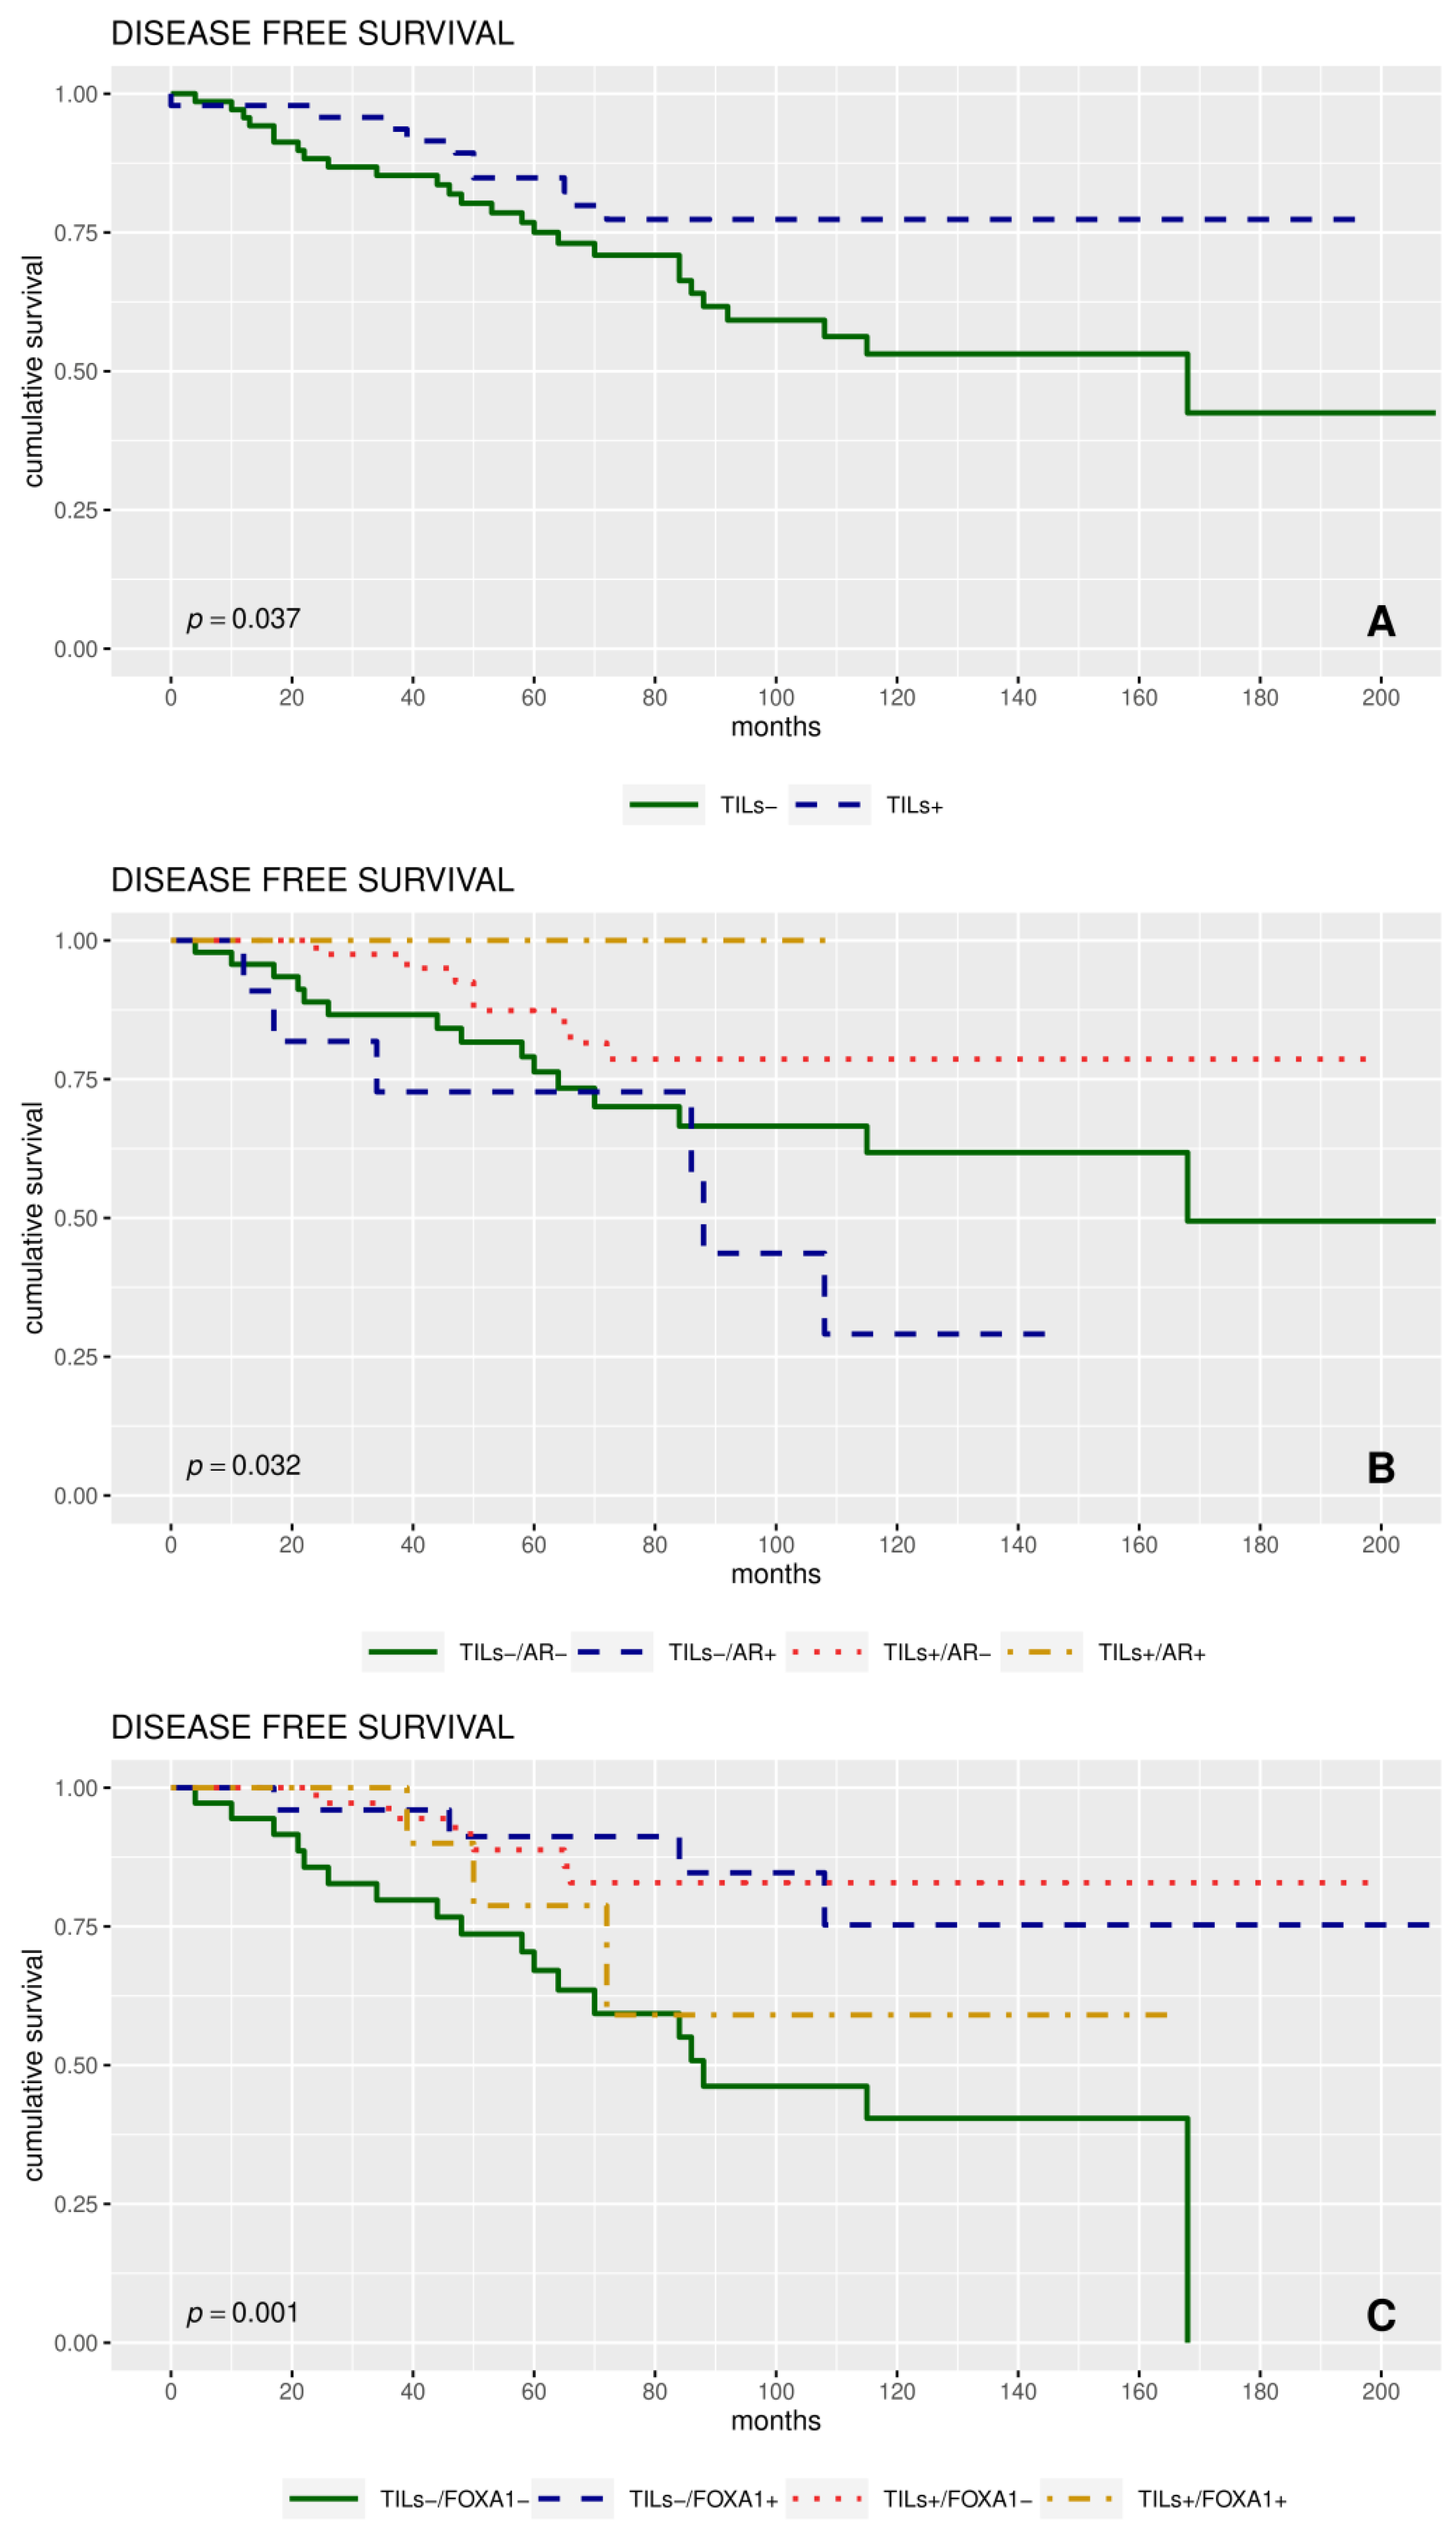
2.4. Expression of Proteins and Patient Clinical Outcome

Univariate analyses were carried out for all the clinicopathological characteristics and the expression of AR, FOXA1, PD-L1, BRCA1, PARP1, mNHERF1, cNHERF1, and nNHERF1 proteins, as dichotomized and continuous variables. These were correlated to disease free survival (DFS) and overall survival (OS). Considering dichotomized variables, no significant differences were observed in the DFS and in the OS analyses among patients with high and low AR, FOXA1, PDL1, and NHERF1 protein expression. We found a significant association between BRCA1 and PARP1 with OS (p = 0.030, p = 0.032, respectively). Moreover, the subgroup of patients with high TILs had a better 5-year DFS and OS compared to patients with low TILs, 84% vs. 75% (p = 0.037) and 98% vs. 88% (p = 0.019) respectively (Table 2).
Multivariate analysis identified the TILs as an independent prognostic factor of DFS (HR = 0.34, 95% confidence interval (CI): 0.12–0.98, p=0.045, (Table 3)).
Next, we investigated the relationship between protein expression and TNBC patient’s survival. Kaplan–Meier curves revealed that the patients with higher TILs score had a better DFS (p = 0.037; Figure 4A).
Considering co-expression markers:
TILs−/AR−, TILs−/AR+, TILs+/AR−, and TILs+/AR+, Kaplan–Meier analysis showed that the patients with TILs−/AR+ tumors had a worse DFS respect to the other phenotypes considered (p = 0.032; Figure 4B).
TILs−/FOXA1−, TILs−/FOXA1+, TILs+/FOXA1−, and TILs+/FOXA1+ phenotypes, we observed significant differences in DFS among four groups. The subgroup TILs−/FOXA1−, had a worse DFS (p = 0.001), compared to other groups (Figure 4C).
Moreover, a poor DFS was observed for AR+/FOXA1+ tumors respect to other tumors (p = 0.0117; Figure S1). The patients with AR+ and FOXA1− tumors tended toward a poorer DFS than patients with AR−/FOXA1+ tumors (p = 0.080). The subgroup TILs−/BRCA1+ showed a worst DFS respect to TILs+/BRCA1− (p = 0.097). Moreover, no significance was found considering the TILs+/PD-L1+ phenotype (p = 0.100; Figure S2).

3. Discussion

The recent scientific research has drawn particular attention to the identification of predictive/prognostic biomarkers for targeted analysis and therapy on TNBCs. Therefore, it is necessary to better understand the molecular regulatory mechanisms of this type of BC, in order to develop new effective therapeutic approaches to improve patients’ treatment.
The prognostic relevance and the potential predictive impact of TILs in TNBCs have been recognized. Different studies confirmed that high levels of TILs are associated with better survival [16,32,33,34].
In our series, multivariate analysis revealed that TILs were an independent prognostic factor of DFS, and, Kaplan–Meier analysis showed that TNBC patients with high TIL levels had a better DFS.
In addition, when TILs were considered in association with AR, Kaplan–Meier analysis revealed a worse DFS for the TILs−/AR+ than other phenotypes. This result reinforced the key role that AR could play in more aggressive tumors and endorsed the protective action of TILs. A protective role was demonstrated by TILs also in the subgroup phenotype TILs+/AR+, balancing the hypothetical negative role of AR and highlighting a subgroup with no recurrence. Patients with TILs−/FOXA1− tumors had a shorter prognosis than other subgroups, suggesting a pivotal role of the immune infiltrate. However a meta-analysis study also showed that low FOXA1 expression level was associated with a poor survival outcome [35].
Our results showed AR expression in about the 15% of cases, with cut-offs of 10%, unlike Guiu [16]. The choice of a better cut-off is still subject of comparison. We adopted a cut-off of 10% following careful review of the literature [36,37]. In agreement with previous studies, we observed a poor DFS in AR+ TNBCs, rationalizing a pharmacological AR block as a potential endocrine therapy for these patients [16,38]. The literature disagrees about the prognostic impact of AR in TNBC. In fact, some authors found an association of AR with a better prognosis in BC [38,39,40,41]. Heterogeneity of used antibodies, chosen cut-offs and patient cohorts make the AR expression particularly variable and its prognostic role controversial [42].
We underlined a significant association AR/FOXA1 and a shorter DFS in AR+/FOXA1+ phenotype, despite the small number of cases, in accordance with other authors [16]. Moreover, the involvement of AR in the tumor aggressiveness is also highlighted by the correlation between AR and cNHERF1, a marker of tumor progression in BCs [31,43], and involved in different signaling pathway [44,45]. Interestingly, we observed a direct interaction between TILs and cNHERF1, that could appear a non-sense being two markers with an antagonist action: Protective and tumorigenic, respectively. Nevertheless, recently we demonstrated a pivotal role of NHERF1 in the orchestrate tumor microenvironment signaling pathways, with a strictly association with angiogenic factors and epithelial-mesenchymal transition proteins [30]. Its involvement in the tumor inflammatory panorama could create the favorable environment to recall TILs migration in the major cancer areas.
It is well known that dysfunction of DNA repair systems such as BRCA1 or PARP1 are involved in carcinogenesis [29]. In this cohort of TNBCs, no significant statistically associations emerged among analyzed biomarkers. We confirmed a direct correlation between BRCA1 and PARP1 expression, to prove the up-regulation of these two repair systems, particularly in TNBCs [31]. In addition, an inverse relationship between BRCA1 and TILs was found, hypothesizing that BRCA1-mutated tumors could have more tumor-specific neoantigens and, therefore, increased TILs. This is in line with what is reported by Massink, who observed that BRCA1-mutated BCs were affected by the presence of high numbers of TILs [46]. The survival analyses were made for all markers alone and in combination with TILs, but no significant results were observed in the different subgroups: TILs-NHERF1, TILs-BRCA1, and TILs-PARP1 phenotypes.
The PD-1/PD-L1 pathway is an important immunosuppression mechanism by which cancer cells escape host immunity [47].
Some recent studies described a higher PD-L1 expression in TNBCs [16,48], but the rate of expression is extremely variable [49], and its prognostic significance is still debated. These differences might be caused by evaluation of PD-L1 expression and the cut-off values adopted, antibodies used and in the type of sample analyzed. In the present study, about 26% of TNBCs expressed PD-L1 and it was associated to tumors with high proliferative activity, but no with AR no FOXA1. The DFS of patients with TILs+/PD-L1+tumors was improved, as reported by other authors [50], even if our result was not statistically significant.
We are aware that changes of standard treatments of this tumor along the time of collection of tumor specimens could represent a potential limit of our study. On the other side, this retrospective series allowed us to have available a very long follow up for these patients.

4. Materials and Methods

4.1. Patients and Clinicopathological Characteristics

A total of 124 primary TNBC patients who had received surgical treatment at the IRCCS, Istituto Tumori “Giovanni Paolo II” of Bari, Italy between 1996 to 2012, were retrieved from a data base of the Pathology Department of our institute. The patients were selected retrospectively according to the availability of the biological material and the clinical follow up. Our patient series was not consecutive. Characteristics of patients are shown in Table 4. All patients received adjuvant chemotherapy (anthracycline and taxane). The patients were selected according to the following criteria: (i) Female gender; (ii) histologically confirmed invasive carcinoma with estrogen (ER) and progesterone (PgR) receptor-negative tumors (<1% of positive cells), and any HER2 status (absence of HER2 overexpression or amplification), (iii) no evidence of distant metastasis at diagnosis, (iv) no treatment of any type prior to surgery, and (v) no patients with a history of previous malignancies. ER, PgR, proliferative activity, and HER2 status were provided by the Pathology Department of our institute. ER and PgR assessment used the ER/PgR (PharmDX kits, Dako, Santa Clara, CA, USA). HER2 status was evaluated using a monoclonal antibody (MoAb clone CB11; Novocastra Laboratories, Ltd., Newcastle, UK) and scored in accordance with the HercepΤest scoring system (Food and Drug Administration, Silver Spring, MD, USA) [51]. HER2 was considered to be positive if immunostaining was 3+ or if a score 2+ showed gene amplification by fluorescence in situ hybridization (FISH). Results were reported using American Society of Clinical Oncology and the College of American Pathologists (ASCO/CAP 2007 criteria) [52]. Ki67 nuclear staining was used to assess the proliferative activity, with a cut off value of 20% positive cells to indicate the tumors with Ki67 >20% as highly proliferating. The analysis of TILs was assessed in full-face hematoxylin and eosin sections, according to the International TILs Working Group 2014 criteria [53]. Tumors with TILs score of ≥50% were considered lymphocyte predominant breast cancer. The study was approved by the Ethics Committee of the Istituto Tumori “Giovanni Paolo II” with the reference 657/CE on 13th December 2018.

4.2. TMA and Immunohistochemistry

Tissue microarrays (TMAs) were assembled from formalin-fixed and paraffin-embedded (FFPE) tissues of tumors using the Galileo Tissue MicroArrayer CK 4500 (Transgenomic, Hillington Park, Glasgow, UK). Each sample was arrayed in triplicate to minimize tissue loss and to overcome tumor heterogeneity.
Four-micrometer-thick sections were cut from FFPE blocks and mounted onto slides. The slides were processed and stained as previously reported [31].
The OptiView DAB IHC Detection Kit (Ventana Medical Systems, Tucson, AZ, USA) was used to detect protein expression and for PD-L1 staining an OptiView Amplification Kit (Ventana Medical Systems, Tucson, AZ, USA) was also used. All solutions were from Ventana Medical Systems unless otherwise specified. Briefly, slides underwent deparaffinization with the EZ PREP solution, followed by antigen retrieval with Cell Conditioning solution 1 at 95° for BRCA1 (60 min), AR (56 min), FoxA1 (32 min), and PD-L1 (32 min), and Cell Conditioning solution 2 at 95 °C for PARP1 (36 min). No antigen retrieval was executed for NHERF1. The following step was incubation at 37° with the following specific primary antibody diluted in Antibody Diluent: Rabbit polyclonal NHERF1 antibody (anti-EBP50; ThermoFisher Scientific, Rockford, IL, USA), 1:350 (16 min); mouse monoclonal PARP1 antibody (F-2 clone, Santa Cruz Biotechnology Inc., Santa Cruz, CA, USA), 1:500 (16 min); mouse monoclonal BRCA1 antibody (MS110 clone; Oncogene Research Products, Calbiochem, Merck KGaA, Darmstadt, Germany), 1:75 (32 min); mouse monoclonal anti-human PD-L1 (clone 22c3, Dako Agilent, Santa Clara, CA, USA), 1:100 (32 min); mouse monoclonal anti-FoxA1 (clone 2f83, Merck Millipore, Burlington, MA, USA), 1:200 (36 min); and mouse monoclonal anti-human androgen receptor (clone AR441, Dako agilent, Santa Clara, CA, USA), 1:50 (36 min). Finally, tissues were counterstained with hematoxylin and a bluing reagent for 8 min and 4 min respectively, then were dehydrated and mounted. Positive and negative controls were included in each staining run as indicated in the data sheet of each antibody. All antibodies used in this study have been validated in the pre-analytic phase to guarantee a satisfactory level of reproducibility and accuracy.

4.3. Immunohistochemical Assessment

To analyze protein expression of AR, FoxA1, PD-L1, BRCA1, PARP1, and NHERF1 we utilized TMAs including 124 breast cancer samples. For immunohistochemical assessment we followed the previous method [31]. The data from the immunohistochemistry assay were examined independently by two of the researchers. If one core was uninformative, lost, or contained no tumor tissue, the overall score applied was that of the remaining cores. For each analyzed protein, the cases in which all three cores were uninformative were considered non-assessable and excluded from the analyses. Any discrepancies between the two observers were resolved by re-examination and consensus. The examination of AR expression was assessed on the basis of nuclear staining intensity and we used 10% as cut-off value (negative <10; and positive ≥10) [37].
For nuclear FoxA1 staining, the percentage of positive cells was estimated and the average intensity was scored similarly to PARP1. In this quickscore (QS) system a final score was calculated by multiplying the percentage score by the intensity score. The percentage of staining was categorized as: 0 = no nuclear expression; 1 = 1% to 10% positive tumor nuclei; 2 = 11% to 20%; and so on until a maximum score of 10 = 91% to 100% positive tumor nuclei. The intensity was scored as: 1+ = weak staining; 2+ = moderate staining; and 3+ = strong staining. A QS between 0 and 3 was classified as negative, and a score ≥4 was considered positive [54]. PD-L1 protein expression was determined by using the tumor proportion score (TPS), which is the percentage of viable tumor cells showing partial or complete membrane staining at any intensity. A TPS ≥1% was referred to as positive staining for PD-L1 [55]. The immunohistochemical assessment of BRCA1, PARP1, and NHERF1 was scored as previously reported [31,56] and it was detailed in Table S2.

4.4. RNA Scope

For evaluation of AR mRNA expression a commercial kit (RNAscope® 2.5 High Definition (HD)-BROWN Assay, Advanced Cell Diagnostics, Newark, CA, USA) was used. Paraffin embedded samples were cut into 5 +/− 1 μm sections, baked for 1 h at 60 °C and deparaffinized. Subsequently the slides were pretreated with a RNAscope® Pretreatment Kit (Advanced Cell Diagnostics, Newark, CA, USA) target retrieval solution and Protease Plus) to unmask target RNA and permeabilize cells. The probe was then hybridized to target mRNA for 2 h at 40 °C. The signal was amplified using a multi-step process, followed by hybridization to horseradish peroxidase (HRP)-labeled probes. The signal was detected using a chromogenic substrate, 3,3′-diaminobenzidine (DAB) for 10’ at room temperature (RT), and before mounting the slides were counterstained with 50% hematoxylin I for 2’ at RT and washed in a 0.02% ammonia bath for 10 seconds. Tissue sections were examined under a standard bright field microscope at 20–40× magnification. Positive signals were visible as brown punctate dots.

4.5. Follow Up and Statistical Analysis

The Chi-squared test and Kendall rank test were assessed to evaluate the tumor markers relationship using categorical variables and continuous variables, respectively. Protein expression analyses were carried out in relation to disease-free survival (DFS) and overall survival (OS) in months. DFS was described as the timeframe between diagnosis and loco-regional/distant relapse (second invasive BC, second primary cancer, and/or death without evidence of BC to the date of last contact). OS was described as the timeframe between diagnosis and date of last contact or of death from any cause. Univariate analyses of biomarkers expression and clinicopathological variables were performed for both DFS and OS, using the Kaplan–Meier method (5-year, 95% confidence interval (CI)) and compared by the log rank test. The hazard ratio (HR) for univariate and multivariate analyses was calculated by the Cox proportional hazard regression model. Statistical significance level was p-values < 0.05. Statistical analyses were achieved using the statistical packages survival and survminer of the statistical language R, version 3.4 (R Core Team: Vienna, Austria) [57].

5. Conclusions

Our data proved that low TILs score was associated with poor patients’ survival, and the presence or absence of TILs in combination with AR or FOXA1 expression affected the patient’s clinical outcome. Moreover, AR+/FOXA1+ phenotype identified a specific subgroup of TNBC patients with a poor DFS. The improved DFS of the TILs+/PD-L1+ tumor phenotypes (even though not statistically significant) suggests a general activation of immune system in TNBCs, highlighted also by direct correlation between TILs and PD-L1. Our results suggest that TILs may be a good marker of the immune response, and underline the need of future studies on the relationship between the immune system and cancer cells.

Supplementary Materials

The following are available online at https://www.mdpi.com/2072-6694/11/9/1393/s1, Table S1: Relationship between tumor markers and clinicopathological features; Table S2: Dilution, source, staining of antibodies and cut off used; Figure S1: Survival analysis. DFS curves for patients with simultaneously AR+/FOXA1+ phenotype respect to all other tumors (p= 0.0117); Figure S2: Survival analysis. DFS curves for patients with simultaneously AR−/FOXA1+ vs. AR+/FOXA1− (p = 0.080). TILs−/BRCA1+ vs. to TILs+/BRCA1− (p = 0.097) and TILs+/PD-L1+ Vs TILs−/PD-L1− (p = 0.100) expression.

Author Contributions

A.M. and G.O. concepted and designed the study; M.C. and C.V. developed methodology; F.G. provided patients’ follow-up; O.P. and M.P. provided clinical-pathological features; A.V. analyzed data; C.S. writing-original draft preparation; A.M. writing-review and editing; A.M. and N.S. supervision.

Funding

This research was funded by the Italian Ministry of Health, “Ricerca Corrente 2018-2020”, Del. 68/2019 and partially supported by Apulian Regional Project “Medicina di Precisione”.

Acknowledgments

The authors thank Francesco Fanelli for the technical assistance and Caterina Farina for language revision and editing.

Conflicts of Interest

The authors declare no conflict of interest.

References

  1. Sharma, P. Biology and management of patients with Triple-Negative Breast Cancer. Oncologist 2016, 21, 1050–1062. [Google Scholar] [CrossRef] [PubMed]
  2. Howlader, N.; Altekruse, S.F.; Li, C.I.; Chen, V.W.; Clarke, C.A.; Ries, L.A.; Cronin, K.A. US incidence of breast cancer subtypes defined by joint hormone receptor and HER2 status. J. Natl. Cancer Inst. 2014, 106, pii: dju055. [Google Scholar] [CrossRef] [PubMed]
  3. Dent, R.; Trudeau, M.; Pritchard, K.I.; Hanna, W.M.; Kahn, H.K.; Sawka, C.A.; Lickley, L.A.; Rawlinson, E.; Sun, P.; Narod, S.A. Triple negative breast cancer: Clinical features and patterns of recurrence. Clin. Cancer Res. 2007, 13, 4429–4434. [Google Scholar] [CrossRef] [PubMed]
  4. Wahba, H.A.; El-Hadaad, H.A. Current approaches in treatment of triple-negative breast cancer. Cancer Biol. Med. 2015, 12, 106–116. [Google Scholar] [PubMed]
  5. Early Breast Cancer Trialists’Collaborative Group (EBCTCG). Comparisons between different polychemotherapy regimens for early breast cancer: Meta-analyses of long-term outcome among 100,000 women in 123 randomised trials. Lancet 2012, 379, 432–444. [Google Scholar] [CrossRef]
  6. Pruneri, G.; Gray, K.P.; Vingiani, A.; Viale, G.; Curigliano, G.; Criscitiello, C.; Láng, I.; Ruhstaller, T.; Gianni, L.; Goldhirsch, A.; et al. Tumor-infiltrating lymphocytes (TILs) are a powerful prognostic marker in patients with triple-negative breast cancer enrolled in the IBCSG phase III randomized clinical trial 22-00. Breast Cancer Res. Treat. 2016, 158, 323–331. [Google Scholar] [CrossRef] [PubMed]
  7. Denkert, C.; Loibl, S.; Noske, A.; Roller, M.; Müller, B.M.; Komor, M.; Budczies, J.; Darb-Esfahani, S.; Kronenwett, R.; Hanusch, C.; et al. Tumor-associated lymphocytes as an independent predictor of response to neoadjuvant chemotherapy in breast cancer. J. Clin. Oncol. 2010, 28, 105–113. [Google Scholar] [CrossRef]
  8. Hida, A.I.; Watanabe, T.; Sagara, Y.; Kashiwaba, M.; Sagara, Y.; Aogi, K.; Ohi, Y.; Tanimoto, A. Diffuse distribution of tumor-infiltrating lymphocytes is a marker for better prognosis and chemotherapeutic effect in triple-negative breast cancer. Breast Cancer Res. Treat. 2019, 1–12. [Google Scholar] [CrossRef]
  9. Stanton, S.E.; Adams, S.; Disis, M.L. Variation in the incidence and magnitude of tumor-infiltrating lymphocytes in breast cancer subtypes: A systematic review. JAMA Oncol. 2016, 2, 1354–1360. [Google Scholar] [CrossRef]
  10. Basile, D.; Garattini, S.K.; Bonotto, M.; Ongaro, E.; Casagrande, M.; Cattaneo, M.; Fanotto, V.; Carlo, E.D.; Loupakis, F.; Urbano, F.; et al. Immunotherapy for colorectal cancer: Where are we heading? Expert Opin. Biol. Ther. 2017, 17, 709–721. [Google Scholar] [CrossRef]
  11. Gardini, A.C.; Scarpi, E.; Faloppi, L.; Scartozzi, M.; Silvestris, N.; Santini, D.; de Stefano, G.; Marisi, G.; Negri, F.V.; Foschi, F.G.; et al. Immune inflammation indicators and implication for immune modulation strategies in advanced hepatocellular carcinoma patients receiving sorafenib. Oncotarget 2016, 7, 67142. [Google Scholar] [CrossRef] [PubMed]
  12. Dieci, M.V.; Criscitiello, C.; Goubar, A.; Viale, G.; Conte, P.; Guarneri, V.; Ficarra, G.; Mathieu, M.C.; Delaloge, S.; Curigliano, G.; et al. Prognostic value of tumor-infiltrating lymphocytes on residual disease after primary chemotherapy for triple-negative breast cancer: A retrospective multicenter study. Ann. Oncol. 2014, 25, 611–618. [Google Scholar] [CrossRef] [PubMed]
  13. Liu, Z.; Li, M.; Jiang, Z.; Wang, X.A. Comprehensive Immunologic Portrait of Triple-Negative Breast. Cancer Transl. Oncol. 2018, 11, 311–329. [Google Scholar] [CrossRef] [PubMed]
  14. Saleh, R.; Taha, R.Z.; Sasidharan Nair, V.; Alajez, N.M.; Elkord, E. PD-L1 Blockade by Atezolizumab Downregulates Signaling Pathways Associated with Tumor Growth, Metastasis, and Hypoxia in Human Triple Negative Breast Cancer. Cancers 2019, 11, 1050. [Google Scholar] [CrossRef] [PubMed]
  15. Raninga, P.V.; Lee, A.C.; Sinha, D.; Shih, Y.Y.; Mittal, D.; Makhale, A.; Bain, A.L.; Nanayakarra, D.; Tonissen, K.F.; Kalimutho, M.; et al. Therapeutic cooperation between auranofin, a thioredoxin reductase inhibitor and anti-PD-L1 antibody for treatment of triple-negative breast cancer. Int. J. Cancer. 2019. [Google Scholar] [CrossRef] [PubMed]
  16. Guiu, S.; Mollevi, C.; Charon-Barra, C.; Boissière, F.; Crapez, E.; Chartron, E.; Lamy, P.J.; Gutowski, M.; Bourgier, C.; Romieu, G.; et al. Prognostic value of androgen receptor and FOXA1 co-expression in non-metastatic triple negative breast cancer and correlation with other biomarkers. Br. J. Cancer. 2018, 119, 76–79. [Google Scholar] [CrossRef] [PubMed]
  17. Simental, J.A.; Sar, M.; Lane, M.V.; French, F.S.; Wilson, E.M. Transcriptional activation and nuclear targeting signals of the human androgen receptor. J. Biol. Chem. 1991, 266, 510–518. [Google Scholar]
  18. Desai, K.V.; Michalowska, A.M.; Kondaiah, P.; Ward, J.M.; Shih, J.H.; Green, J.E. Gene expression profiling identifies a unique androgen-mediated inflammatory/immune signature and a PTEN (phosphatase and tensin homolog deleted on chromosome 10)-mediated apoptotic response specific to the rat ventral prostate. Mol. Endocrinol. 2004, 18, 2895–2907. [Google Scholar] [CrossRef]
  19. Liu, Y.X.; Zhang, K.J.; Tang, L.L. Clinical significance of androgen receptor expression in triple negative breast cancer-an immunohistochemistry study. Oncol. Lett. 2018, 15, 10008–10016. [Google Scholar] [CrossRef]
  20. Ni, M.; Chen, Y.; Lim, E.; Wimberly, H.; Bailey, S.T.; Imai, Y.; Rimm, D.L.; Liu, X.S.; Brown, M. Targeting androgen receptor in estrogen receptor-negative breast cancer. Cancer Cell 2011, 20, 119–131. [Google Scholar] [CrossRef]
  21. Barton, V.N.; Christenson, J.L.; Gordon, M.A.; Greene, L.I.; Rogers, T.J.; Butterfield, K.; Babbs, B.; Spoelstra, N.S.; D’Amato, N.C.; Elias, A.; et al. Androgen receptor supports an anchorage-independent, cancer stem cell-like population in triple-negative breast cancer. Cancer Res. 2017, 77, 3455–3466. [Google Scholar] [CrossRef] [PubMed]
  22. De Amicis, F.; Thirugnansampanthan, J.; Cui, Y.; Selever, J.; Beyer, A.; Parra, I.; Weigel, N.L.; Herynk, M.H.; Tsimelzon, A.; Lewis, M.T.; et al. Androgen receptor overexpression induces tamoxifen resistance in human breast cancer cells. Breast Cancer Res. Treat. 2010, 121, 1–11. [Google Scholar] [CrossRef] [PubMed]
  23. Robinson, J.L.; Macarthur, S.; Ross-Innes, C.S.; Tilley, W.D.; Neal, D.E.; Mills, I.G.; Carroll, J.S. Androgen receptor driven transcription in molecular apocrine breast cancer is mediated by FoxA1. EMBO J. 2011, 30, 3019–3027. [Google Scholar] [CrossRef] [PubMed] [Green Version]
  24. Hurtado, A.; Holmes, K.A.; Ross-Innes, C.S.; Schmidt, D.; Carroll, J.S. FOXA1 is a key determinant of estrogen receptor function and endocrine response. Nat. Genet. 2011, 43, 27–33. [Google Scholar] [CrossRef] [PubMed]
  25. Mehta, R.J.; Jain, R.K.; Leung, S.; Choo, J.; Nielsen, T.; Huntsman, D.; Nakshatri, H.; Badve, S. FOXA1 is an independent prognostic marker for ER-positive breast cancer. Breast Cancer Res. Treat. 2012, 131, 881–890. [Google Scholar] [CrossRef] [PubMed]
  26. Carroll, J.S.; Liu, X.S.; Brodsky, A.S.; Li, W.; Meyer, C.A.; Szary, A.J.; Eeckhoute, J.; Shao, W.; Hestermann, E.V.; Geistlinger, T.R.; et al. Chromosome-wide mapping of estrogen receptor binding reveals long-range regulation requiring the forkhead protein FoxA1. Cell 2005, 122, 33–43. [Google Scholar] [CrossRef] [PubMed]
  27. Laganiere, J.; Deblois, G.; Lefebvre, C.; Bataille, A.R.; Robert, F.; Giguère, V. From the cover: Location analysis of estrogen receptor alpha target promoters reveals that FOXA1 defines a domain of the estrogen response. Proc. Natl. Acad. Sci. USA. 2005, 102, 11651–11656. [Google Scholar] [CrossRef] [PubMed]
  28. Gong, C.; Fujino, K.; Monteiro, L.J.; Gomes, A.R.; Drost, R.; Davidson-Smith, H.; Takeda, S.; Khoo, U.S.; Jonkers, J.; Sproul, D.; et al. FOXA1 repression is associated with loss of BRCA1 and increased promoter methylation and chromatin silencing in breast cancer. Oncogene 2015, 34, 5012–5024. [Google Scholar] [CrossRef]
  29. Wu, P.E.; Shen, C.Y. ‘Hide-then-hit’ to explain the importance of genotypic polymorphism of DNA repair genes in determining susceptibility to cancer. J. Mol. Cell Biol. 2011, 3, 59–65. [Google Scholar] [CrossRef]
  30. Saponaro, C.; Vagheggini, A.; Scarpi, E.; Centonze, M.; Catacchio, I.; Popescu, O.; Pastena, M.I.; Giotta, F.; Silvestris, N.; Mangia, A. NHERF1 and tumor microenvironment: A new scene in invasive breast carcinoma. J. Exp. Clin. Cancer Res. 2018, 37, 96. [Google Scholar] [CrossRef] [PubMed]
  31. Mangia, A.; Scarpi, E.; Partipilo, G.; Schirosi, L.; Opinto, G.; Giotta, F.; Simone, G. NHERF1 together with PARP1 and BRCA1 expression as a new potential biomarker to stratify breast cancer patients. Oncotarget 2017, 8, 65730–65742. [Google Scholar] [CrossRef] [PubMed] [Green Version]
  32. Dieci, M.V.; Tsvetkova, V.; Orvieto, E.; Piacentini, F.; Ficarra, G.; Griguolo, G.; Miglietta, F.; Giarratano, T.; Omarini, C.; Bonaguro, S.; et al. Immune characterization of breast cancer metastases: Prognostic implications. Breast Cancer Res. 2018, 20, 62. [Google Scholar] [CrossRef] [PubMed]
  33. Yu, X.; Zhang, Z.; Wang, Z.; Wu, P.; Qiu, F.; Huang, J. Prognostic and predictive value of tumor-infiltrating lymphocytes in breast cancer: A systematic review and meta-analysis. Clin. Transl. Oncol. 2016, 18, 497–506. [Google Scholar] [CrossRef] [PubMed]
  34. Mao, Y.; Qu, Q.; Chen, X.; Huang, O.; Wu, J.; Shen, K. The Prognostic Value of Tumor-Infiltrating Lymphocytes in Breast Cancer: A Systematic Review and Meta-Analysis. PLoS ONE 2016, 11, e0152500. [Google Scholar] [CrossRef] [PubMed]
  35. Shou, J.; Lai, Y.; Xu, J.; Huang, J. Prognostic value of FOXA1 in breast cancer: A systematic review and meta-analysis. Breast 2016, 27, 35–43. [Google Scholar] [CrossRef] [PubMed]
  36. McGhan, L.J.; McCullough, A.E.; Protheroe, C.A.; Dueck, A.C.; Lee, J.J.; Nunez-Nateras, R.; Castle, E.P.; Gray, R.J.; Wasif, N.; Goetz, M.P.; et al. Androgen receptor-positive triple negative breast cancer: A unique breast cancer subtype. Ann. Surg. Oncol. 2014, 21, 361–367. [Google Scholar] [CrossRef] [PubMed]
  37. Wang, C.; Pan, B.; Zhu, H.; Zhou, Y.; Mao, F.; Lin, Y.; Xu, Q.; Sun, Q. Prognostic value of androgen receptor in triple negative breast cancer: A meta-analysis. Oncotarget 2016, 7, 46482–46491. [Google Scholar] [CrossRef] [PubMed] [Green Version]
  38. Choi, J.E.; Kang, S.H.; Lee, S.J.; Bae, Y.K. Androgen receptor expression predicts decreased survival in early stage triple-negative breast cancer. Ann. Surg. Oncol. 2015, 22, 82–89. [Google Scholar] [CrossRef] [PubMed]
  39. Asano, Y.; Kashiwagi, S.; Goto, W.; Tanaka, S.; Morisaki, T.; Takashima, T.; Noda, S.; Onoda, N.; Ohsawa, M.; Hirakawa, K.; et al. Expression and clinical significance of androgen receptor in triple negative breast cancer. Cancers (Basel) 2017, 9, 4. [Google Scholar] [CrossRef] [PubMed]
  40. Kim, Y.; Jae, E.; Yoon, M. Influence of Androgen Receptor Expression on the Survival Outcomes in Breast Cancer: A Meta-Analysis. J. Breast Cancer 2015, 18, 134–142. [Google Scholar] [CrossRef] [Green Version]
  41. Vera-Badillo, F.E.; Templeton, A.J.; de Gouveia, P.; Diaz-Padilla, I.; Bedard, P.L.; Al-Mubarak, M.; Seruga, B.; Tannock, I.F.; Ocana, A.; Amir, E. Androgen receptor expression and outcomes in early breast cancer: A systematic review and meta-analysis. J. Natl. Cancer Inst. 2014, 106, djt319. [Google Scholar] [CrossRef] [PubMed]
  42. McNamara, K.M.; Yoda, T.; Miki, Y.; Chanplakorn, N.; Wongwaisayawan, S.; Incharoen, P.; Kongdan, Y.; Wang, L.; Takagi, K.; Mayu, T.; et al. Androgenic pathway in triple negative invasive ductal tumors: Its correlation with tumor cell proliferation. Cancer Sci. 2013, 104, 639–646. [Google Scholar] [CrossRef] [PubMed] [Green Version]
  43. Paradiso, A.; Scarpi, E.; Malfettone, A.; Addati, T.; Giotta, F.; Simone, G.; Amadori, D.; Mangia, A. Nuclear NHERF1 expression as a prognostic marker in breast cancer. Cell Death Dis. 2013, 4, e904. [Google Scholar] [CrossRef] [PubMed]
  44. Gu, Y.; Yu, H.; Hao, C.; Martin, T.A.; Hargest, R.; He, J.; Cheng, S.; Jiang, W.G. NHERF1 regulates the progression of colorectal cancer through the interplay with VEGFR2 pathway. Oncotarget 2017, 8, 7753–7765. [Google Scholar] [CrossRef] [PubMed]
  45. Saponaro, C.; Scarpi, E.; Zito, F.A.; Giotta, F.; Silvestris, N.; Mangia, A. Independent Negative Prognostic Role of TCF1 Expression within the Wnt/β-Catenin Signaling Pathway in Primary Breast Cancer Patients. Cancers (Basel) 2019, 11, 1035. [Google Scholar] [CrossRef] [PubMed]
  46. Massink, M.P.; Kooi, I.E.; van Mil, S.E.; Jordanova, E.S.; Ameziane, N.; Dorsman, J.C.; van Beek, D.M.; van der Voorn, J.P.; Sie, D.; Ylstra, B.; et al. Proper genomic profiling of (BRCA1-mutated) basal-like breast carcinomas requires prior removal of tumor infiltrating lymphocytes. Mol. Oncol. 2015, 9, 877–888. [Google Scholar] [CrossRef] [PubMed]
  47. Mathot, L.; Stenninger, J. Behavior of seeds and soil in the mechanism of metastasis: A deeper understanding. Cancer Sci. 2012, 103, 626–631. [Google Scholar] [CrossRef]
  48. Adams, S.; Loi, S.; Toppmeyer, D.; Cescon, D.W.; De Laurentiis, M.; Nanda, R.; Winer, E.P.; Mukai, H.; Tamura, K.; Armstrong, A.; et al. Phase 2 study of pembrolizumab as first-line therapy for PD-L1–positive metastatic triple-negative breast cancer (mTNBC): Preliminary data from KEYNOTE-086 cohort B. J. Clin. Oncol. 2017, 35, 1088. [Google Scholar] [CrossRef]
  49. Polk, A.; Svane, I.M.; Andersson, M.; Nielsen, D. Checkpoint inhibitors in breast cancer current status. Cancer Treat. Rev. 2018, 63, 122–134. [Google Scholar] [CrossRef]
  50. Mori, H.; Kubo, M.; Yamaguchi, R.; Nishimura, R.; Osako, T.; Arima, N.; Okumura, Y.; Okido, M.; Yamada, M.; et al. The combination of PD-L1 expression and decreased tumor-infiltrating lymphocytes is associated with a poor prognosis in triple-negative breast cancer. Oncotarget 2017, 8, 15584–15592. [Google Scholar] [CrossRef]
  51. Birner, P.; Oberhuber, G.; Stani, J.; Reithofer, C.; Samonigg, H.; Hausmaninger, H.; Kubista, E.; Kwasny, W.; Kandioler-Eckersberger, D.; Gnant, M.; et al. Evaluation of the United States Food and Drug Administration-approved scoring and test system of HER-2 protein expression in breast cancer. Clin. Cancer Res. 2001, 7, 1669–1675. [Google Scholar] [PubMed]
  52. Wolff, A.C.; Hammond, M.E.; Schwartz, J.N.; Hagerty, K.L.; Allred, D.C.; Cote, R.J.; Dowsett, M.; Fitzgibbons, P.L.; Hanna, W.M.; Langer, A.; et al. American Society of Clinical Oncology/College of American Pathologists guideline recommendations for human epidermal growth factor receptor 2 testing in breast cancer. J. Clin. Oncol. 2007, 25, 118–145. [Google Scholar] [CrossRef] [PubMed]
  53. Salgado, R.; Denkert, C.; Demaria, S.; Sirtaine, N.; Klauschen, F.; Pruneri, G.; Wienert, S.; Van den Eynden, G.; Baehner, F.L.; Penault-Llorca, F.; et al. The evaluation of tumor-infiltrating lymphocytes (TILs) in breast cancer: Recommendations by an International TILs Working Group 2014. Ann. Oncol. 2015, 26, 259–271. [Google Scholar] [CrossRef] [PubMed]
  54. Thorat, M.A.; Marchio, C.; Morimiya, A.; Savage, K.; Nakshatri, H.; Reis-Filho, J.S.; Badve, S. Forkhead box A1 expression in breast cancer is associated with luminal subtype and good prognosis. J. Clin. Pathol. 2008, 61, 327–332. [Google Scholar] [CrossRef] [PubMed]
  55. Lin, G.; Fan, X.; Zhu, W.; Huang, C.; Zhuang, W.; Xu, H.; Lin, X.; Hu, D.; Huang, Y.; Jiang, K.; et al. Prognostic significance of PD-L1 expression and tumor infiltrating lymphocyte in surgically resectable non-small cell lung cancer. Oncotarget 2017, 8, 83986–83994. [Google Scholar] [CrossRef]
  56. Mazzotta, A.; Partipilo, G.; De Summa, S.; Giotta, F.; Simone, G.; Mangia, A. Nuclear PARP1 expression and its prognostic significance in breast cancer patients. Tumour Biol. 2016, 37, 6143–6153. [Google Scholar] [CrossRef]
  57. Team, R.C. R: A Language and Environment for Statistical Computing; R Foundation for Statistical Computing: Vienna, Austria, 2017; Available online: https://www.R-project.org (accessed on 5 January 2017).
Figure 1. Scheme of androgen receptor (AR) transcriptional activity. (A) The scheme shows AR and its main interactors. A high confidence protein–protein interaction network is generated with STRING software. The network nodes are input proteins. The edges represent the predicted associations. (B) The interaction AR–Forkhead box A1 (FOXA1) is represented: FOXA1 should direct AR to sites usually occupied by ER, leading to an increase of proliferation estrogen-like.
Cancers 11 01393 g001
Figure 2. Immunohistochemical expression. (A) Androgen receptor (AR) I) negative and II) positive immunohistochemical protein staining and the corresponding III) negative and IV) positive mRNA xpression detected by an RNA Scope. Scale bars = 20 μm. (B) Representative images of immunohistochemical staining for Forkhead box A1 (FOXA1), programmed cell death ligand-1 (PD-L1), breast cancer type 1 susceptibility protein (BRCA1), poly (ADP-Ribose) polymerase 1 (PARP1), and Na+/H+ exchanger regulatory factor 1 (NHERF1) proteins. I) Negative and II) positive nuclear FOXA1 expression. III) Negative and IV) positive PD-L1 expression, the positivity has been considered for tumor cells showing partial or complete membrane staining at any intensity (Arrows). V) Negative and VI) positive high nuclear BRCA1 expression. VII) Negative and VIII) positive nuclear PARP1 expression (Arrows). IX) Negative and X) positive high membranous and cytoplasmic NHERF1 expression (Arrows). Scale bars = 50 μm. (C) Representative tissue samples with I) low tumor-infiltrating lymphocytes (TILs) and II) high TILs density. TILs were performed in full-face hematoxylin and eosin-stained sections. Scale bars = 50 μm. Images were obtained on an Axion Image 2 upright microscope (Zeiss, Oberkochen, Germany) with an Axiocam 512 color camera.
Cancers 11 01393 g002
Figure 3. Protein interaction. Heatmap of the protein–protein interaction. AR: Androgen receptor; FOXA1: Forkhead box A1; PD-L1: Programmed cell death ligand-1; BRCA1: Breast cancer susceptibility protein 1; PARP1: Poly (ADP-Ribose) polymerase 1; TILs: tumor-infiltrating lymphocytes; mNHERF1: Membranous Na+/H+ exchanger regulatory factor 1; cNHERF1: cytoplasmic NHERF1; nNHERF1: Nuclear NHERF1.
Cancers 11 01393 g003
Figure 4. Survival analyses. (A) Disease-free-survival (DFS) curves for patients with tumor-infiltrating lymphocytes positive (TILs+; reverse Kaplan–Meier method median follow up: 108, 95% confidence interval (CI) (85–140); events: 10/47) versus TILs- (median follow up: 104, 95% CI (86–142); events: 26/70) presence (p = 0.037). (B) DFS curves for patients with simultaneously TILs–/androgen receptor (AR)– (median follow up: 104, 95% CI (77–151); events: 15/47), TILs–/AR+ (median follow up: 142, 95% CI (61-not available (NA); events: 6/11), TILs+/AR− (median follow up: 118, 95% CI (89–143), events: 8/40), TILs+/AR+ (median follow up: 84, 95% CI (77–NA); events: 0/5) expression: The four Kaplan–Meier curves resulted significantly different (p = 0.032). (C) DFS curves for patients with simultaneously TILs−/forkhead box A1 (FOXA1)– (median follow up: 110, 95% CI (68–164); events: 18/36), TILs−/FOXA1+ (median follow up: 92, 95% CI (62–147); events: 4/26), TILs+/FOXA1− (median follow up: 117, 95% CI (89–143); events: 6/36) and TILs+/FOXA1+ (median follow up: 110, 95% CI (60–NA); events: 3/10) expression: The four Kaplan–Meier curves resulted significantly different (p = 0.001).
Cancers 11 01393 g004
Table 1. Non-linear relationship between two continuous variables assessed by the Kendall rank test.
ARFOXA1PD-L1BRCA1PARP1TILScNHERF1nNHERF1
τp-valueτp-valueτp-valueτp-valueτp-valueτp-valueτp-valueτp-value
FOXA10.354<0.001
PD-L1−0.0220.803−0.1100.173
BRCA1−0.0680.425−0.0380.623−0.1640.054
PARP10.1260.1430.0800.307−0.0460.5950.2480.001
TILS−0.1160.145−0.1240.0850.2590.001−0.1720.020−0.0030.966
cNHERF10.2410.0020.1290.0730.1380.079−0.0600.418−0.0510.4960.1990.004
nNHERF1−0.0710.4290.0980.2290.0640.4620.1340.1060.297<0.001−0.0400.602−0.0570.455
mNHERF10.0370.6680.0110.888−0.0290.732−0.0040.959−0.2420.0030.1680.0240.2210.002−0.1110.177
AR: Androgen receptor; FOXA1: Forkhead box A1; PD-L1: Programmed cell death ligand-1; BRCA1: Breast cancer susceptibility protein 1; PARP1: Poly (ADP-Ribose) polymerase 1; TILs: Tumor-infiltrating lymphocytes; mNHERF1: Membranous Na+/H+ exchanger regulatory factor 1; cNHERF1: Cytoplasmic NHERF1; nNHERF1: Nuclear NHERF1.
Table 2. Univariate analysis on categorical data.
Characteristicspts.DFSOS
Events5-year DFS
(95% CI) a
HR
(95% CI) b
p-Value cEvents5-year OS
(95% CI) a
p-Value c
Overall1243680 (73–88) 1292 (87–97)
Age
≤51652279 (70–90)1.000.432593 (87–100)0.460
>51591481 (71−92)0.765 (0.39–1.50)789 (82-98)
Pre/post
Post732581 (73–90)1.000.810794 (88–99)0.391
Pre411179 (66–93)1.09 (0.53–2.23)587 (77–98)
Size
≤2 cm591587 (78–96)1.000.552493 (86–100)0.431
>2 cm642174 (64–86)1.22 (0.63–2.38)890 (83–98)
Histological type
IDC1113381 (74–89)-0.947993 (89–98)0.027
ILC4175 (43–100)-0100 (100–100)
Other9274 (48–100)-367 (42–100)
Lymph node status
Negative651683 (74–93)1.000.578690 (83-98)0.894
Positive551779 (69–91)1.21 (0.61−2.40)692 (85–100)
Ki67
Negative (≤20%)12482 (62–100)1.000.8431100 (100–100)0.945
Positive (>20%)1103081 (73–89)0.90 (0.32–2.56)1190 (85–96)
AR
Negative (<10%)922383 (75–91)1.000.219793 (88–99)0.111
Positive (≥10%)16681 (64–100)1.75 (0.70–4.33)387 (71−100)
FOXA1
Negative762479 (71−89)1.000.281890 (84–97)0.990
Positive37788 (77–100)0.63 (0.27–1.47)491 (82–100)
PD-L1
Negative (<1%)832483 (75–92)1.000.460794 (88–99)0.432
Positive (≥1%)22779 (66–96)0.73 (0.31−1.69)486 (75–100)
BRCA1
Negative (<3%)461184 (74–96)1.000.2731100 (100–100)0.030
Positive (≥3%)601882 (72–93)1.52 (0.72–3.23)888 (80–97)
PARP1
Negative (0–9)872483 (75–91)1.000.523695 (91−100)0.032
Positive (10–18)20685 (71−100)1.34 (0.55–3.28)480 (63–100)
TILs
Negative (<50%)702675 (65–87)1.000.0371088 (80–96)0.019
Positive (≥50%)471084 (75–96)0.47 (0.23–0.971)198 (94–100)
mNHERF1
Negative (0%)761981 (73–91)1.000.478889 (82–96)0.435
Positive (>0%)421478 (66–92)1.28 (0.64–2.57)395 (88–100)
cNHERF1
Negative (70%)571481 (71−93)1.000.645787 (78–96)0.202
Positive (≥70%)611979 (69–90)1.18 (0.59–2.35)495 (89–100)
nNHERF1
Negative (0%)981778 (70–87)1.000.276893 (87–98)0.321
Positive (>0%)20389 (76–100)0.52 (0.16–1.71)383 (68–100)
a confidence interval (CI), five-year disease-free survival (DFS) or overall survival (OS) based on the Kaplan–Meier method, b hazard-ratio (HR) computed using the Cox proportional hazard regression model for the DFS (for OS cannot be computed due to the low number of events), c p-value of the log-rank test for the equality of probability of an event (relapse for DFS or death for OS). ); IDC: Invasive ductal carcinoma; ILC: Invasive lobular carcinoma; AR: Androgen receptor; FOXA1: Forkhead box A1; PD-L1: Programmed cell death ligand-1; BRCA1: Breast cancer susceptibility protein 1; PARP1: Poly (ADP-Ribose) polymerase 1; TILs: tumor-infiltrating lymphocytes; mNHERF1: Membranous Na+/H+ exchanger regulatory factor 1; cNHERF1: Cytoplasmic NHERF1; nNHERF1: Nuclear NHERF1.
Table 3. DFS multivariate analysis on categorical and continuous variables.
CharacteristicsCategoricalContinuous
HR
(95% CI) a
p-Value aHR
(95% CI)
p-Value a
AR1.65 (0.54–5.02)0.3821.00 (0.99–1.03)0.509
FOXA10.38 (0.12–1.20)0.1000.64 (0.16–2.48)0.517
PD-L10.49 (0.13–1.76)0.2721.00 (0.96–1.04)0.863
BRCA11.47 (0.53–4.11)0.4591.00 (0.99–1.02)0.386
PARP1 1.40 (0.46–4.32)0.5541.00 (0.99–1.02)0.583
TILS0.34 (0.12–0.98)0.0450.19 (0.02–1.51)0.116
mNHERF12.28 (0.89–5.82)0.0851.01 (1.00–1.02)0.104
cNHERF10.92 (0.37–2.32)0.8671.00 (0.99–1.02)0.805
nNHERF10.62 (0.13–3.00)0.5480.88 (0.70–1.10)0.263
a hazard-ratio (HR), confidence interval (CI) and p-value for five-year disease-free survival (DFS) computed using the multivariate Cox proportional hazard regression model with categorical and continuous variables. AR: Androgen receptor; FOXA1: Forkhead box A1; PD-L1: Programmed cell death ligand-1; BRCA1: Breast cancer susceptibility protein 1; PARP1: Poly (ADP-Ribose) polymerase 1;TILs: tumor-infiltrating lymphocytes; mNHERF1: Membranous Na+/H+ exchanger regulatory factor 1; cNHERF1: Cytoplasmic NHERF1; nNHERF1: Nuclear NHERF1.
Table 4. Clinicopathological characteristics of 124 triple negative breast cancer (TNBC) patients.
Characteristicsn(%)
Patients Age: median value 51 (range 26–80)
≤51 years65(52.4)
>51 years59(47.6)
Menopausal status
Pre83(66.9)
Post41(33.1)
Histological type
IDC111(89.5)
ILC4(3.2)
Other9(7.3)
Histological grade
G11(0.8)
G223(18.7)
G399(80.5)
Unknown1
Tumor size (cm)
≤2 cm59(48.0)
>2 cm64(52.0)
Unknown1
Lymph node status
Negative65(54.2)
Positive55(45.8)
Unknown 4
Ki67
Negative (≤20%)12(9.8)
Positive (>20%)110(90.2)
Unknown2
TILs
Negative (<50%)70(59.8)
Positive (≥50%)47(40.2)
Unknown7
IDC: Invasive ductal carcinoma; ILC: Invasive lobular carcinoma; TILs: Tumor-infiltrating lymphocytes.

