Monitoring Radiotherapeutic Response in Prostate Cancer Patients Using High Throughput FTIR Spectroscopy of Liquid Biopsies

 , ,
, ,  ,
,  and
and 
Abstract
1. Introduction
2. Results
2.1. Monitoring Treatment Progression
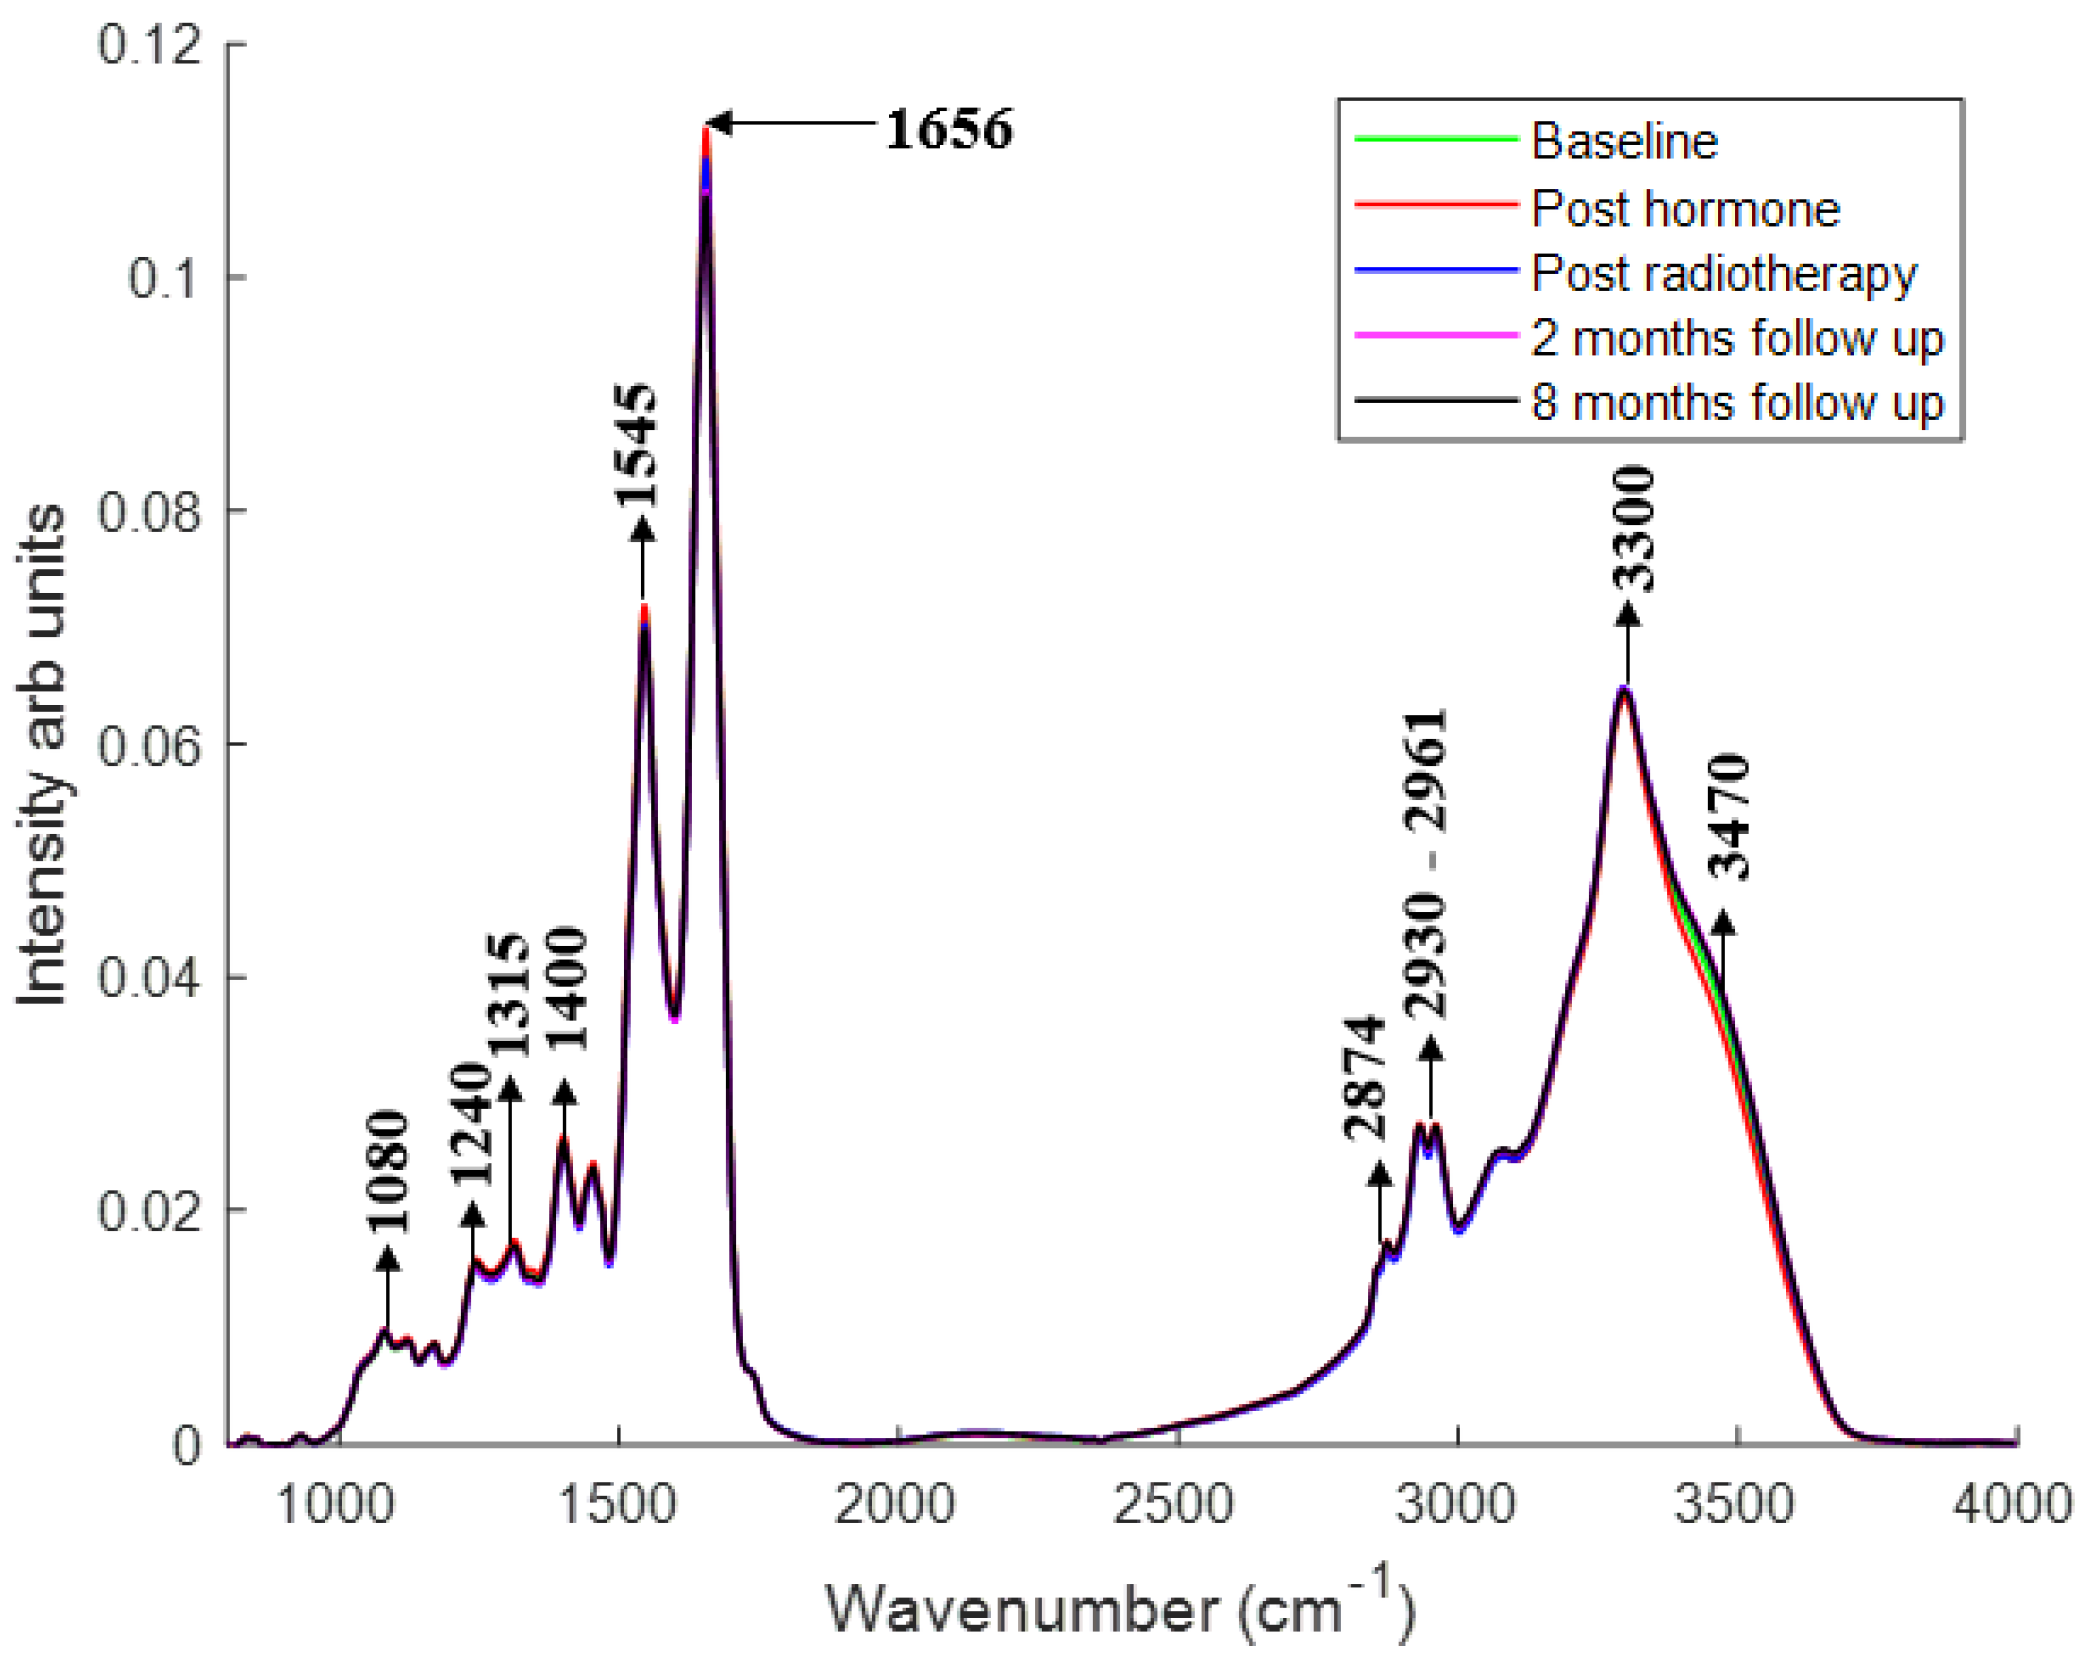
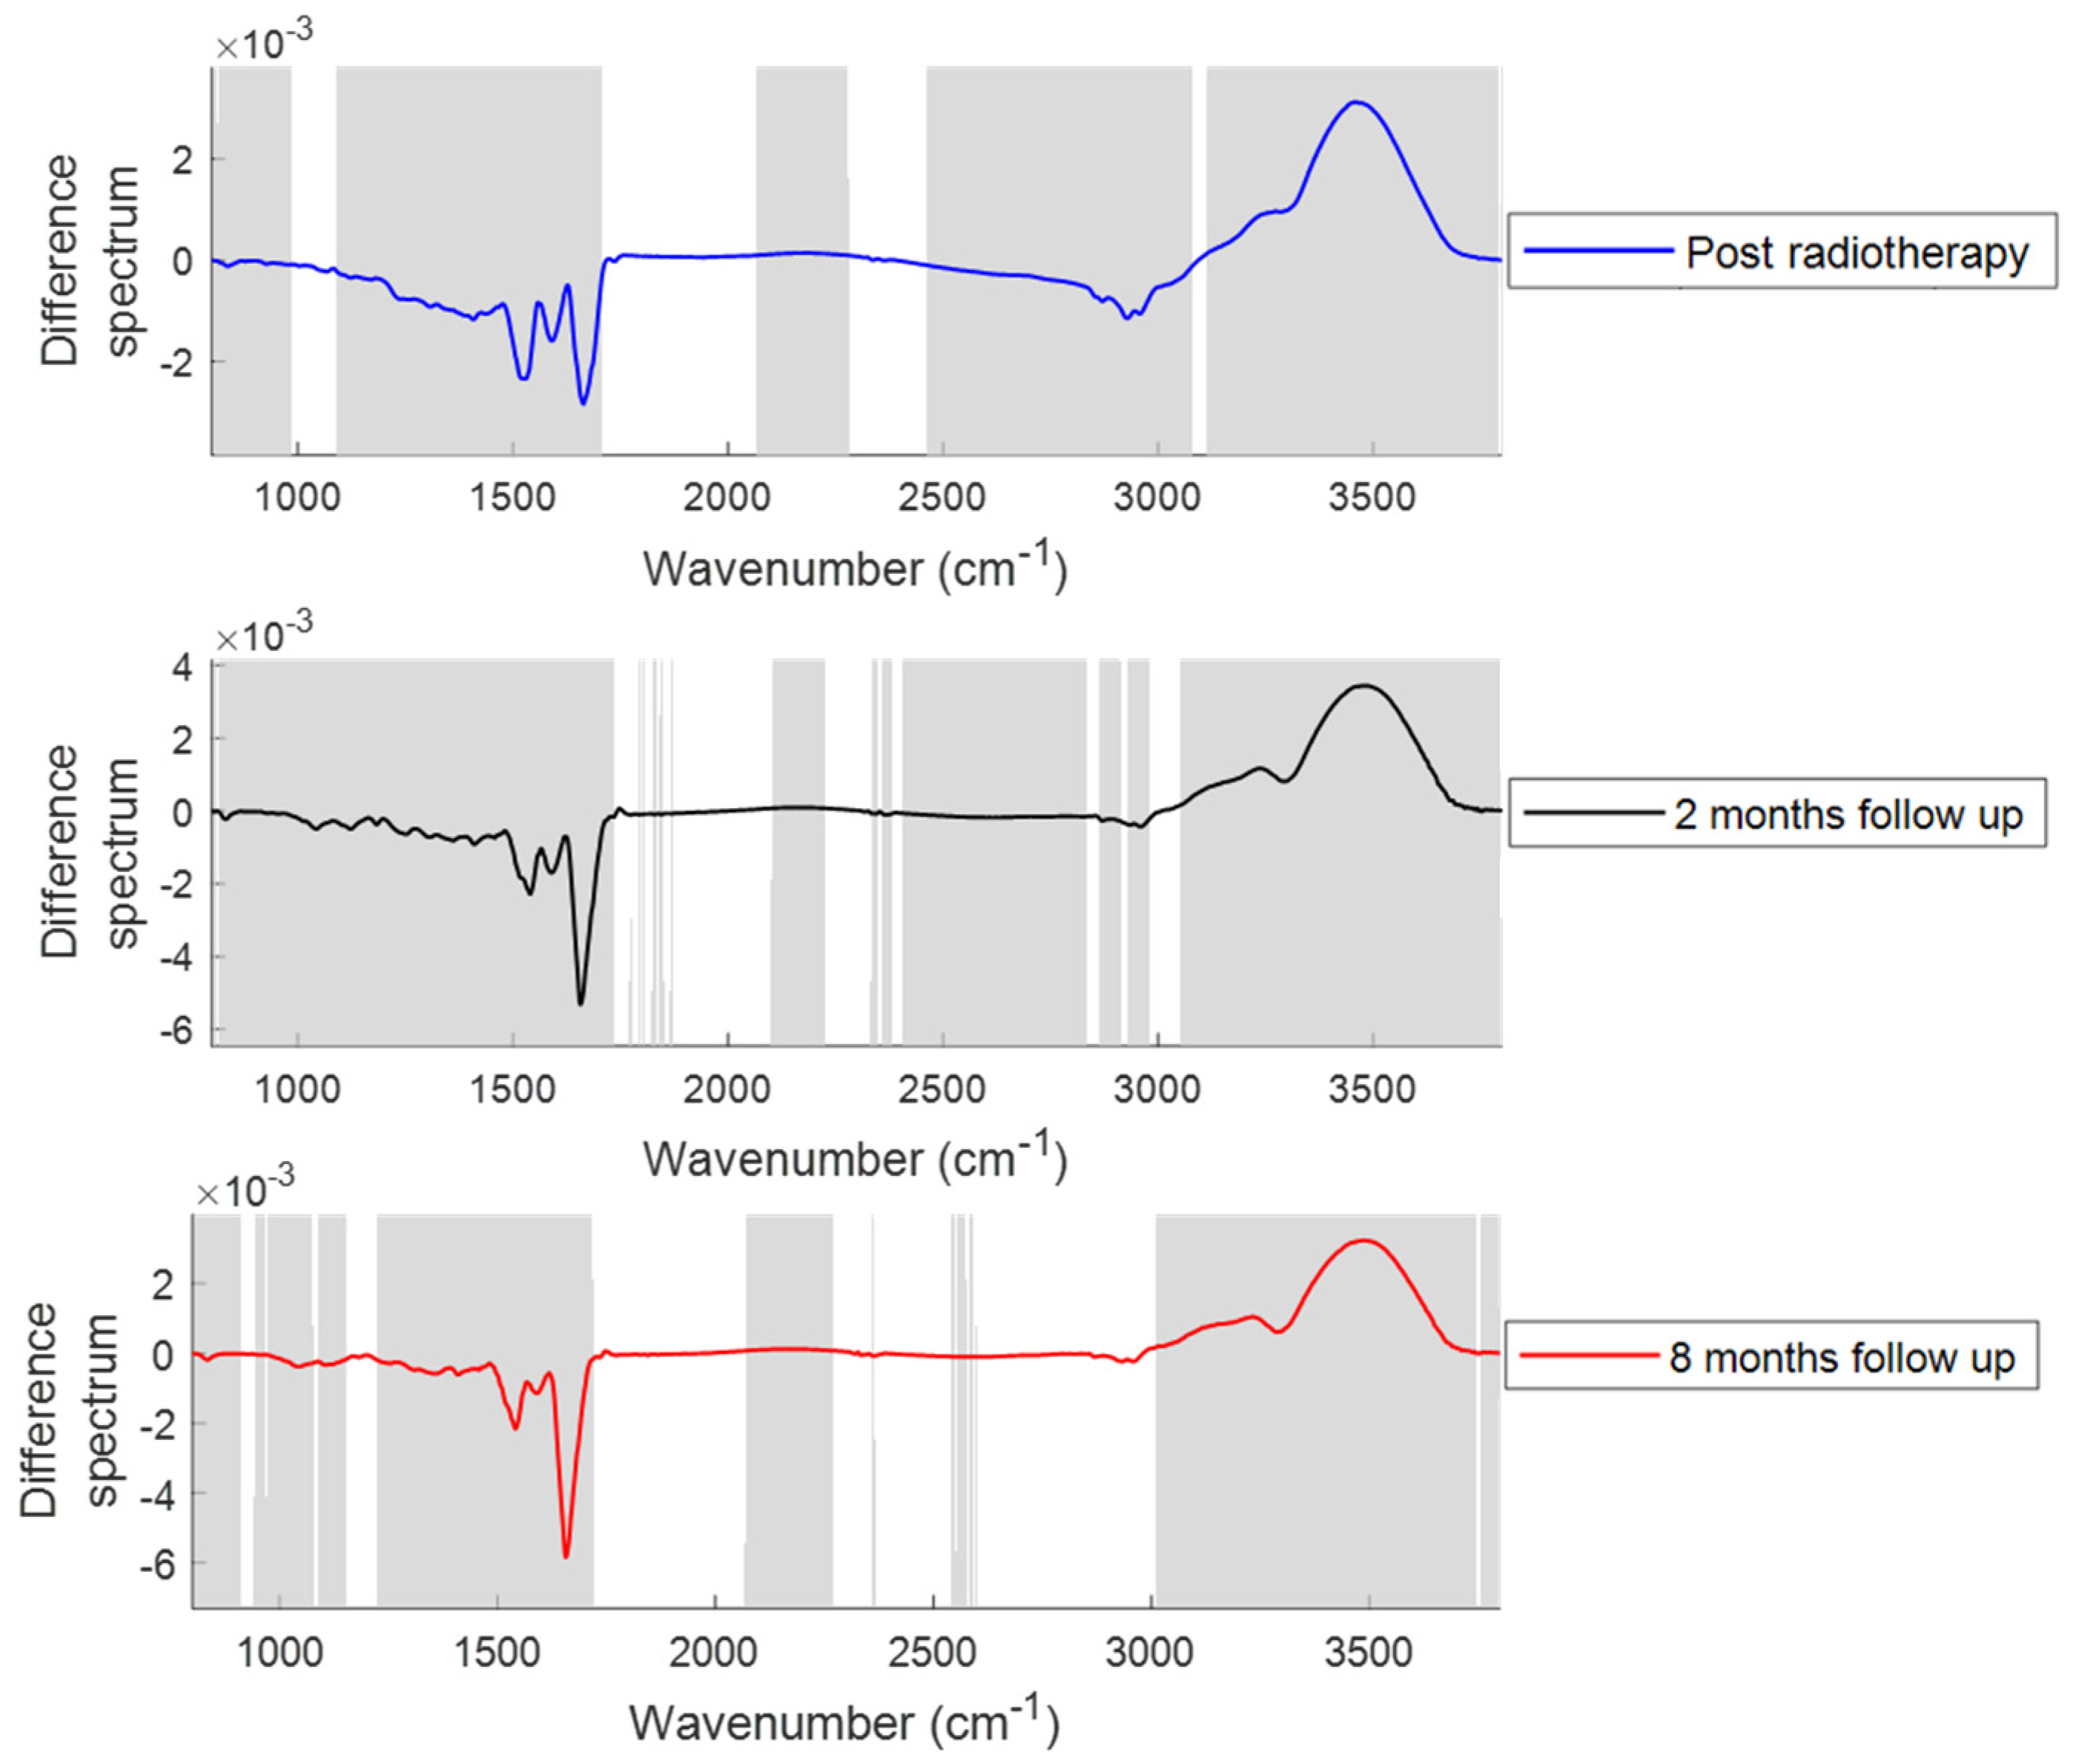
2.1.1. Changes in the Spectral Features with Patient Treatment Progression
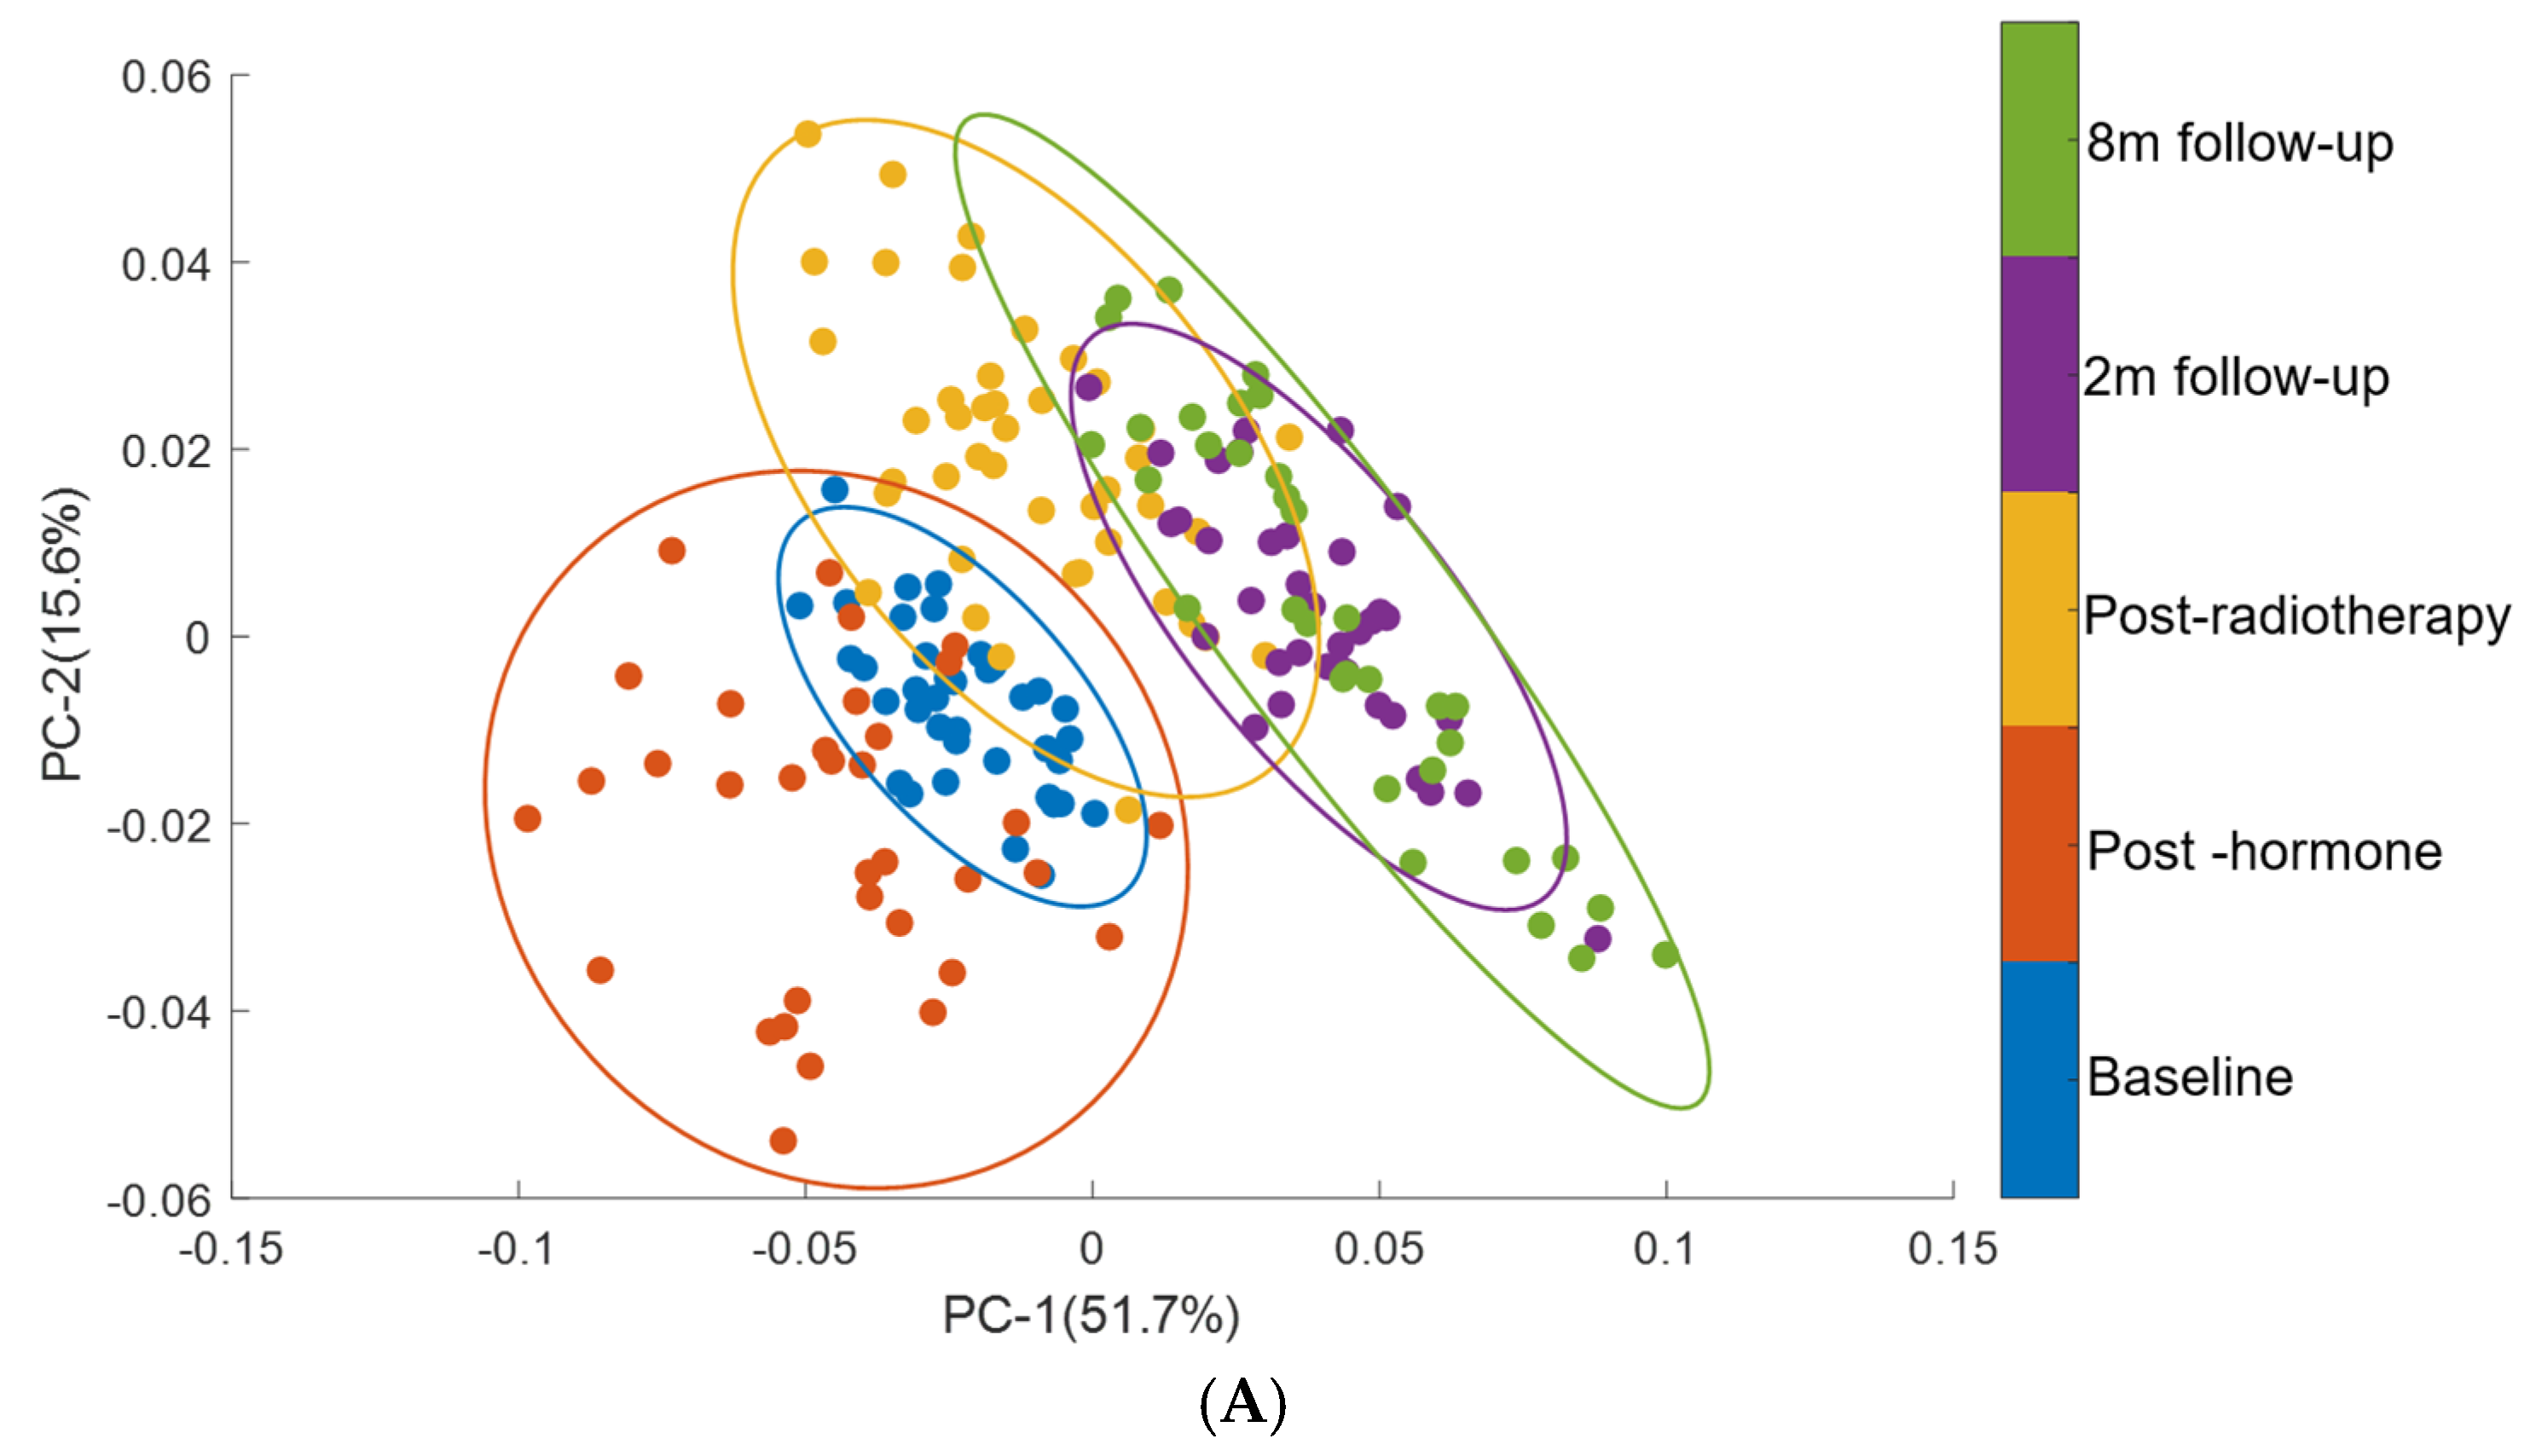
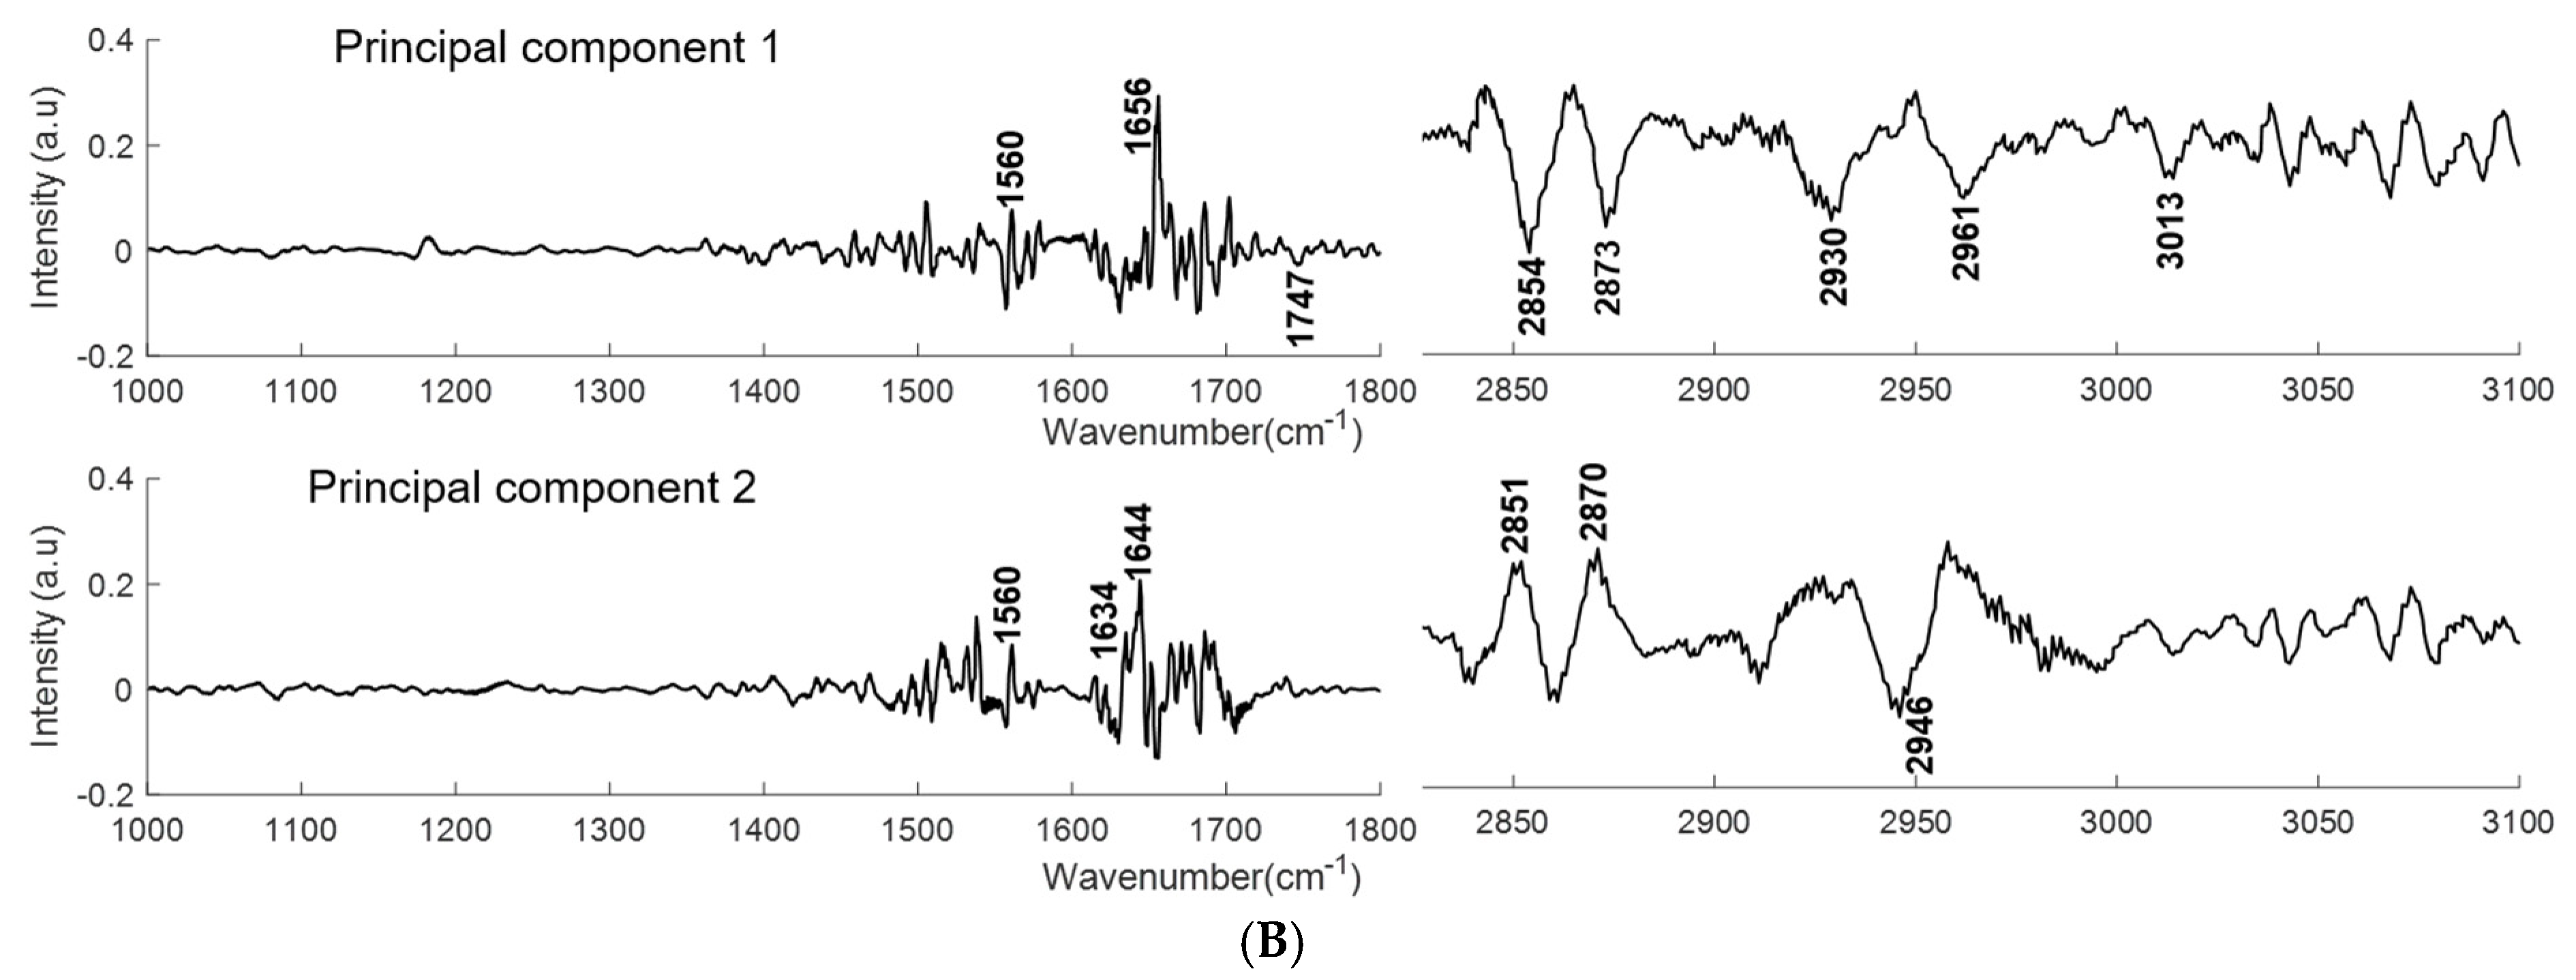
2.1.2. PCA
2.1.3. Classification of Plasma Spectra of Patients during Treatment with Respect to Baseline by PLS-DA
2.2. Analysis of Patient Toxicity after Radiotherapy
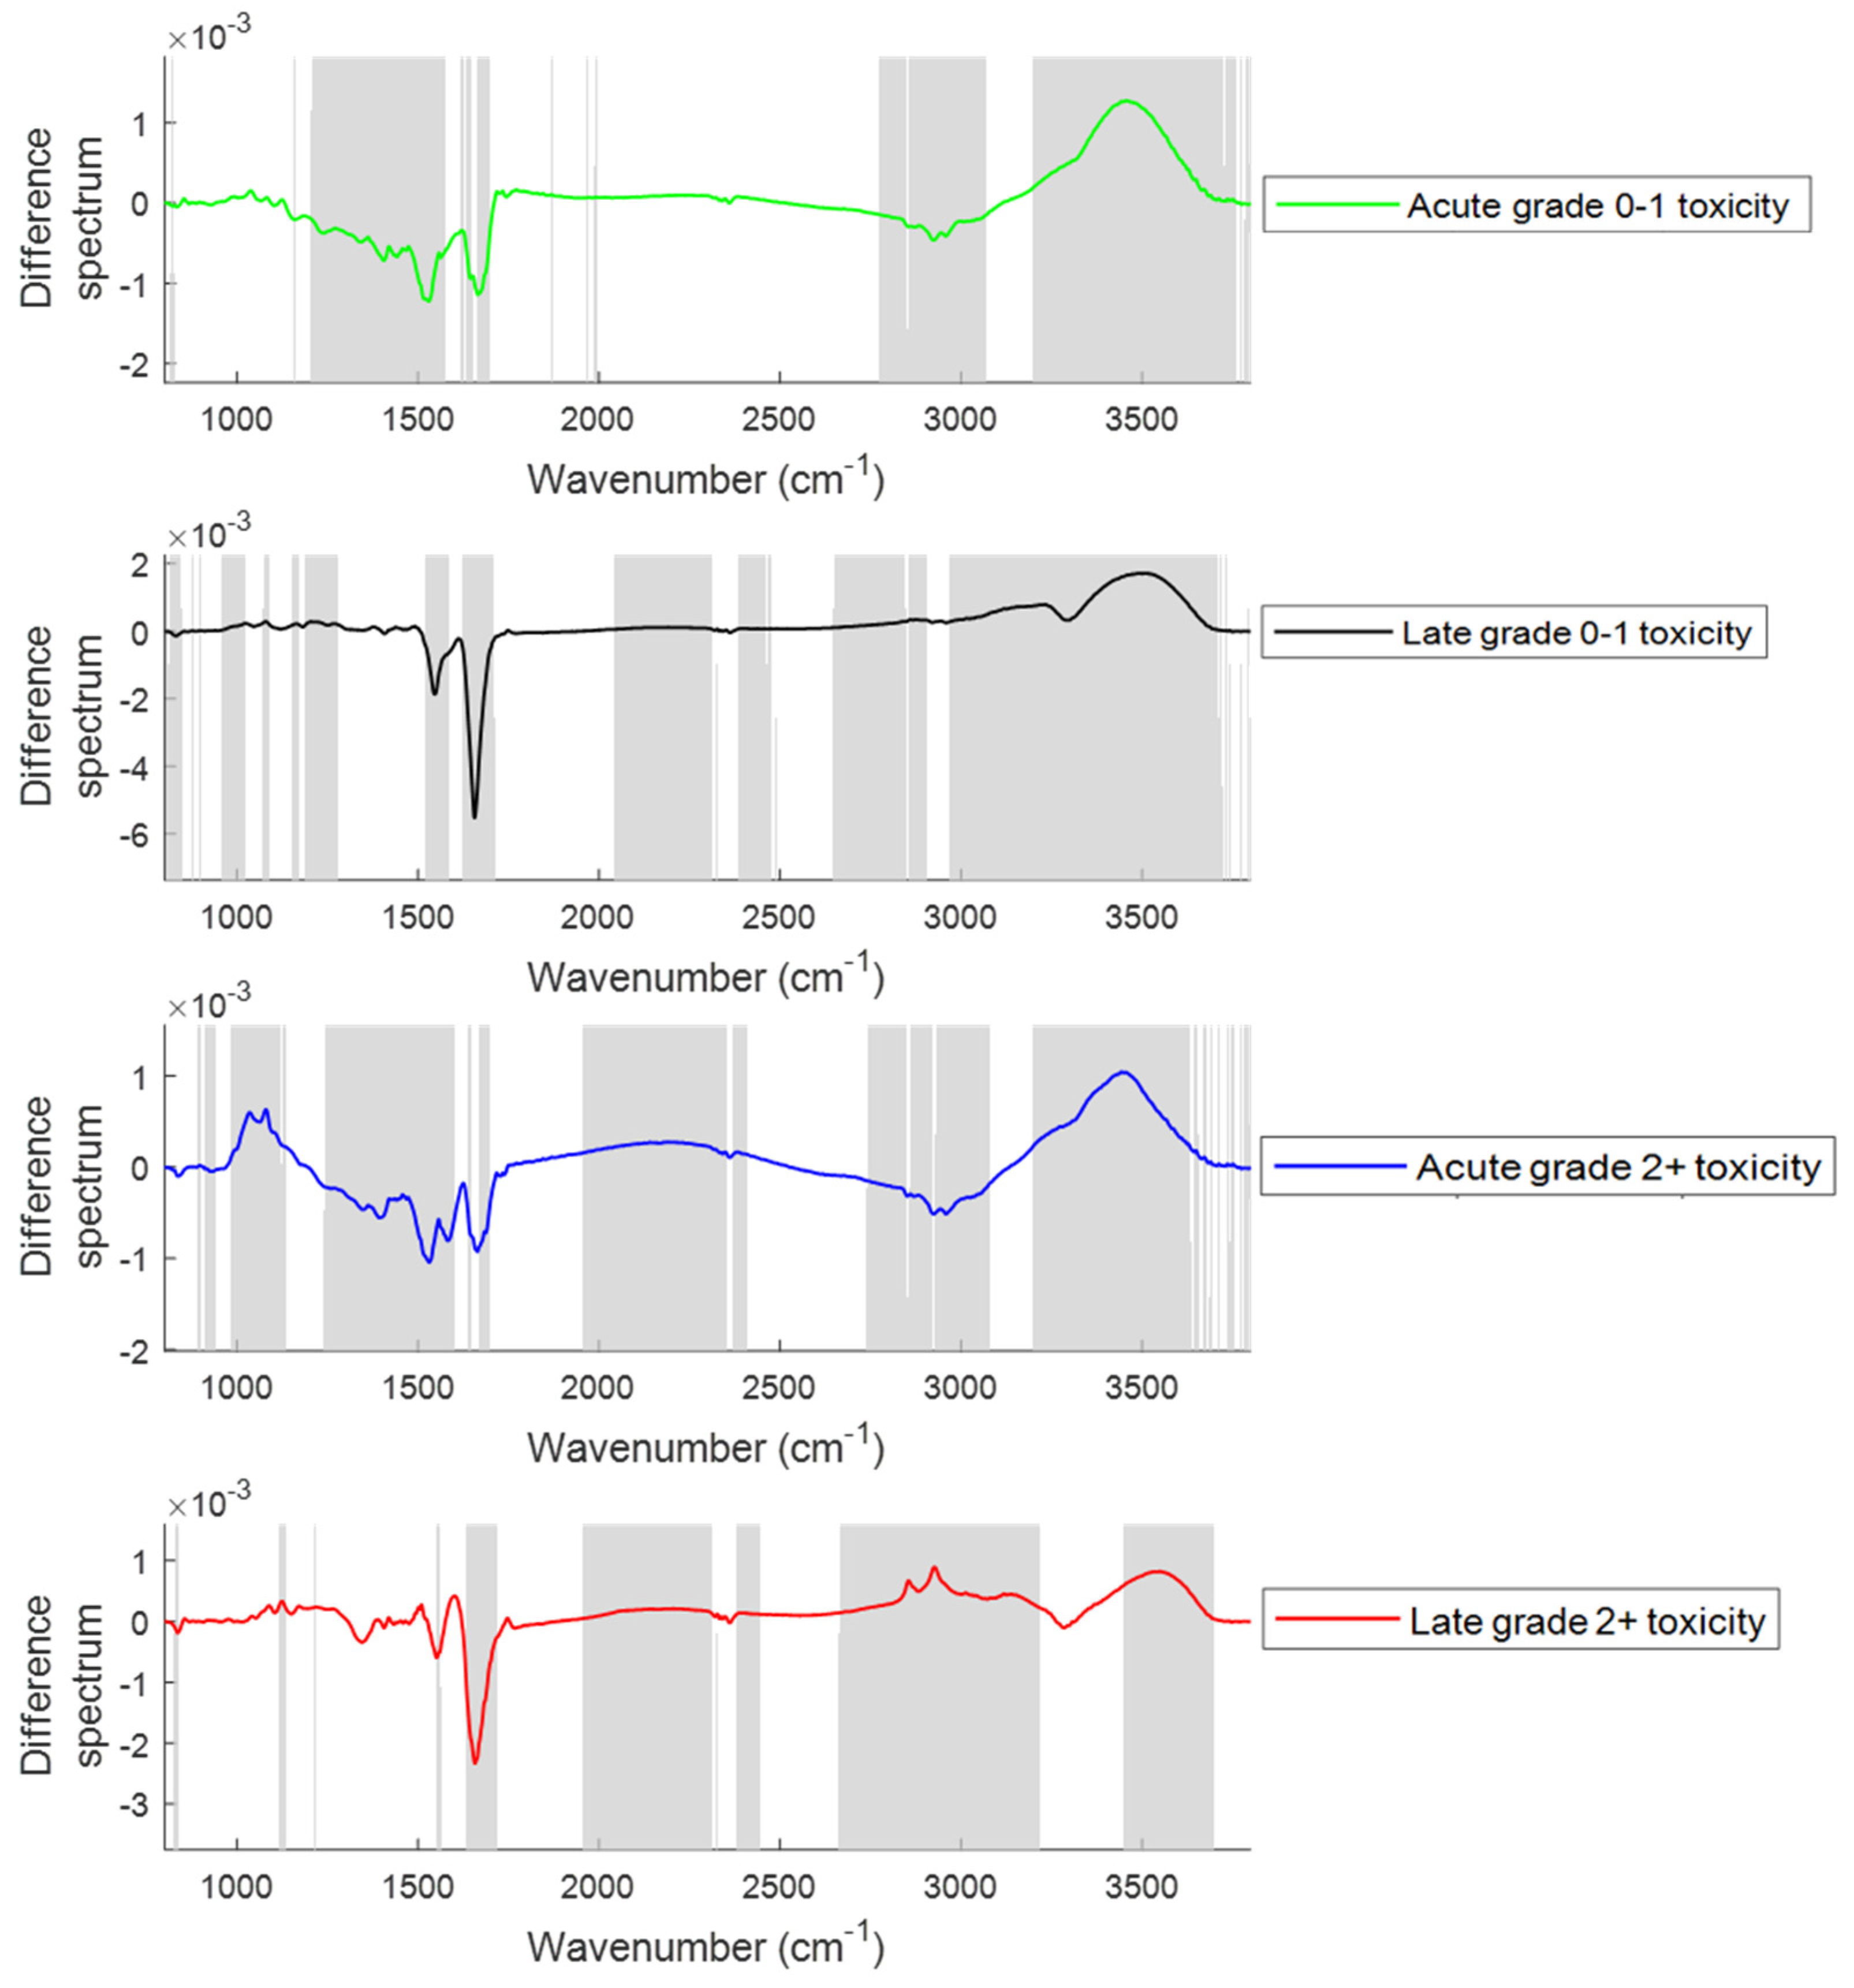
2.2.1. Changes in the Spectral Features with the Onset of Acute and Late Toxicity
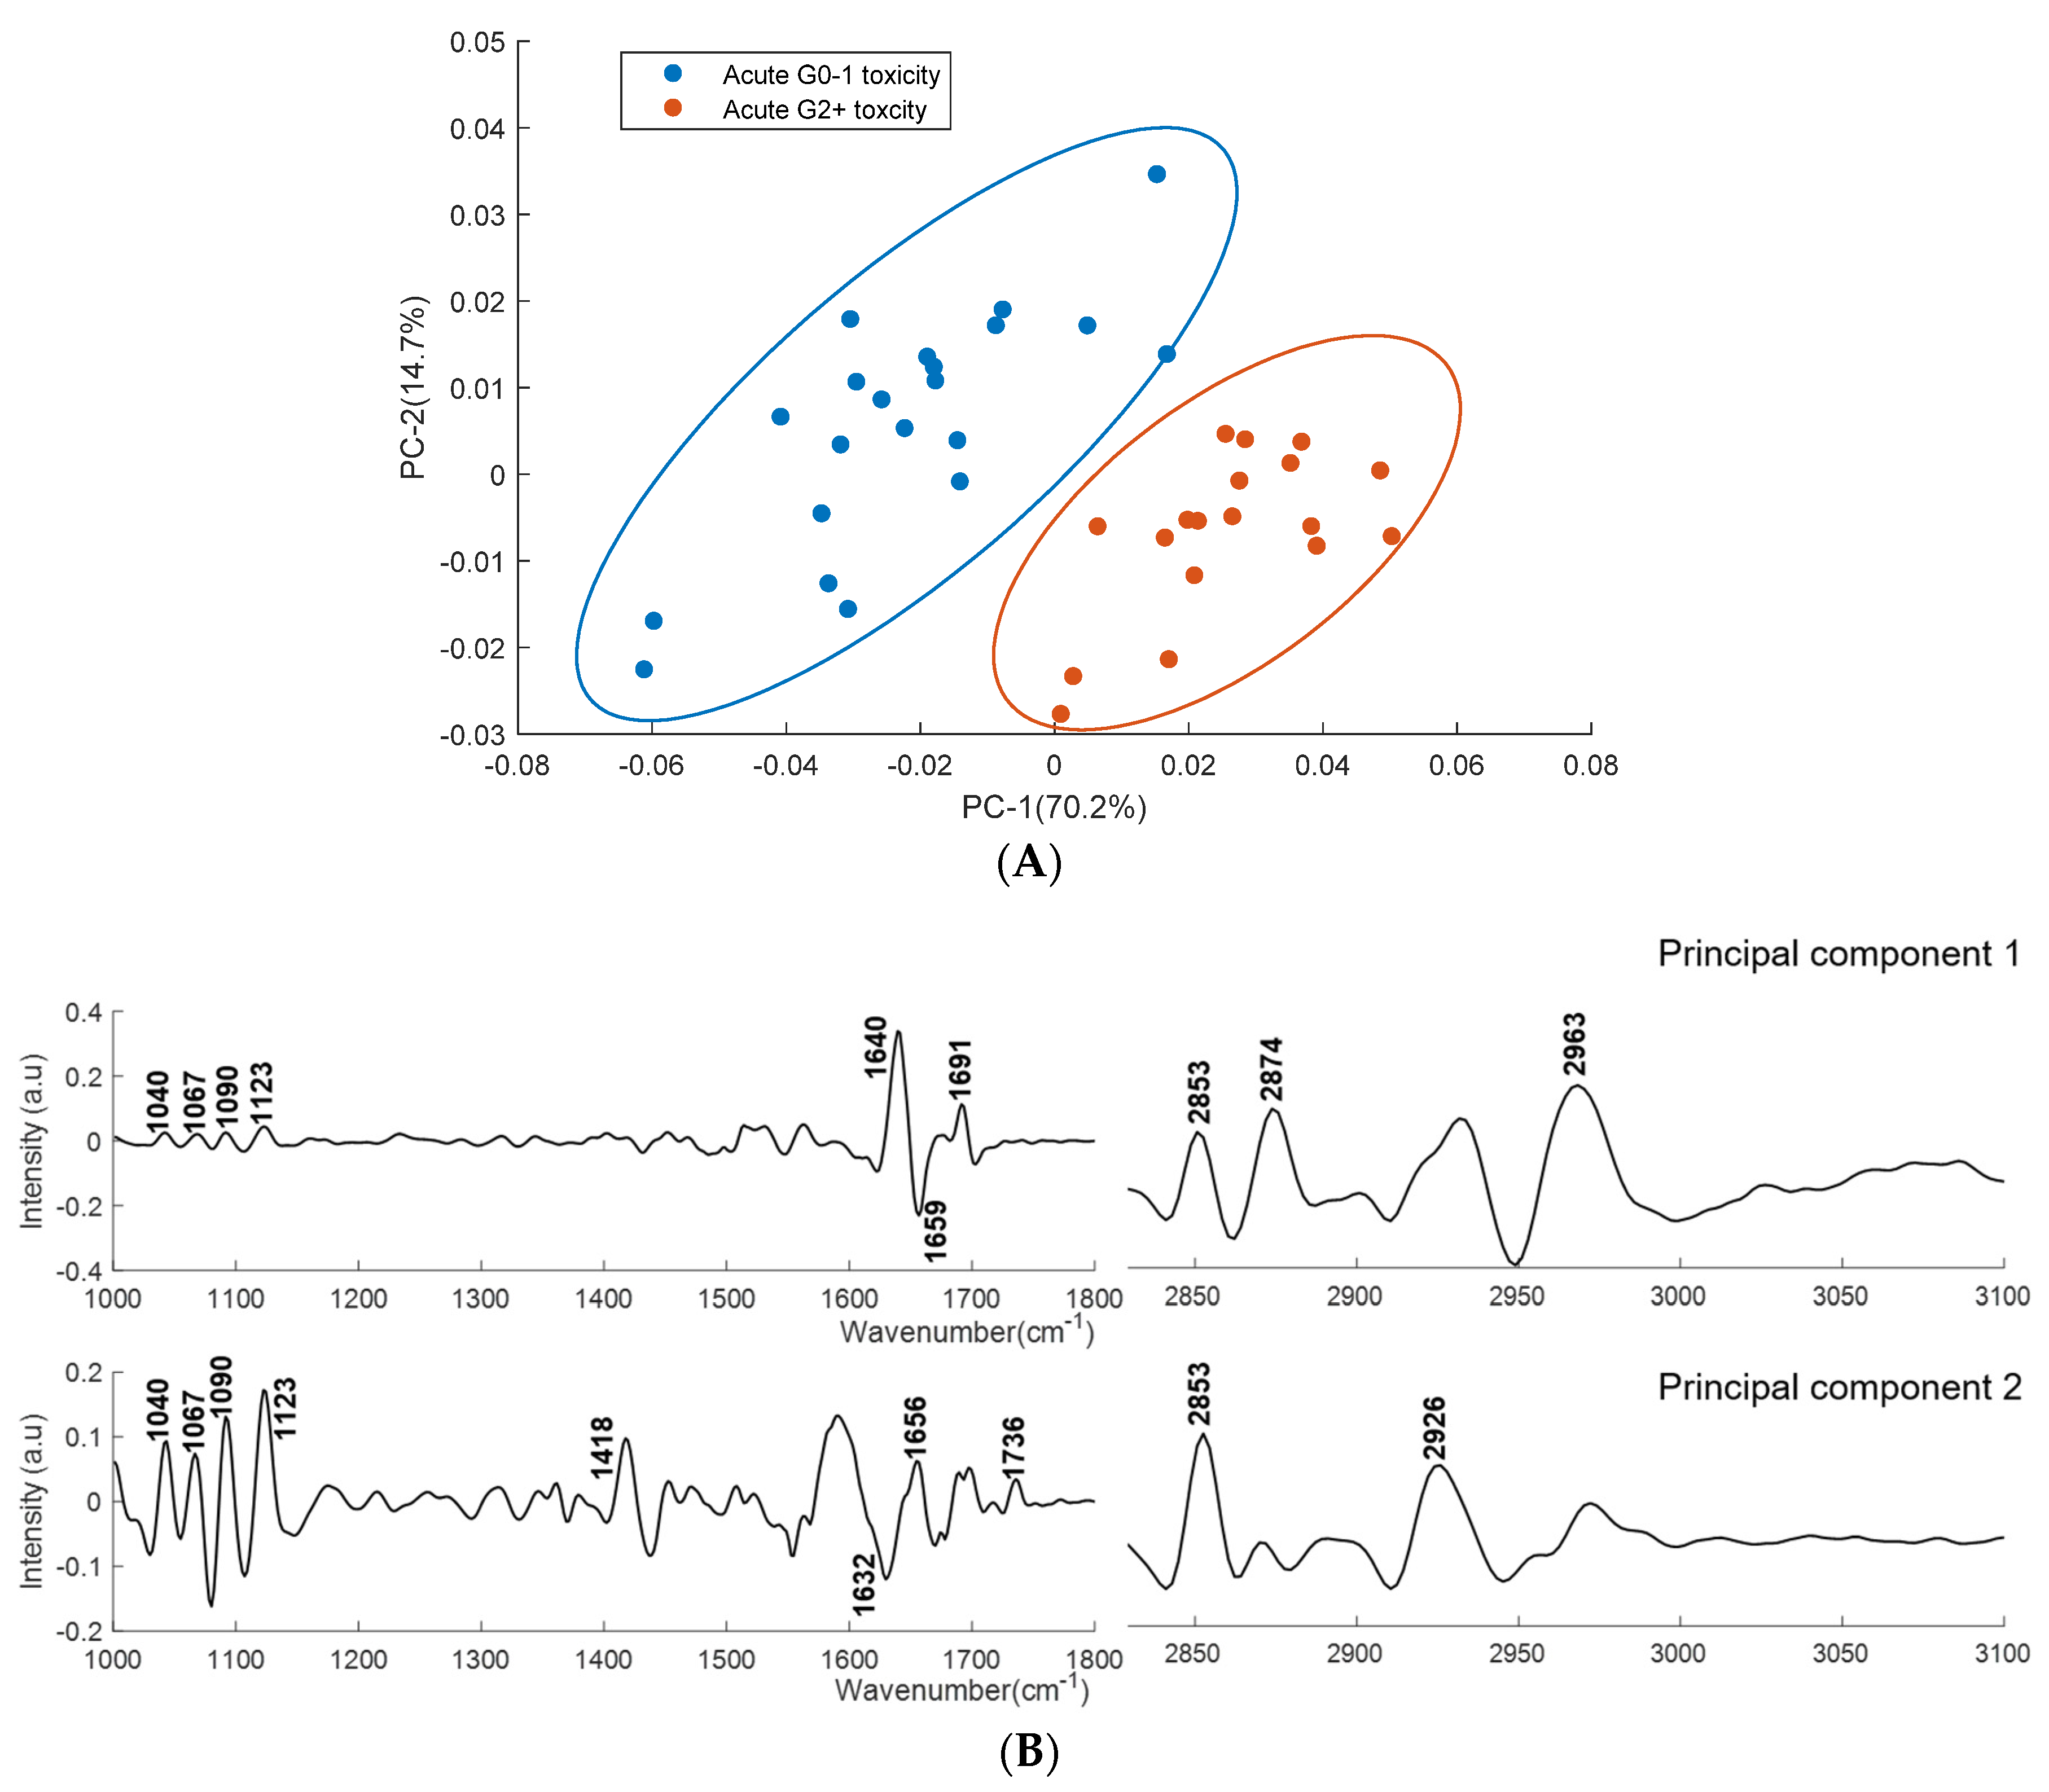
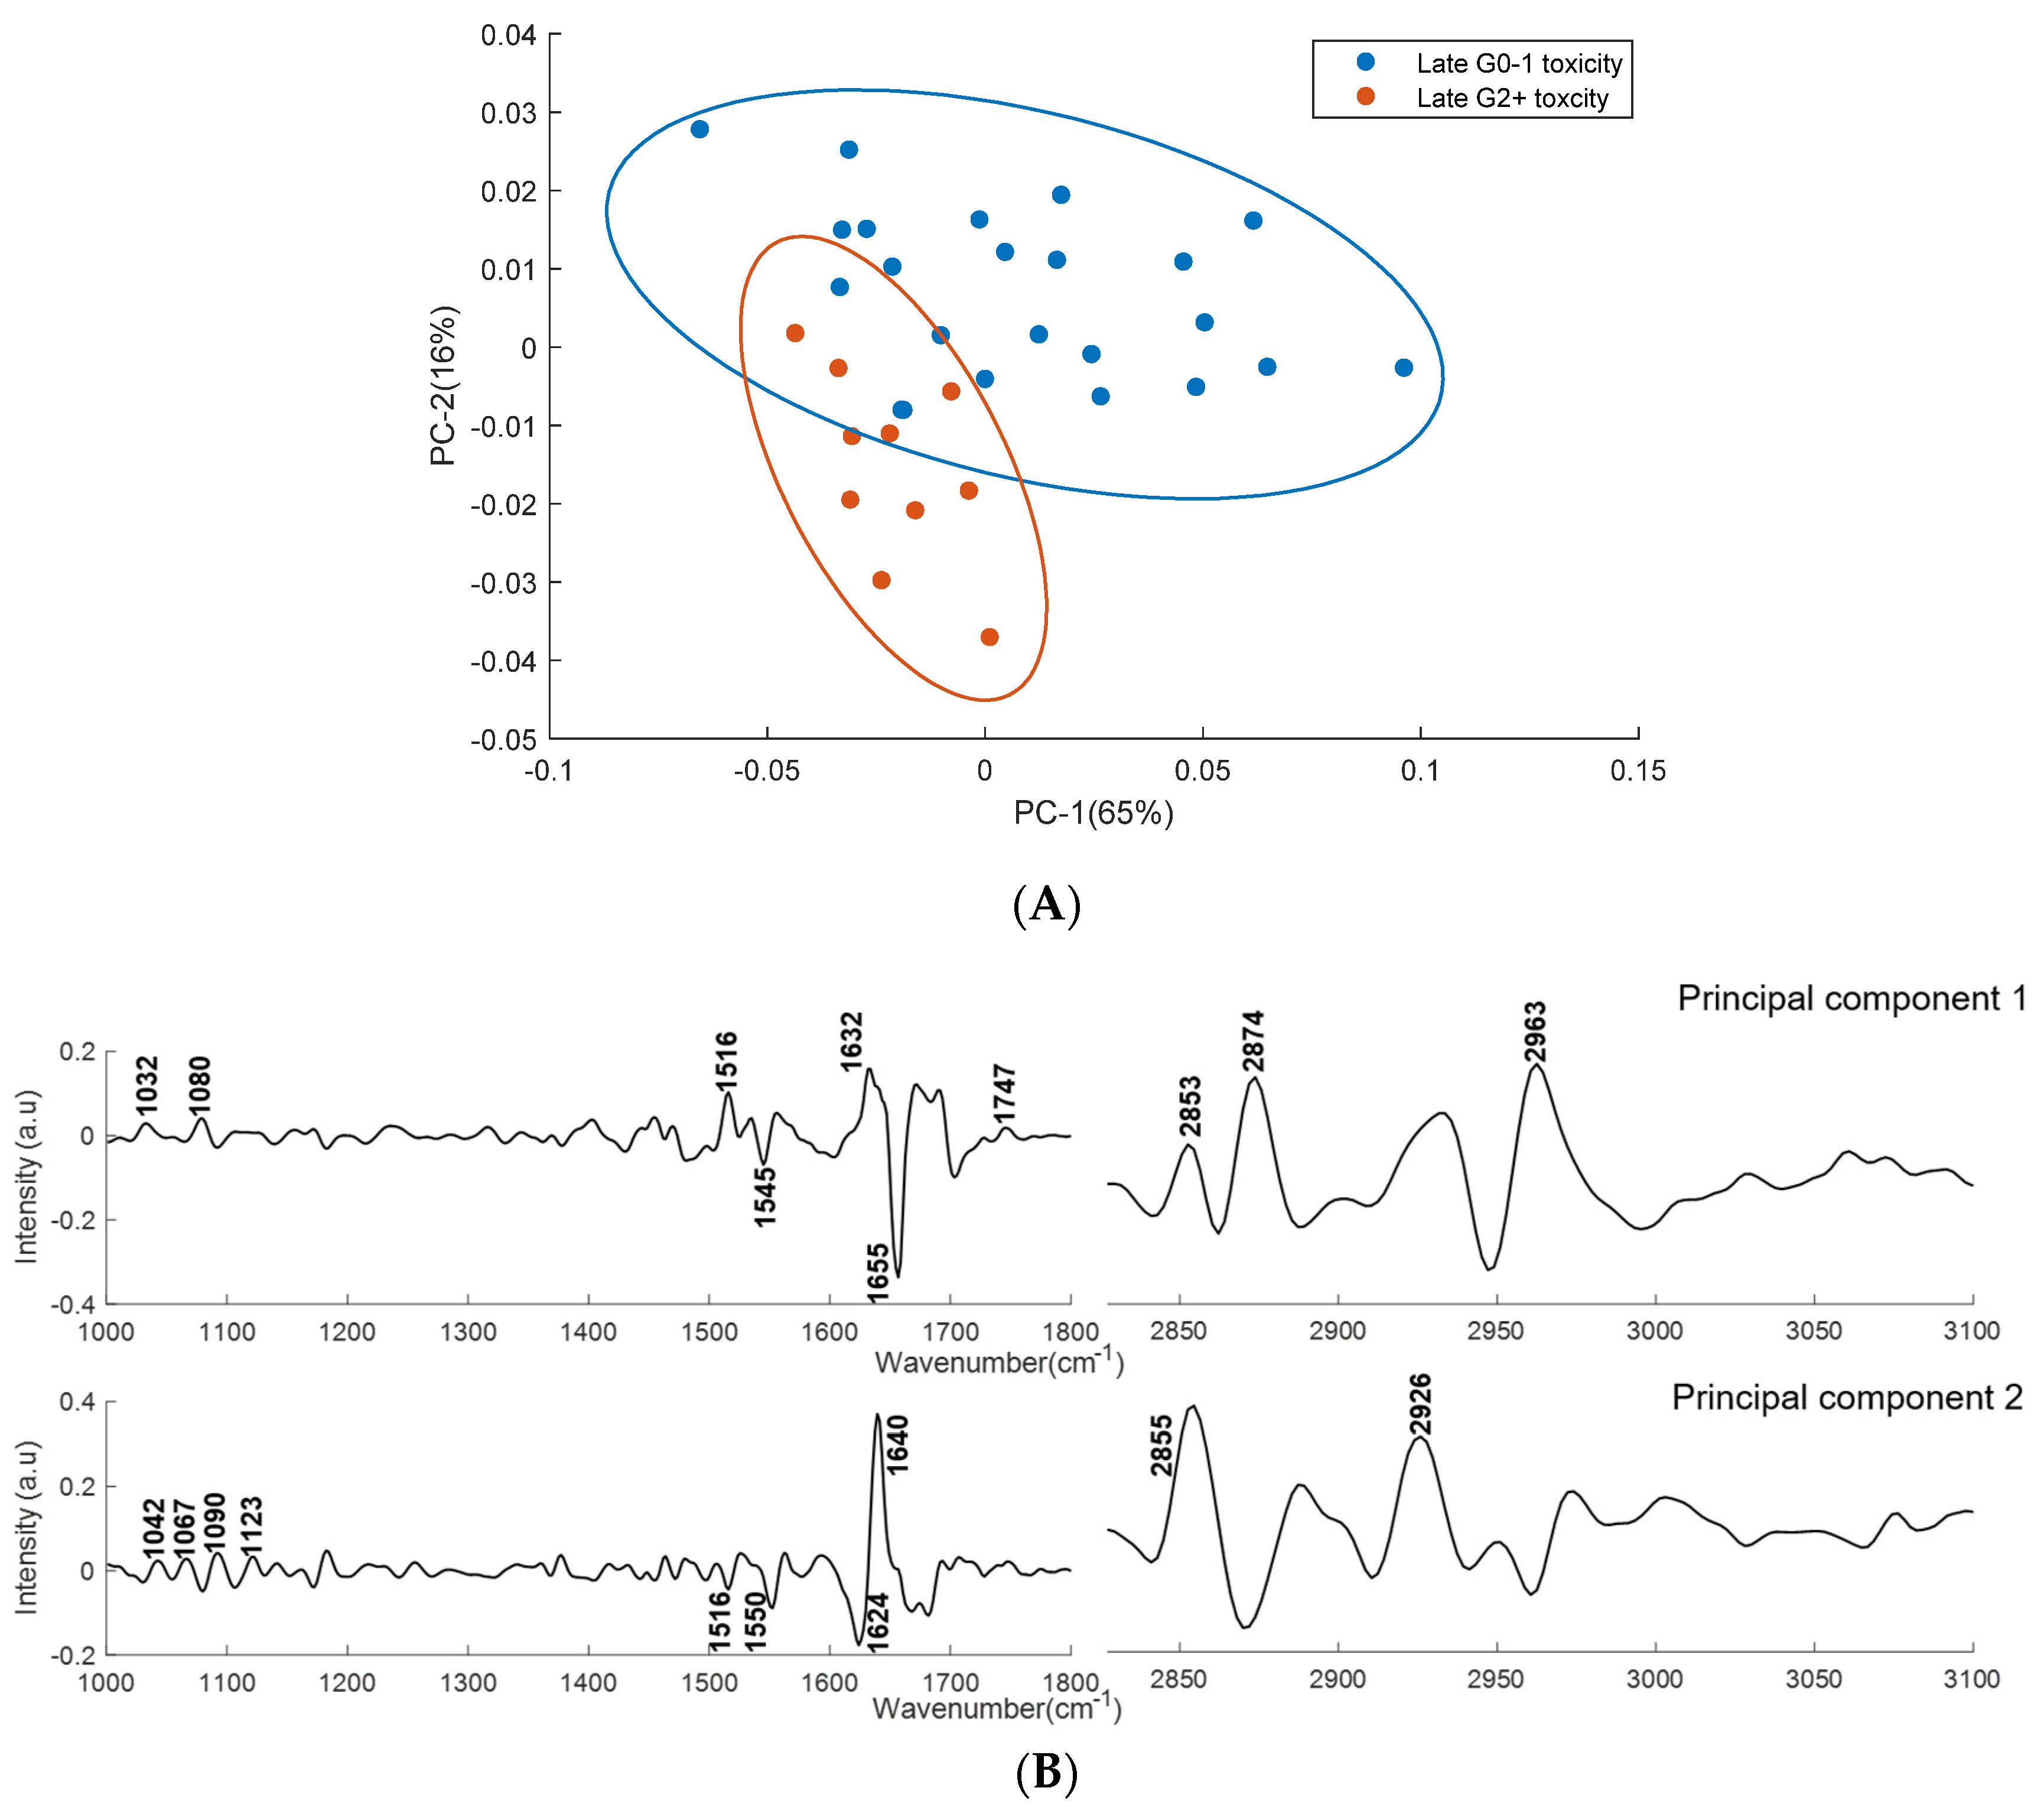
2.2.2. PCA
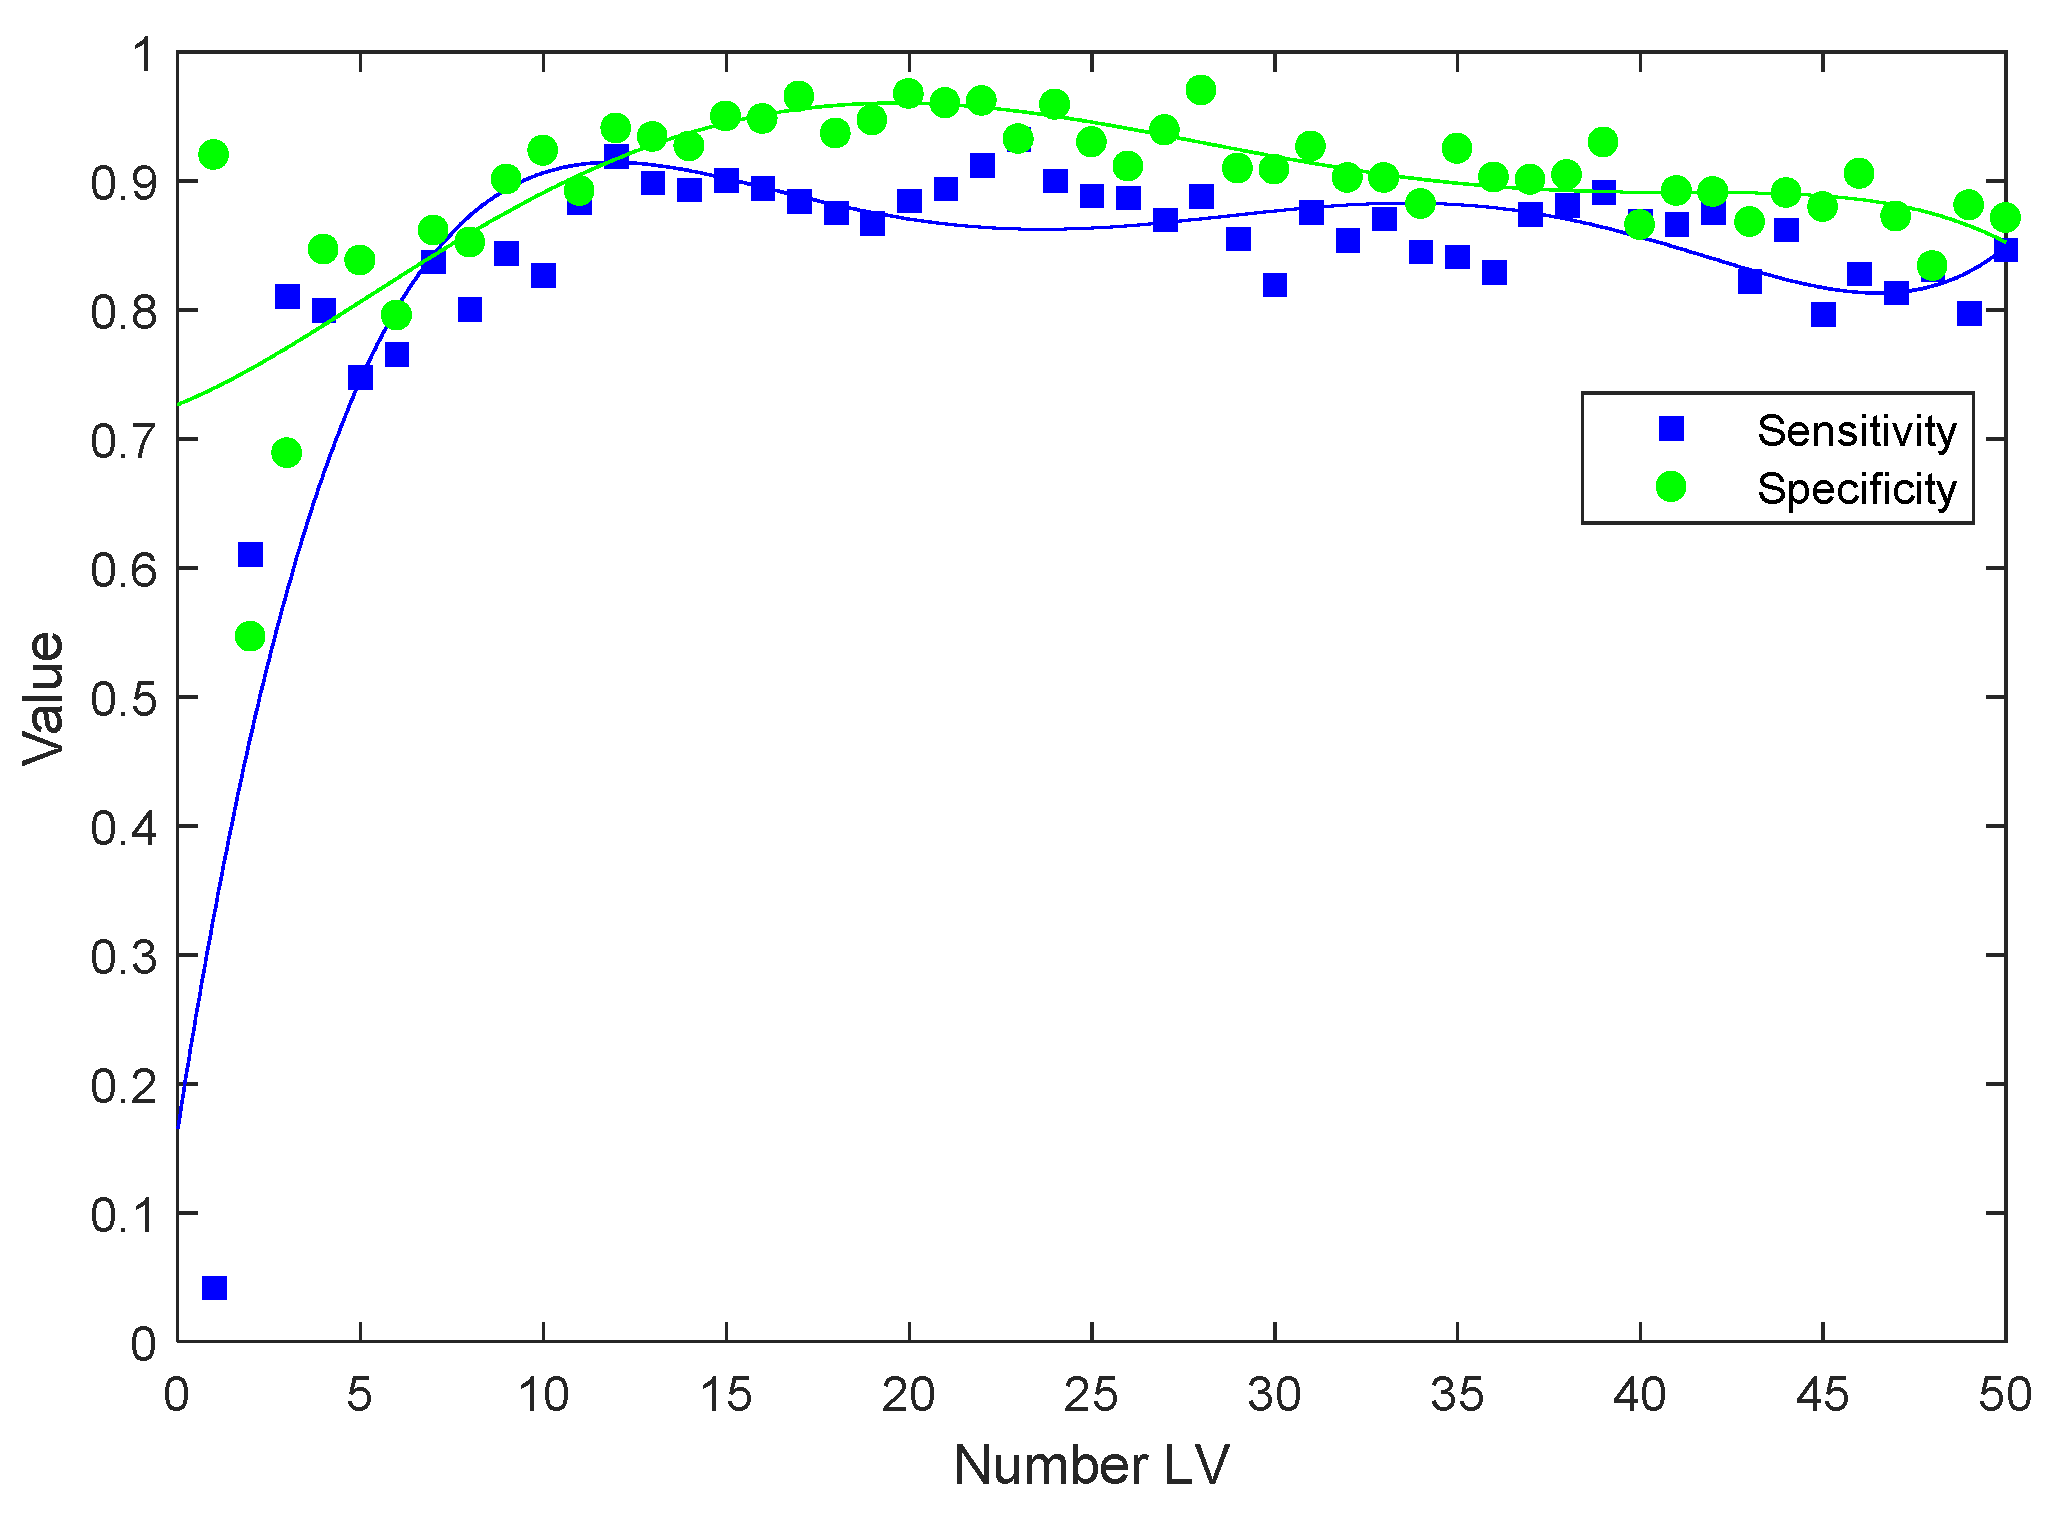
2.2.3. PLS−DA
3. Discussion
4. Materials and Methods
4.1. Ethical Approval
4.2. Patients
4.3. Plasma Separation
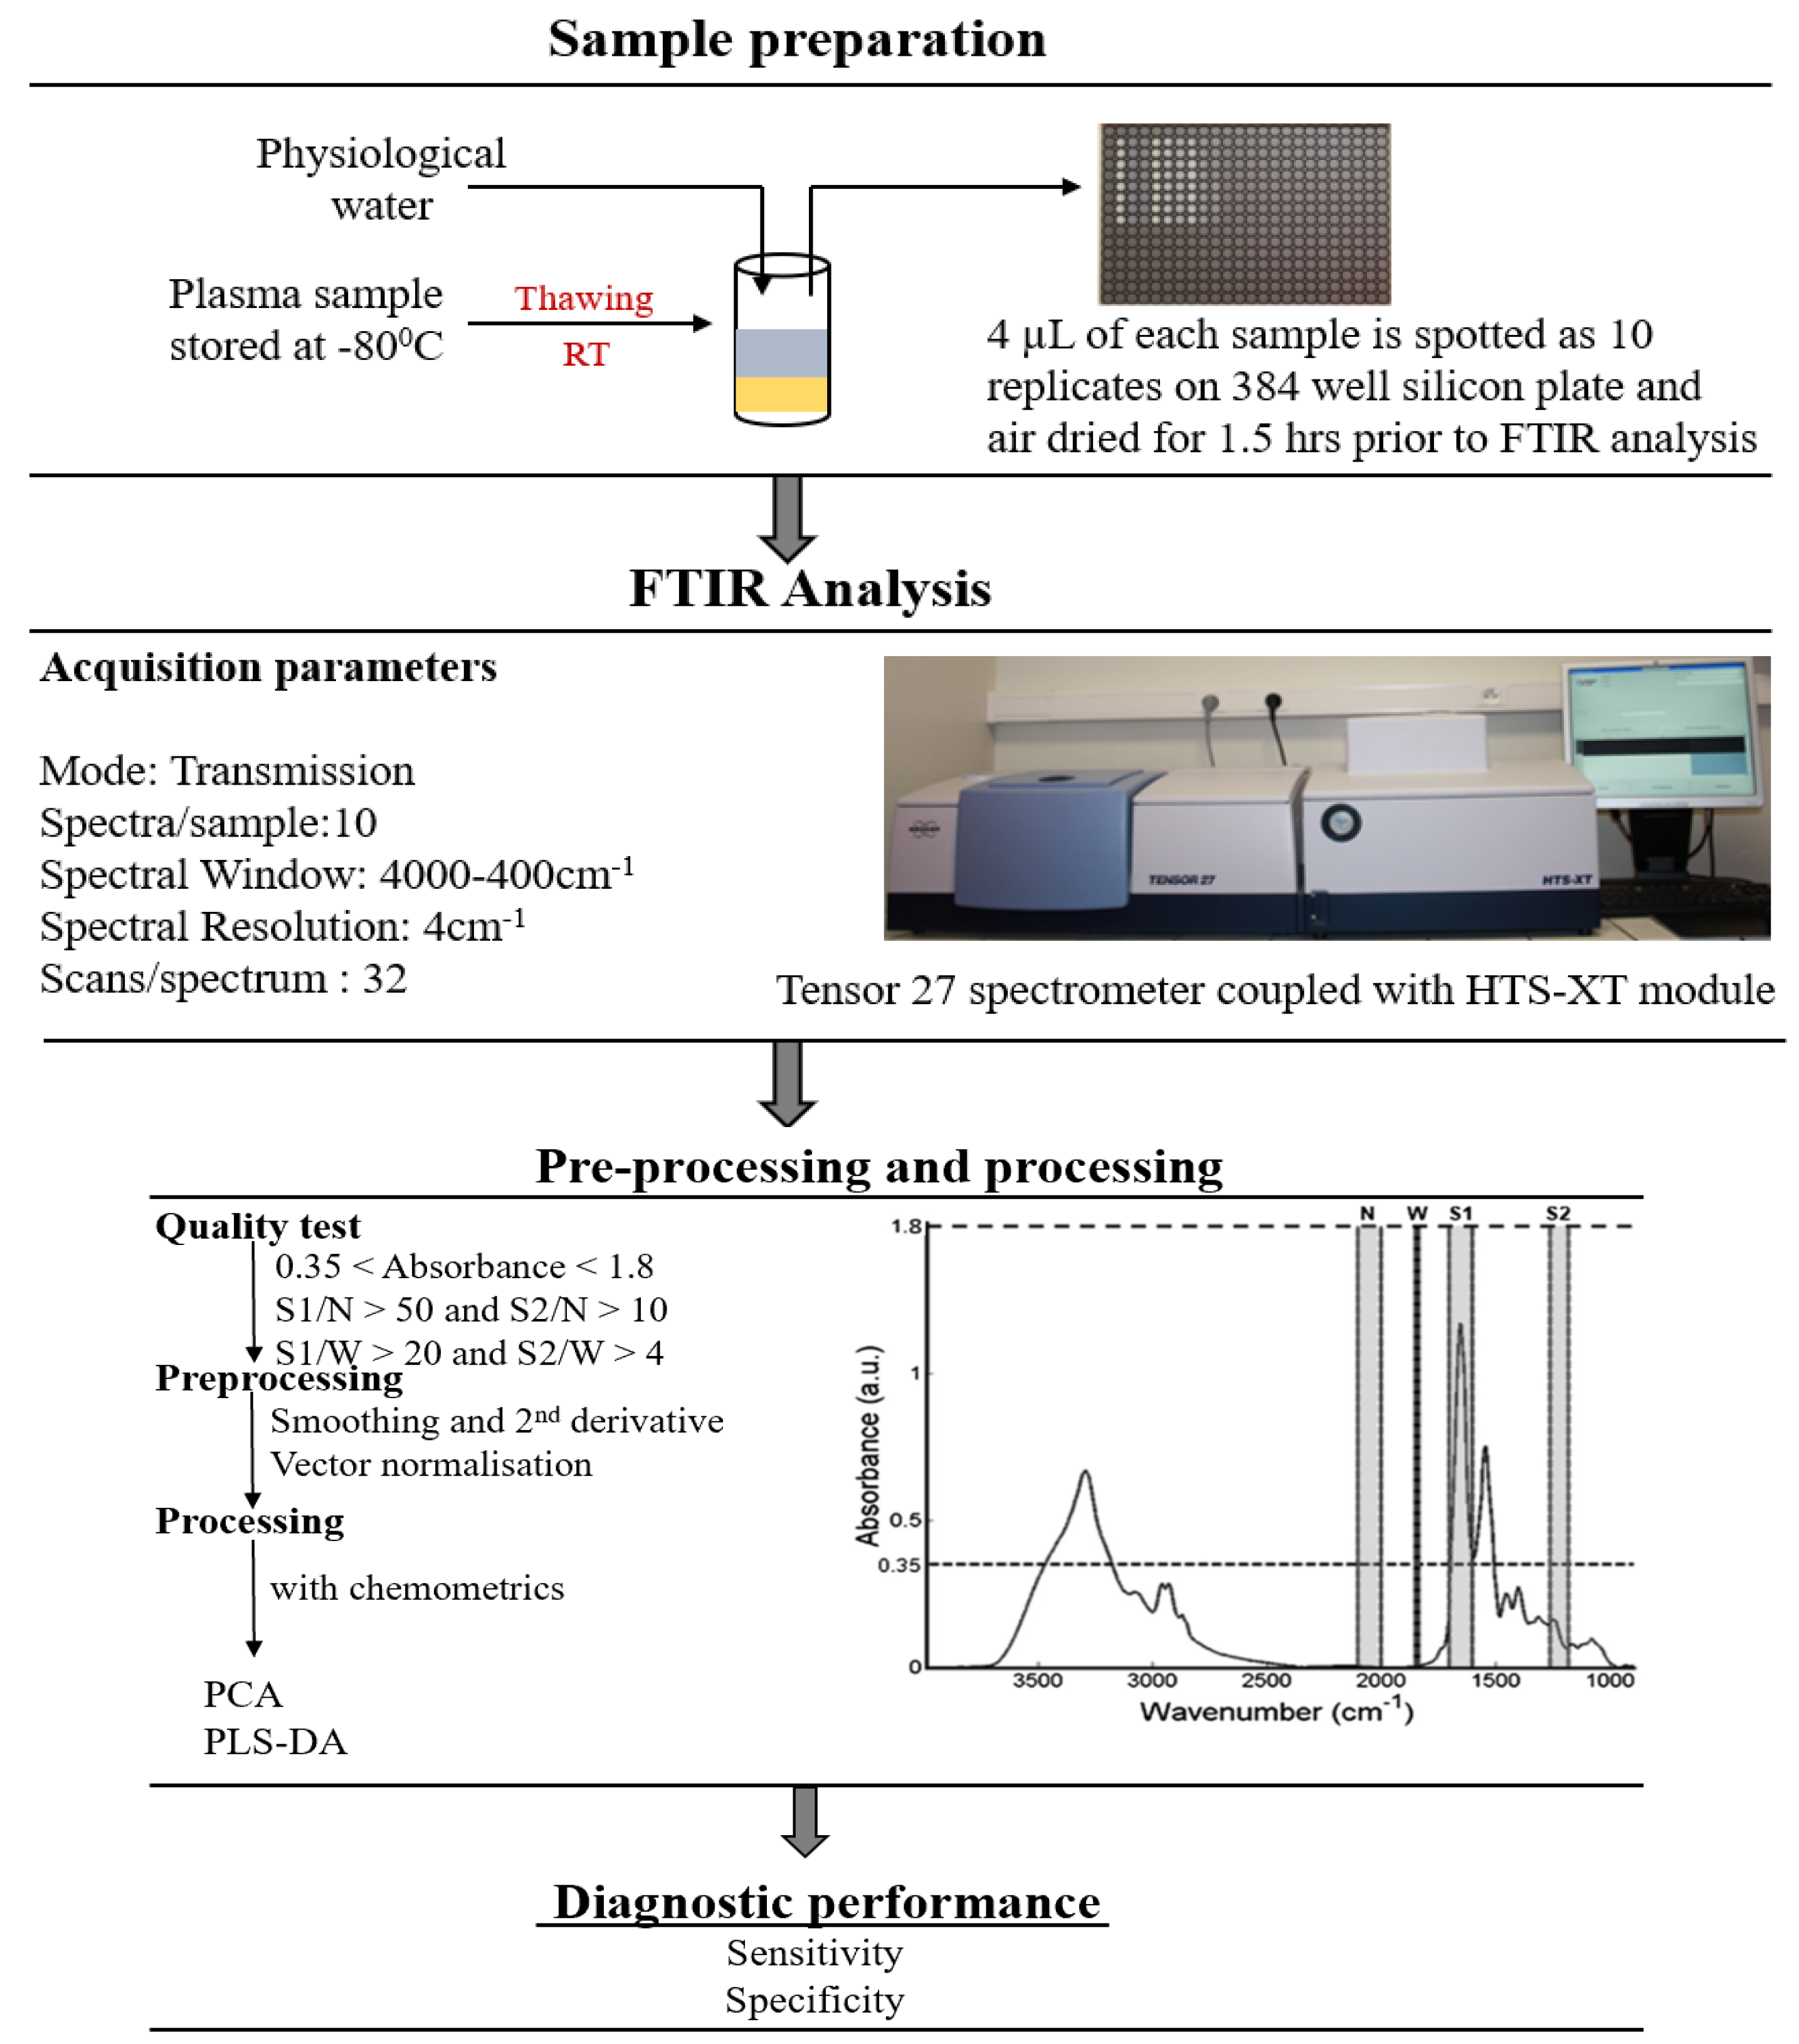
4.4. FTIR Spectroscopy
4.5. Data Analysis
4.5.1. Pre-Processing
4.5.2. PCA
4.5.3. PLS-DA
5. Conclusions
Author Contributions
Funding
Acknowledgments
Conflicts of Interest
References
- Ferlay, J.; Soerjomataram, I.; Dikshit, R.; Eser, S.; Mathers, C.; Rebelo, M.; Parkin, D.M.; Forman, D.; Bray, F. Cancer Incidence and Mortality Worldwide: Sources, Methods and Major Patterns in GLOBOCAN 2012. Int. J. Cancer 2015, 136, E359–E386. [Google Scholar] [CrossRef] [PubMed]
- Keyes, M.; Crook, J.; Morton, G.; Vigneault, E.; Usmani, N.; Morris, W.J. Treatment Options for Localized Prostate Cancer. Can. Fam. Physician 2013, 59, 1269–1274. [Google Scholar] [PubMed]
- Milecki, P.; Martenka, P.; Antczak, A.; Kwias, Z. Radiotherapy Combined with Hormonal Therapy in Prostate Cancer: The State of the Art. Cancer Manag. Res. 2010, 2, 243–253. [Google Scholar] [CrossRef] [PubMed]
- Chen, R.C.; Clark, J.A.; Talcott, J.A. Individualizing Quality-of-Life Outcomes Reporting: How Localized Prostate Cancer Treatments Affect Patients with Different Levels of Baseline Urinary, Bowel, and Sexual Function. J. Clin. Oncol. 2009, 27, 3916–3922. [Google Scholar] [CrossRef]
- West, C.M.; Barnett, G.C. Genetics and Genomics of Radiotherapy Toxicity: Towards Prediction. Genome Med. 2011. [Google Scholar] [CrossRef]
- Franken, N.A.; Rodermond, H.M.; Stap, J.; Haveman, J.; van Bree, C. Clonogenic Assay of Cells in Vitro. Nat. Protoc. 2006, 1, 2315–2319. [Google Scholar] [CrossRef] [PubMed]
- West, C.M.; Davidson, S.E.; Roberts, S.A.; Hunter, R.D. Intrinsic Radiosensitivity and Prediction of Patient Response to Radiotherapy for Carcinoma of the Cervix. Br. J. Cancer 1993, 68, 819–823. [Google Scholar] [CrossRef]
- Streffer, C.; van Beuningen, D.; Gross, E.; Schabronath, J.; Eigler, F.W.; Rebmann, A. Predictive Assays for the Therapy of Rectum Carcinoma. Radiother. Oncol. 1986, 5, 303–310. [Google Scholar] [CrossRef]
- Joiner, M.; Van der Kogel, A. Basic Clinical Radiobiology, 4th ed.; Hodder Arnold: London, UK, 2009. [Google Scholar] [CrossRef]
- Baria, K.; Warren, C.; Roberts, S.A.; West, C.M.; Scott, D. Chromosomal Radiosensitivity as a Marker of Predisposition to Common Cancers? Br. J. Cancer 2001, 84, 892–896. [Google Scholar] [CrossRef]
- Bourton, E.C.; Plowman, P.N.; Smith, D.; Arlett, C.F.; Parris, C.N. Prolonged Expression of the γ-H2AX DNA Repair Biomarker Correlates with Excess Acute and Chronic Toxicity from Radiotherapy Treatment. Int. J. Cancer 2011, 129, 2928–2934. [Google Scholar] [CrossRef]
- Herskind, C.; Talbot, C.J.; Kerns, S.L.; Veldwijk, M.R.; Rosenstein, B.S.; West, C.M.L. Radiogenomics: A Systems Biology Approach to Understanding Genetic Risk Factors for Radiotherapy Toxicity? Cancer Lett. 2016. [Google Scholar] [CrossRef] [PubMed]
- Talbot, C.J.; Tanteles, G.A.; Barnett, G.C.; Burnet, N.G.; Chang-Claude, J.; Coles, C.E.; Davidson, S.; Dunning, A.M.; Mills, J.; Murray, R.J.S.; et al. A Replicated Association between Polymorphisms near TNFα and Risk for Adverse Reactions to Radiotherapy. Br. J. Cancer 2012. [Google Scholar] [CrossRef] [PubMed]
- Seibold, P.; Behrens, S.; Schmezer, P.; Helmbold, I.; Barnett, G.; Coles, C.; Yarnold, J.; Talbot, C.J.; Imai, T.; Azria, D.; et al. XRCC1 Polymorphism Associated with Late Toxicity after Radiation Therapy in Breast Cancer Patients. Int. J. Radiat. Oncol. Biol. Phys. 2015. [Google Scholar] [CrossRef] [PubMed]
- Barnett, G.C.; Thompson, D.; Fachal, L.; Kerns, S.; Talbot, C.; Elliott, R.M.; Dorling, L.; Coles, C.E.; Dearnaley, D.P.; Rosenstein, B.S.; et al. A Genome Wide Association Study (GWAS) Providing Evidence of an Association between Common Genetic Variants and Late Radiotherapy Toxicity. Radiother. Oncol. 2014. [Google Scholar] [CrossRef] [PubMed]
- Fachal, L.; Gómez-Caamaño, A.; Barnett, G.C.; Peleteiro, P.; Carballo, A.M.; Calvo-Crespo, P.; Kerns, S.L.; Sánchez-García, M.; Lobato-Busto, R.; Dorling, L.; et al. A Three-Stage Genome-Wide Association Study Identifies a Susceptibility Locus for Late Radiotherapy Toxicity at 2q24.1. Nat. Genet. 2014. [Google Scholar] [CrossRef]
- Kerns, S.L.; Dorling, L.; Fachal, L.; Bentzen, S.; Pharoah, P.D.P.; Barnes, D.R.; Gómez-Caamaño, A.; Carballo, A.M.; Dearnaley, D.P.; Peleteiro, P.; et al. Meta-Analysis of Genome Wide Association Studies Identifies Genetic Markers of Late Toxicity Following Radiotherapy for Prostate Cancer. EBioMedicine 2016, 10, 150–163. [Google Scholar] [CrossRef]
- Easton, D.F.; Pooley, K.A.; Dunning, A.M.; Pharoah, P.D.P.; Thompson, D.; Ballinger, D.G.; Struewing, J.P.; Morrison, J.; Field, H.; Luben, R.; et al. Genome-Wide Association Study Identifies Novel Breast Cancer Susceptibility Loci. Nature 2007. [Google Scholar] [CrossRef]
- Mohlke, K.L.; Boehnke, M.; Abecasis, G.R. Metabolic and Cardiovascular Traits: An Abundance of Recently Identified Common Genetic Variants. Hum. Mol. Genet. 2008. [Google Scholar] [CrossRef]
- Easton, D.F.; Eeles, R.A. Genome−Wide Association Studies in Cancer. Hum. Mol. Genet. 2008. [Google Scholar] [CrossRef]
- Lettre, G.; Rioux, J.D. Autoimmune Diseases: Insights from Genome-Wide Association Studies. Hum. Mol. Genet. 2008. [Google Scholar] [CrossRef]
- Eeles, R.A.; Kote-Jarai, Z.; Giles, G.G.; Al Olama, A.A.; Guy, M.; Jugurnauth, S.K.; Mulholland, S.; Leongamornlert, D.A.; Edwards, S.M.; Morrison, J.; et al. Multiple Newly Identified Loci Associated with Prostate Cancer Susceptibility. Nat. Genet. 2008. [Google Scholar] [CrossRef] [PubMed]
- Lacombe, C.; Untereiner, V.; Gobinet, C.; Zater, M.; Sockalingum, G.D.; Garnotel, R. Rapid Screening of Classic Galactosemia Patients: A Proof-of-Concept Study Using High-Throughput FTIR Analysis of Plasma. Analyst 2015, 140, 2280–2286. [Google Scholar] [CrossRef] [PubMed]
- Carmona, P.; Molina, M.; Calero, M.; Bermejo-Pareja, F.; Martínez-Martín, P.; Toledano, A. Discrimination Analysis of Blood Plasma Associated with Alzheimer’s Disease Using Vibrational Spectroscopy. J. Alzheimers Dis. 2013, 34, 911–920. [Google Scholar] [CrossRef] [PubMed]
- Scaglia, E.; Sockalingum, G.D.; Schmitt, J.; Gobinet, C.; Schneider, N.; Manfait, M.; Thiéfin, G. Noninvasive Assessment of Hepatic Fibrosis in Patients with Chronic Hepatitis C Using Serum Fourier Transform Infrared Spectroscopy. Anal. Bioanal. Chem. 2011, 401, 2919–2925. [Google Scholar] [CrossRef] [PubMed]
- Gajjar, K.; Trevisan, J.; Owens, G.; Keating, P.J.; Wood, N.J.; Stringfellow, H.F.; Martin-Hirsch, P.L.; Martin, F.L. Fourier−Transform Infrared Spectroscopy Coupled with a Classification Machine for the Analysis of Blood Plasma or Serum: A Novel Diagnostic Approach for Ovarian Cancer. Analyst 2013, 138, 3917–3926. [Google Scholar] [CrossRef] [PubMed]
- Wan, Q.S.; Wang, T.; Zhang, K.H. Biomedical Optical Spectroscopy for the Early Diagnosis of Gastrointestinal Neoplasms. Tumor Biol. 2017. [Google Scholar] [CrossRef] [PubMed]
- Elmi, F.; Movaghar, A.F.; Elmi, M.M.; Alinezhad, H.; Nikbakhsh, N. Application of FT−IR Spectroscopy on Breast Cancer Serum Analysis. Spectrochim. Acta Part A Mol. Biomol. Spectrosc. 2017. [Google Scholar] [CrossRef]
- Meade, A.D.; Clarke, C.; Byrne, H.J.; Lyng, F.M. Fourier Transform Infrared Microspectroscopy and Multivariate Methods for Radiobiological Dosimetry. Radiat. Res. 2010. [Google Scholar] [CrossRef]
- Meade, A.D.; Howe, O.; Unterreiner, V.; Sockalingum, G.D.; Byrne, H.J.; Lyng, F.M. Vibrational Spectroscopy in Sensing Radiobiological Effects: Analyses of Targeted and Non−Targeted Effects in Human Keratinocytes. Faraday Discuss. 2016, 187, 213–234. [Google Scholar] [CrossRef] [PubMed]
- Meade, A.D.; Maguire, A.; Bryant, J.; Cullen, D.; Medipally, D.; White, L.; McClean, B.; Shields, L.; Armstrong, J.; Dunne, M.; et al. Prediction of DNA Damage and G2 Chromosomal Radio−Sensitivity Ex Vivo in Peripheral Blood Mononuclear Cells with Label-Free Raman Micro-Spectroscopy. Int. J. Radiat. Biol. 2018. [Google Scholar] [CrossRef]
- Maziak, D.E.; Do, M.T.; Shamji, F.M.; Sundaresan, S.R.; Perkins, D.G.; Wong, P.T.T. Fourier-Transform Infrared Spectroscopic Study of Characteristic Molecular Structure in Cancer Cells of Esophagus: An Exploratory Study. Cancer Detect. Prev. 2007. [Google Scholar] [CrossRef] [PubMed]
- Staniszewska-Slezak, E.; Fedorowicz, A.; Kramkowski, K.; Leszczynska, A.; Chlopicki, S.; Baranska, M.; Malek, K. Plasma Biomarkers of Pulmonary Hypertension Identified by Fourier Transform Infrared Spectroscopy and Principal Component Analysis. Analyst 2015. [Google Scholar] [CrossRef] [PubMed]
- Bonnier, F.; Baker, M.J.; Byrne, H.J. Vibrational Spectroscopic Analysis of Body Fluids: Avoiding Molecular Contamination Using Centrifugal Filtration. Anal. Methods 2014. [Google Scholar] [CrossRef]
- Chisanga, M.; Muhamadali, H.; Ellis, D.I.; Goodacre, R. Surface-Enhanced Raman Scattering (SERS) in Microbiology: Illumination and Enhancement of the Microbial World. Appl. Spectrosc. 2018. [Google Scholar] [CrossRef] [PubMed]
- Saylor, P.J.; Smith, M.R. Adverse Effects of Androgen Deprivation Therapy: Defining the Problem and Promoting Health among Men with Prostate Cancer. J. Natl. Compr. Cancer Netw. 2010, 8, 211–223. [Google Scholar] [CrossRef]
- Roayaei, M.; Ghasemi, S. Effect of Androgen Deprivation Therapy on Cardiovascular Risk Factors in Prostate Cancer. J. Res. Med. Sci. 2013, 18, 580–582. [Google Scholar] [PubMed]
- Keating, N.L.; Liu, P.H.; O’Malley, A.J.; Freedland, S.J.; Smith, M.R. Androgen−Deprivation Therapy and Diabetes Control among Diabetic Men with Prostate Cancer. Eur. Urol. 2014. [Google Scholar] [CrossRef]
- Wolny-Rokicka, E.; Tukiendorf, A.; Wydmański, J.; Brzezniakiewicz-Janus, K.; Zembroń-Łacny, A. The Effect of Radiotherapy on the Concentration of Plasma Lipids in Elderly Prostate Cancer Patients. Am. J. Mens Heal. 2019, 13. [Google Scholar] [CrossRef]
- Kageyama, S.; Nihei, K.; Karasawa, K.; Sawada, T.; Koizumi, F.; Yamaguchi, S.; Kato, S.; Hojo, H.; Motegi, A.; Tsuchihara, K.; et al. Radiotherapy Increases Plasma Levels of Tumoral Cell−Free DNA in Non−Small Cell Lung Cancer Patients. Oncotarget 2018, 9, 19368–19369. [Google Scholar] [CrossRef]
- Jelonek, K.; Pietrowska, M.; Ros, M.; Zagdanski, A.; Suchwalko, A.; Polanska, J.; Marczyk, M.; Rutkowski, T.; Skladowski, K.; Clench, M.R.; et al. Radiation-Induced Changes in Serum Lipidome of Head and Neck Cancer Patients. Int. J. Mol. Sci. 2014, 15, 6609. [Google Scholar] [CrossRef]
- Daly, M.J. Death by Protein Damage in Irradiated Cells. DNA Repair 2012, 11, 12–21. [Google Scholar] [CrossRef] [PubMed]
- Alicikus, Z.A.; Yamada, Y.; Zhang, Z.; Pei, X.; Hunt, M.; Kollmeier, M.; Cox, B.; Zelefsky, M.J. Ten-Year Outcomes of High-Dose, Intensity-Modulated Radiotherapy for Localized Prostate Cancer. Cancer 2011, 117, 1429–1437. [Google Scholar] [CrossRef] [PubMed]
- Helm, D.; Labischinski, H.; Naumann, D. Elaboration of a Procedure for Identification of Bacteria Using Fourier−Transform IR Spectral Libraries: A Stepwise Correlation Approach. J. Microbiol. Methods 1991. [Google Scholar] [CrossRef]
- Shaver, J. Chemometrics for Raman Spectroscopy. In Handbook of Raman Spectroscopy: From the Research Laboratory to the Process Line; Lewis, I.R., Edwards, H., Eds.; Marcel Dekker Inc.: New York, NY, USA, 2001; pp. 275–306. [Google Scholar]
- Opus 5 Reference Manual; Bruker OPTIK GmbH: Ettlingen, Germany, 2004.
- Savitzky, A.; Golay, M.J.E. Smoothing and Differentiation of Data by Simplified Least Squares Procedures. Anal. Chem. 1964. [Google Scholar] [CrossRef]
- Krafft, C.; Steiner, G.; Beleites, C.; Salzer, R. Disease Recognition by Infrared and Raman Spectroscopy. J. Biophotonics 2009, 2, 13–28. [Google Scholar] [CrossRef] [PubMed]
- Meade, A.D.; Byrne, H.J.; Lyng, F.M. Spectroscopic and Chemometric Approaches to Radiobiological Analyses. Mutat. Res. 2010, 704, 108–114. [Google Scholar] [CrossRef][Green Version]
- Brereton, R.G.; Lloyd, G.R. Partial Least Squares Discriminant Analysis: Taking the Magic Away. J. Chemom. 2014. [Google Scholar] [CrossRef]
- Wold, S.; Sjöström, M.; Eriksson, L. PLS−Regression: A Basic Tool of Chemometrics. Chemom. Intell. Lab. Syst. 2001, 58, 109–130. [Google Scholar] [CrossRef]
- Gromski, P.S.; Muhamadali, H.; Ellis, D.I.; Xu, Y.; Correa, E.; Turner, M.L.; Goodacre, R. A Tutorial Review: Metabolomics and Partial Least Squares−Discriminant Analysis—A Marriage of Convenience or a Shotgun Wedding. Anal. Chim. Acta 2015. [Google Scholar] [CrossRef] [PubMed]
- Mehmood, T.; Martens, H.; Sæbø, S.; Warringer, J.; Snipen, L. A Partial Least Squares Based Algorithm for Parsimonious Variable Selection. Algorithms Mol. Biol. 2011. [Google Scholar] [CrossRef]
- Krishnan, A.; Williams, L.J.; McIntosh, A.R.; Abdi, H. Partial Least Squares (PLS) Methods for Neuroimaging: A Tutorial and Review. Neuroimage 2011. [Google Scholar] [CrossRef] [PubMed]
- Worley, B.; Halouska, S.; Powers, R. Utilities for Quantifying Separation in PCA/PLS-DA Scores Plots. Anal. Biochem. 2013, 433, 102–104. [Google Scholar] [CrossRef] [PubMed]


| Time Point | Number of Latent Variables (LVs) | Sensitivity | Specificity |
|---|---|---|---|
| Post hormone therapy | 10 | 78.7% | 80% |
| Post radiotherapy | 11 | 89.3% | 89.1% |
| 2 months follow up | 10 | 91.4% | 91.5% |
| 8 months follow up | 13 | 98.4% | 99.1% |
| Toxicity | Number of Patients |
|---|---|
| Acute grade 0−1 toxicity | 24 |
| Acute grade 2+ toxicity | 19 |
| Late grade 0−1 toxicity | 24 |
| Late grade 2+ toxicity | 11 |
| Patients | Number of LVs | Sensitivity | Specificity |
|---|---|---|---|
| Grade 0−1 vs Grade 2+ acute toxicity | 10 | 80.8% | 81.6% |
| Grade 0−1 vs Grade 2+ late toxicity | 10 | 81.4% | 81.5% |
| Patients | PSA Level Mean (SD) |
|---|---|
| Baseline (n = 37) | 14.4 (13.9) ng/mL |
| Post hormone (n = 36) | 0.72 (1.71) ng/mL |
| Post radiotherapy (n = 43) | 0.08 (0.11) ng/mL |
| 2 months post RT (n = 37) | 0.07 (0.09) ng/mL |
| 8 months post RT (n = 35) | 0.09 (0.11) ng/mL |
| Age (years) | |
| Mean | 69.26 |
| Median | 70.5 |
| Range | 57−85 |
| PSA (ng/mL) | |
| Mean | 17.22 |
| Median | 9.4 |
| T Stage | |
| T2a to T2c | 11 (25%) |
| T3a | 23 (53%) |
| T3b | 08 (18%) |
| T4a | 01 (2%) |
| Gleason score | |
| 7 | 14 (33%) |
| 8 | 16 (37%) |
| 9 | 13 (30%) |
| Planned duration of hormones | |
| 6 months | 05 (12%) |
| 36 months | 38 (88%) |
| RT Dose/fractions | |
| 81.0/45 | 43 (100%) |
© 2019 by the authors. Licensee MDPI, Basel, Switzerland. This article is an open access article distributed under the terms and conditions of the Creative Commons Attribution (CC BY) license (http://creativecommons.org/licenses/by/4.0/).
Share and Cite
Medipally, D.K.R.; Nguyen, T.N.Q.; Bryant, J.; Untereiner, V.; Sockalingum, G.D.; Cullen, D.; Noone, E.; Bradshaw, S.; Finn, M.; Dunne, M.; et al. Monitoring Radiotherapeutic Response in Prostate Cancer Patients Using High Throughput FTIR Spectroscopy of Liquid Biopsies. Cancers 2019, 11, 925. https://doi.org/10.3390/cancers11070925
Medipally DKR, Nguyen TNQ, Bryant J, Untereiner V, Sockalingum GD, Cullen D, Noone E, Bradshaw S, Finn M, Dunne M, et al. Monitoring Radiotherapeutic Response in Prostate Cancer Patients Using High Throughput FTIR Spectroscopy of Liquid Biopsies. Cancers. 2019; 11(7):925. https://doi.org/10.3390/cancers11070925
Chicago/Turabian StyleMedipally, Dinesh K.R., Thi Nguyet Que Nguyen, Jane Bryant, Valérie Untereiner, Ganesh D. Sockalingum, Daniel Cullen, Emma Noone, Shirley Bradshaw, Marie Finn, Mary Dunne, and et al. 2019. "Monitoring Radiotherapeutic Response in Prostate Cancer Patients Using High Throughput FTIR Spectroscopy of Liquid Biopsies" Cancers 11, no. 7: 925. https://doi.org/10.3390/cancers11070925
APA StyleMedipally, D. K. R., Nguyen, T. N. Q., Bryant, J., Untereiner, V., Sockalingum, G. D., Cullen, D., Noone, E., Bradshaw, S., Finn, M., Dunne, M., Shannon, A. M., Armstrong, J., Lyng, F. M., & Meade, A. D. (2019). Monitoring Radiotherapeutic Response in Prostate Cancer Patients Using High Throughput FTIR Spectroscopy of Liquid Biopsies. Cancers, 11(7), 925. https://doi.org/10.3390/cancers11070925