Urinary Metabolic Signatures Detect Recurrences in Non-Muscle Invasive Bladder Cancer

 , ,
, ,  , and
, and
Abstract
1. Introduction
2. Results
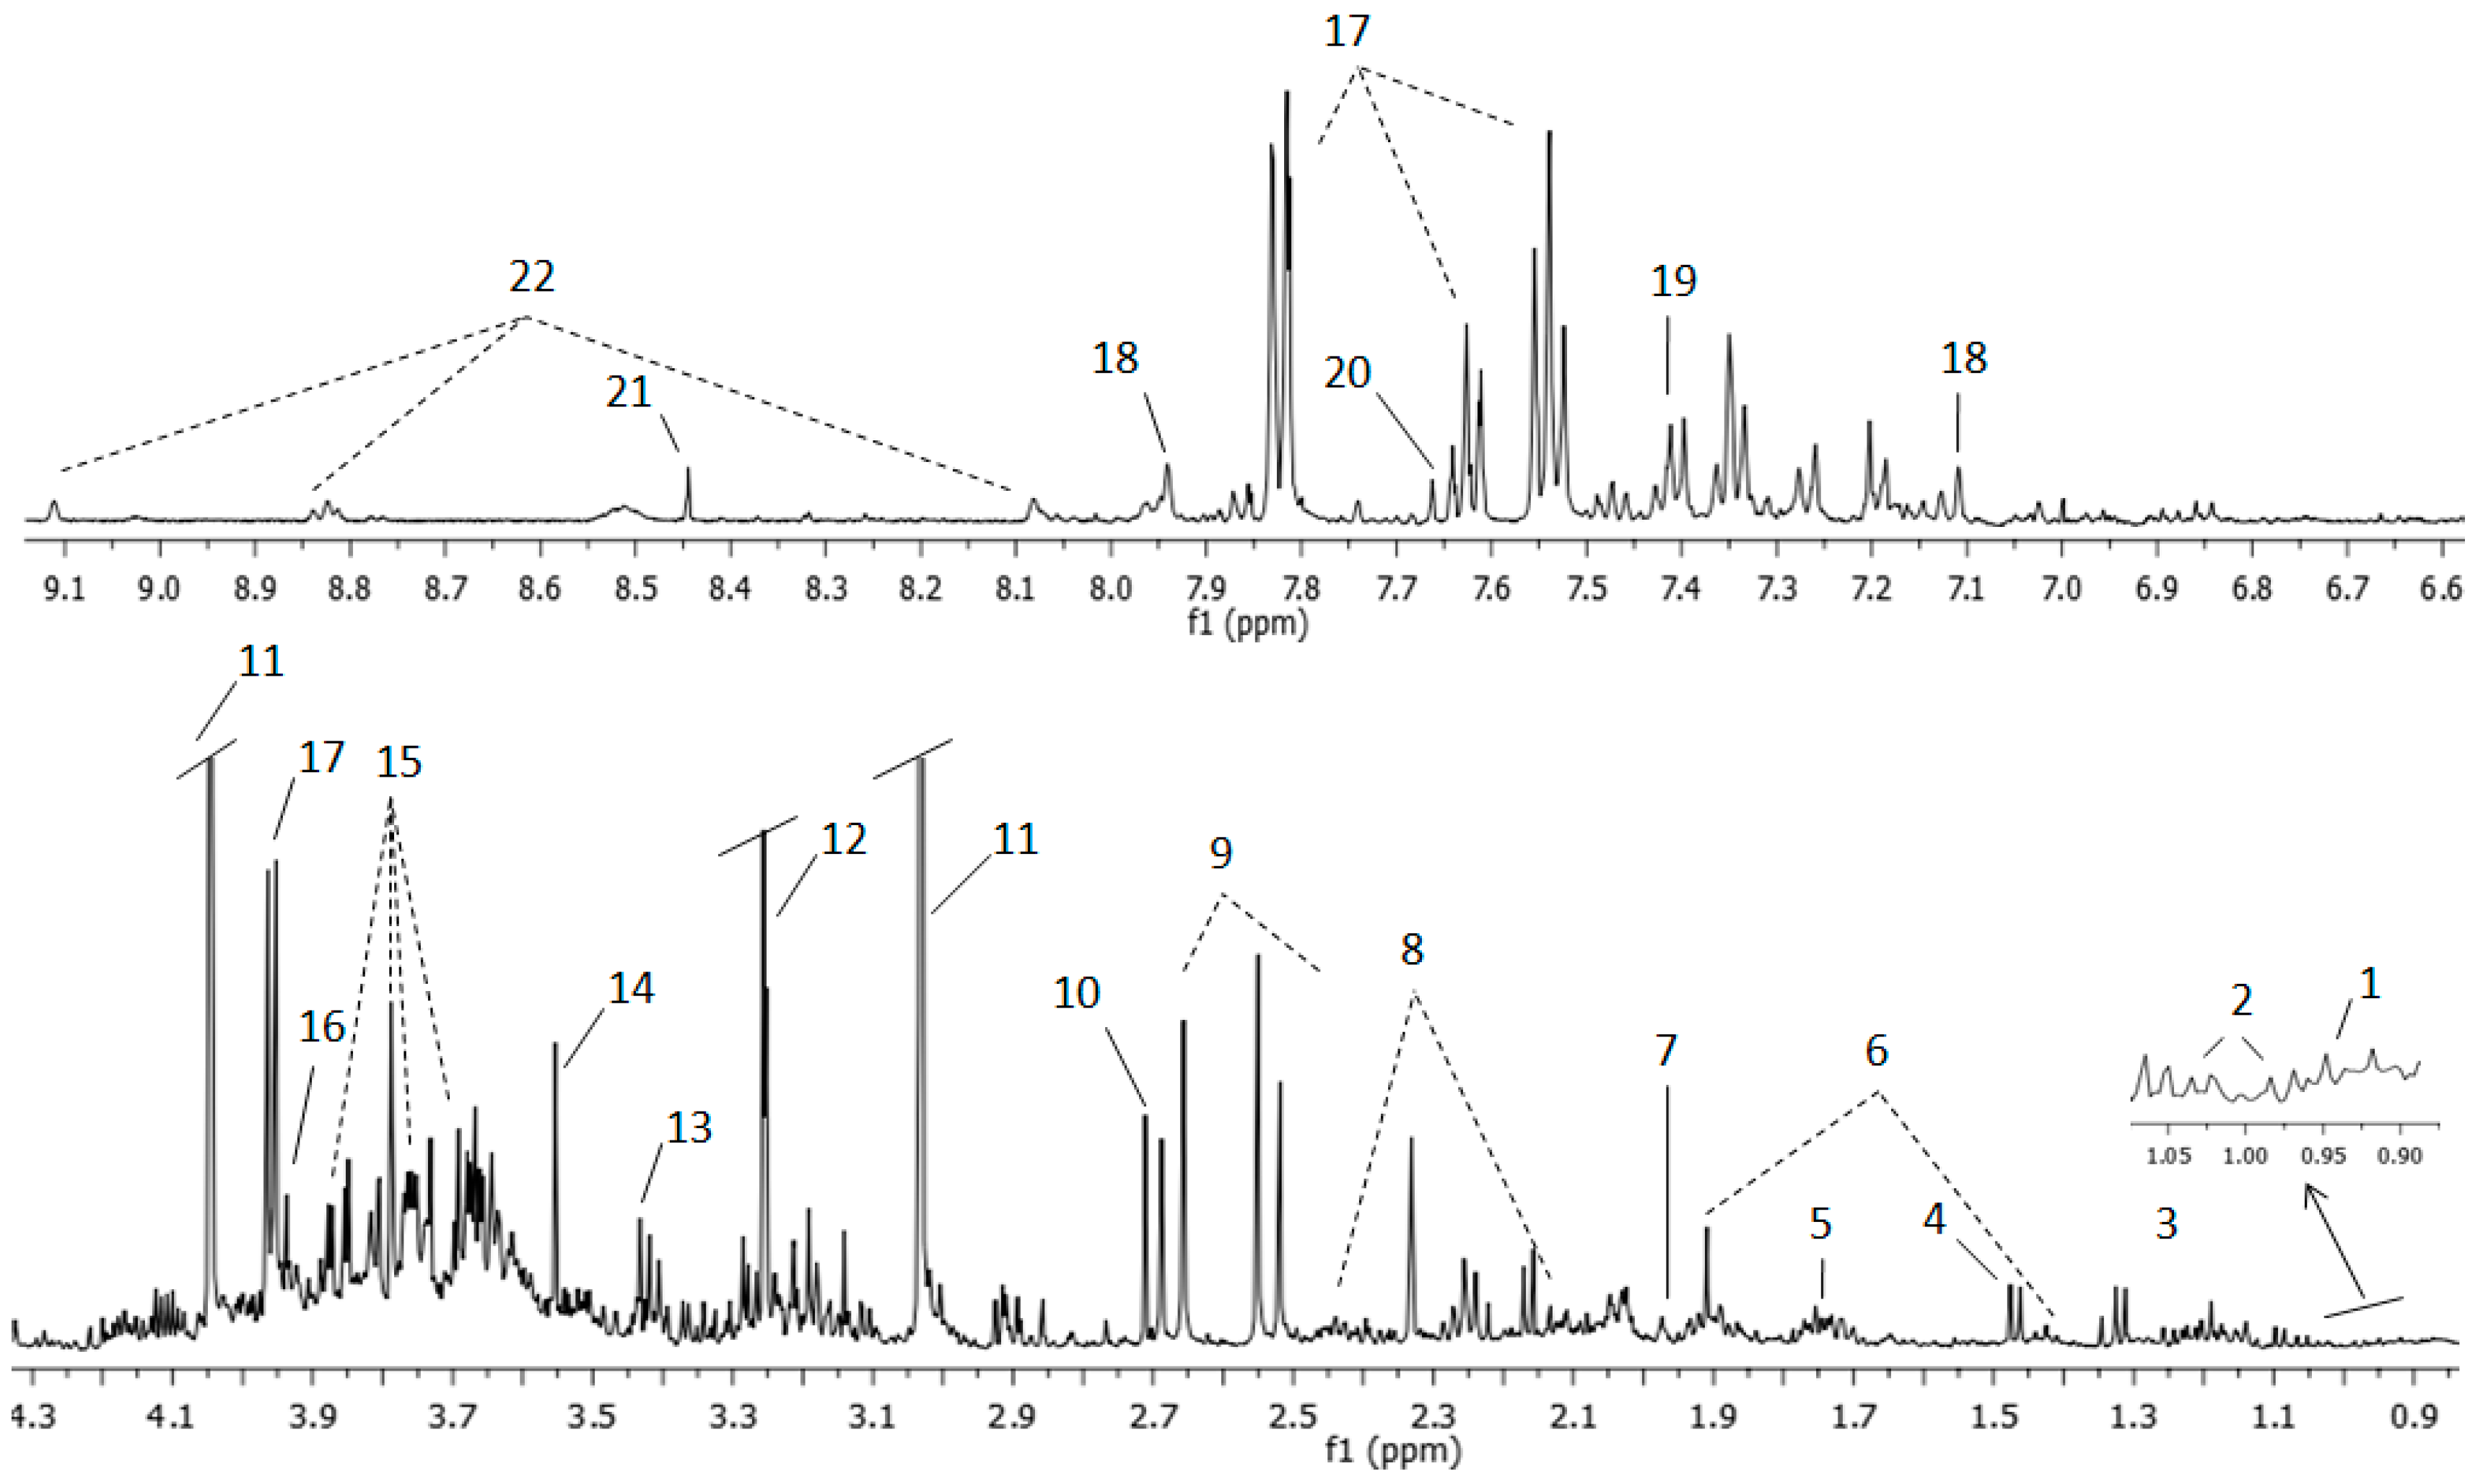
2.1. Urinary Metabolomic Profile in BC Patients
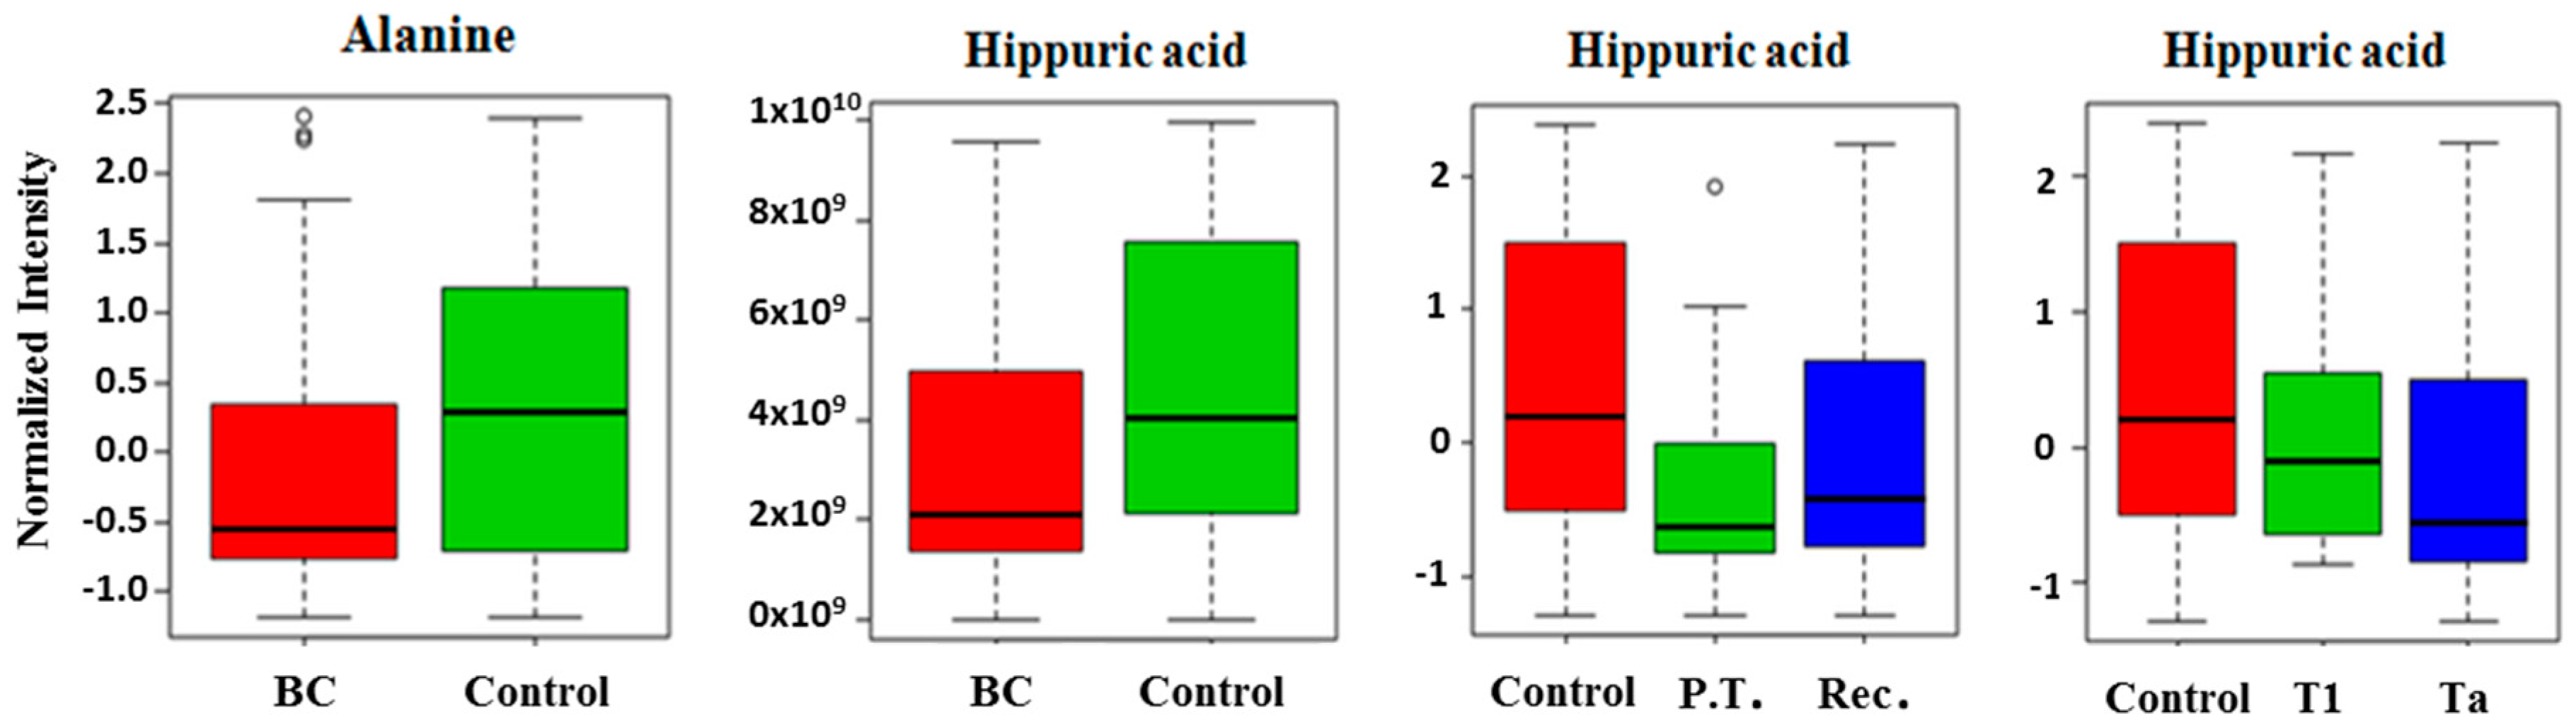
2.2. Comparison of Metabolites Detected in Urine
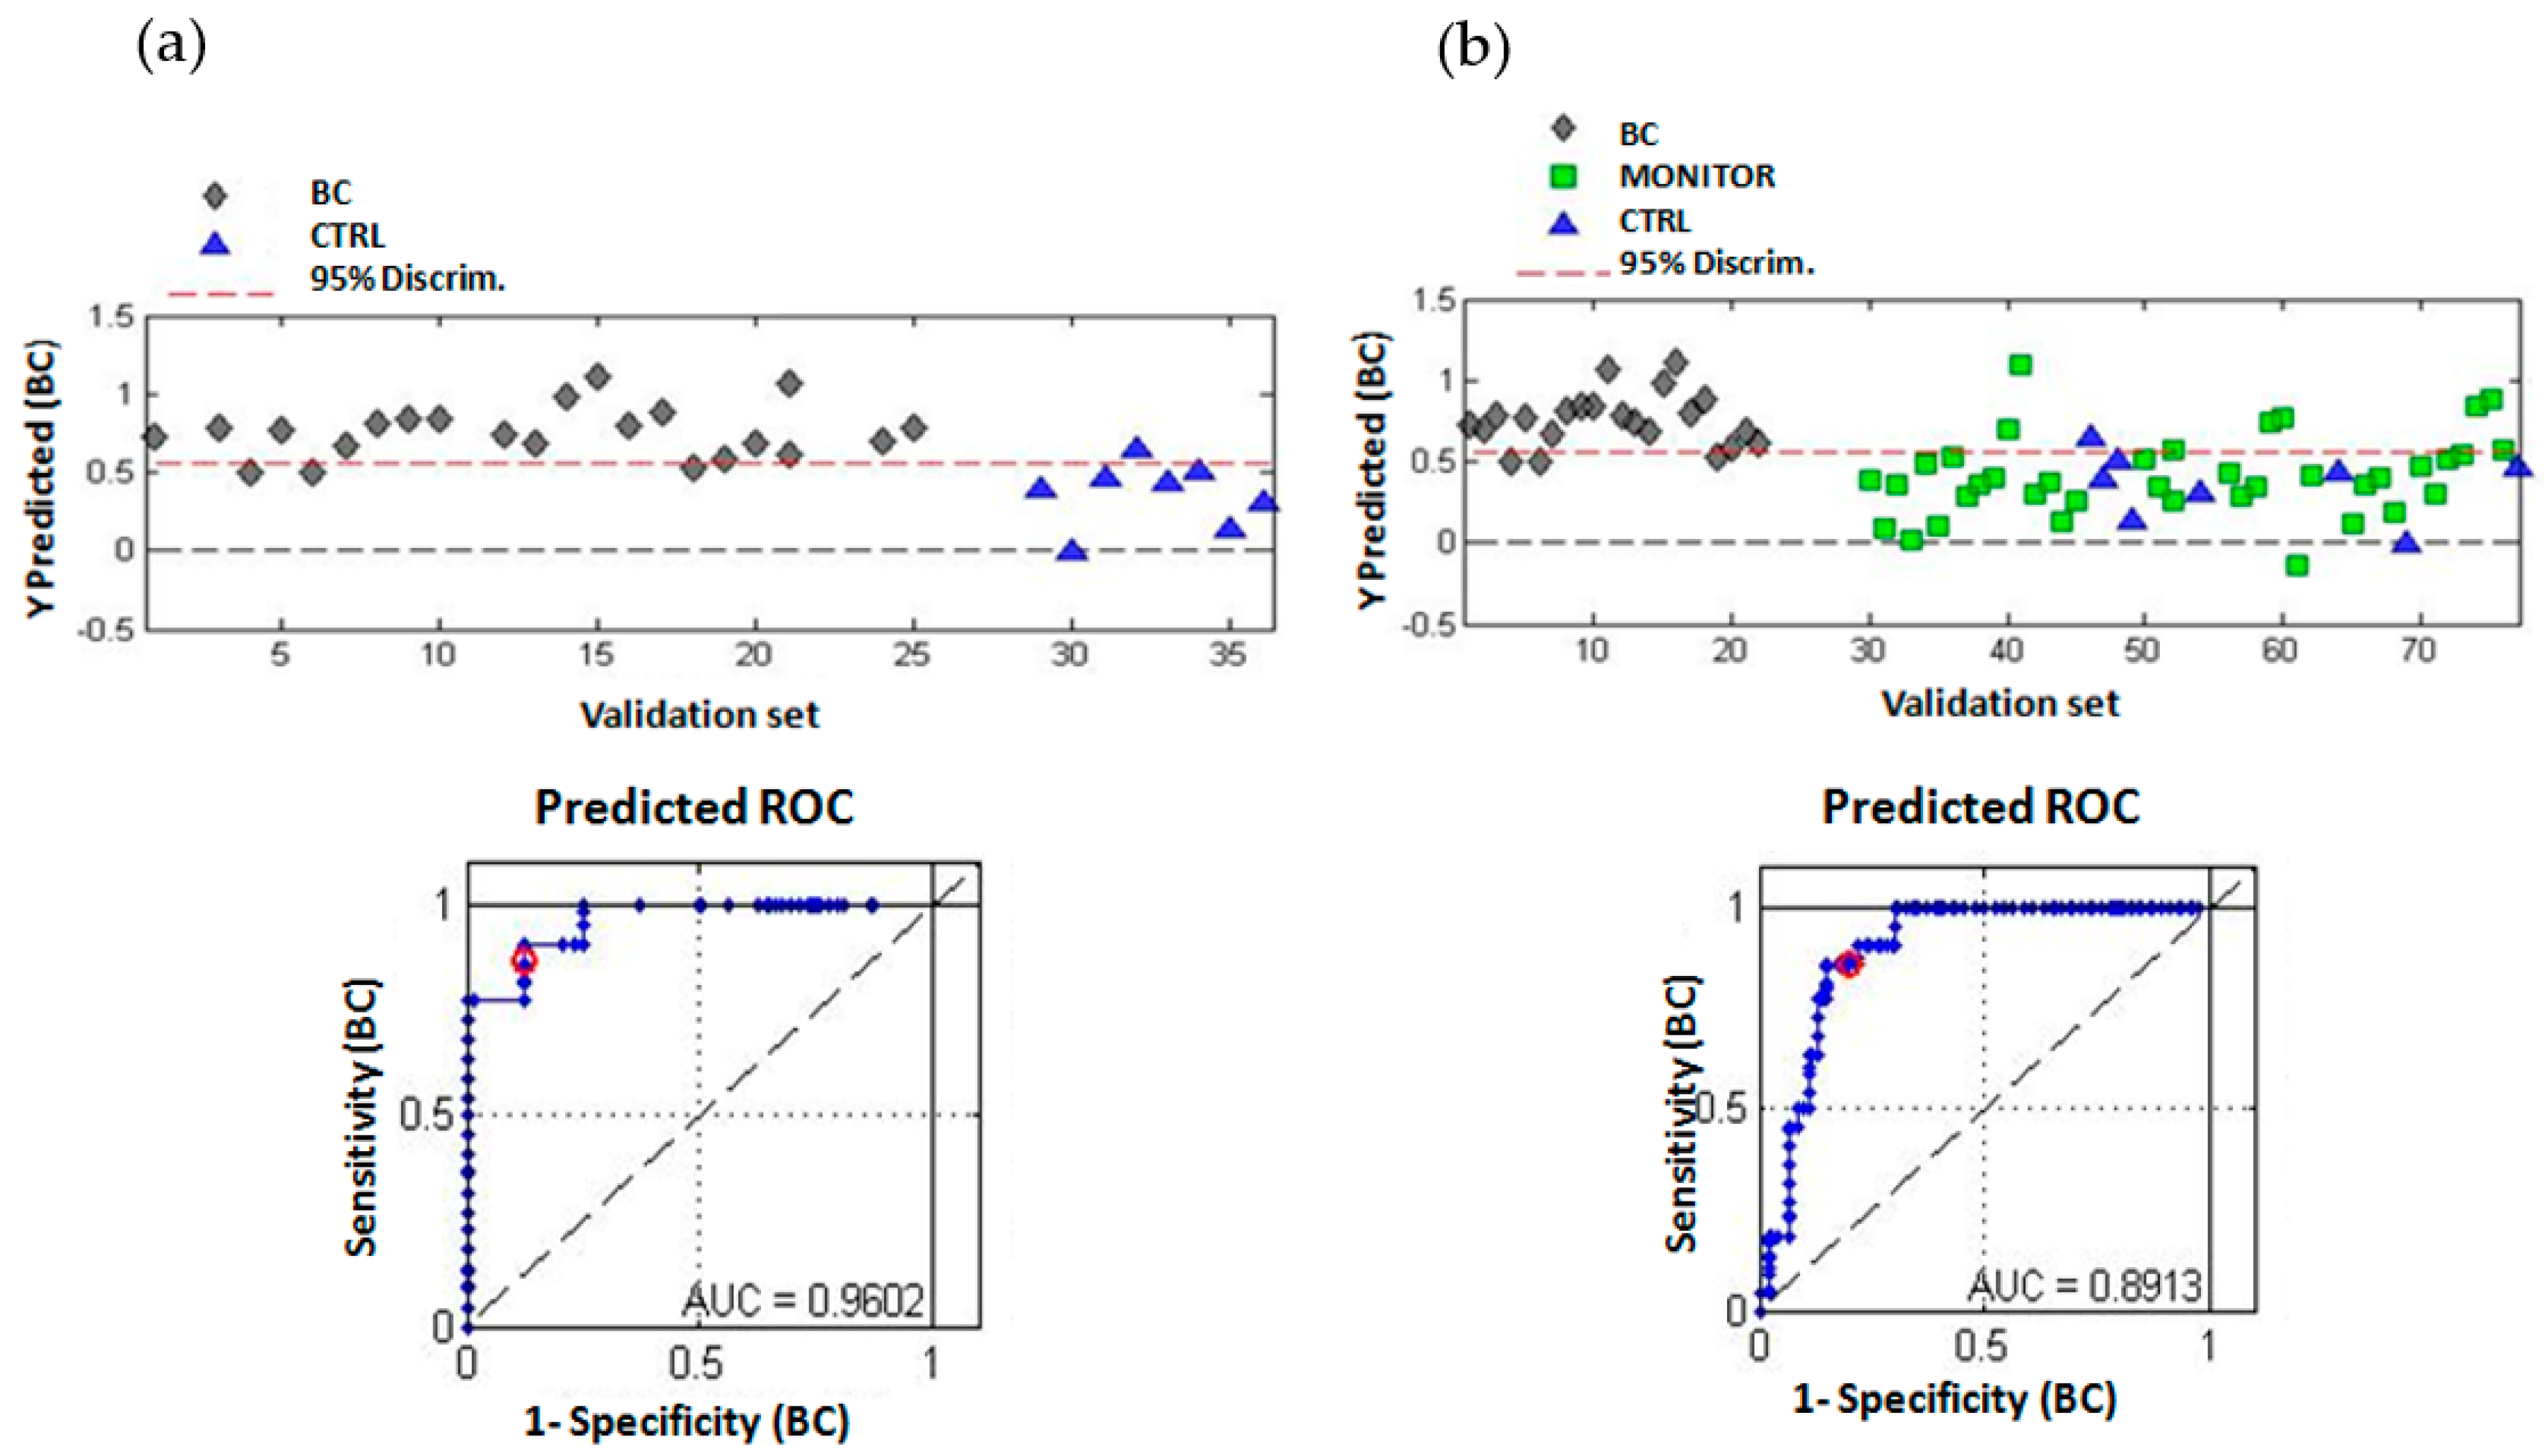
2.3. Multivariate Analysis of the Urinary Metabolomic Profiles
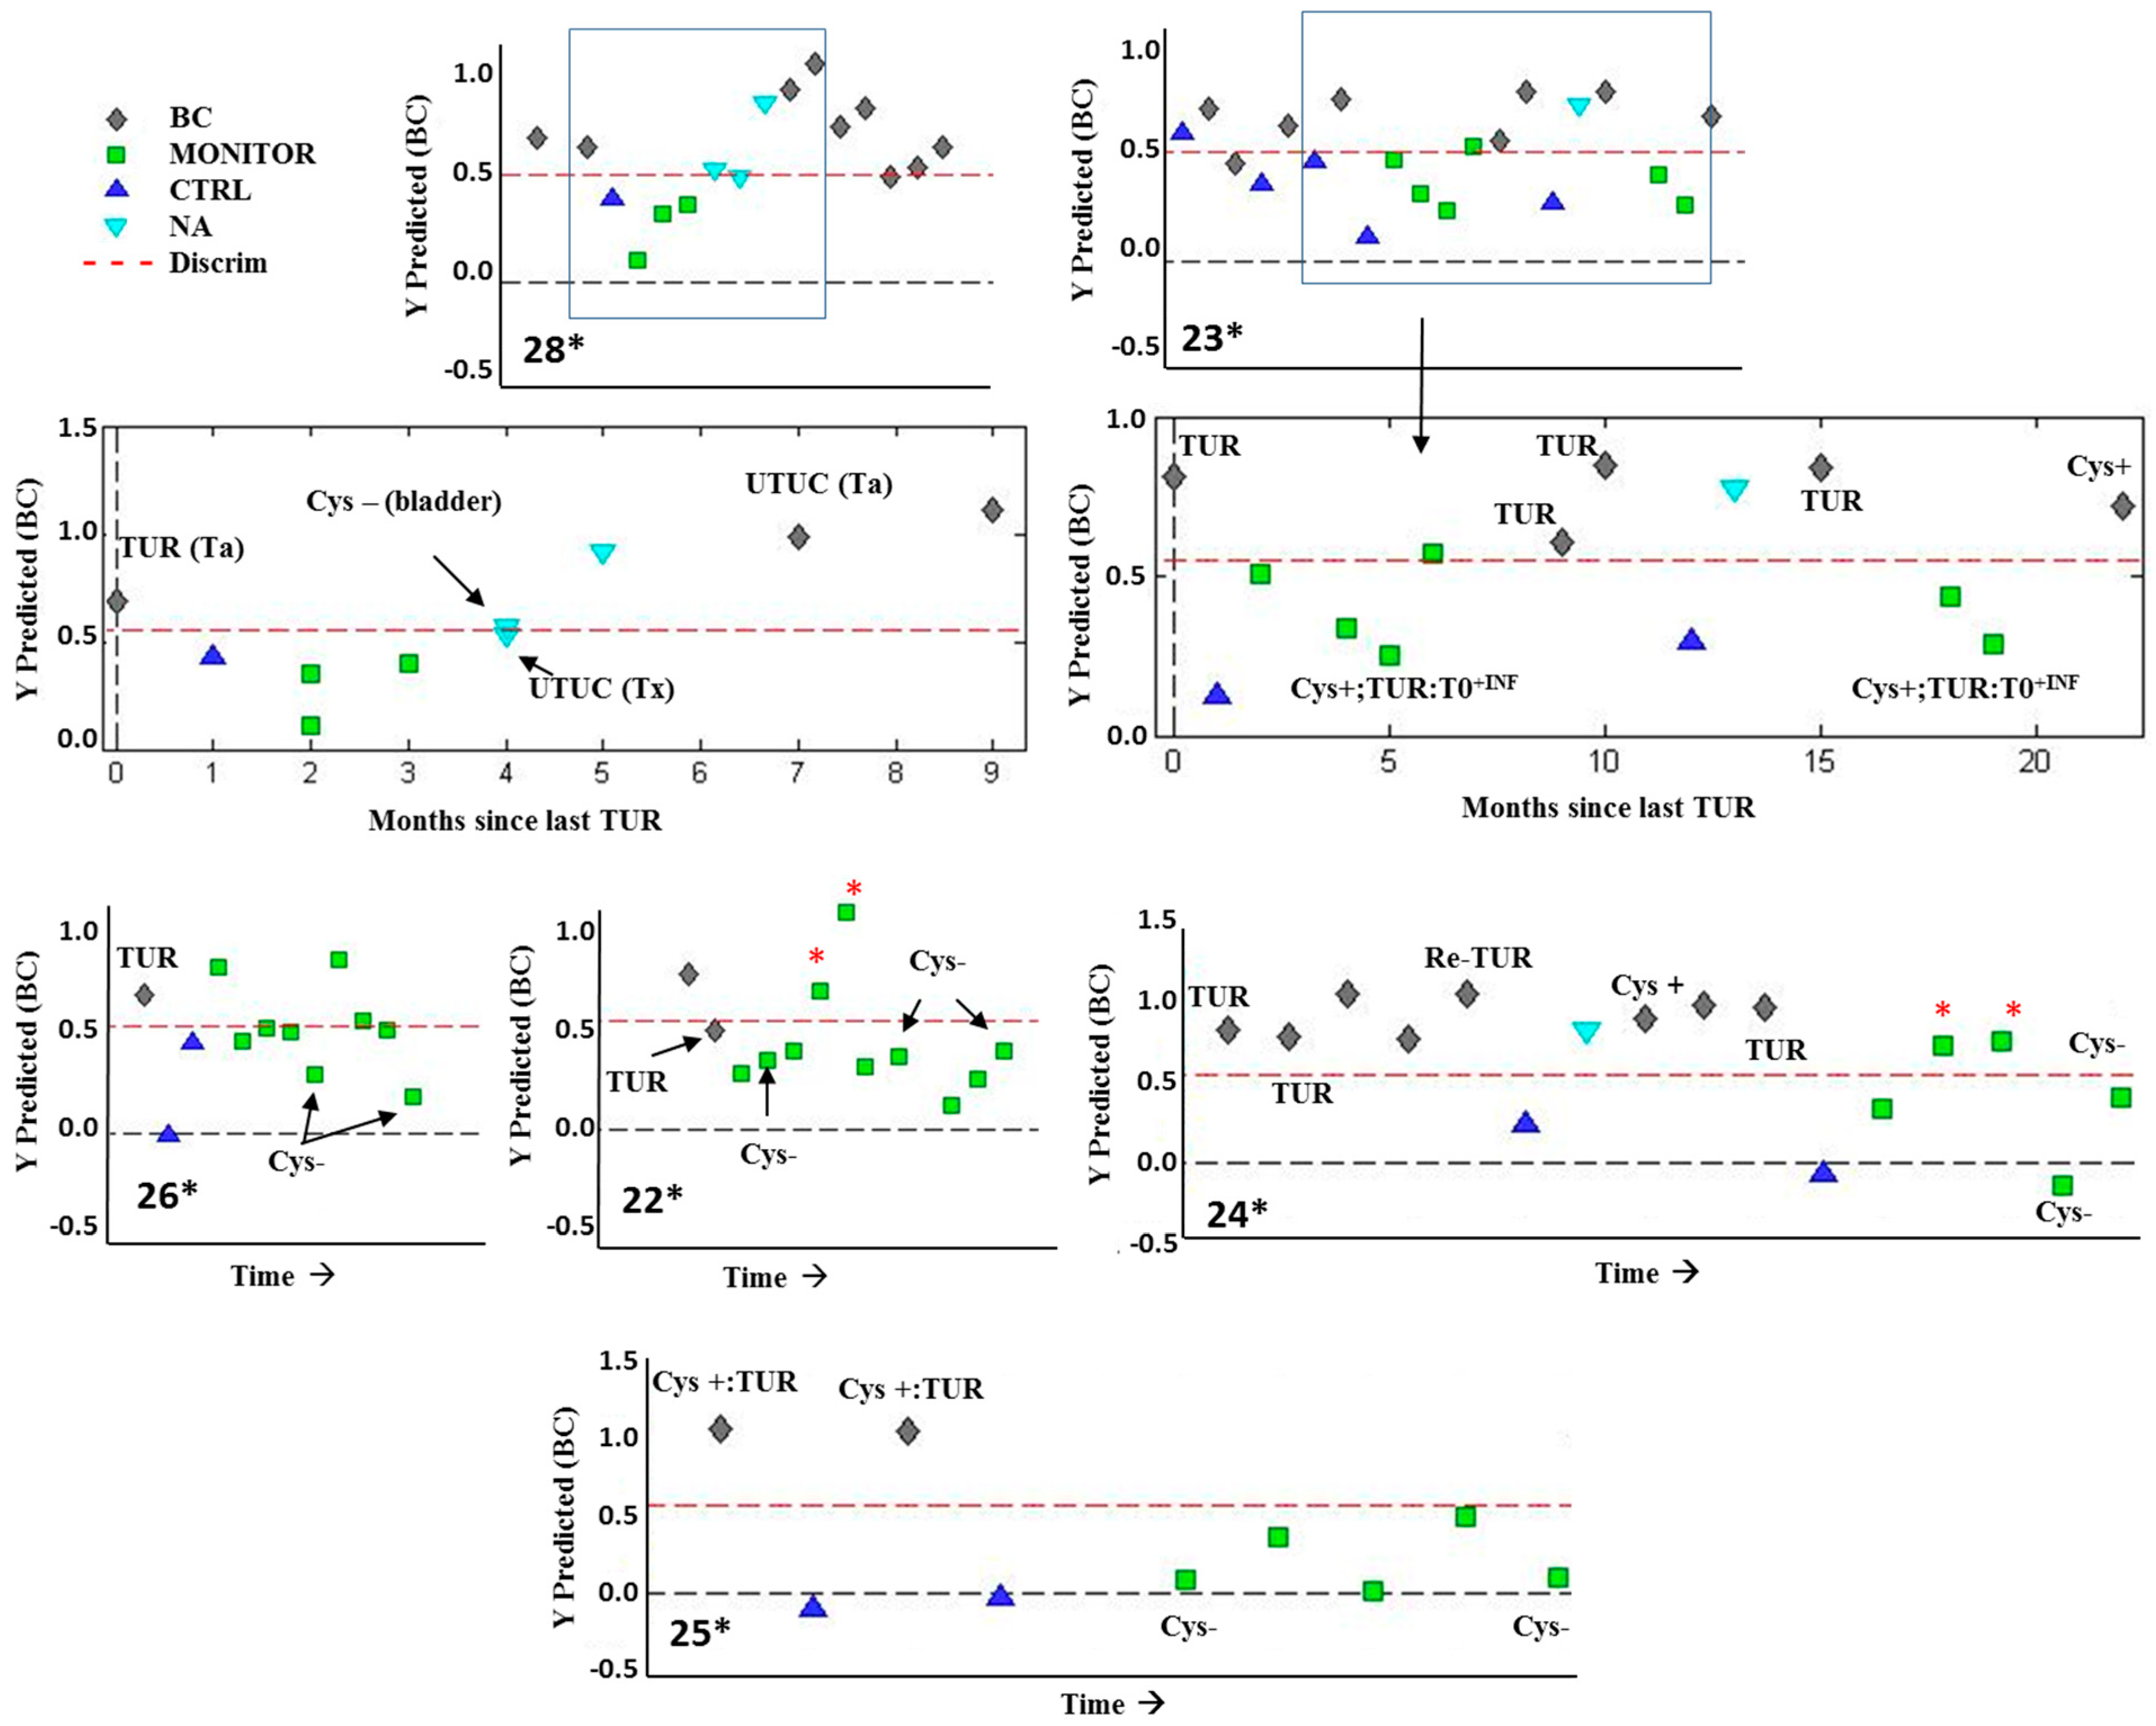
2.4. Analysis of Changes in the Metabolic Profile during the Follow-Up Period of NMIBC Patients
3. Discussion
4. Materials and Methods
4.1. Patient Selection and Study Design
4.2. Sample Preparation and 1H NMR Acquisition
4.3. 1H NMR Spectra Pre-Processing and Metabolite Assignment
4.4. Data Analysis
5. Conclusions
Supplementary Materials
Author Contributions
Funding
Acknowledgments
Conflicts of Interest
References
- Ferlay, J.; Soerjomataram, I.; Dikshit, R.; Eser, S.; Mathers, C.; Rebelo, M.; Parkin, D.M.; Forman, D.; Bray, F. Cancer incidence and mortality worldwide: Sources, methods and major patterns in GLOBOCAN 2012. Int. J. Cancer 2015, 136, E359–E386. [Google Scholar] [CrossRef] [PubMed]
- Burger, M.; Catto, J.W.F.; Dalbagni, G.; Grossman, H.B.; Herr, H.; Karakiewicz, P.; Kassouf, W.; Kiemeney, L.A.; La Vecchia, C.; Shariat, S.; et al. Epidemiology and Risk Factors of Urothelial Bladder Cancer. Eur. Urol. 2013, 63, 234–241. [Google Scholar] [CrossRef] [PubMed]
- Van Rhijn, B.W.G.; Burger, M.; Lotan, Y.; Solsona, E.; Stief, C.G.; Sylvester, R.J.; Witjes, J.A.; Zlotta, A.R. Recurrence and Progression of Disease in Non–Muscle-Invasive Bladder Cancer: From Epidemiology to Treatment Strategy. Eur. Urol. 2009, 56, 430–442. [Google Scholar] [CrossRef] [PubMed]
- Babjuk, M.; Böhle, A.; Burger, M.; Capoun, O.; Cohen, D.; Compérat, E.M.; Hernández, V.; Kaasinen, E.; Palou, J.; Rouprêt, M.; et al. EAU Guidelines on Non–Muscle-invasive Urothelial Carcinoma of the Bladder: Update 2016. Eur. Urol. 2017, 71, 447–461. [Google Scholar] [CrossRef] [PubMed]
- Rosser, C.J.; Urquidi, V.; Goodison, S. Urinary biomarkers of bladder cancer: An update and future perspectives. Biomark. Med. 2013, 7, 779–790. [Google Scholar] [CrossRef]
- Su, H.; Jiang, H.; Tao, T.; Kang, X.; Zhang, X.; Kang, D.; Li, S.; Li, C.; Wang, H.; Yang, Z.; et al. Hope and challenge: Precision medicine in bladder cancer. Cancer Med. 2019, 8, 1806–1816. [Google Scholar] [CrossRef] [PubMed]
- Mbeutcha, A.; Lucca, I.; Mathieu, R.; Lotan, Y.; Shariat, S.F. Current Status of Urinary Biomarkers for Detection and Surveillance of Bladder Cancer. Urol. Clin. North Am. 2016, 43, 47–62. [Google Scholar] [CrossRef]
- Lodewijk, I.; Dueñas, M.; Rubio, C.; Munera-Maravilla, E.; Segovia, C.; Bernardini, A.; Teijeira, A.; Paramio, J.M.; Suárez-Cabrera, C. Liquid Biopsy Biomarkers in Bladder Cancer: A Current Need for Patient Diagnosis and Monitoring. Int. J. Mol. Sci. 2018, 19, 2514. [Google Scholar] [CrossRef]
- Di Meo, A.; Bartlett, J.; Cheng, Y.; Pasic, M.D.; Yousef, G.M. Liquid biopsy: A step forward towards precision medicine in urologic malignancies. Mol. Cancer 2017, 16, 80. [Google Scholar] [CrossRef]
- Bardelli, A.; Pantel, K. Liquid Biopsies, What We Do Not Know (Yet). Cancer Cell 2017, 31, 172–179. [Google Scholar] [CrossRef]
- Bujak, R.; Struck-Lewicka, W.; Markuszewski, M.J.; Kaliszan, R. Metabolomics for laboratory diagnostics. J. Pharm. Biomed. Anal. 2015, 113, 108–120. [Google Scholar] [CrossRef] [PubMed]
- Feng, H.; Qin, Z.; Zhang, X. Opportunities and methods for studying alternative splicing in cancer with RNA-Seq. Cancer Lett. 2013, 340, 179–191. [Google Scholar] [CrossRef] [PubMed]
- Patel, S.; Ahmed, S. Emerging field of metabolomics: Big promise for cancer biomarker identification and drug discovery. J. Pharm. Biomed. Anal. 2015, 107, 63–74. [Google Scholar] [CrossRef] [PubMed]
- Emwas, A.-H.M.; Salek, R.M.; Griffin, J.L.; Merzaban, J. NMR-based metabolomics in human disease diagnosis: Applications, limitations, and recommendations. Metabolomics 2013, 9, 1048–1072. [Google Scholar] [CrossRef]
- Ladurner, A.G. Rheostat Control of Gene Expression by Metabolites. Mol. Cell 2006, 24, 1–11. [Google Scholar] [CrossRef] [PubMed]
- Burgio, G.; Onorati, M.C.; Corona, D.F.V. Chromatin remodeling regulation by small molecules and metabolites. Biochim. Biophys. Acta - Gene Regul. Mech. 2010, 1799, 671–680. [Google Scholar] [CrossRef] [PubMed][Green Version]
- Kaushik, A.K.; DeBerardinis, R.J. Applications of metabolomics to study cancer metabolism. Biochim. Biophys. Acta - Rev. Cancer 2018, 1870, 2–14. [Google Scholar] [CrossRef]
- Issaq, H.J.; Waybright, T.J.; Veenstra, T.D. Cancer biomarker discovery: Opportunities and pitfalls in analytical methods. Electrophoresis 2011, 32, 967–975. [Google Scholar] [CrossRef]
- Cheng, Y.; Yang, X.; Deng, X.; Zhang, X.; Li, P.; Tao, J.; Qin, C.; Wei, J.; Lu, Q. Metabolomics in bladder cancer: A systematic review. Int. J. Clin. Exp. Med. 2015, 8, 11052–11063. [Google Scholar]
- Issaq, H.J.; Nativ, O.; Waybright, T.; Luke, B.; Veenstra, T.D.; Issaq, E.J.; Kravstov, A.; Mullerad, M. Detection of bladder cancer in human urine by metabolomic profiling using high performance liquid chromatography/mass spectrometry. J. Urol. 2008, 179, 2422–2426. [Google Scholar] [CrossRef]
- Shao, C.-H.; Chen, C.-L.; Lin, J.-Y.; Chen, C.-J.; Fu, S.-H.; Chen, Y.-T.; Chang, Y.-S.; Yu, J.-S.; Tsui, K.-H.; Juo, C.-G.; et al. Metabolite marker discovery for the detection of bladder cancer by comparative metabolomics. Oncotarget 2017, 8, 38802–38810. [Google Scholar] [CrossRef] [PubMed]
- Zhang, W.-T.; Zhang, Z.-W.; Guo, Y.-D.; Wang, L.-S.; Mao, S.-Y.; Zhang, J.-F.; Liu, M.-N.; Yao, X.-D. Discovering biomarkers in bladder cancer by metabolomics. Biomark. Med. 2018, 12, 1347–1359. [Google Scholar] [CrossRef] [PubMed]
- Loras, A.; Trassierra, M.; Sanjuan-Herráez, D.; Martínez-Bisbal, M.C.; Castell, J.V.; Quintás, G.; Ruiz-Cerdá, J.L. Bladder cancer recurrence surveillance by urine metabolomics analysis. Sci. Rep. 2018, 8, 9172. [Google Scholar] [CrossRef] [PubMed]
- Loras, A.; Suárez-Cabrera, C.; Martínez-Bisbal, M.C.; Quintás, G.; Paramio, J.M.; Martínez-Máñez, R.; Gil, S.; Ruiz-Cerdá, J.L.; Loras, A.; Suárez-Cabrera, C.; et al. Integrative Metabolomic and Transcriptomic Analysis for the Study of Bladder Cancer. Cancers 2019, 11, 686. [Google Scholar] [CrossRef] [PubMed]
- Hong, Y.; Esuvaranathan, K.; Pasikanti, K.K.; Yong Chan, E.C. Metabonomic diagnosis of bladder cancer: What are the advantages and considerations? Bioanalysis 2015, 7, 2727–2729. [Google Scholar] [CrossRef] [PubMed]
- Hanahan, D.; Weinberg, R.A. Hallmarks of cancer: The next generation. Cell 2011, 144, 646–674. [Google Scholar] [CrossRef]
- Giskeødegård, G.F.; Bertilsson, H.; Selnæs, K.M.; Wright, A.J.; Bathen, T.F.; Viset, T.; Halgunset, J.; Angelsen, A.; Gribbestad, I.S.; Tessem, M.-B. Spermine and Citrate as Metabolic Biomarkers for Assessing Prostate Cancer Aggressiveness. PLoS ONE 2013, 8, e62375. [Google Scholar] [CrossRef] [PubMed]
- El Agouza, I.M.; Eissa, S.S.; El Houseini, M.M.; El-Nashar, D.E.; Abd El Hameed, O.M. Taurine: A novel tumor marker for enhanced detection of breast cancer among female patients. Angiogenesis 2011, 14, 321–330. [Google Scholar] [CrossRef]
- Bishnu, A.; Sakpal, A.; Ghosh, N.; Choudhury, P.; Chaudhury, K.; Ray, P. Long term treatment of metformin impedes development of chemoresistance by regulating cancer stem cell differentiation through taurine generation in ovarian cancer cells. Int. J. Biochem. Cell Biol. 2019, 107, 116–127. [Google Scholar] [CrossRef]
- Pavlova, N.N.; Thompson, C.B. The Emerging Hallmarks of Cancer Metabolism. Cell Metab. 2016, 23, 27–47. [Google Scholar] [CrossRef]
- Balendiran, G.K.; Dabur, R.; Fraser, D. The role of glutathione in cancer. Cell Biochem. Funct. 2004, 22, 343–352. [Google Scholar] [CrossRef] [PubMed]
- Singer, K.; Cheng, W.-C.; Kreutz, M.; Ho, P.-C.; Siska, P.J. Immunometabolism in cancer at a glance. Dis. Model. Mech. 2018, 11, 1–10. [Google Scholar] [CrossRef] [PubMed]
- Srivastava, S.; Roy, R.; Singh, S.; Kumar, P.; Dalela, D.; Sankhwar, S.N.; Goel, A.; Sonkar, A.A. Taurine - a possible fingerprint biomarker in non-muscle invasive bladder cancer: A pilot study by 1H NMR spectroscopy. Cancer Biomark. 2010, 6, 11–20. [Google Scholar] [CrossRef] [PubMed]
- Gamagedara, S.; Shi, H.; Ma, Y. Quantitative determination of taurine and related biomarkers in urine by liquid chromatography–tandem mass spectrometry. Anal. Bioanal. Chem. 2012, 402, 763–770. [Google Scholar] [CrossRef] [PubMed]
- Kim, J.-W.; Lee, G.; Moon, S.-M.; Park, M.-J.; Hong, S.K.; Ahn, Y.-H.; Kim, K.-R.; Paik, M.-J. Metabolomic screening and star pattern recognition by urinary amino acid profile analysis from bladder cancer patients. Metabolomics 2010, 6, 202–206. [Google Scholar] [CrossRef]
- Beckonert, O.; Keun, H.C.; Ebbels, T.M.D.; Bundy, J.; Holmes, E.; Lindon, J.C.; Nicholson, J.K. Metabolic profiling, metabolomic and metabonomic procedures for NMR spectroscopy of urine, plasma, serum and tissue extracts. Nat. Protoc. 2007, 2, 2692–2703. [Google Scholar] [CrossRef] [PubMed]
- Bouatra, S.; Aziat, F.; Mandal, R.; Guo, A.C.; Wilson, M.R.; Knox, C.; Bjorndahl, T.C.; Krishnamurthy, R.; Saleem, F.; Liu, P.; et al. The Human Urine Metabolome. PLoS ONE 2013, 8, e73076. [Google Scholar] [CrossRef]
- Cao, M.; Zhao, L.; Chen, H.; Xue, W.; Lin, D. NMR-based metabolomic analysis of human bladder cancer. Anal. Sci. 2012, 28, 451–456. [Google Scholar] [CrossRef]
- Moestue, S.; Sitter, B.; Frost Bathen, T.; Tessem, M.-B.; Susann Gribbestad, I. HR MAS MR Spectroscopy in Metabolic Characterization of Cancer. Curr. Top. Med. Chem. 2011, 11, 2–26. [Google Scholar] [CrossRef]
- Martínez-Bisbal, M.C.; Martí-Bonmatí, L.; Piquer, J.; Revert, A.; Ferrer, P.; Llácer, J.L.; Piotto, M.; Assemat, O.; Celda, B. 1H and 13C HR-MAS spectroscopy of intact biopsy samples ex vivo and in vivo 1H MRS study of human high grade gliomas. NMR Biomed. 2004, 17, 191–205. [Google Scholar] [CrossRef]
- Wishart, D.S.; Feunang, Y.D.; Marcu, A.; Guo, A.C.; Liang, K.; Vázquez-Fresno, R.; Sajed, T.; Johnson, D.; Li, C.; Karu, N.; et al. HMDB 4.0: The human metabolome database for 2018. Nucleic Acids Res. 2018, 46, 608–617. [Google Scholar] [CrossRef] [PubMed]
- Lundberg, P.; Vogel, T.; Malusek, A.; Lundquist, P.-O.; Cohen, L.; Dahlqvist, O. MDL—The Magnetic Resonance Metabolomics Database. Available online: https://liu.se/hu/mdl/main/ (accessed on 27 May 2019).
- Xia, J.; Sinelnikov, I.V.; Han, B.; Wishart, D.S. MetaboAnalyst 3.0--making metabolomics more meaningful. Nucleic Acids Res. 2015, 43, 251–257. [Google Scholar] [CrossRef] [PubMed]


| Number Assignment | Metabolite | Group | Chemical Shift ppm |
|---|---|---|---|
| 1 | Leucine | CH3 | 0.94 |
| 2 | Valine | γCH3 | 0.98 |
| 2 | Valine | γCH3 | 1.03 |
| 3 | Lactate | CH3 | 1.32 |
| 6 | Lysine | γCH2 | 1.43 |
| 4 | Alanine | βCH3 | 1.47 |
| 6 | Lysine | βCH2 | 1.71 |
| 7 | Acetic acid | CH3 | 1.97 |
| 6 | Lysine | βCH2 | 1.91 |
| 8 | Glutamine | βCH2 | 2.13 |
| 8 | Glutamine | γCH2 | 2.44 |
| 9 | Citrate | CH2 | 2.51 |
| 9 | Citrate | CH2 | 2.65 |
| 10 | Dimethylamine | CH3 | 2.71 |
| 11 | Creatinine | CH3 | 3.03 |
| 13 | Taurine | -CH2-NH3+ | 3.25 |
| 12 | Trimethylamine N-oxide | CH3 | 3.29 |
| 13 | Taurine | -CH2-SO3- | 3.42 |
| 14 | Glycine | αCH | 3.55 |
| 15 | Sucrose | C6′H2 | 3.81 |
| 15 | Sucrose | C5′H | 3.87 |
| 16 | Creatine | CH2 | 3.92 |
| 17 | Hippuric acid | αCH2 | 3.96 |
| 11 | Creatinine | CH2 | 4.05 |
| 18 | Histidine | CH | 7.09 |
| 19 | Phenylalanine | C2′6H | 7.33 |
| 19 | Phenylalanine | C3′5H | 7.41 |
| 17 | Hippuric acid | C3′5H | 7.63 |
| 20 | Pseudouridine | CH | 7.66 |
| 17 | Hippuric acid | C2′6H | 7.82 |
| 18 | Histidine | CH | 7.93 |
| 21 | Formic acid | CH | 8.45 |
| 22 | Trigonelline | C3′5H | 8.82 |
| 22 | Trigonelline | C1′H | 9.11 |
| Indices Test Validity | Calibration Set (BC vs. CTRL) | Validation Set (BC vs. CTRL) | Validation Set (BC vs. MONITOR + CTRL) |
|---|---|---|---|
| True prevalence | 69.6% | 73.3% | 31.9% |
| Sensitivity | 81.3% (68.1–89.8%) | 86.4% (66.7–95.3%) | 86.4% (66.7–95.3%) |
| Specificity | 66.7% (45.4–82.8%) | 87.5% (52.9–97.8%) | 80.9% (67.5–89.6%) |
| PPV a | 84.8% (71.8–92.4%) | 95.0% (76.4–9.1%) | 67.9% (49.3–2.1%) |
| NPV b | 60.9% (40.8–77.8%) | 70.0% (39.7–9.2%) | 92.7% (80.6–97.5%) |
| ACC c | 76.8% (65.6–5.2%) | 86.7% (70.3–4.7%) | 82.6% (72.0–9.8%) |
| PLR d | 2.44 (1.31–4.53) | 6.91 (1.10–43.54) | 4.51 (2.45–8.3) |
| NLR e | 0.28 (0.15–0.52) | 0.16 (0.05–0.45) | 0.17 (0.06–0.49) |
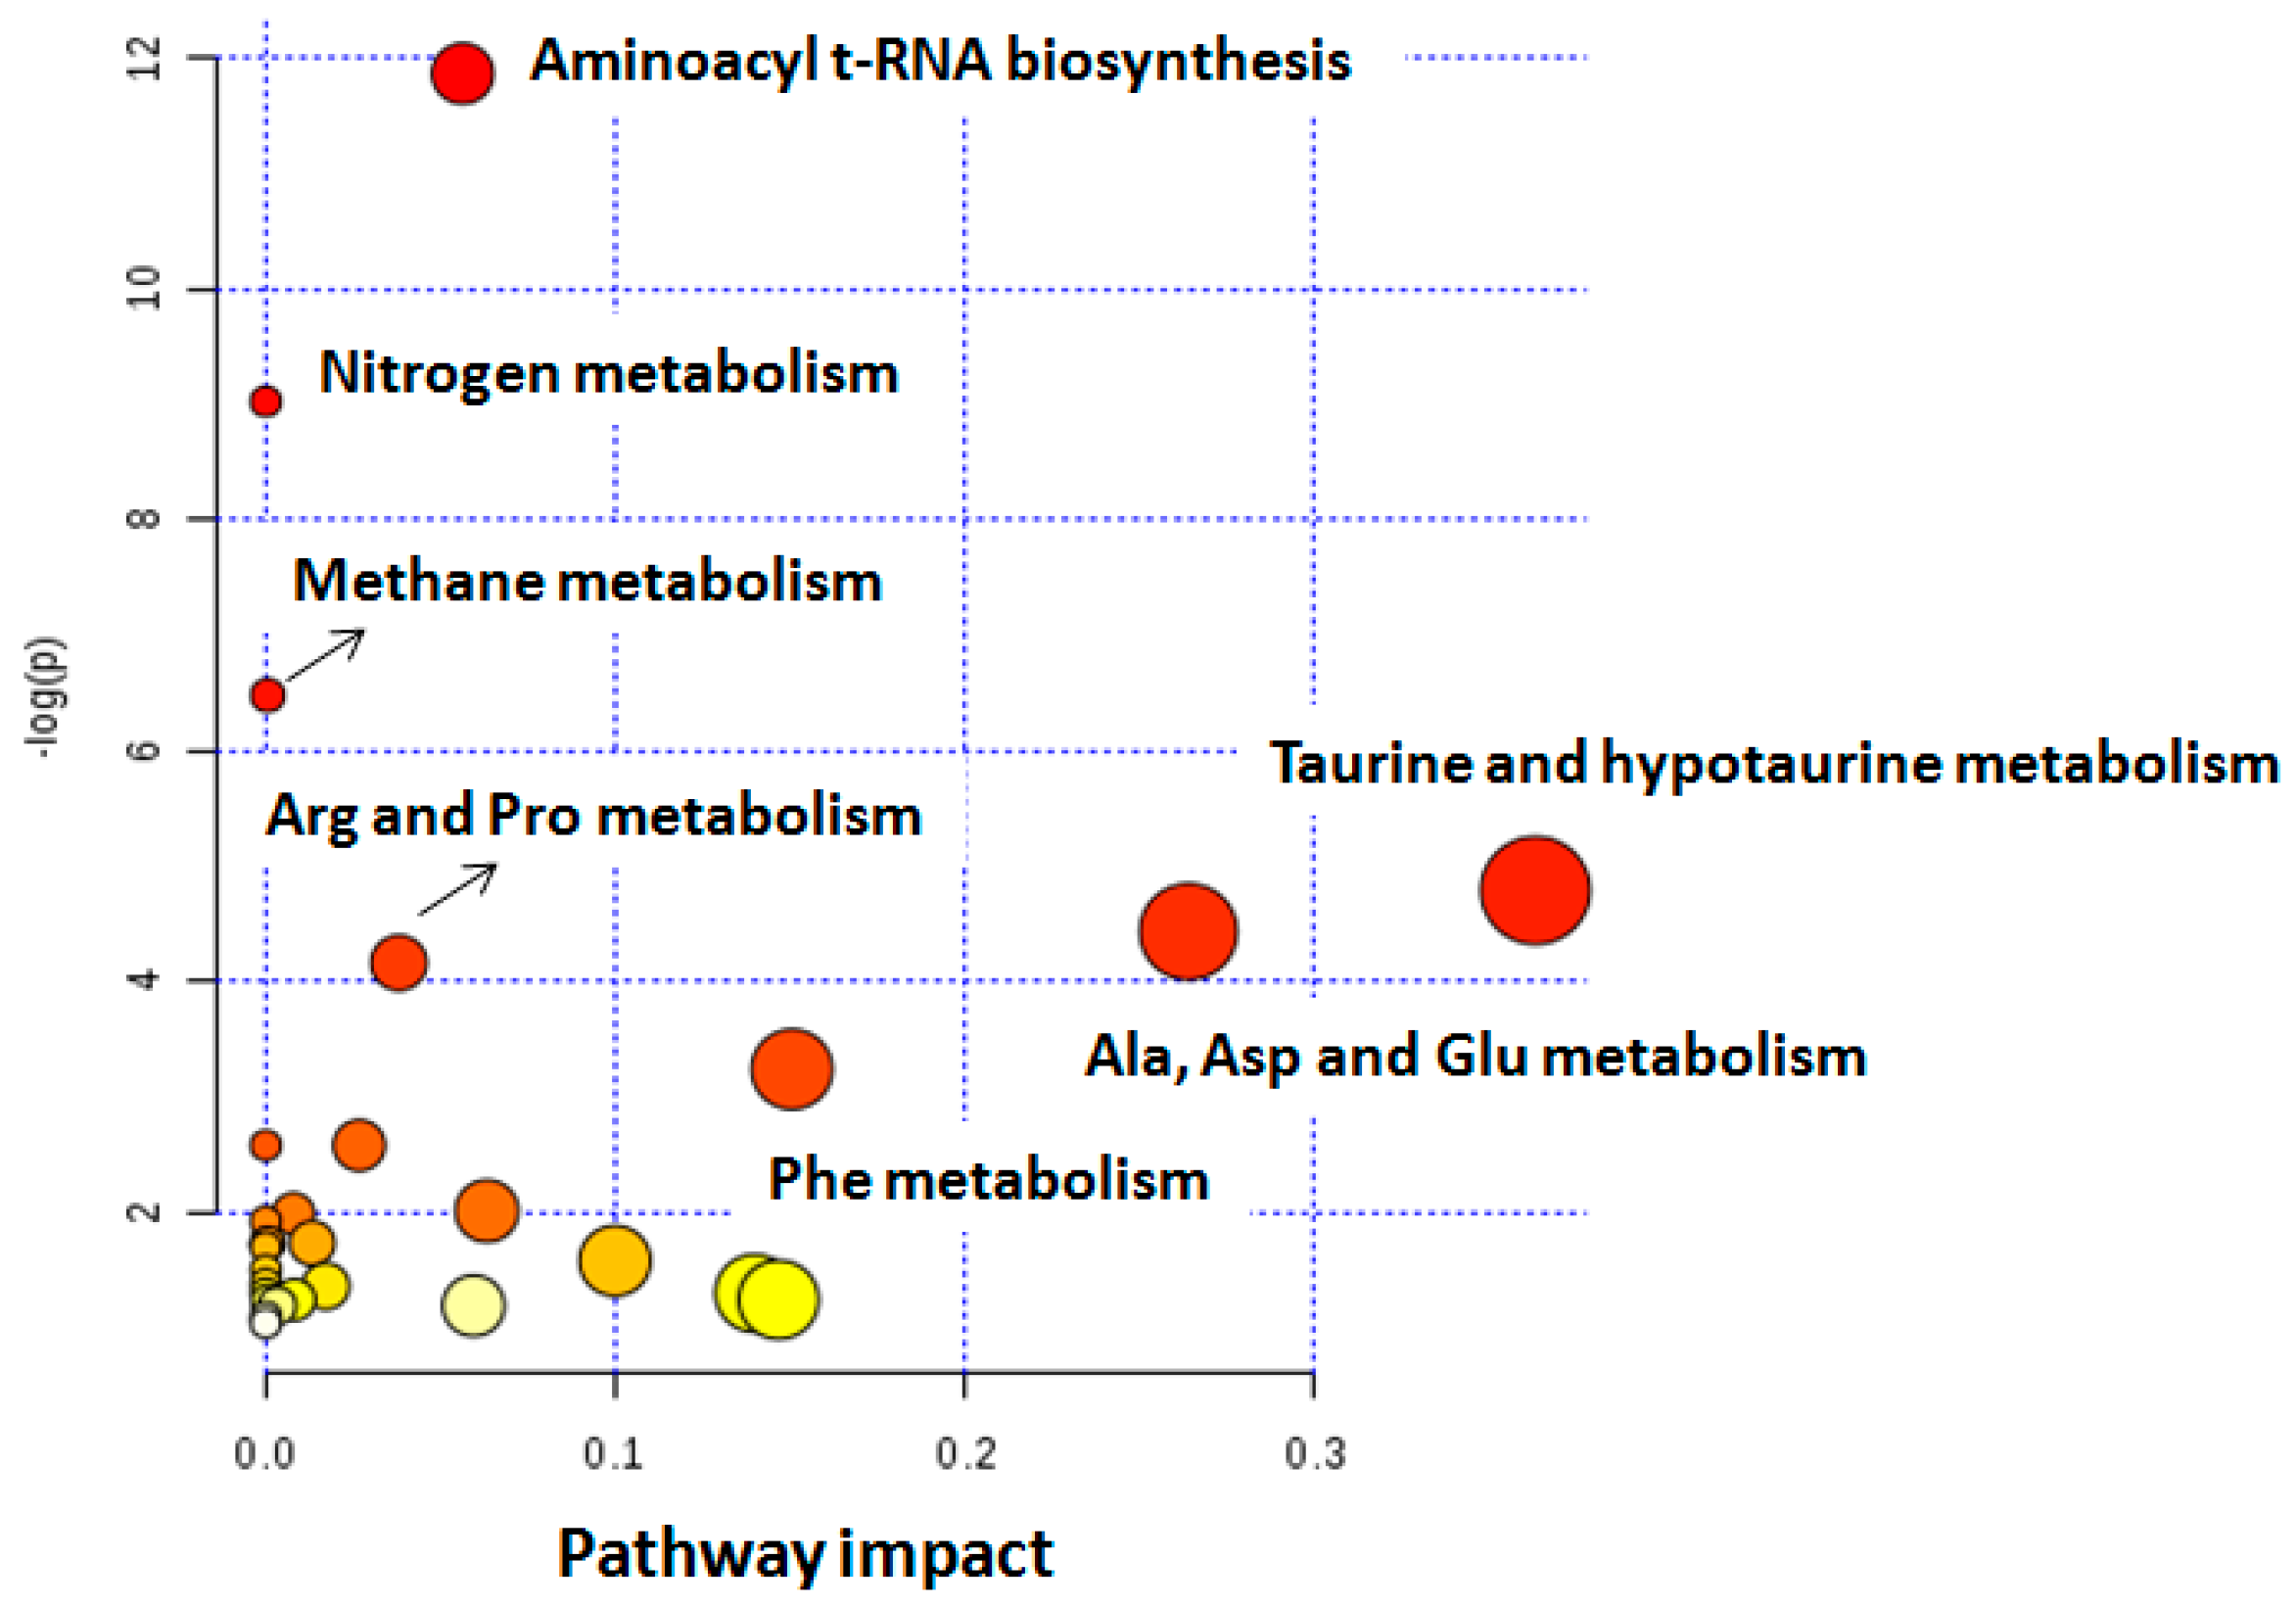
| Altered Pathways in BC | Metabolites | p Value | Impact |
|---|---|---|---|
| Alanine, aspartate, and glutamate | Alanine, glutamine, succinate | 6.5 × 10⁻⁴ | 0.26 |
| Taurine and hypotaurine | Taurine, alanine | 9.0 × 10⁻³ | 0.36 |
| Aminoacyl-tRNA biosynthesis | Phenylalanine, glutamine, valine, alanine, lysine | 1.6 × 10⁻⁴ | 0.56 |
| Methane | Trimethylamine N-oxide, methanol | 2.5 × 10⁻² | 0.02 |
| Arginine and proline | Citrate, succinate | 9.0 × 10⁻³ | 0.08 |
| Phenylalanine | Succinate, phenylalanine, hippuric acid | 4.0 × 10⁻³ | 0.07 |
| Nitrogen metabolism | Phenylalanine, taurine, glutamine | 2.7 × 10⁻³ | 0.05 |
| Clinical data | Calibration Set | Validation Set |
|---|---|---|
| Patients (male/female) | 24 (18/6) | 7 (5/2) |
| Age (mean and standard deviation) | 70 (11.15) | 63 (5.13) |
| Total samples | 69 | 84 |
| CTRL | 21 | 8 |
| MONITOR | 0 | 38 |
| NA | 0 | 16 |
| BC | 48 | 22 |
| Primary/Recurrent BC | 13/35 | 4/18 |
| Tumor stage (Ta, T1, Tx) | 33/13/2 | 17/4/1 |
| Tumor grade (High/Low) | 32/15 (UK:1) | 20/1 (UK:1) |
| Tumor size (≥3/<3) | 11/35 (UK:2) | 7/15 |
| Tumor number (1/2–7/≥8) | 18/28/0 (UK:2) | 14/8/0 |
© 2019 by the authors. Licensee MDPI, Basel, Switzerland. This article is an open access article distributed under the terms and conditions of the Creative Commons Attribution (CC BY) license (http://creativecommons.org/licenses/by/4.0/).
Share and Cite
Loras, A.; Martínez-Bisbal, M.C.; Quintás, G.; Gil, S.; Martínez-Máñez, R.; Ruiz-Cerdá, J.L. Urinary Metabolic Signatures Detect Recurrences in Non-Muscle Invasive Bladder Cancer. Cancers 2019, 11, 914. https://doi.org/10.3390/cancers11070914
Loras A, Martínez-Bisbal MC, Quintás G, Gil S, Martínez-Máñez R, Ruiz-Cerdá JL. Urinary Metabolic Signatures Detect Recurrences in Non-Muscle Invasive Bladder Cancer. Cancers. 2019; 11(7):914. https://doi.org/10.3390/cancers11070914
Chicago/Turabian StyleLoras, Alba, M. Carmen Martínez-Bisbal, Guillermo Quintás, Salvador Gil, Ramón Martínez-Máñez, and José Luis Ruiz-Cerdá. 2019. "Urinary Metabolic Signatures Detect Recurrences in Non-Muscle Invasive Bladder Cancer" Cancers 11, no. 7: 914. https://doi.org/10.3390/cancers11070914
APA StyleLoras, A., Martínez-Bisbal, M. C., Quintás, G., Gil, S., Martínez-Máñez, R., & Ruiz-Cerdá, J. L. (2019). Urinary Metabolic Signatures Detect Recurrences in Non-Muscle Invasive Bladder Cancer. Cancers, 11(7), 914. https://doi.org/10.3390/cancers11070914