Preventing the Solid Cancer Progression via Release of Anticancer-Cytokines in Co-Culture with Cold Plasma-Stimulated Macrophages

 ,
,  , ,
, ,  ,
, 
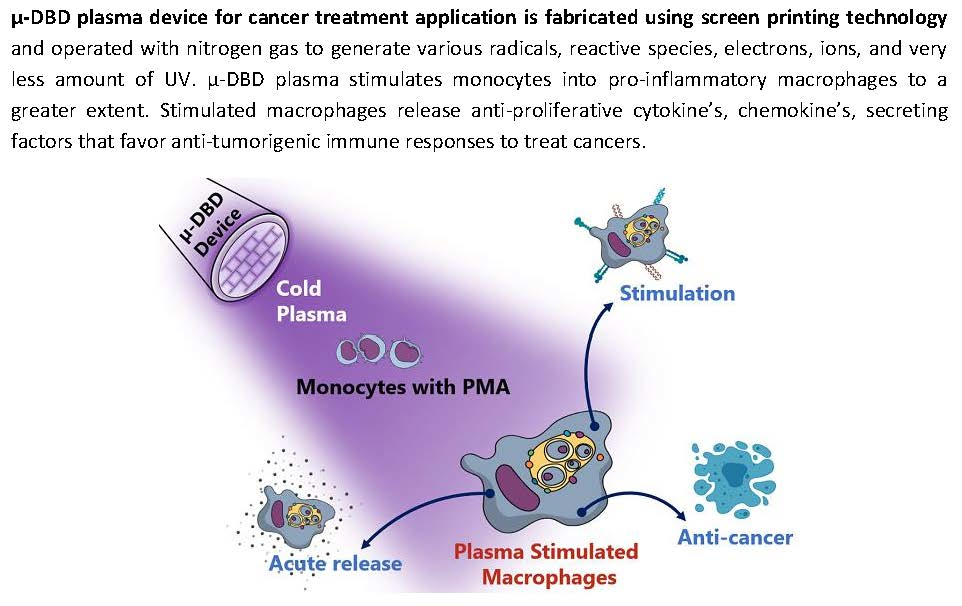
Abstract
:
1. Introduction
2. Results
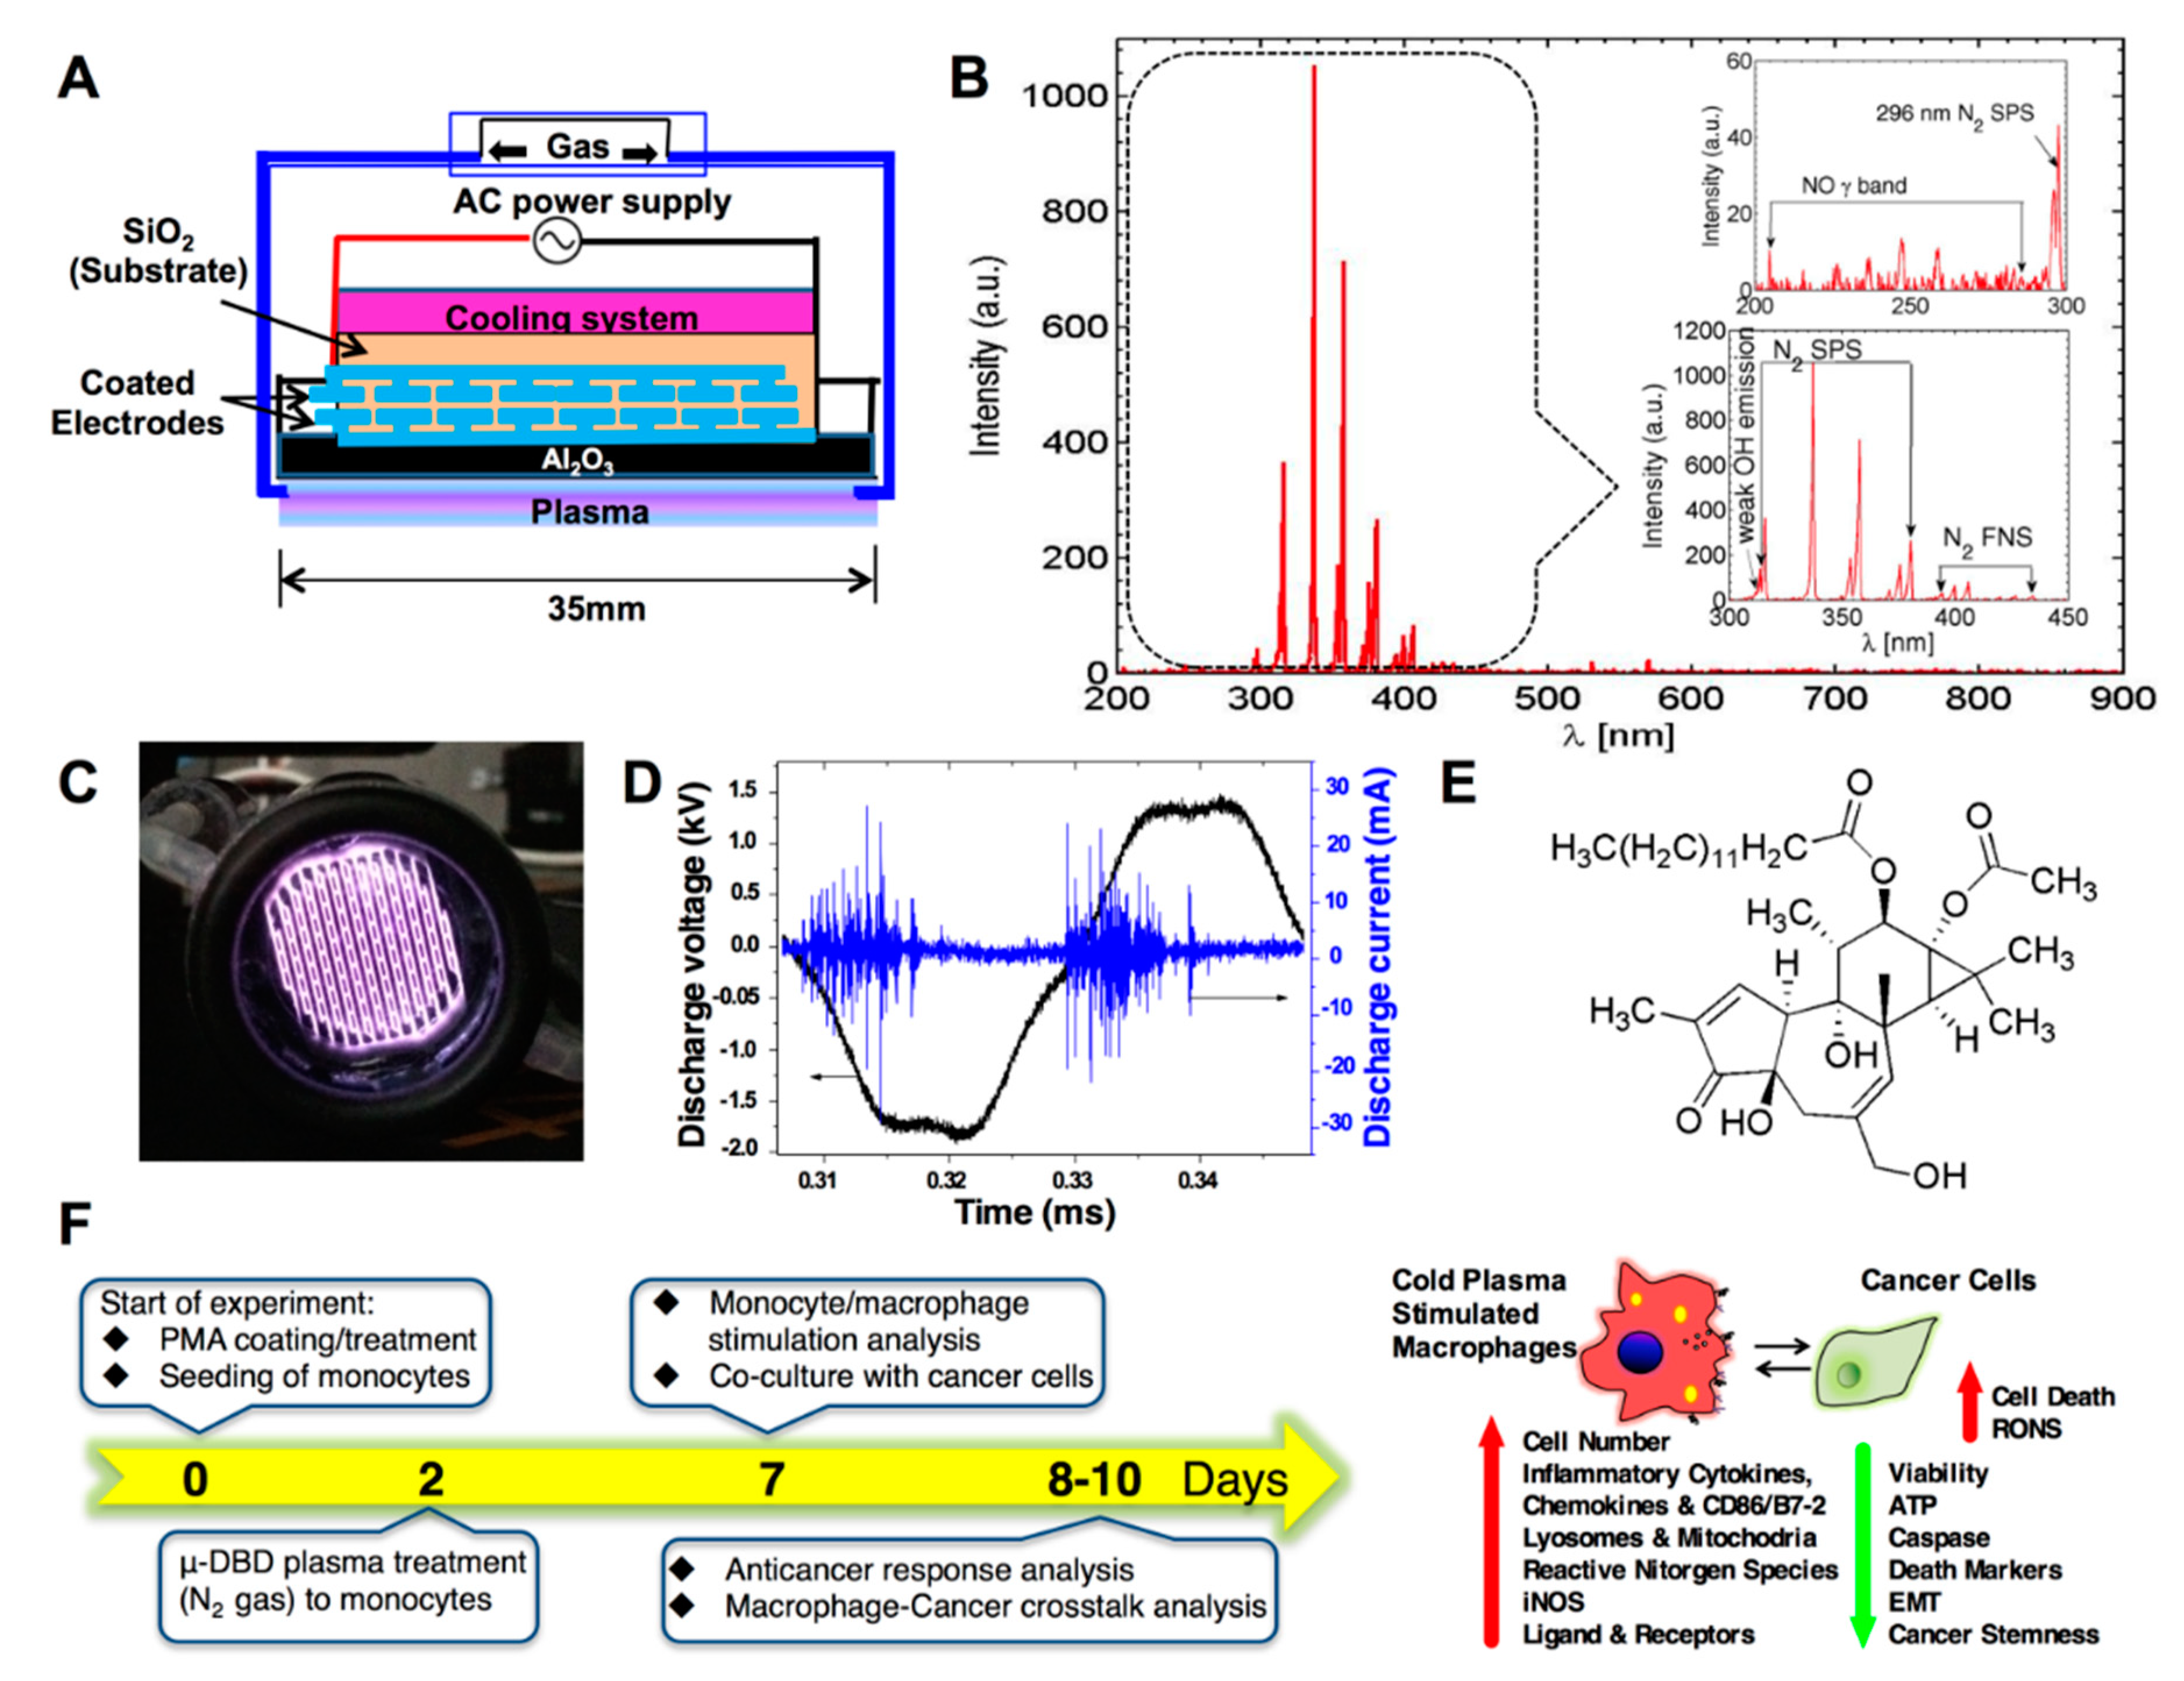
2.1. Optimization of the Cold μ-DBD Plasma Source
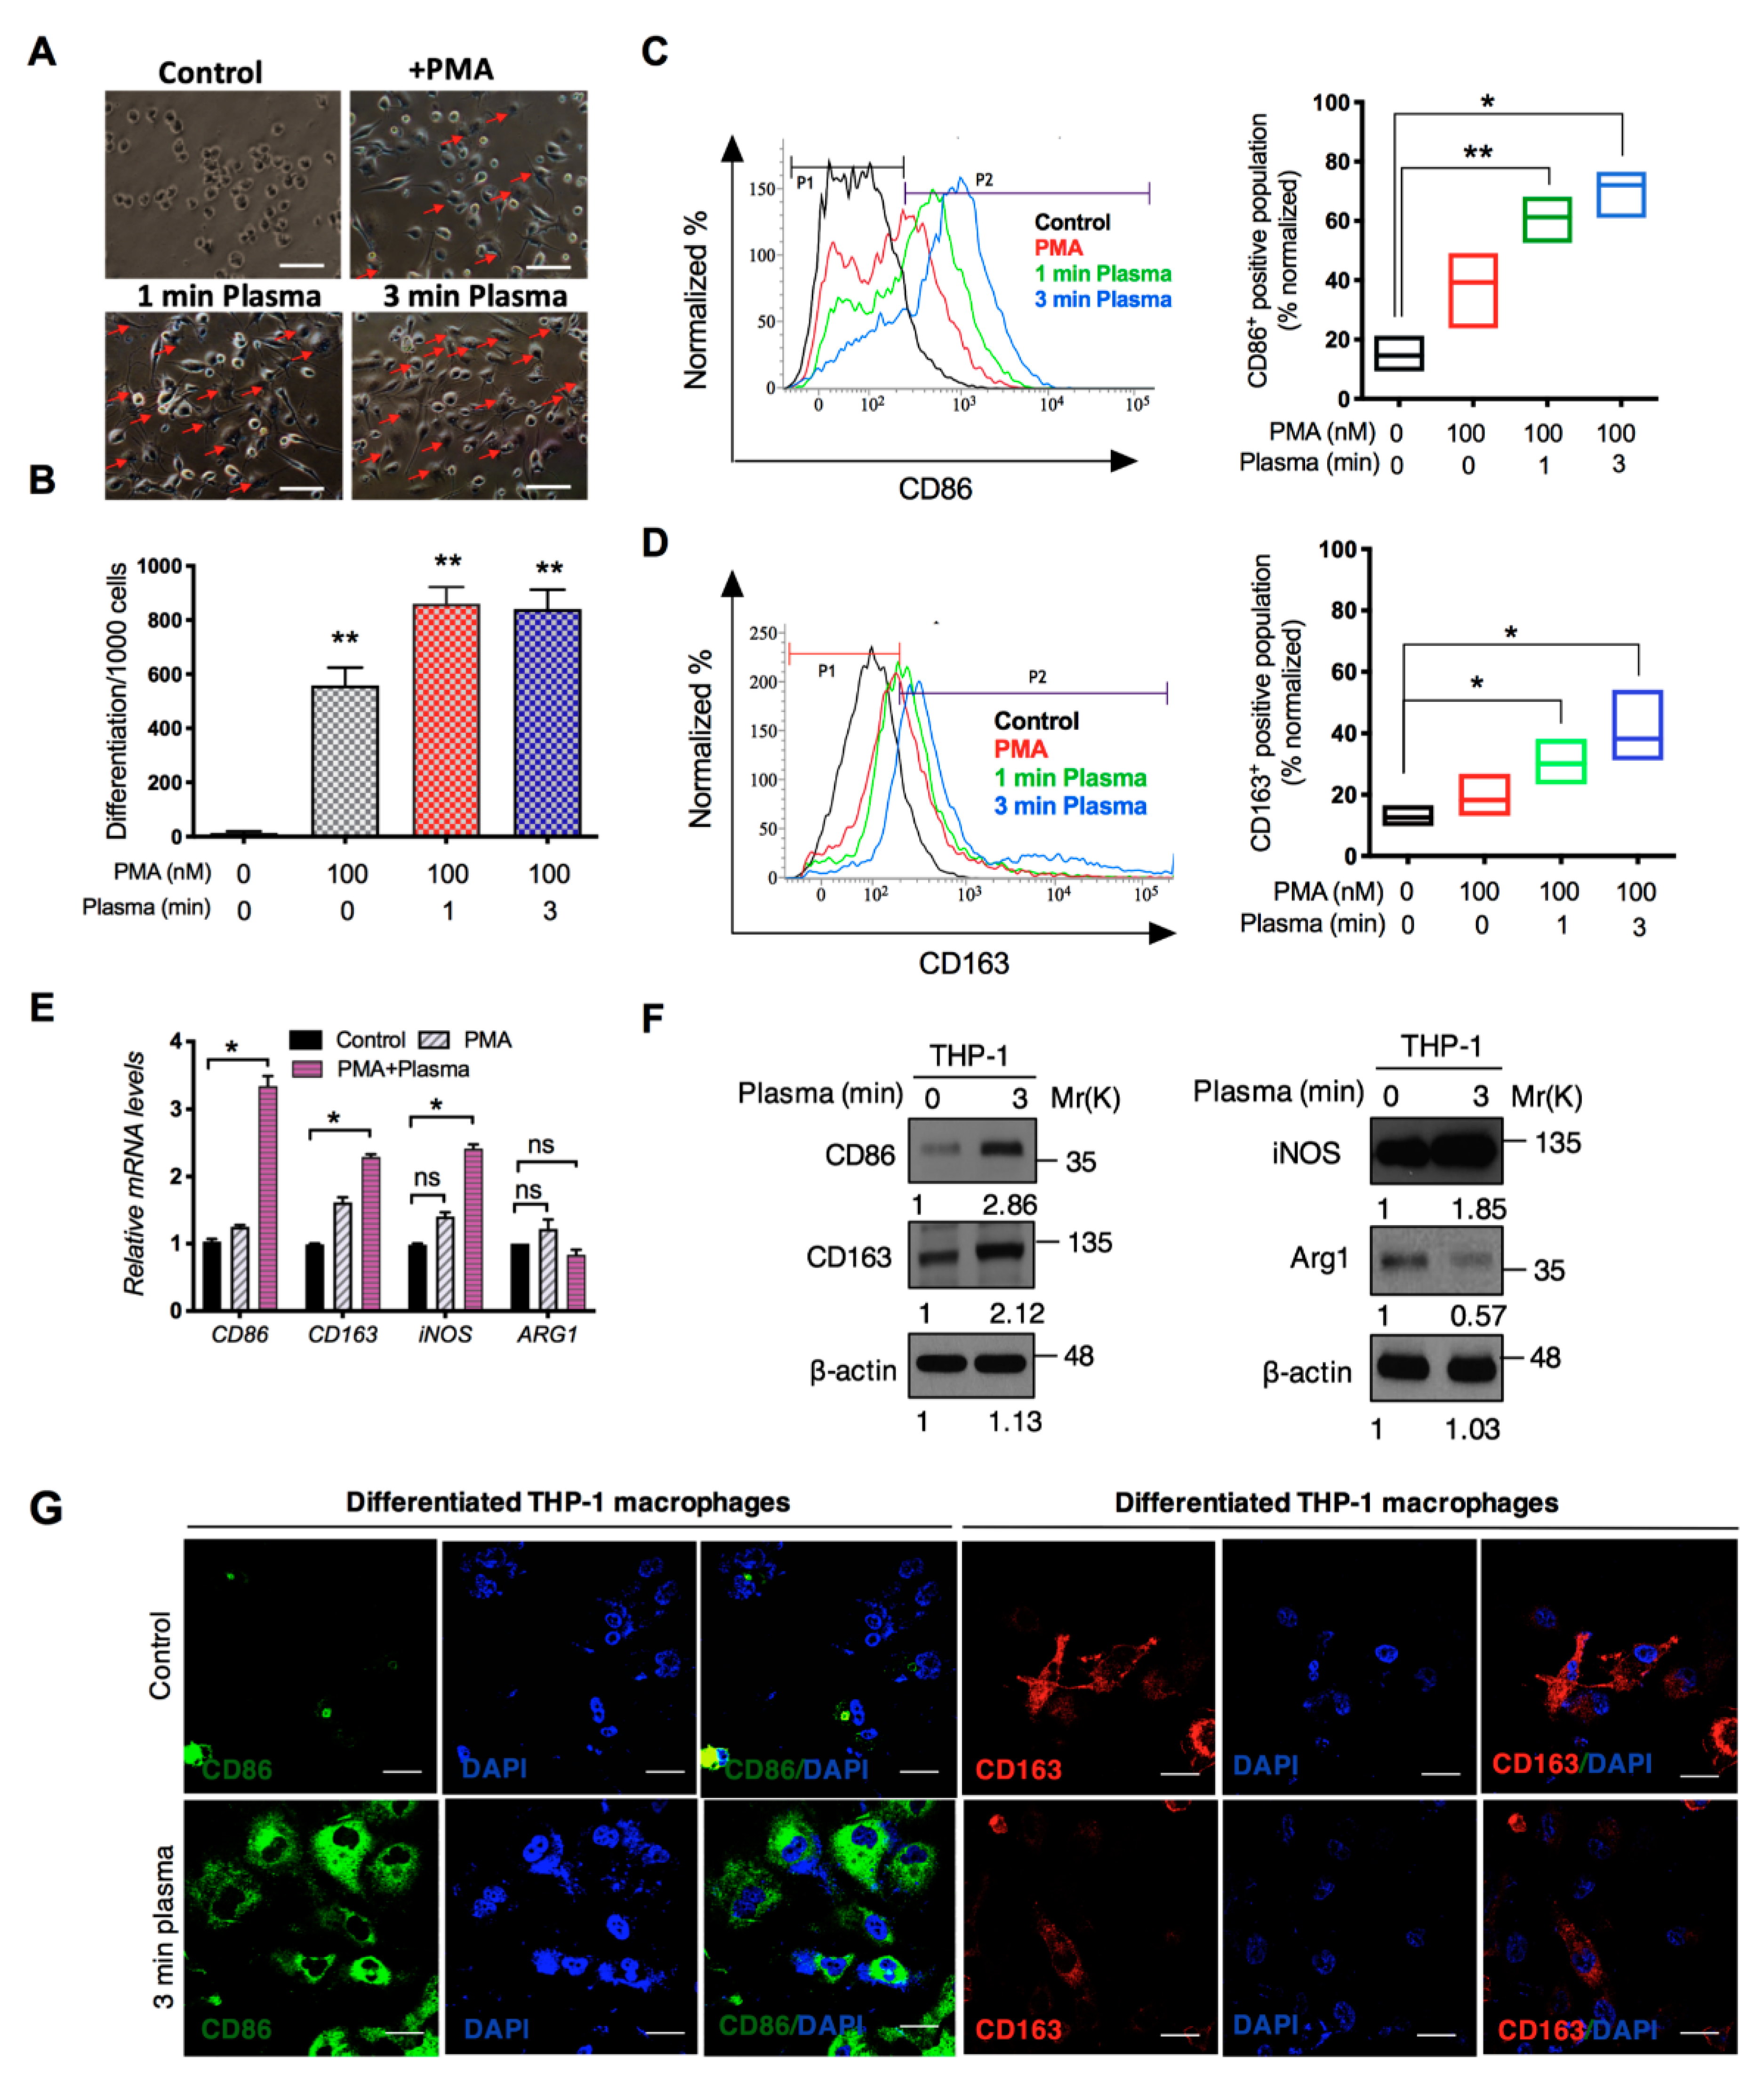
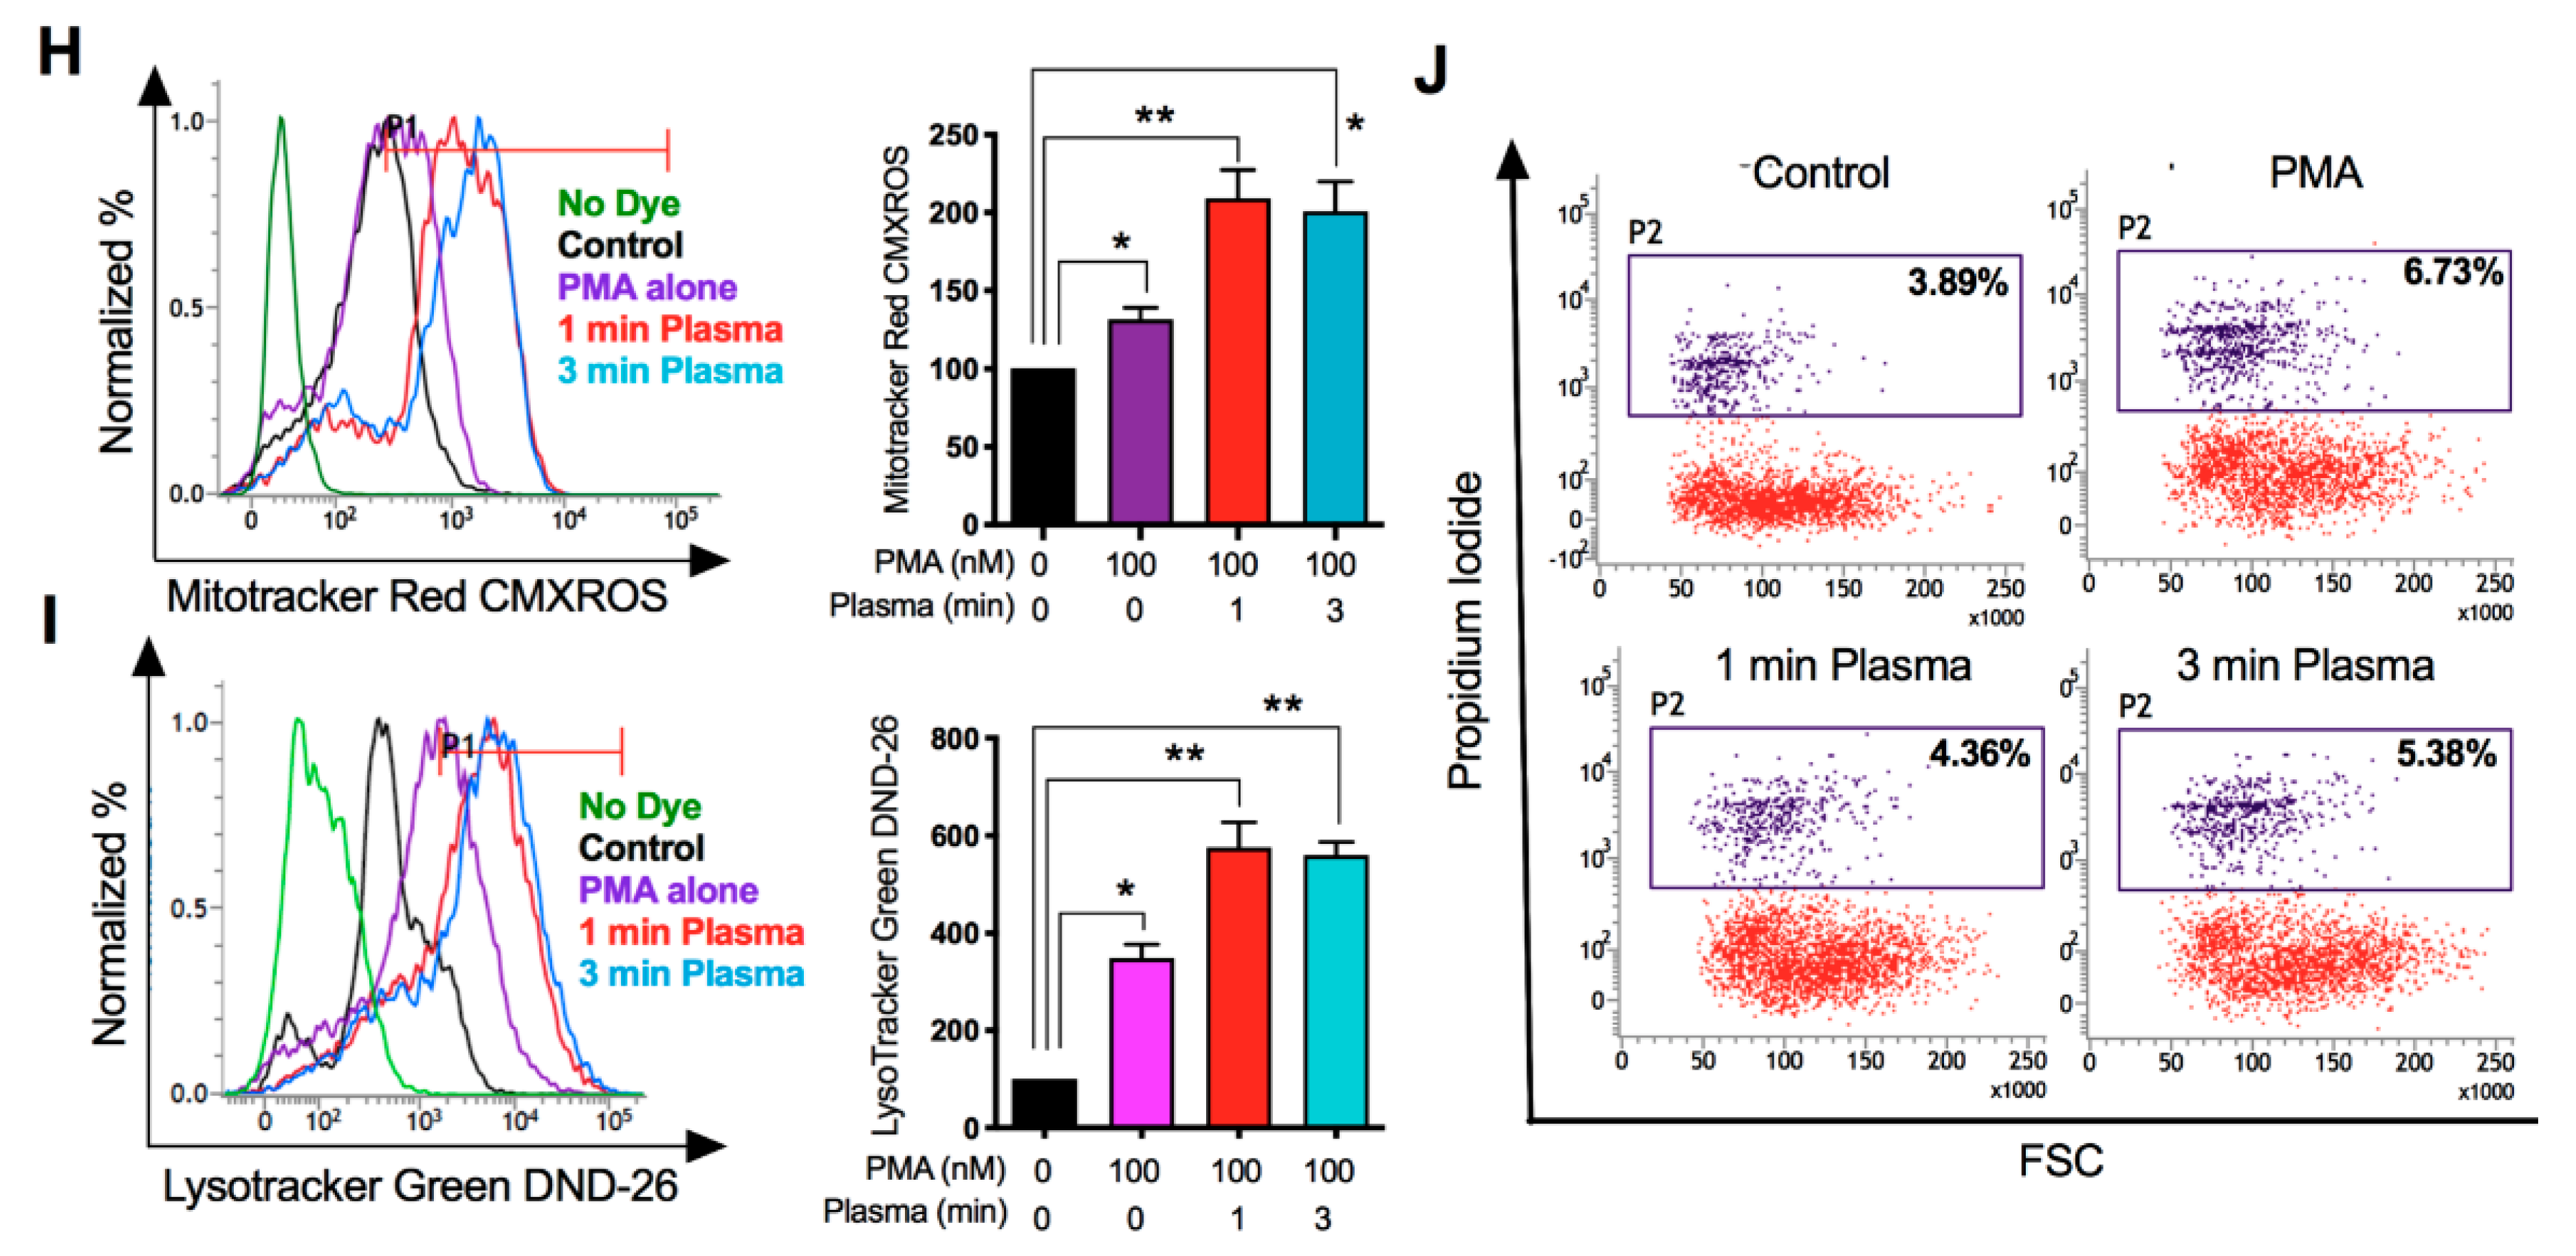
2.2. Distinct Molecular Features Characterize a Subset of M1/M2 Cells with Plasma Treatment In Vitro
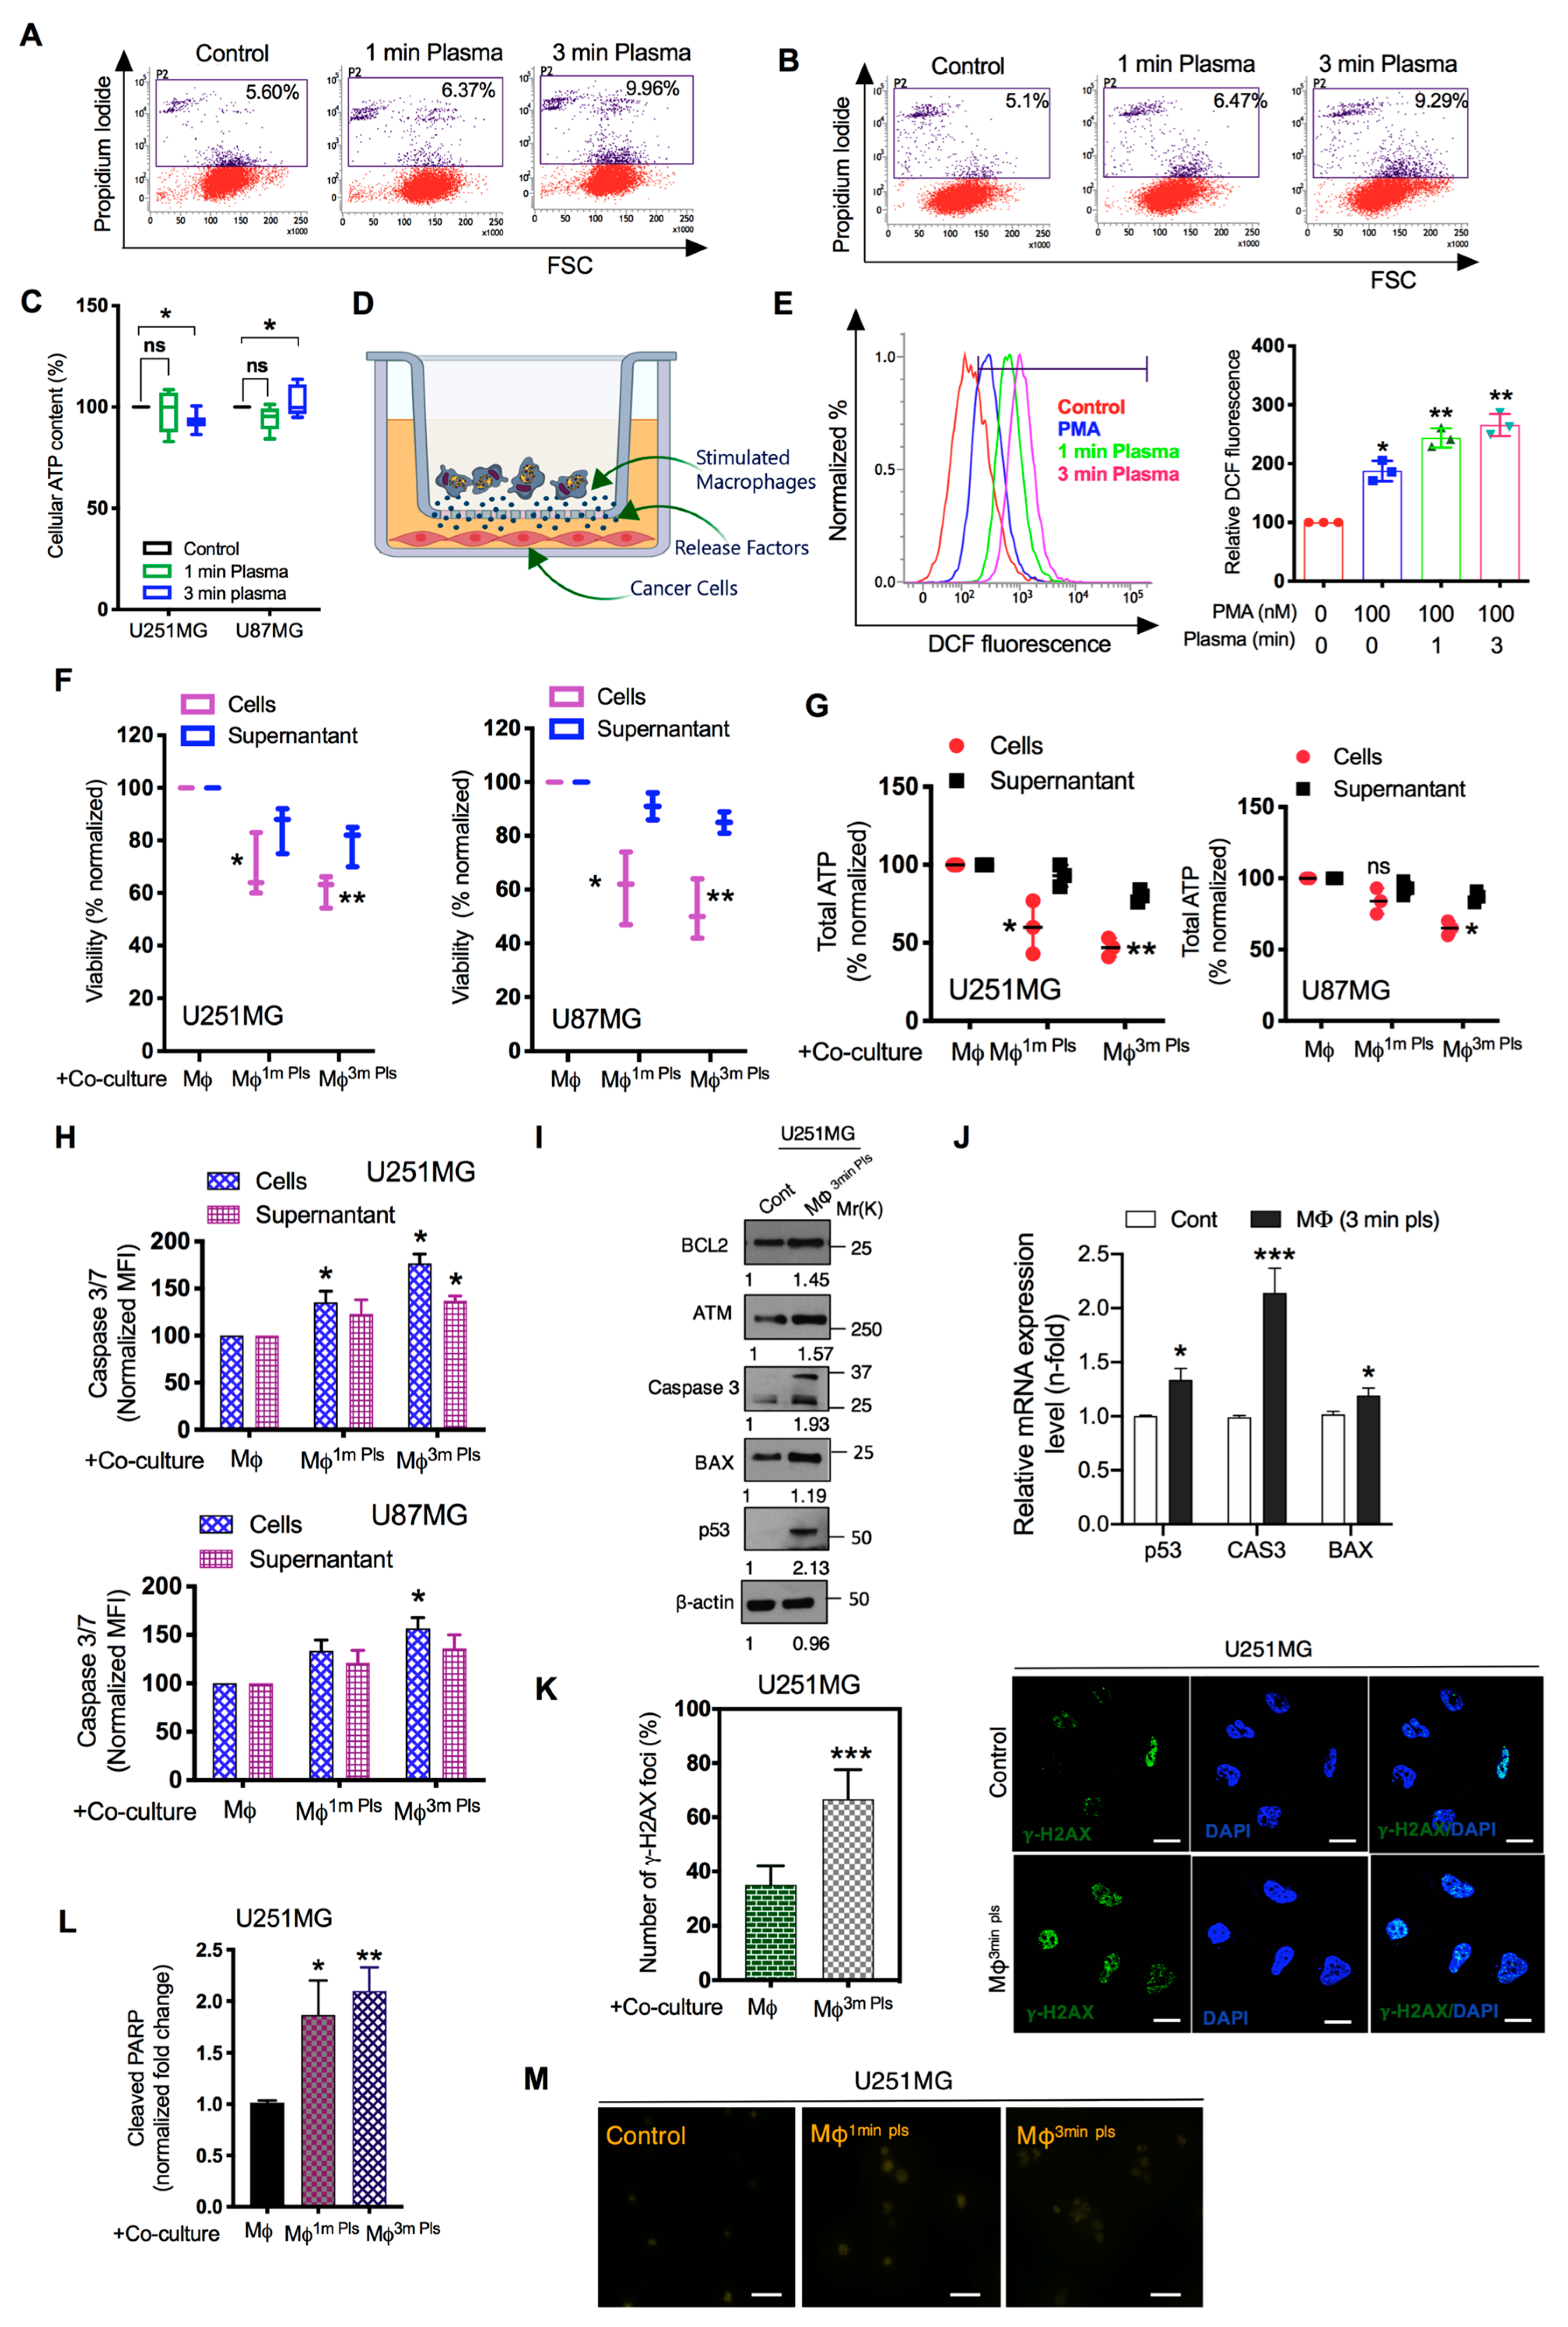
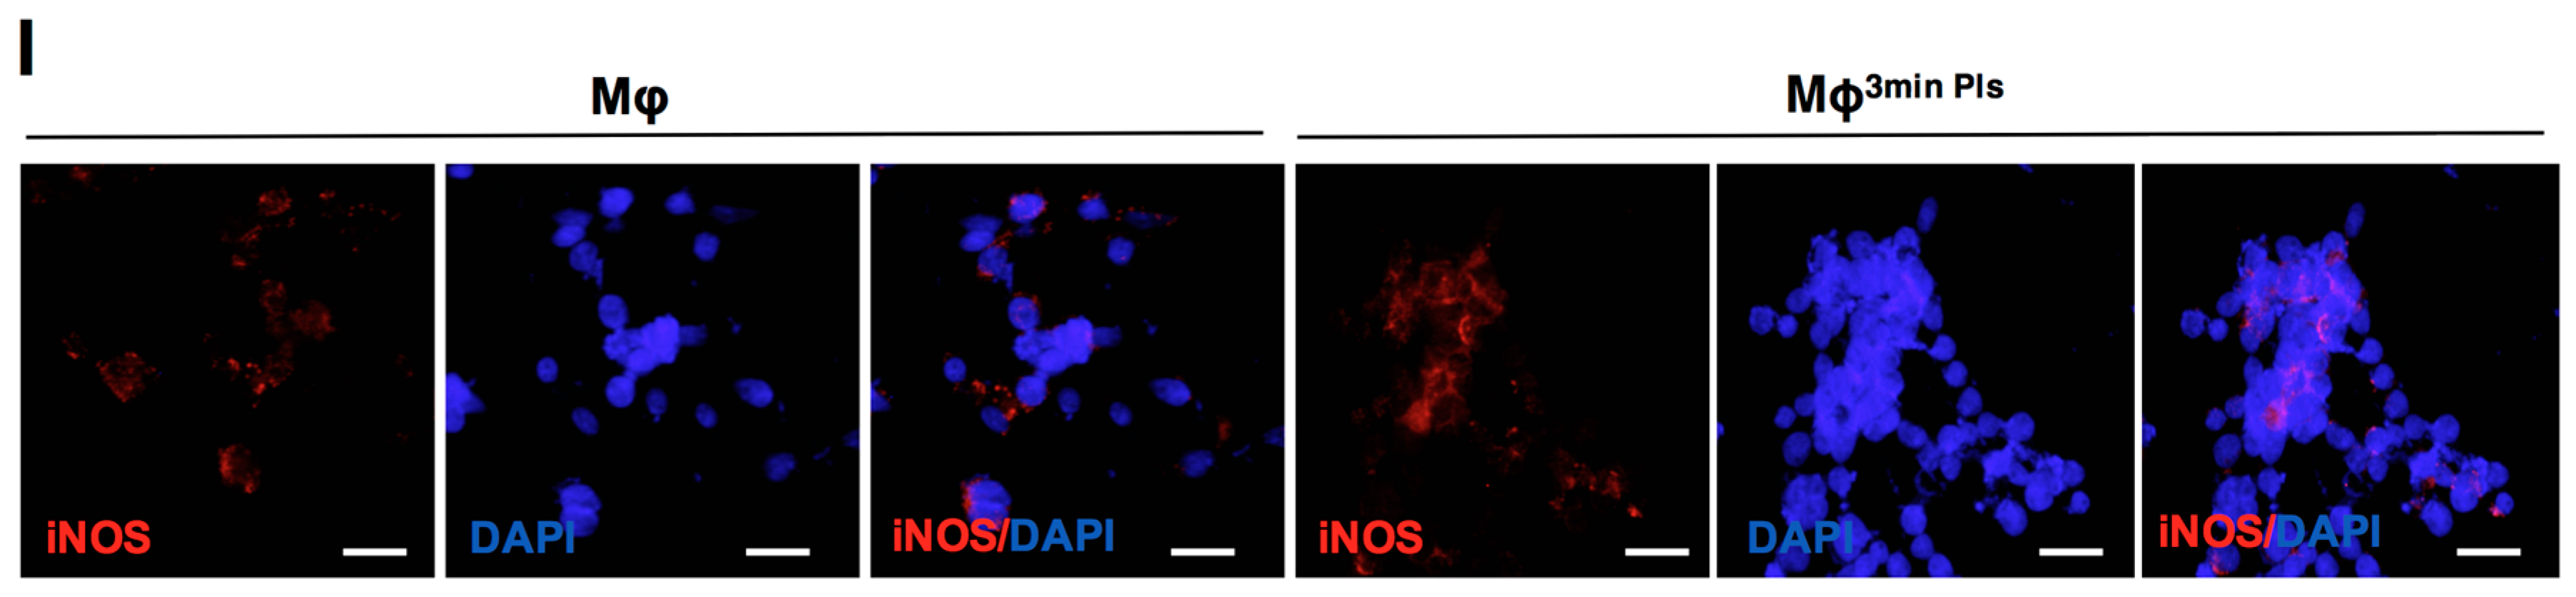
2.3. M1-Like Macrophages Induce Solid Tumor Cell Death If Activated by Plasma with PMA
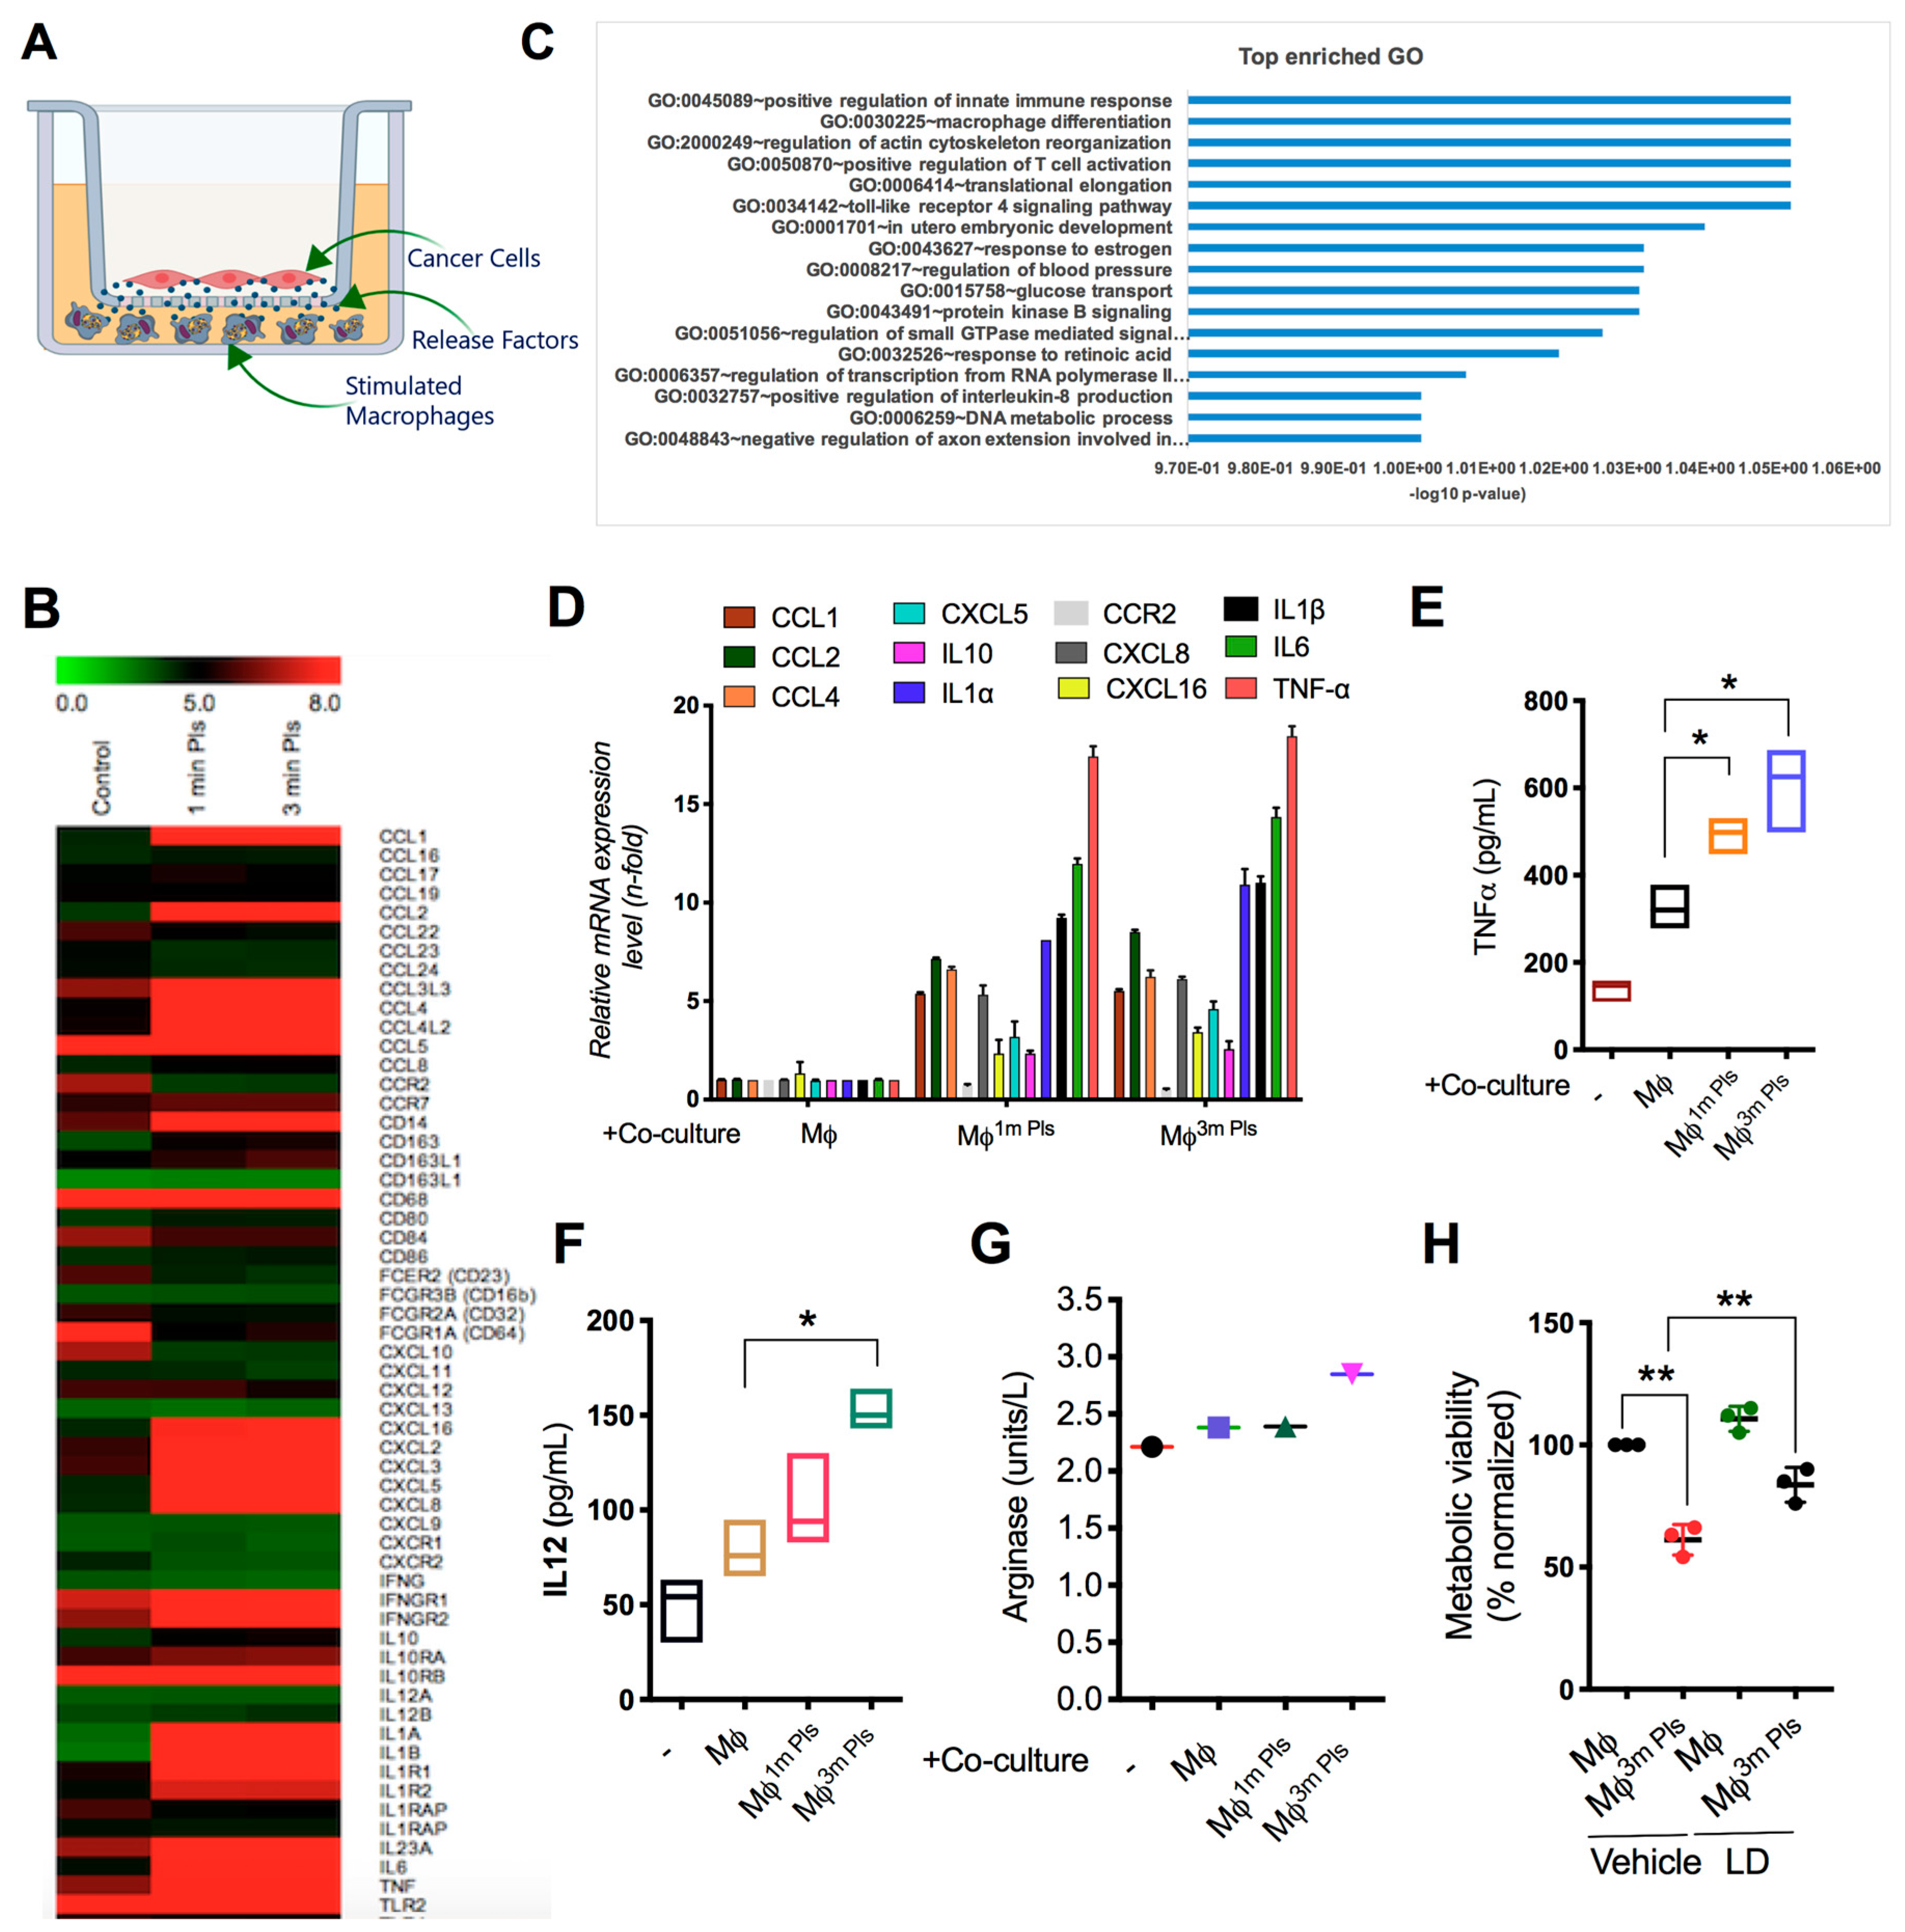
2.4. Analysis of the Cytokine Profile Expressed by Macrophages
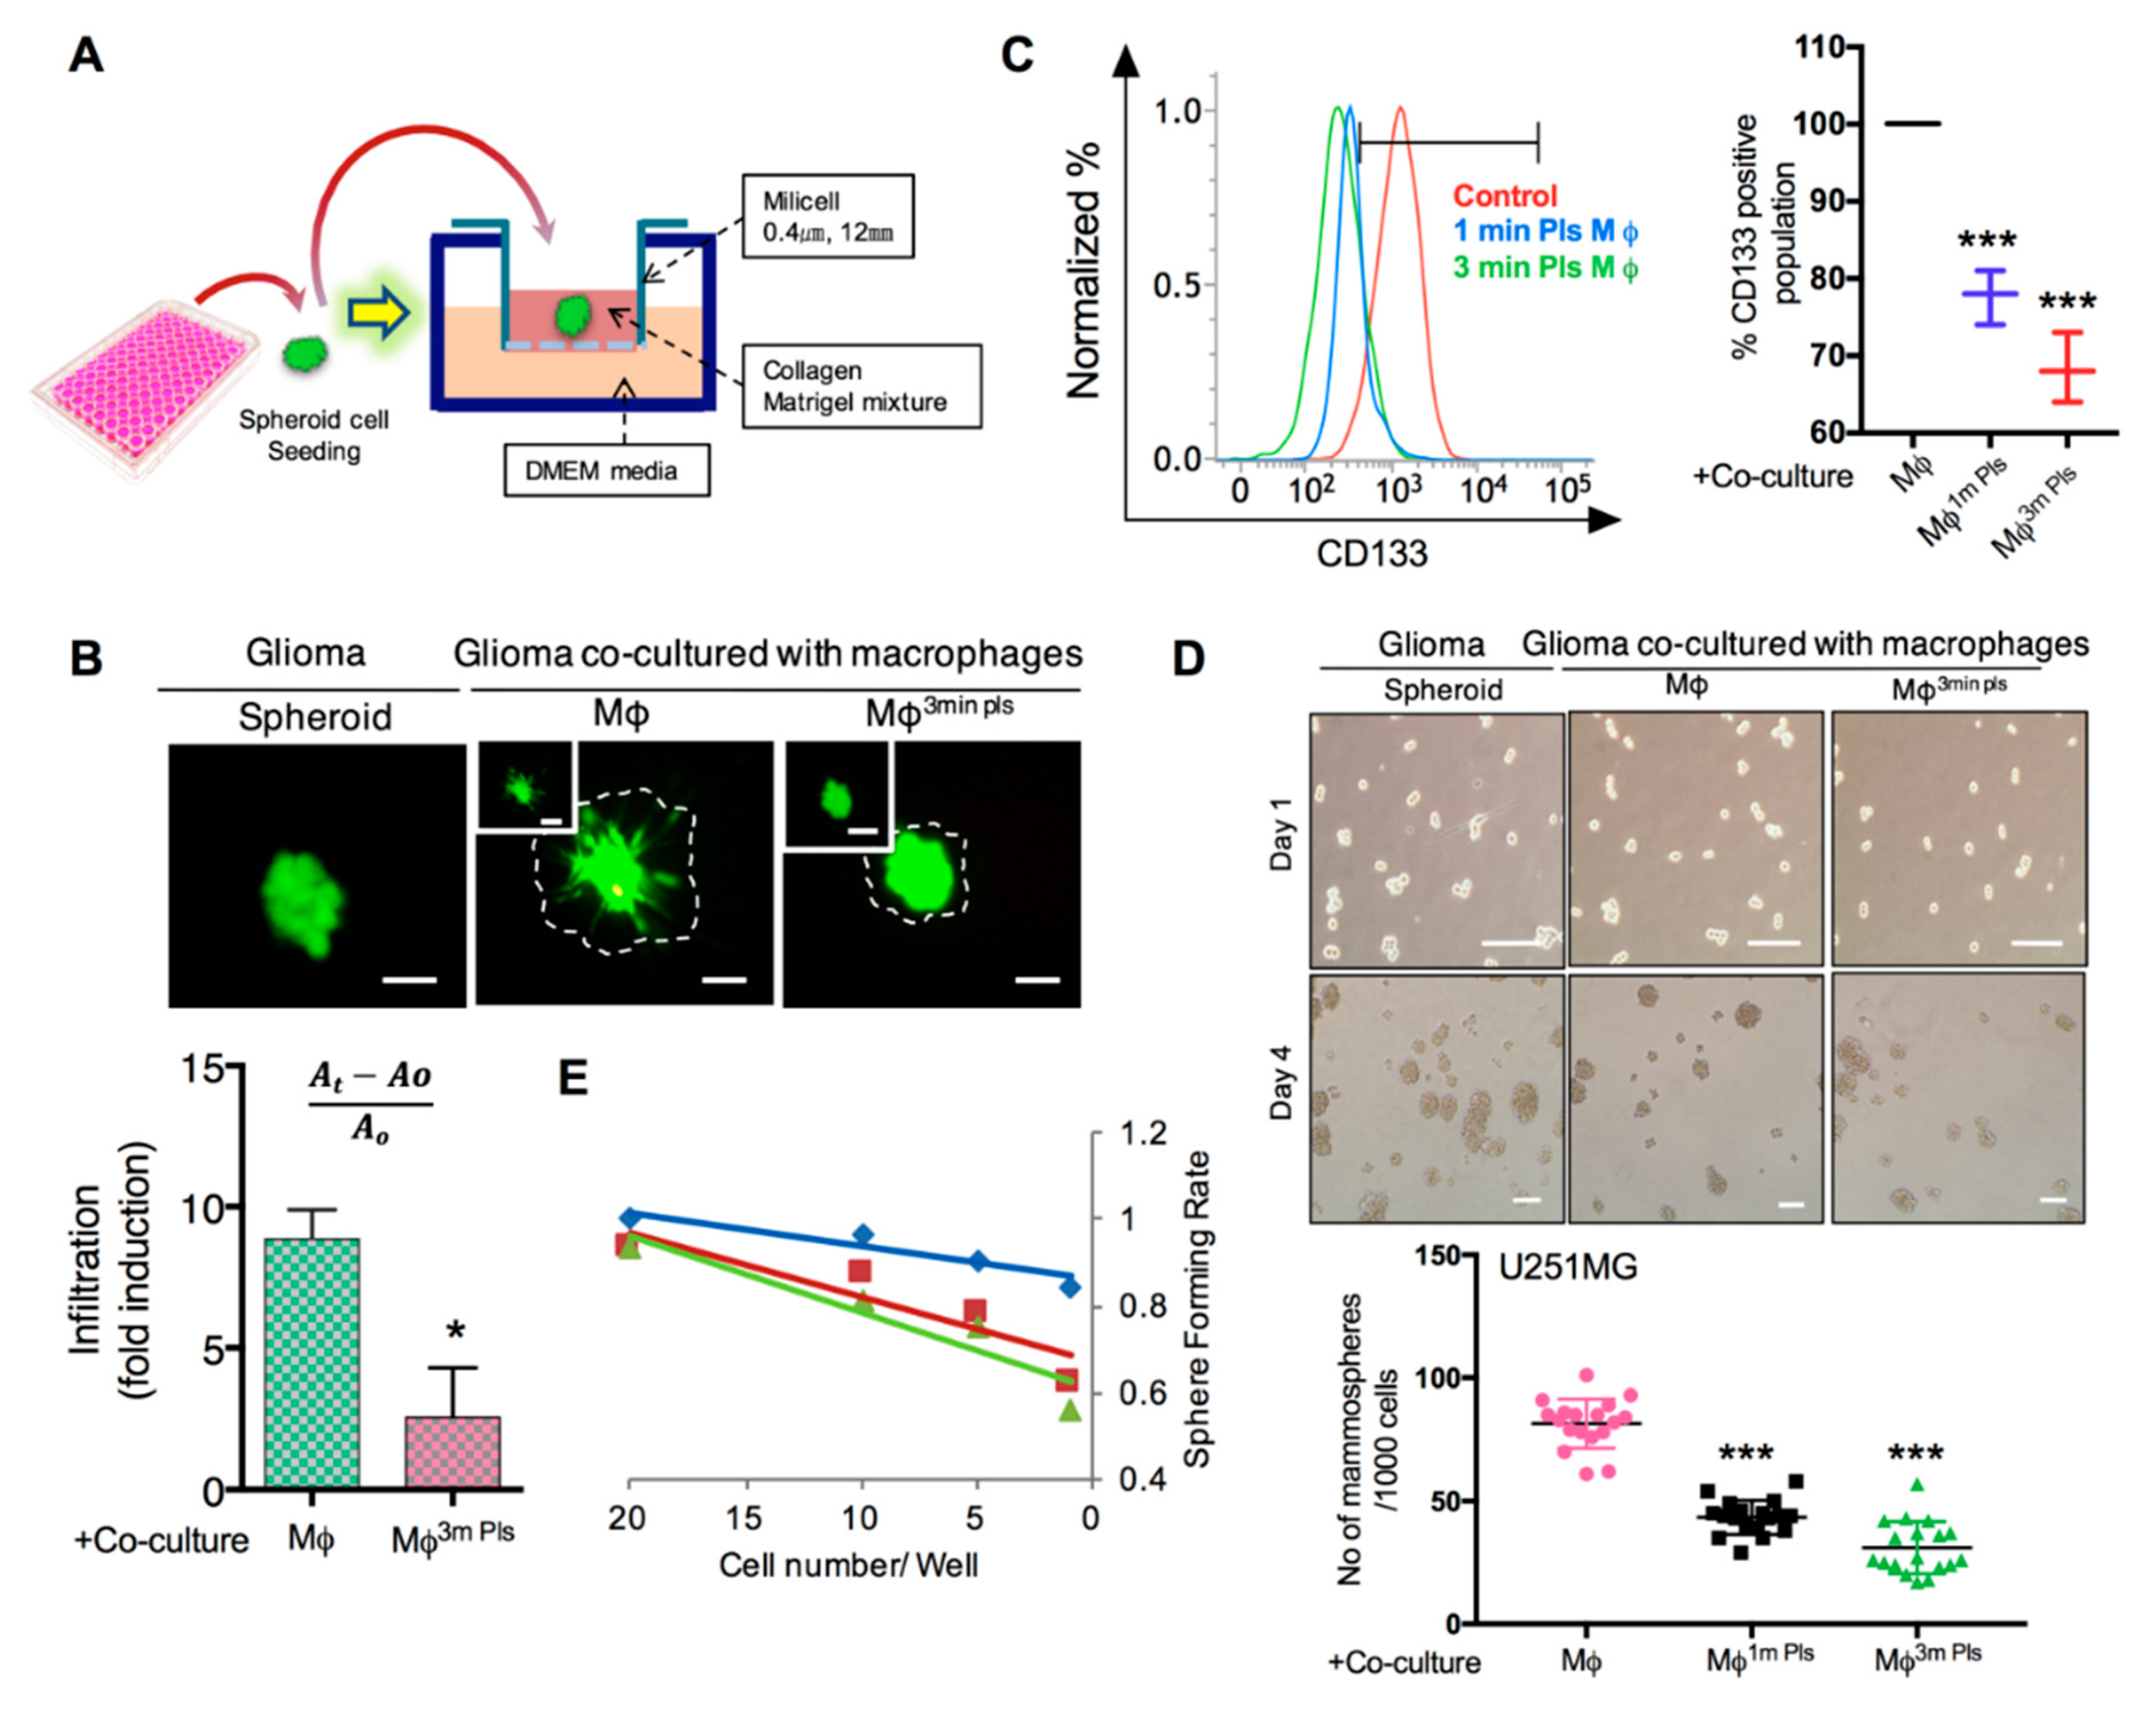
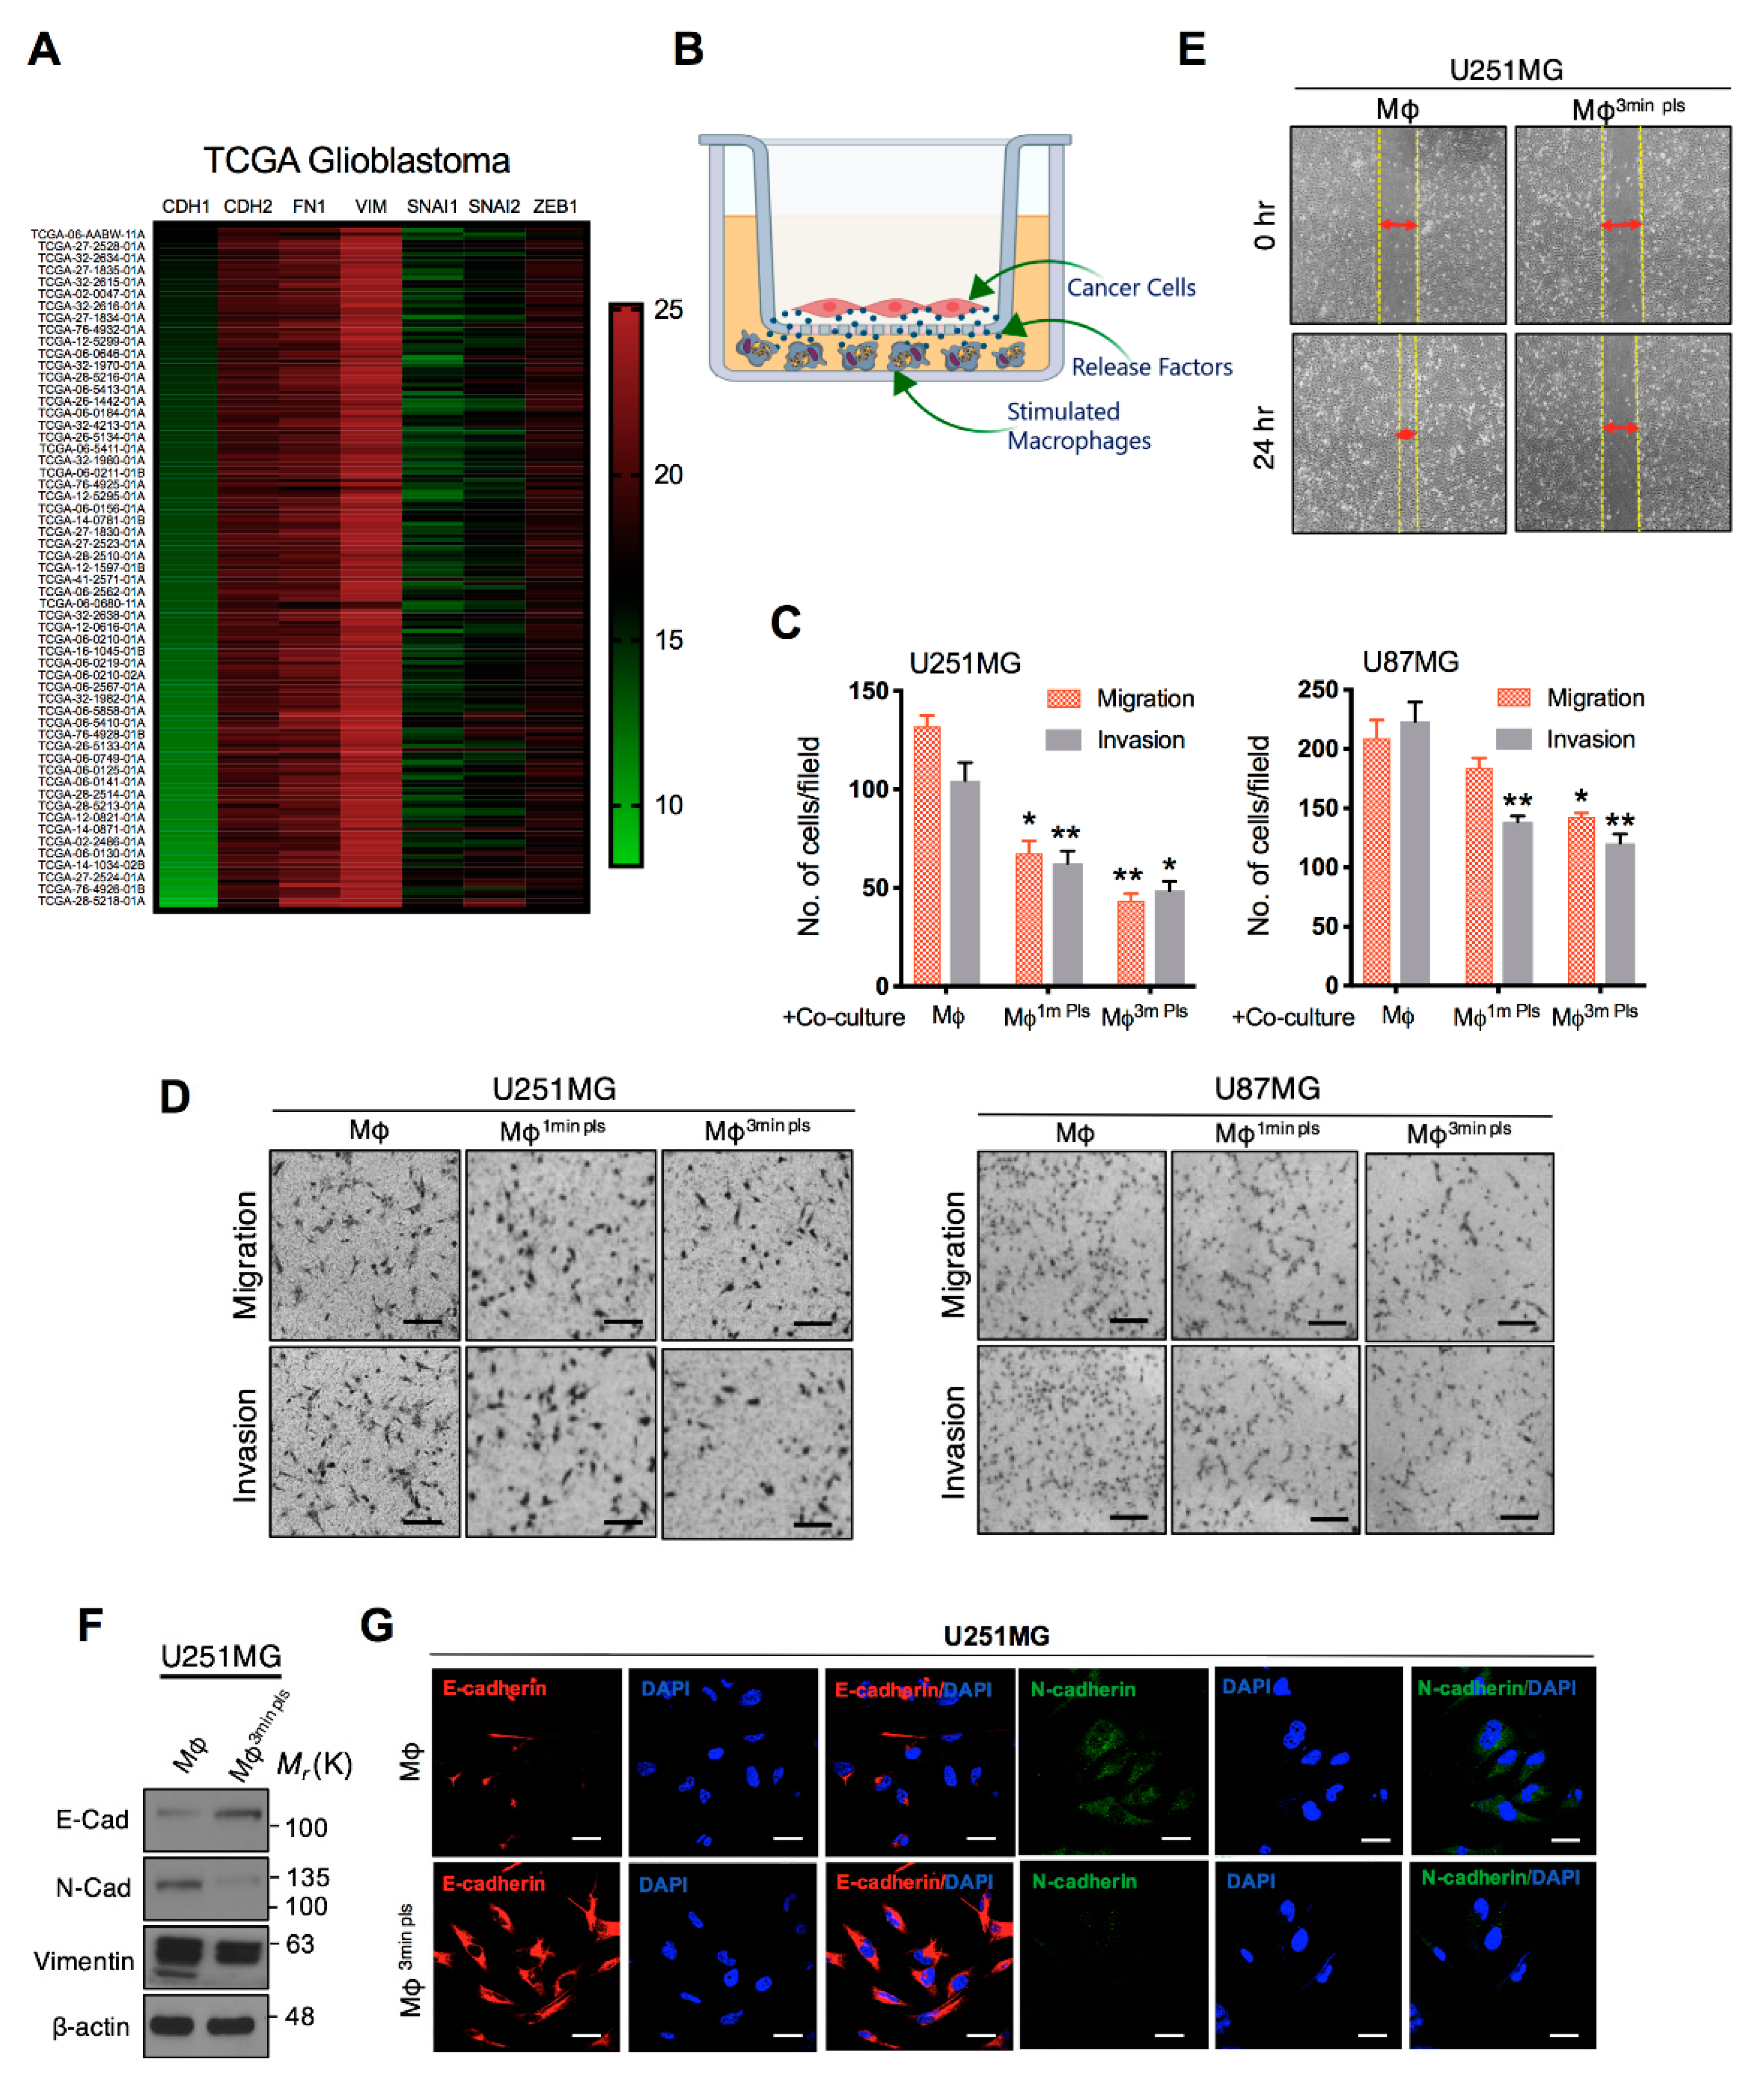
2.5. Co-Culture of Cancer Cells with Plasma-Activated Macrophages Decreases the Invasive Behavior of Cancer Cells
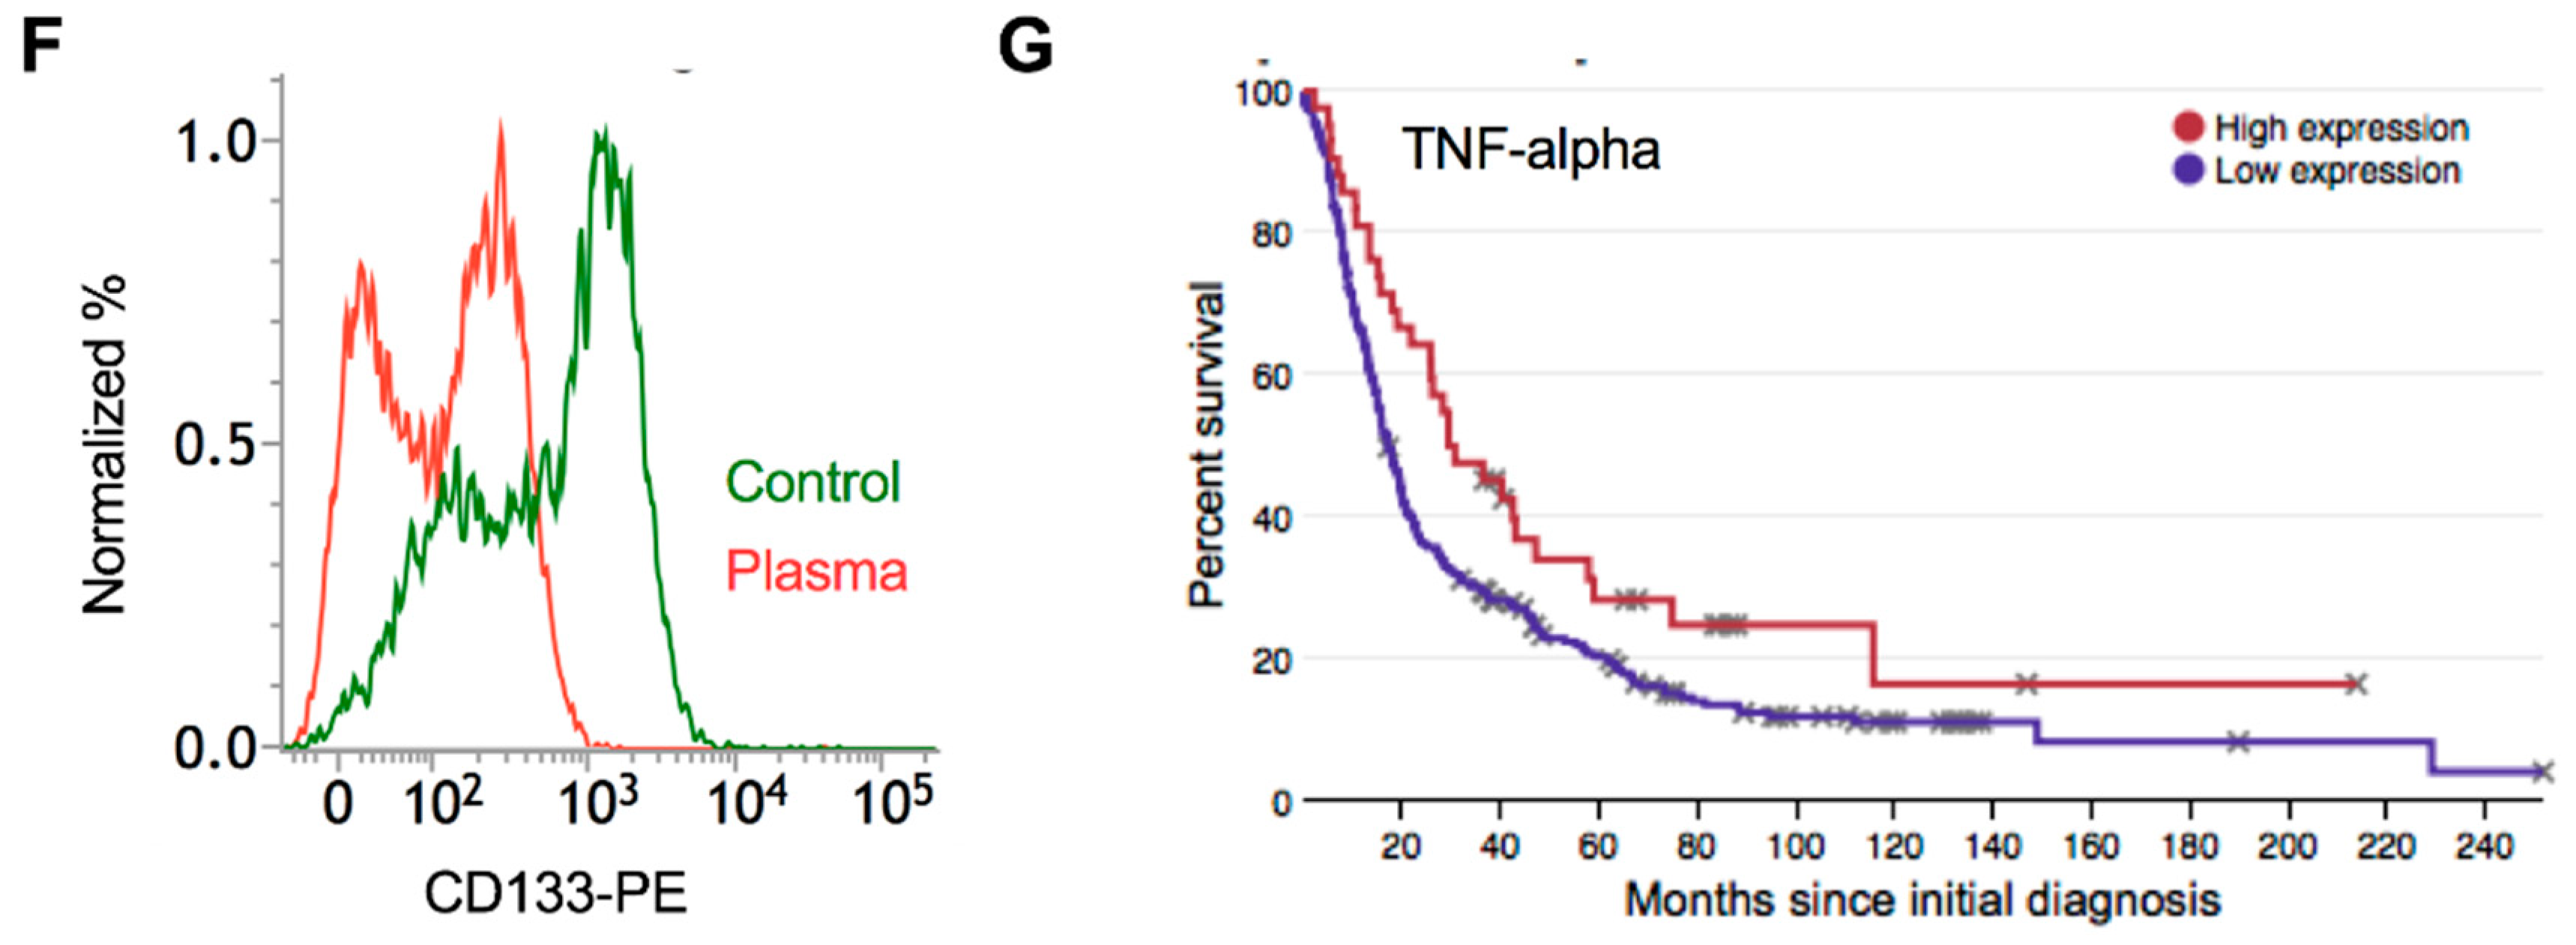
2.6. Plasma-Polarized Macrophages in the Co-Culture Condition Effects the Stemness of Cancer Stem-Like Cells
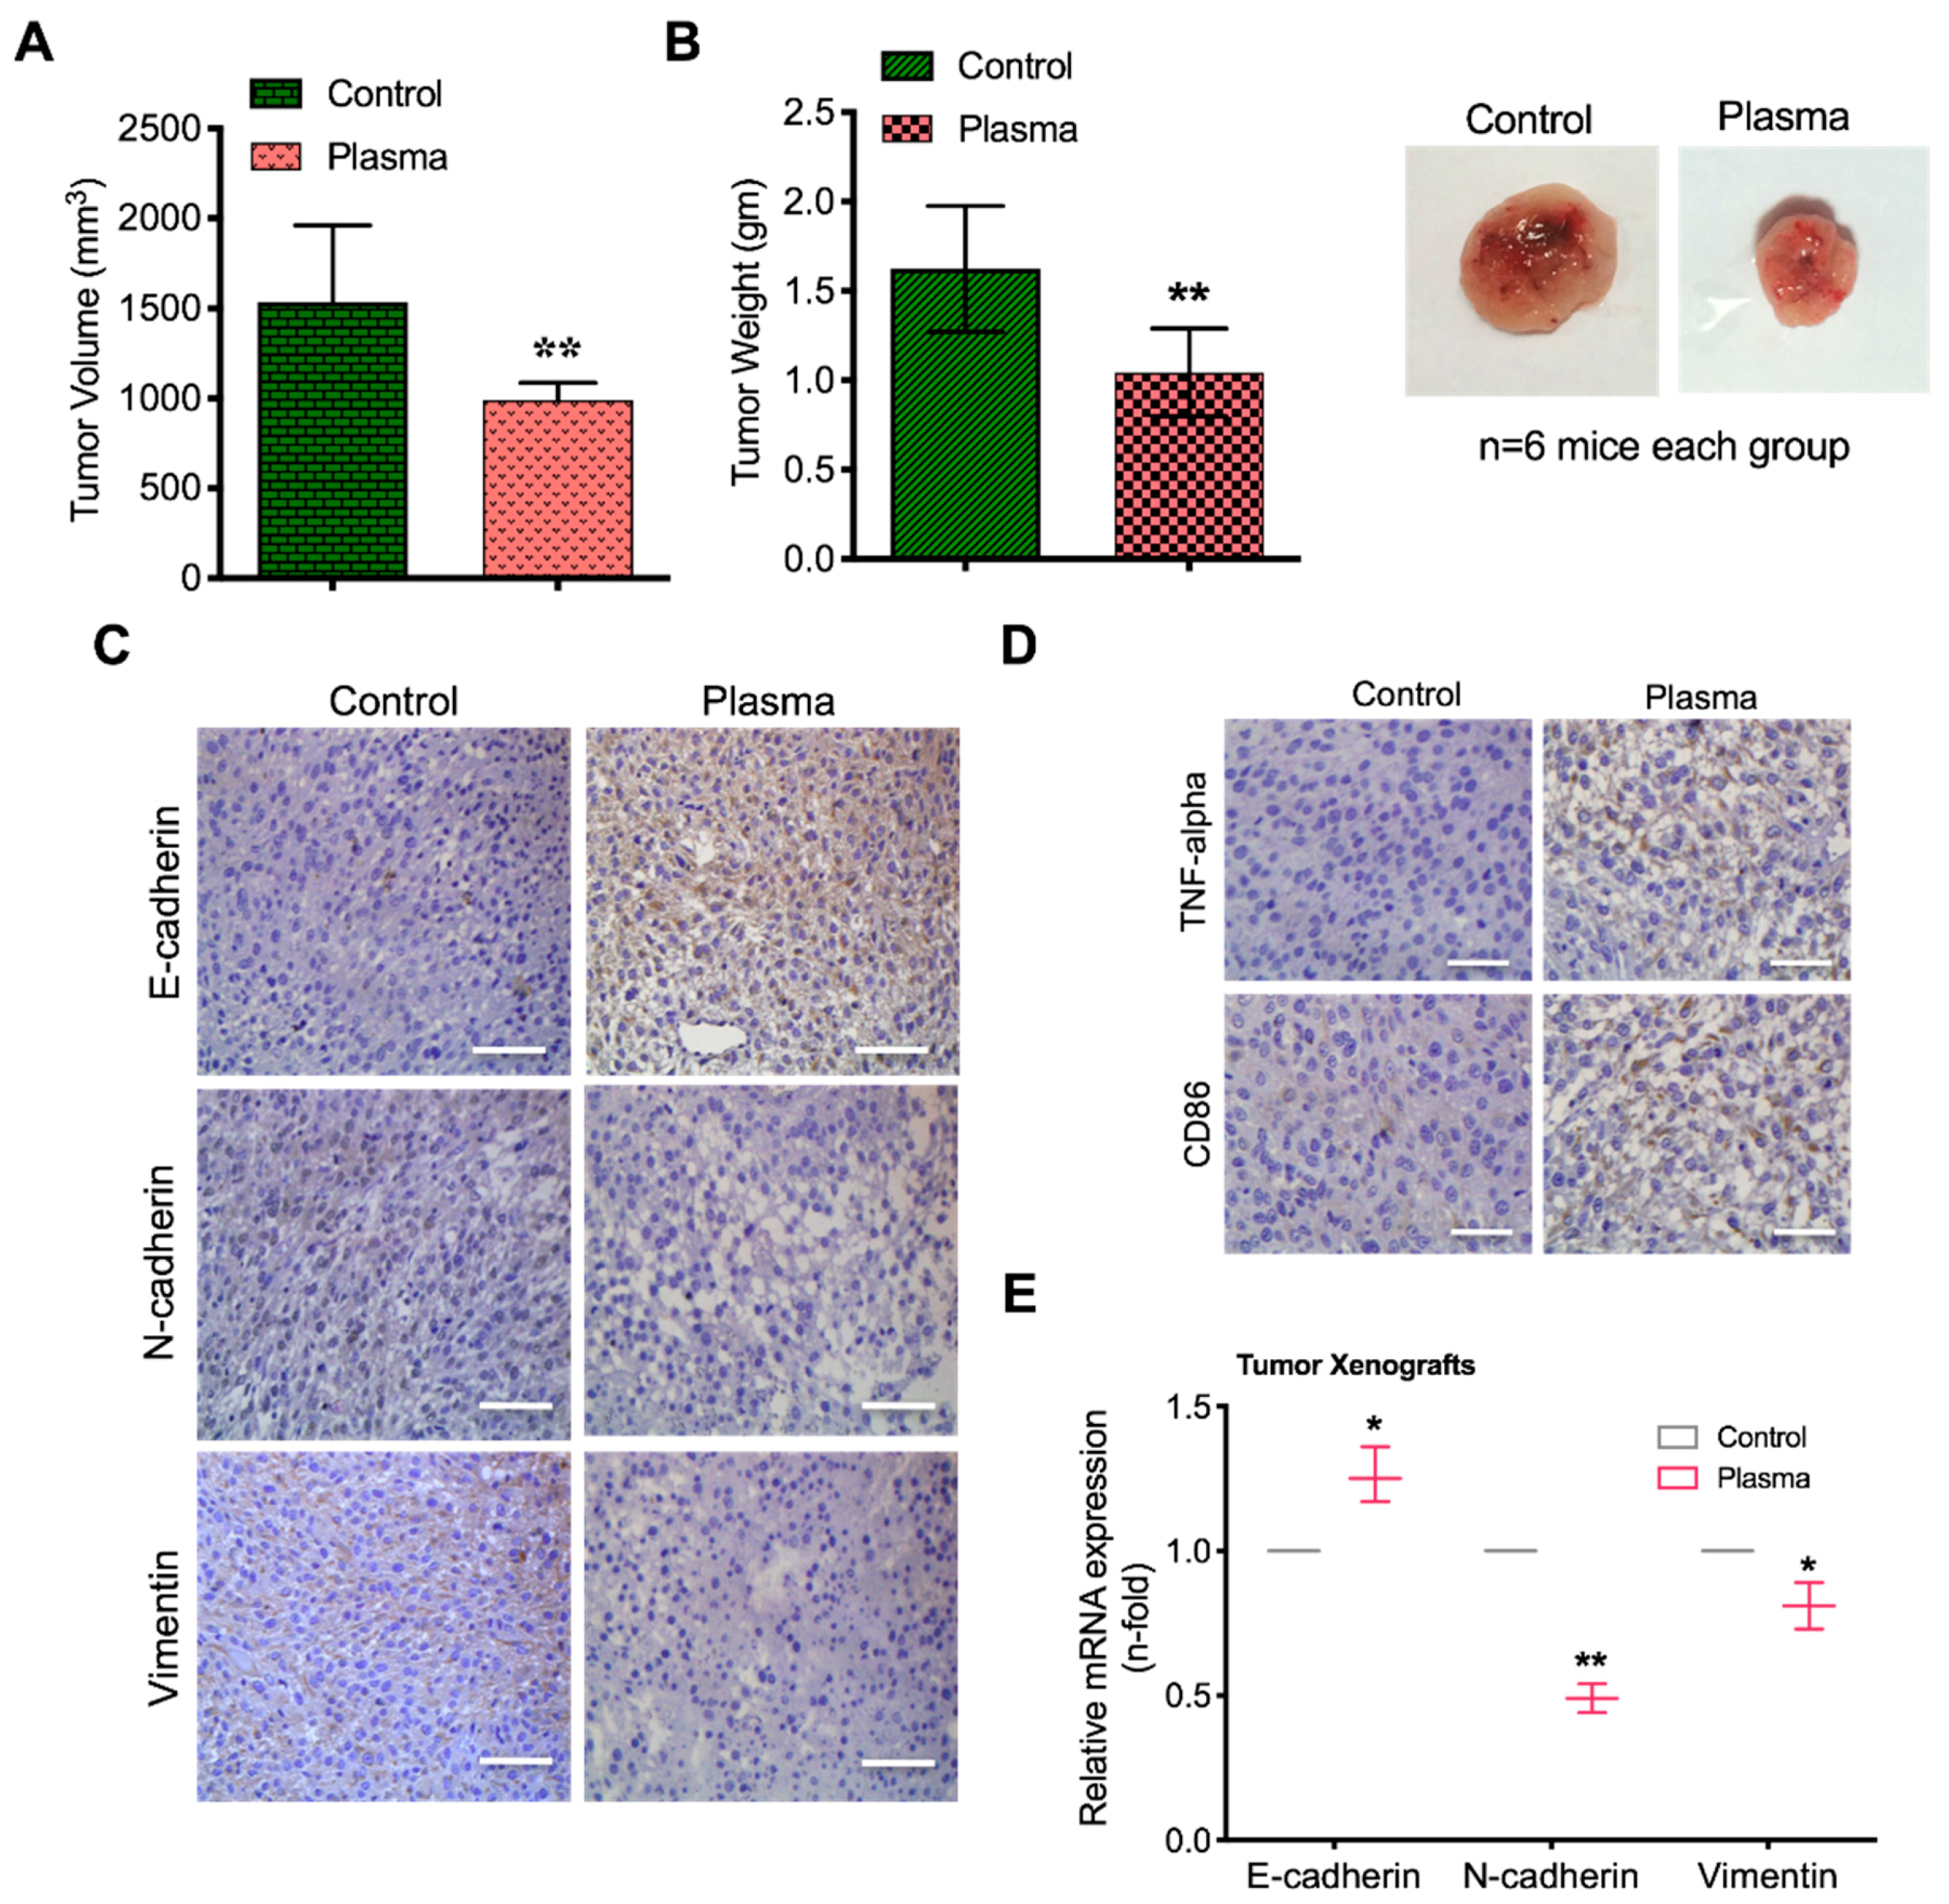
2.7. Plasma Attenuates Mesenchymal Markers In Vivo
3. Discussion
4. Materials and Methods
4.1. Human Cell Culture and Differentiation
4.2. Macrophage-Tumor Cell Co-Cultures
4.3. Flow Cytometry
4.4. Cytokine ELISA
4.5. Caspase-3 and ATP Assays
4.6. Confocal Microscopy
4.7. Migration and Invasion Assays
4.8. 3D Culture
4.9. qPCR and Western Blot
4.10. Animal Experiments
4.11. Immunohistochemistry
4.12. Kaplan-Meier Analysis
4.13. Statistical Analysis
5. Conclusions
Supplementary Materials
Author Contributions
Funding
Conflicts of Interest
References
- Condeelis, J.; Pollard, J.W. Macrophages: Obligate Partners for Tumor Cell Migration, Invasion and Metastasis. Cell 2006, 124, 263–266. [Google Scholar] [CrossRef] [PubMed]
- Lewis, C.E.; Pollard, J.W. Distinct Role of Macrophages in Different Tumor Microenvironments. Cancer Res. 2006, 66, 605–612. [Google Scholar] [CrossRef] [PubMed]
- Mantovani, A.; Sica, A.; Locati, M. New vistas on macrophage differentiation and activation. Eur. J. Immunol. 2007, 37, 14–16. [Google Scholar] [CrossRef] [PubMed]
- Pollard, J.W. Tumour-educated macrophages promote tumour progression and metastasis. Nat. Rev. Cancer 2004, 4, 71. [Google Scholar] [CrossRef] [PubMed]
- Buddingh, E.P.; Kuijjer, M.L.; Duim, R.A.J.; Bürger, H.; Agelopoulos, K.; Myklebost, O.; Serra, M.; Mertens, F.; Hogendoorn, P.C.W.; Lankester, A.C.; et al. Tumor-Infiltrating Macrophages Are Associated with Metastasis Suppression in High-Grade Osteosarcoma: A Rationale for Treatment with Macrophage Activating Agents. Clin. Cancer Res. 2011, 17, 2110–2119. [Google Scholar] [CrossRef] [PubMed]
- Staerkel, R.; Mazumder, A. Activation of tumoricidal properties in peripheral blood monocytes of patients with colorectal carcinoma. Cancer Res. 1986, 46, 994–998. [Google Scholar]
- Kurzman, I.D.; Shi, F.; Vail, D.M.; MacEwen, E.G. In vitro and in vivo enhancement of canine pulmonary alveolar macrophage cytotoxic activity against canine osteosarcoma cells. Cancer Biother. Radiopharm. 1999, 14, 121–128. [Google Scholar] [CrossRef] [PubMed]
- Fridman, G.; Friedman, G.; Gutsol, A.; Shekhter, A.B.; Vasilets, V.N.; Fridman, A. Applied Plasma Medicine. Plasma Process. Polym. 2008, 5, 503–533. [Google Scholar] [CrossRef]
- Fridman, G.; Brooks, A.D.; Balasubramanian, M.; Fridman, A.; Gutsol, A.; Vasilets, V.N.; Ayan, H.; Friedman, G. Comparison of Direct and Indirect Effects of Non-Thermal Atmospheric-Pressure Plasma on Bacteria. Plasma Process. Polym. 2007, 4, 370–375. [Google Scholar] [CrossRef]
- Kim, J.Y.; Ballato, J.; Foy, P.; Hawkins, T.; Wei, Y.; Li, J.; Kim, S.-O. Single-Cell-Level Cancer Therapy Using a Hollow Optical Fiber-Based Microplasma. Small 2010, 6, 1474–1478. [Google Scholar] [CrossRef]
- Keidar, M.; Walk, R.; Shashurin, A.; Srinivasan, P.; Sandler, A.; Dasgupta, S.; Ravi, R.; Guerrero-Preston, R.; Trink, B. Cold plasma selectivity and the possibility of a paradigm shift in cancer therapy. Br. J. Cancer 2011, 105, 1295–1301. [Google Scholar] [CrossRef] [PubMed]
- Panicker, S.P.; Raychaudhuri, B.; Sharma, P.; Tipps, R.; Mazumdar, T.; Mal, A.K.; Palomo, J.M.; Vogelbaum, M.A.; Haque, S.J. p300- and Myc-mediated regulation of glioblastoma multiforme cell differentiation. Oncotarget 2010, 1, 289–303. [Google Scholar] [PubMed]
- Sontheimer, H. Malignant gliomas: Perverting glutamate and ion homeostasis for selective advantage. Trends Neurosci. 2003, 26, 543–549. [Google Scholar] [CrossRef] [PubMed]
- Merzak, A.; Pilkington, G.J. Molecular and cellular pathology of intrinsic brain tumours. Cancer Metastasis Rev. 1997, 16, 155–177. [Google Scholar] [CrossRef] [PubMed]
- Kaushik, N.K.; Kaushik, N.; Min, B.; Choi, K.H.; Hong, Y.J.; Miller, V.; Fridman, A.; Choi, E.H. Cytotoxic macrophage-released tumour necrosis factor-alpha (TNF-α) as a killing mechanism for cancer cell death after cold plasma activation. J. Phys. D Appl. Phys. 2016, 49, 84001. [Google Scholar] [CrossRef]
- Pang, L.; Zhu, Y.; Qin, J.; Zhao, W.; Wang, J. Primary M1 macrophages as multifunctional carrier combined with PLGA nanoparticle delivering anticancer drug for efficient glioma therapy. Drug Deliv. 2018, 25, 1922–1931. [Google Scholar] [CrossRef]
- Thiyagarajan, M.; Sarani, A.; Nicula, C. Optical emission spectroscopic diagnostics of a non-thermal atmospheric pressure helium-oxygen plasma jet for biomedical applications. J. Appl. Phys. 2013, 113, 233302–2333028. [Google Scholar] [CrossRef]
- Kaushik, N.K.; Ghimire, B.; Li, Y.; Adhikari, M.; Veerana, M.; Kaushik, N.; Jha, N.; Adhikari, B.; Lee, S.J.; Masur, K.; et al. Biological and medical applications of plasma-activated media, water and solutions. Biol. Chem. 2018, 400, 39–62. [Google Scholar] [CrossRef]
- Kaushik, N.K.; Kaushik, N.; Yoo, K.C.; Uddin, N.; Kim, J.S.; Lee, S.J.; Choi, E.H. Low doses of PEG-coated gold nanoparticles sensitize solid tumors to cold plasma by blocking the PI3K/AKT-driven signaling axis to suppress cellular transformation by inhibiting growth and EMT. Biomaterials 2016, 87, 118–130. [Google Scholar] [CrossRef]
- Chhor, V.; Le Charpentier, T.; Lebon, S.; Oré, M.-V.; Celador, I.L.; Josserand, J.; Degos, V.; Jacotot, E.; Hagberg, H.; Sävman, K.; et al. Characterization of phenotype markers and neuronotoxic potential of polarised primary microglia in vitro. Brain. Behav. Immunol. 2013, 32, 70–85. [Google Scholar] [CrossRef]
- Cucak, H.; Grunnet, L.G.; Rosendahl, A. Accumulation of M1-like macrophages in type 2 diabetic islets is followed by a systemic shift in macrophage polarization. J. Leukoc. Biol. 2014, 95, 149–160. [Google Scholar] [CrossRef] [PubMed]
- Fjeldborg, K.; Pedersen, S.B.; Møller, H.J.; Christiansen, T.; Bennetzen, M.; Richelsen, B. Human adipose tissue macrophages are enhanced but changed to an anti-inflammatory profile in obesity. J. Immunol. Res. 2014, 2014, 309548. [Google Scholar] [CrossRef] [PubMed]
- Cohn, Z.A.; Benson, B. The Differentiation of Mononuclear Phagocytes. Morphology, Cytochemistry and Biochemistry. J. Exp. Med. 1965, 121, 153–170. [Google Scholar] [CrossRef] [PubMed]
- Kradin, R.L.; McCarthy, K.M.; Preffer, F.I.; Schneeberger, E.E. Flow-Cytometric and Ultrastructural Analysis of Alveolar Macrophage Maturation. J. Leukoc. Biol. 1986, 40, 407–417. [Google Scholar] [CrossRef] [PubMed]
- Macouillard-Poulletier de Gannes, F.; Belaud-Rotureau, M.A.; Voisin, P.; Leducq, N.; Belloc, F.; Canioni, P.; Diolez, P. Flow cytometric analysis of mitochondrial activity in situ: Application to acetylceramide-induced mitochondrial swelling and apoptosis. Cytometry 1998, 33, 333–339. [Google Scholar] [CrossRef]
- Kaushik, N.; Uddin, N.; Sim, G.B.; Hong, Y.J.; Baik, K.Y.; Kim, C.H.; Lee, S.J.; Kaushik, N.K.; Choi, E.H. Responses of solid tumor cells in DMEM to reactive oxygen species generated by non-thermal plasma and chemically induced ROS systems. Sci. Rep. 2015, 5, 8587. [Google Scholar] [CrossRef] [PubMed]
- Ismail, I.H.; Hendzel, M.J. The γ-H2A.X: Is it just a surrogate marker of double-strand breaks or much more? Environ. Mol. Mutagen. 2008, 49, 73–82. [Google Scholar] [CrossRef] [PubMed]
- Redon, C.E.; Nakamura, A.J.; Zhang, Y.-W.; Ji, J.J.; Bonner, W.M.; Kinders, R.J.; Parchment, R.E.; Doroshow, J.H.; Pommier, Y. Histone gammaH2AX and poly(ADP-ribose) as clinical pharmacodynamic biomarkers. Clin. Cancer Res. 2010, 16, 4532–4542. [Google Scholar] [CrossRef] [PubMed]
- Sato, M.; Shames, D.S.; Hasegawa, Y. Emerging evidence of epithelial-to-mesenchymal transition in lung carcinogenesis. Respirology 2012, 17, 1048–1059. [Google Scholar] [CrossRef]
- Singh, S.K.; Hawkins, C.; Clarke, I.D.; Squire, J.A.; Bayani, J.; Hide, T.; Henkelman, R.M.; Cusimano, M.D.; Dirks, P.B. Identification of human brain tumour initiating cells. Nature 2004, 432, 396. [Google Scholar] [CrossRef]
- Bao, S.; Wu, Q.; McLendon, R.E.; Hao, Y.; Shi, Q.; Hjelmeland, A.B.; Dewhirst, M.W.; Bigner, D.D.; Rich, J.N. Glioma stem cells promote radioresistance by preferential activation of the DNA damage response. Nature 2006, 444, 756. [Google Scholar] [CrossRef] [PubMed]
- Shiao, S.L.; Coussens, L.M. The Tumor-Immune Microenvironment and Response to Radiation Therapy. J. Mammary Gland Biol. Neoplasia 2010, 15, 411–421. [Google Scholar] [CrossRef] [PubMed] [Green Version]
- Gordon, S.B.; Irving, G.R.; Lawson, R.A.; Lee, M.E.; Read, R.C. Intracellular trafficking and killing of Streptococcus pneumoniae by human alveolar macrophages are influenced by opsonins. Infect. Immunol. 2000, 68, 2286–2293. [Google Scholar] [CrossRef] [PubMed]
- Murray, P.J.; Allen, J.E.; Biswas, S.K.; Fisher, E.A.; Gilroy, D.W.; Goerdt, S.; Gordon, S.; Hamilton, J.A.; Ivashkiv, L.B.; Lawrence, T.; et al. Macrophage activation and polarization: Nomenclature and experimental guidelines. Immunity 2014, 41, 14–20. [Google Scholar] [CrossRef] [PubMed]
- Murray, P.J.; Wynn, T.A. Protective and pathogenic functions of macrophage subsets. Nat. Rev. Immunol. 2011, 11, 723–737. [Google Scholar] [CrossRef]
- Decker, T.; Lohmann-Matthes, M.L.; Gifford, G.E. Cell-associated tumor necrosis factor (TNF) as a killing mechanism of activated cytotoxic macrophages. J. Immunol. 1987, 138, 957–962. [Google Scholar] [PubMed]
- Galván-Peña, S.; O’Neill, L.A.J. Metabolic reprograming in macrophage polarization. Front. Immunol. 2014, 5, 420. [Google Scholar]
- Gordon, S. Alternative activation of macrophages. Nat. Rev. Immunol. 2003, 3, 23. [Google Scholar] [CrossRef]
- Lamouille, S.; Xu, J.; Derynck, R. Molecular mechanisms of epithelial–mesenchymal transition. Nat. Rev. Mol. Cell Biol. 2014, 15, 178. [Google Scholar] [CrossRef]


© 2019 by the authors. Licensee MDPI, Basel, Switzerland. This article is an open access article distributed under the terms and conditions of the Creative Commons Attribution (CC BY) license (http://creativecommons.org/licenses/by/4.0/).
Share and Cite
Kaushik, N.K.; Kaushik, N.; Adhikari, M.; Ghimire, B.; Linh, N.N.; Mishra, Y.K.; Lee, S.-J.; Choi, E.H. Preventing the Solid Cancer Progression via Release of Anticancer-Cytokines in Co-Culture with Cold Plasma-Stimulated Macrophages. Cancers 2019, 11, 842. https://doi.org/10.3390/cancers11060842
Kaushik NK, Kaushik N, Adhikari M, Ghimire B, Linh NN, Mishra YK, Lee S-J, Choi EH. Preventing the Solid Cancer Progression via Release of Anticancer-Cytokines in Co-Culture with Cold Plasma-Stimulated Macrophages. Cancers. 2019; 11(6):842. https://doi.org/10.3390/cancers11060842
Chicago/Turabian StyleKaushik, Nagendra Kumar, Neha Kaushik, Manish Adhikari, Bhagirath Ghimire, Nguyen Nhat Linh, Yogendra Kumar Mishra, Su-Jae Lee, and Eun Ha Choi. 2019. "Preventing the Solid Cancer Progression via Release of Anticancer-Cytokines in Co-Culture with Cold Plasma-Stimulated Macrophages" Cancers 11, no. 6: 842. https://doi.org/10.3390/cancers11060842
APA StyleKaushik, N. K., Kaushik, N., Adhikari, M., Ghimire, B., Linh, N. N., Mishra, Y. K., Lee, S.-J., & Choi, E. H. (2019). Preventing the Solid Cancer Progression via Release of Anticancer-Cytokines in Co-Culture with Cold Plasma-Stimulated Macrophages. Cancers, 11(6), 842. https://doi.org/10.3390/cancers11060842