Article

Amplification of the EGFR and CCND1 Are Coordinated and Play Important Roles in the Progression of Oral Squamous Cell Carcinomas

1
Department of Public Health, Chang Gung University, Tao-Yuan 33302, Taiwan
2
Department of Nutrition and Health Sciences, Chang Gung University of Science and Technology, Tao-Yuan 33302, Taiwan
3
Department of Anatomy, Chang Gung University, Tao-Yuan 33302, Taiwan
4
Department of Otolaryngology, Head and Neck Surgery, Chang Gung Memorial Hospital, Linkou branch, Tao-Yuan 33302, Taiwan
5
Division of Hematology/Oncology, Department of Internal Medicine, Chang Gung Memorial Hospital, Linkou branch, Tao-Yuan 33302, Taiwan
*
Author to whom correspondence should be addressed.
Cancers 2019, 11(6), 760; https://doi.org/10.3390/cancers11060760
Submission received: 6 May 2019 / Revised: 23 May 2019 / Accepted: 25 May 2019 / Published: 31 May 2019
(This article belongs to the Special Issue Targeting Head and Neck Cancer)

Abstract

:
Oral squamous cell carcinoma (OSCC) is a common cancer in Taiwan and worldwide. To provide some clues for clinical management of OSCC, 72 advanced-stage OSCCs were analyzed using two microarray platforms (26 cases with Affymetrix 500 K and 46 cases with Affymetrix SNP 6.0). Genomic identification of significant targets in cancer analyses were used to identify significant copy number alterations (CNAs) using a q-value cutoff of 0.25. Among the several significant regions, 12 CNAs were common between these two platforms. Two gain regions contained the well-known oncogenes EGFR (7p11.2) and CCND1 (11q13.3) and several known cancer suppressor genes, such as FHIT (3p14.2–p12.1), FAT1 (4q35.1), CDKN2A (9p21.3), and ATM (11q22.3–q24.3), reside within the 10 deletion regions. Copy number gains of EGFR and CCND1 were further confirmed by fluorescence in situ hybridization and TaqMan CN assay, respectively, in 257 OSCC cases. Our results indicate that EGFR and CCND1 CNAs are significantly associated with clinical stage, tumor differentiation, and lymph node metastasis. Furthermore, EGFR and CCND1 CNAs have an additive effect on OSCC tumor progression. Thus, current genome-wide CNA analysis provides clues for future characterization of important oncogenes and tumor suppressor genes associated with the behaviors of the disease.

1. Introduction

Cancer is complicated in its behavior which is usually related with genomic instability [1]. The genetic alterations are not the same in every tumor cell. Tumor cells that harbor chromosomal aberrations involving important tumor suppressor genes or oncogenes could behave more aggressively and can be used as predictive and prognostic markers [2]. Oral cancer ranked fourth in the incidence of all cancers in Taiwan and is the sixth most common malignancy worldwide [3]. Cigarette, areca quid (AQ), and alcohol are the three main environmental carcinogens for oral squamous cell carcinoma (OSCC) in Taiwan [4,5]. Several studies demonstrated that both tobacco and areca nut extract are toxic to cells and induce genome instability [6,7]. In recent years, new radiation therapy techniques, target therapies and immuno-oncologic agents have been developed in cancer treatment but the advancements in the control of oral cancer were limited. The 5-year survival rate of OSCC has remained almost unchanged at about 50% over the past 30 years [8]. Therefore, we utilized high-throughput genome-wide analysis to improve our understanding of the existing therapies and explored the possibilities for new therapeutics. Copy number alterations (CNAs) are a sign of genome instability and are frequently observed in malignant tumors. CNAs have been extensively investigated in many cancers, and some known biomarkers were identified though these studies (e.g., EGFR amplification in non-small cell lung cancer [9]; erb-b2 amplification in breast cancer [10]). Understanding the genetic alterations and related molecular mechanisms that drive the tumorigenesis and metastasis of OSCCs can help investigators develop new therapeutic strategies and improve the control of oral cancer. The single nucleotide polymorphism (SNP) array has opened up new possibilities to catalogue CNAs at high resolution and throughput [11,12,13]. Several chromosomal aberrations have been identified in previous OSCCs studies, including both loss and gain of chromosomes [14]. Only a minority of these loci involve the true “driver” genes contributing to tumorigenesis and/or tumor progression. The others, considered “passenger” genes, may be altered simply because of their chromosomal location and proximity to the target genes [15]. Thus, identifying true disease-related aberrations may provide clues for the treatment and/or prognosis of OSCC. In the present study, we analyzed 26 and 46 OSCCs on the platforms of Affymetrix 500-K and Affymetrix Genome-Wide Human SNP Array 6.0, respectively. Furthermore, to distinguish important CNAs from random events, we used genomic identification of significant targets in cancer (GISTIC), which considers both the frequency and degree of CNAs [16]. Finally, fluorescence in situ hybridization (FISH) and TaqMan copy number (CN) assays were used for validation. The roles and clinical significance of amplification of the EGFR and CCND1 in OSCC were investigated.

2. Results

2.1. Identification of Common, Distinct CNAs in 72 OSCCs

High-resolution genomic analyses using 500 K SNP arrays and SNP 6.0 arrays were performed in 26 and 46 cases, respectively (Table 1). GISTIC analyses identified 41 (2 gains and 39 losses) and 32 (4 gains and 28 losses) distinct CNAs from the 500 K and SNP 6.0 platforms, respectively (Tables S1 and S2). The median number of distinct CNAs (gains or losses) per OSCC was 10 (range: 0–27) for the 500 K platform and 7 (range: 0–27) for the SNP 6.0 platform (Figure S1). It is worth noting that similar patterns of CN gains and diverse patterns of CN losses were observed from these two platforms (Figure S2). Based on the position of distinct CNAs estimated from GISTIC, a total of 12 common distinct CNAs (namely gains in 7p11.2 and 11q13.3; losses in 2q23.3–q24.2, 3p14.2–p12.1, 4q35.2, 7q33–q34, 9p21.3, 11q22.3–q24.3, 16q23.1, 18q11.2–q22.3, 21q21.1 and 21q22.3) were identified by these two platforms (Table 2). Among them, the highest frequency (51%, 37/72) of CNAs occurred in 7p11.2 and 11q13.3. To validate CNAs found in the present series of OSCCs, SNP 6.0 array data from another 68 Taiwanese OSCCs were randomly extracted from the Gene Expression Omnibus data repository (accession number GSE25103) [17], processed with GenePattern pipeline; 51 CNAs (8 gains and 43 losses) were observed (Table S3). As indicated in Table 2, 9 (75%, two gains and seven losses) of the 12 common CNAs were also identified in this dataset; this confirms that CN gains in 7p11.2 and 11q13.3 were common in Taiwanese OSCCs.

2.2. Confirmation of EGFR and CCND1, Including in the CNA Region of 7p11.2 and 11q13.3

As stated above, there were two common CN gains (7p11.2 and 11q13.3) refined in GISTIC analyses. Based on the GISTIC high-peak region, the CN gain in 7p11.2 (spanning 54.62 to 55.86 Mb) contained EGFR and SEC61G, and the CN gain in 11q13.3 (spanning 68.96 to 70.32 Mb) contained MYEOV, CCND1, ORAOV1, FADD, and CTTN. EGFR is the most likely candidate driver gene in 7p11.2 involved in OSCC molecular pathogenesis [18]. The cell cycle regulatory gene CCND1 located in 11q13.3 is a downstream effector of EGFR and is commonly deregulated in various cancers including head and neck cancer. Moreover, several studies have reported that CCND1 amplification and overexpression are associated with poor prognosis, cisplatin resistance, and EGFR-inhibitor resistance [19,20]. Thus, these two genes were further validated using FISH (EGFR) or TaqMan CN assays (CCND1). The validation rate was 75% for EGFR and 67% for CCND1 (Figure S3).

2.3. Clinical Implications of CNA’s in EGFR and CCND1

To further explore the clinical value of common CN gains of EGFR and CCND1 in OSCC, 257 OSCC cases were included for further analysis (Table 1). Of these, 27 (11%) and 52 (20%) OSCCs displayed EGFR polysomy and amplification, respectively, and 135 (53%) displayed CCND1 CN amplification (Table 3). In addition, as shown in Table 3, EGFR CNA’s (polysomy or amplification) were associated with young age (chi-square trend test, p = 0.04), advanced tumor stage (p = 0.01), a higher grade of tumor differentiation (p = 0.03), and LNM (p < 0.01), but not with tumor site, AQ chewing, cigarette smoking, or alcohol drinking. CCND1 CN amplification was associated with advanced tumor stage (p = 0.04), a higher grade of tumor differentiation (p < 0.01), LNM (p < 0.01), and alcohol drinking (p = 0.03), but not age, the tumor site, AQ chewing, or cigarette smoking. On the other hand, the CNA frequency of EGFR was 31% (79/257), and the proportion of CCND1 amplification was 53% (135/257). Both the EGFR and CCND1 were altered in 22% (56/257) of OSCC samples (Table S4). When we considered the statuses of both genes, the synergistic effects of EGFR and CCND1 were associated with tumor stage (p < 0.01), LNM (p < 0.01), and tumor differentiation (p < 0.01) (Table 3).

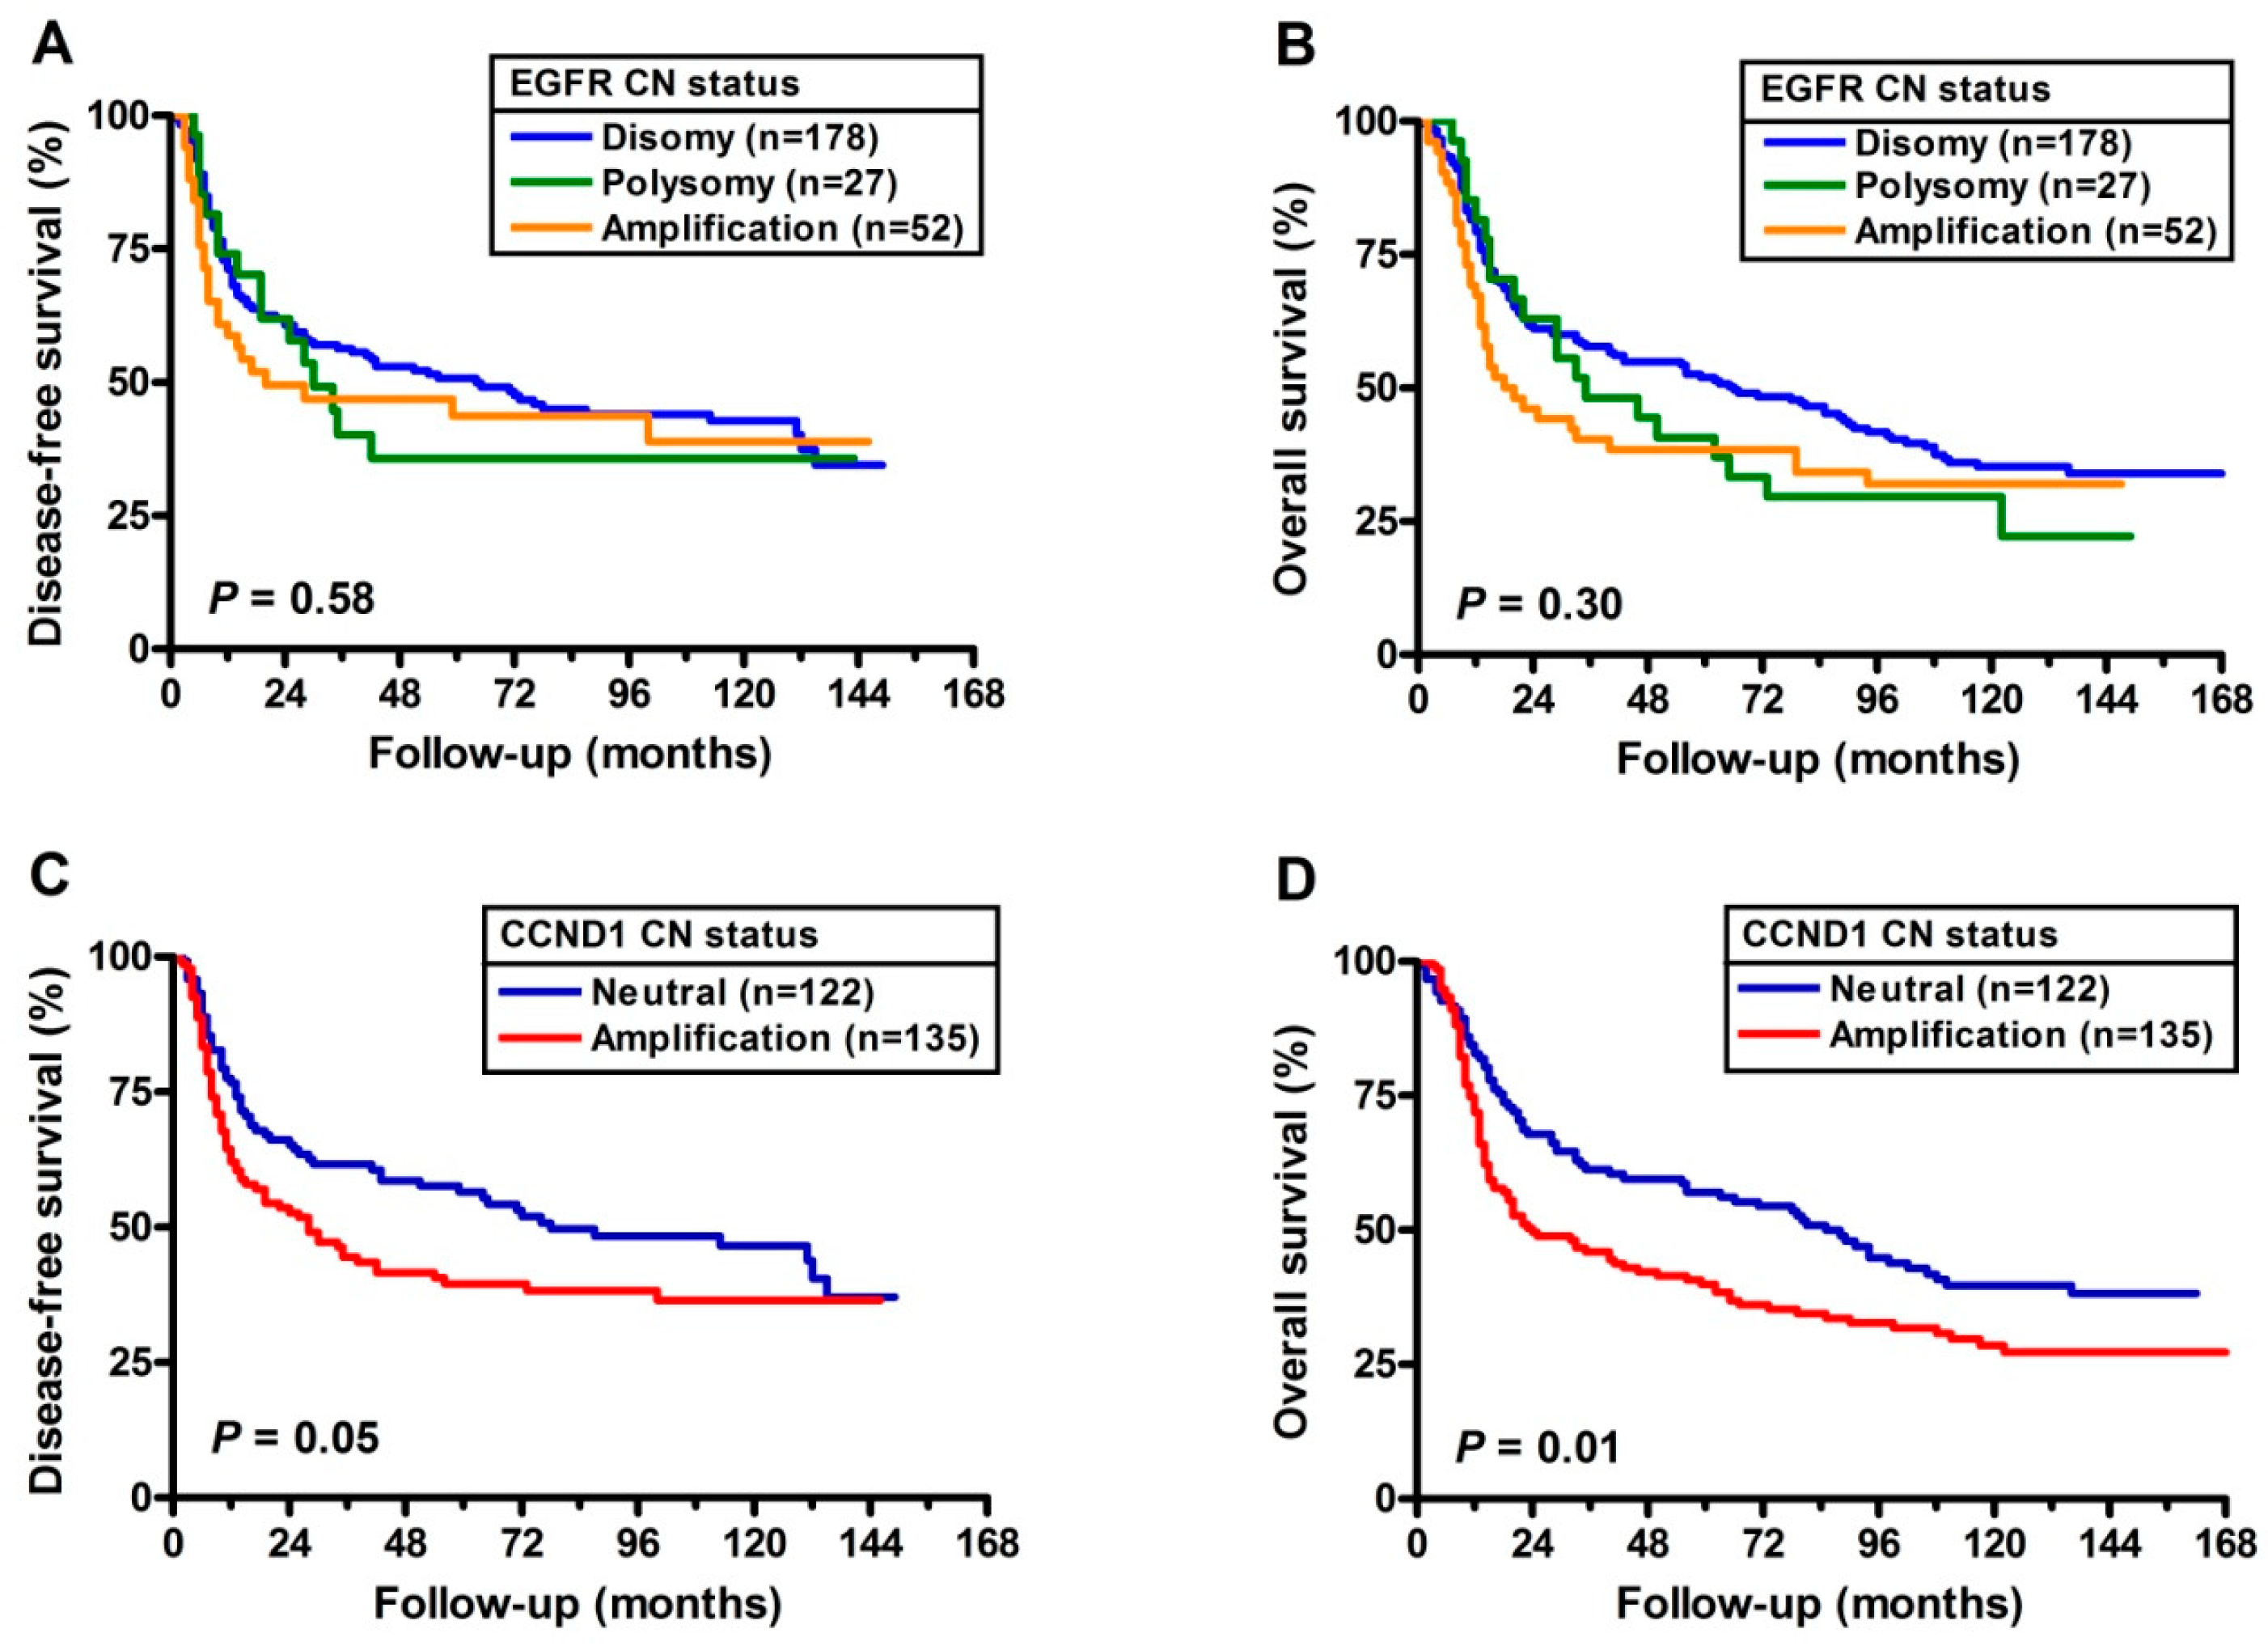
2.4. Prognostic Implications of CNA’s with EGFR and CCND1

Kaplan-Meier survival curves for DFS and overall survival (OS) are presented in Figure 1. Although not statistically significant, the three EGFR FISH patterns with median time to relapse were 64.00, 30.00, and 20.00 months. In addition, the median times to death were 89.00, 46.00, and 33.00 months. On the other hand, as shown in panels C and D, the median DFS in those with CCND1 CN neutral were 78.00 months and those with CCND1 CN amplification were 28 months. The median OS in those with CCND1 CN neutral were 102.00 months and those with CCND1 CN amplification were 41.00 months. The curves demonstrate the adverse impact of CCND1 CN amplification on both DFS (borderline, p = 0.05) and OS (p = 0.01). Furthermore, the OSCC patients with the worst prognoses had both the EGFR and CCND1 with CNAs (hazards ratio (HR) = 1.750, 95% CI = 1.126–2.719) (Table 4). The median DFS in those having both EGFR and CCND1 CN neutral, either EGFR or CCND1 amplification and both EGFR/CCND1 CN amplification were 87.00 months, 30.00 months, and 28.00 months respectively. The median OS in those having both EGFR and CCND1 CN neutral, either EGFR or CCND1 amplification and both EGFR/CCND1 CN amplification were 102.00 months, 65.00 months, and 33.00 months respectively (Figure 2).

3. Discussion

Initially, the experiments were performed on 500-K SNP arrays followed by SNP 6.0 arrays, which have a much higher resolution for the detection of CNAs (with more than 1.8 million markers). GISTIC analyses can determine CNAs associated with OSCC from potentially random events and organizes the profiles of both platforms. The two platforms reveal several CNAs and individually highlight genomic regions that are most likely to encode oncogenes and tumor suppressor genes (Tables S1 and S2). To identify the clinical significance of CNAs, regions of common CNAs were identified in 72 OSCC tumors on two different platforms (Table 2). There were several established cancer genes involved in a total of 12 common CNAs identified according to GISTIC, including EGFR [21], CCND1 [22], FHIT [23], and FAT1 [24]. These data demonstrate that the GISTIC method was reliable despite the small sample size. The amplicons at 7p11.2 and 11q13.3 were the top two CNAs. These findings are similar to observations of CNAs from 29 OSCCs in a study in Taiwan that used the 250K SNP array method [18]. The higher CNA frequency of 7p11.2 (51% vs. 31%) and 11q13.3 (51% vs. 17%) in our study might be due to the increasing density of the SNP array (500-K SNP array and SNP 6.0). EGFR and CCND1 were the GISTIC-identified CNA target genes in the top two CNA peaks. EGFR is the candidate gene of the 7p11.2 region and regulates many cellular functions including cell proliferation and survival through tyrosine kinase downstream signaling such as the PI3K-AKT pathway or STAT3 activation [25]. CCND1 is a proto-oncogene that encodes cyclin D1, which is a key regulator of the G1 phase of the cell cycle [26]. Cyclin D1 binds and activates CDK4 and CDK6, and this complex catalyzes Rb protein phosphorylation resulting in the release of transcriptional regulators E2F from Rb, which promotes cell cycle progression [26]. The role of CCND1 had been investigated in both HNSCCs and oral cancers. The results indicated CCND1 plays an important role in the tumor progression in OSCC and is a prognostic marker [20,27]. Interestingly, these two major genes are also significant in a published dataset in Taiwan [17]. These findings highlight the critical role of EGFR and CCND1 in OSCC in Taiwan.
Furthermore, we used two different approaches to verify the CN of EGFR and CCND1. Using the FISH method, the frequency of EGFR changes (polysomy or amplification) was 31% (79/257). The frequency of EGFR CNAs has been reported to be 18–44% [14,28,29]. The large range might be due to differences in tumor location and tumor stage. EGFR amplification is also frequently found in many cancers such as lung cancer, breast cancer, and glioblastomas [30]. CN amplification is associated with LNM and poorer prognoses in HNSCC [28,31]. In our study, the increased EGFR gene copies showed a higher risk of LNM (OR = 2.368, 95% CI = 1.372–4.026, p < 0.01). Comparing the median survival times, there was a definite trend toward worse survival in cases with increased EGFR gene copies, although the association between EGFR amplification and survival was nonsignificant. According to a previous study, EGFR gene amplification is highly correlated with overexpression of EGFR protein [32]. EGFR expression is also correlated with lower histologic tumor differentiation [33]. In this study, we found a similar association between tumor differentiation and EGFR CNAs.
The frequency of CCND1 amplification (135/257, 53%) found in this study was similar to a previous OSCC study in Taiwan (41/82, 50%) [22]. We found that CCND1 gene amplification significantly correlated with poorer differentiation and LNM. Liu et al. and Myo et al. have shown that CCND1 CNA are related with cyclin D1 protein overexpression [22,34]. In a previous study, we noted the overexpression of CCND1 protein in 37% of OSCC cases and found that this was correlated with tumor differentiation, LNM, and poor clinical outcomes. Thus, CCND1 amplification may indirectly contribute to the acquisition of invasive ability and metastatic potential. Another explanation of this observation is that CCND1 amplification might reflect general genomic instability in cancer cells, and such cells possess a more aggressive phenotype [35]. Smoking, alcohol drinking, and AQ chewing are well-known risk factors for OSCC. Alcoholic drinks might act as a solvent for the penetration of carcinogens through the mucosa of the upper aerodigestive organ [36]. Furthermore, research on alcohol and cancer remains limited in terms of clinical, epidemiological, and experimental settings. Although only borderline, alcohol consumption increased the risk for CCND1 CNA (relative risk (RR) = 1.860, 95% CI = 1.011–3.422) in our study (Table S5). Recently, Urashima et al. found that several somatic CNAs were associated with heavy alcohol consumption including CCND1 amplification (heavy drinkers vs. moderate/non-drinkers, RR = 1.94, 95% CI = 1.12–3.37, p = 0.019) [37]. The presence of ECS is a marker for a biologically-aggressive disease and is the most pivotal predictor of survival, recurrence, and distant metastasis [38]. Michikawa et al., indicated that the identification of numerical aberrations in EGFR might be a more useful tool for selecting patients at high risk for ECS compared to CCND1 aberrations [38]. However, we previously found a positive association between the overexpression of CCND1 protein and ECS [39]. We might need a large cohort to further clarify the correlation between CCND1 amplification and ECS status (Table 3). In this study, CCND1 CNAs were significantly associated with reduced DFS and OS, and these observations were highly correlated with LNM.
CCND1 plays a crucial role in canonical or non-canonical pathways of EGFR [40]. Furthermore, several in vitro studies have shown that deregulated CCND1 overexpression is significantly associated with resistance of HNSCC to EGFR inhibitors. These observations suggest that CCND1 is a pivotal downstream target gene in EGFR-driven tumorigenesis. Therefore, the genetic statuses of not only EGFR but also CCND1 are needed to predict the therapeutic effects of EGFR inhibitors [19,41]. In our observations, OSCC patients with two concomitant events have the worst prognosis (Figure 2B, Table 4). Moreover, the rate of co-alterations in both genes was 22% (56/257), higher than in a previous study (10%, 3/29) [18]. However, this finding still suggests that there are other downstream targets for EGFR and other upstream regulators for CCND1. These findings may have important therapeutic implications for OSCC patients.

4. Materials and Methods

4.1. Patients, Specimens and Clinical Diagnosis

This study was approved by the Institutional Review Board of Chang Gung Medical Foundation, Lin-Kou, Taiwan (IRB#102-5616B). All patients included in the study received primary radical surgery at this hospital between 1999 and 2004. The methods in this study were carried out in accordance with the relevant guidelines, including any relevant details. All patients gave written informed consent before participating, and information regarding current and past cigarette smoking, alcohol drinking, and AQ chewing habits was obtained. All cases were histologically confirmed and scored according to the recommendations for the reporting of specimens containing oral cavity, oropharynx, or hypopharynx neoplasms by the Association of Directors of Anatomical and Surgical Pathology (ADASP) (2000). For each case, tumor tissues were taken, dissected into small pieces, frozen immediately in liquid nitrogen, and stored at −80 °C. Ten milliliters of venous blood was separated into plasma, buffy coat cells, and red blood cells by centrifugation within 18 h of obtaining the blood. Then the buffy coat cells were stored at −80 °C. Genomic DNA from the tissue and buffy coat were purified as previously described [42]. Because the sex ratio (male versus female) of OSCC incidence in Taiwan was ~10.4 after adjusting for age, only male patients were included. High-resolution genomic analyses using 500-K SNP arrays and SNP 6.0 arrays were performed in 26 and 46 cases, respectively. In addition, a total of 257 OSCCs were included for further EGFR and CCND1 CN analysis (Table 1).

4.2. High-Resolution SNP Array and Data Analysis

A total of 500 ng genomic DNA from each OSCC were subjected to SNP genotyping with either the Human Mapping 500-K Array set or Genome-Wide Human SNP Array 6.0 (Affymetrix Inc, Santa Clara, CA, USA). Genomic DNA preparation and chip processing were performed according to Affymetrix’s recommended protocols. Genotyping was performed at the National Center for Genome Medicine (NCGM) t Academia Sinica, Taipei, Taiwan. Array image data were preliminarily analyzed with Genotyping Console 4.0 to derive the CEL files. The CEL files of the 500-K Array were processed using Partek Genomic Suite (Partek Inc., Chesterfield, MO, USA), and CNs were created from allele intensities, using 270 CN samples from the HapMap collection as the baseline. Log ratio intensities were adjusted for local GC content in unpaired samples to decrease genomic waviness, and CNA segments (gains and losses) were built using a Hidden Markov Model with a minimum of four genomic markers per CNA segment. The CEL files of SNP Array 6.0 and 45 HapMap Han Chinese data were processed using a GenePattern pipeline that runs the following modules: SNPFileCreator_SNP6, CopyNumberInference, RemoveCopyNumberOutliers, TangentNormalization, and ParallelCBS. Distinct, recurrent CNA from the above two platforms were identified by GISTIC 2.0 using a Web-based interface (http://genepattern.broadinstitute.org/) with CNA thresholds of +0.1, a join segment size of four markers, and a q-value threshold of 0.25 [43]. The naturally occurring CNVs presented in the Database of Genomic Variants (DGV) were excluded during GISTIC 2.0 processing. SNP, gene, and cytogenetic band locations were based on GRCh37/hg19. To validate the CNAs found in our study, SNP 6.0 array data of 68 Taiwanese OSCCs were randomly extracted from the Gene Expression Omnibus data repository (accession number GSE25103) [17] and further processed using GenePattern pipeline as described above.

4.3. Fluorescence In Situ Hybridization (FISH) for EGFR

FISH analyses were performed as previously described using the LSI EGFR SpectrumOrange/CEP 7 SpectrumGreen probe system (Vysis; Abbott Laboratories, Downers Grove, IL, USA) [32]. At least 100 non-overlapping nuclei per case were scored independently by two independent observers. EGFR FISH patterns were classified as follows: normal disomy, with ≤2 copies in more than 90% of analyzed cells; polysomy, ≥3 copies in more than 40% of analyzed cells; and amplification defined by the presence of tight EGFR clusters in ≥10% of analyzed cells [32].

4.4. TaqMan CN Assays via Quantitative Real-Time Polymerase Chain Reaction (qPCR) for CCND1

Next, qPCR analyses were performed according to the Minimum Information for Publication of Quantitative Real-Time PCR Experiments (MIQE) guidelines [44]. CCND1 CN was measured using a duplex TaqMan Gene Copy Number Assay (Applied Biosystems). Two hydrolysis probes were selected, in exon 1 (Hs01818912_cn) and exon 5 (Hs02353610_cn), using RNase P as a reference for the duplex assay. CN assays were performed in triplicate using TaqMan Genotyping Master Mix in the 7500 Fast Real-Time PCR System (Applied Biosystems, Foster City, CA, USA). Thermal cycling conditions included initial denaturation at 95 °C for 10 min, followed by 40 cycles of 15 s at 95 °C for denaturing and 60 s at 60 °C for annealing and extension. Two known control samples from peripheral blood (carrying two alleles) were included in each reaction plate. The comparative quantification cycle (∆∆Cq) method was used for data analysis and >0.59 was set as the cutoff value for amplification [21].

5. Conclusions

In the present study, we constructed a CNA profile of OSCC in Taiwan using a high-density SNP array and GISTIC. Furthermore, we validated the alterations in EGFR and CCND1 and demonstrated the clinical implications of these two candidate genes.

Supplementary Materials

The following are available online at https://www.mdpi.com/2072-6694/11/6/760/s1, Figure S1: Distribution of the number of CNAs (events) per sample, Figure S2: Circos plots of CNA’s detected in 72 OSCCs by GISTIC, Figure S3: Validation of EGFR and CCND1 genes copy number alterations, Table S1: Distinct copy number gains and losses identified from 26 OSCCs using 500-K array platform, Table S2: Distinct copy number gains and losses identified from 46 OSCCs using SNP 6.0 platform, Table S3: Distinct copy number gains and losses identified from 68 OSCCs randomly extracted from GSE25103 data repository, Table S4: Association between EGFR and CCND1 genes CN status and Table S5: Association between CCND1 CN status and cigarette smoking, AQ chewing and alcohol drinking.

Author Contributions

Conceptualization, S.-F.H. and H.-T.C.; methodology, S.-D.C., S.-F.H. and H.-T.C.; validation, S.-F.H. and H.-T.C.; formal analysis, H.-T.C.; investigation, S.-F.H. and H.-T.C.; resources, C.-T.L., H.-M.W., S.-F.H. and S.-D.C.; writing—original draft preparation, H.-T.C.; writing—review and editing, S.-F.H., C.-T.L. and H.-M.W.; visualization, H.-T.C.; supervision, S.-F.H.; project administration, S.-F.H.; funding acquisition, S.-F.H.

Funding

This study was supported by Grants CMRPG3F0671, CMRPG3F2221, CMRPG3F2222, and CMRPB53 from Chang Gung Memorial Hospital and grant MOST106-2314-B-182-025-MY3 from the Ministry of Science and Technology, Executive Yuan, Taiwan, ROC and by the Health and Welfare Surcharge on Tobacco Products (grant MOHW107-TDU-B-212-114016 and MOHW108-TDU-B-212-124016) from the Ministry of Health and Welfare (MOHW), Executive Yuan, Taiwan, ROC.

Acknowledgments

We thank the National Center for Genome Medicine in Taiwan for the technical support.

Conflicts of Interest

The authors declare no conflict of interest.

References

  1. Hanahan, D.; Weinberg, R.A. Hallmarks of Cancer: The Next Generation. Cell 2011, 144, 646–674. [Google Scholar] [CrossRef] [Green Version]
  2. Frohling, S.; Dohner, H. Chromosomal Abnormalities in Cancer. N. Engl. J. Med. 2008, 359, 722–734. [Google Scholar] [CrossRef] [PubMed]
  3. Warnakulasuriya, S. Global Epidemiology of Oral and Oropharyngeal Cancer. Oral Oncol. 2009, 45, 309–316. [Google Scholar] [CrossRef] [PubMed]
  4. Ko, Y.C.; Huang, Y.L.; Lee, C.H.; Chen, M.J.; Lin, L.M.; Tsai, C.C. Betel Quid Chewing, Cigarette Smoking and Alcohol Consumption Related to Oral Cancer in Taiwan. J. Oral Pathol. Med. 1995, 24, 450–453. [Google Scholar] [CrossRef] [PubMed]
  5. Lin, W.J.; Jiang, R.S.; Wu, S.H.; Chen, F.J.; Liu, S.A. Smoking, Alcohol, and Betel Quid and Oral Cancer: A Prospective Cohort Study. J. Oncol. 2011, 2011, 525976. [Google Scholar] [CrossRef] [PubMed]
  6. Singh, R.; Sandhu, J.; Kaur, B.; Juren, T.; Steward, W.P.; Segerback, D.; Farmer, P.B. Evaluation of the DNA Damaging Potential of Cannabis Cigarette Smoke by the Determination of Acetaldehyde Derived N2-Ethyl-2’-Deoxyguanosine Adducts. Chem. Res. Toxicol. 2009, 22, 1181–1188. [Google Scholar] [CrossRef]
  7. Lai, K.C.; Lee, T.C. Genetic Damage in Cultured Human Keratinocytes Stressed by Long-Term Exposure to Areca Nut Extracts. Mutat. Res. 2006, 599, 66–75. [Google Scholar] [CrossRef]
  8. Silverman, S., Jr. Demographics and Occurrence of Oral and Pharyngeal Cancers. The Outcomes, the Trends, the Challenge. J. Am. Dent. Assoc. 2001, 132, 7S–11S. [Google Scholar] [CrossRef]
  9. Dahabreh, I.J.; Linardou, H.; Kosmidis, P.; Bafaloukos, D.; Murray, S. Egfr Gene Copy Number as a Predictive Biomarker for Patients Receiving Tyrosine Kinase Inhibitor Treatment: A Systematic Review and Meta-Analysis in Non-Small-Cell Lung Cancer. Ann. Oncol. 2011, 22, 545–552. [Google Scholar] [CrossRef] [PubMed]
  10. Kwei, K.A.; Kung, Y.; Salari, K.; Holcomb, I.N.; Pollack, J.R. Genomic Instability in Breast Cancer: Pathogenesis and Clinical Implications. Mol. Oncol. 2010, 4, 255–266. [Google Scholar] [CrossRef] [PubMed]
  11. Mao, X.; Young, B.D.; Lu, Y.J. The Application of Single Nucleotide Polymorphism Microarrays in Cancer Research. Curr. Genom. 2007, 8, 219–228. [Google Scholar]
  12. Ambatipudi, S.; Gerstung, M.; Gowda, R.; Pai, P.; Borges, A.M.; Schaffer, A.A.; Beerenwinkel, N.; Mahimkar, M.B. Genomic Profiling of Advanced-Stage Oral Cancers Reveals Chromosome 11q Alterations as Markers of Poor Clinical Outcome. PLoS ONE 2011, 6, e17250. [Google Scholar] [CrossRef] [Green Version]
  13. Chiang, D.Y.; Villanueva, A.; Hoshida, Y.; Peix, J.; Newell, P.; Minguez, B.; LeBlanc, A.C.; Donovan, D.J.; Thung, S.N.; Sole, M.; et al. Focal Gains of Vegfa and Molecular Classification of Hepatocellular Carcinoma. Cancer Res. 2008, 68, 6779–6788. [Google Scholar] [CrossRef] [PubMed]
  14. Da Silva, S.D.; Ferlito, A.; Takes, R.P.; Brakenhoff, R.H.; Valentin, M.D.; Woolgar, J.A.; Bradford, C.R.; Rodrigo, J.P.; Rinaldo, A.; Hier, M.P.; et al. Advances and Applications of Oral Cancer Basic Research. Oral Oncol. 2011, 47, 783–791. [Google Scholar] [CrossRef] [PubMed]
  15. Leary, R.J.; Lin, J.C.; Cummins, J.; Boca, S.; Wood, L.D.; Parsons, D.W.; Jones, S.; Sjoblom, T.; Park, B.H.; Parsons, R.; et al. Integrated Analysis of Homozygous Deletions, Focal Amplifications, and Sequence Alterations in Breast and Colorectal Cancers. Proc. Natl. Acad. Sci. USA 2008, 105, 16224–16229. [Google Scholar] [CrossRef] [PubMed]
  16. Beroukhim, R.; Getz, G.; Nghiemphu, L.; Barretina, J.; Hsueh, T.; Linhart, D.; Vivanco, I.; Lee, J.C.; Huang, J.H.; Alexander, S.; et al. Assessing the Significance of Chromosomal Aberrations in Cancer: Methodology and Application to Glioma. Proc. Natl. Acad. Sci. USA 2007, 104, 20007–20012. [Google Scholar] [CrossRef] [PubMed]
  17. Peng, C.H.; Liao, C.T.; Peng, S.C.; Chen, Y.J.; Cheng, A.J.; Juang, J.L.; Tsai, C.Y.; Chen, T.C.; Chuang, Y.J.; Tang, C.Y.; et al. A Novel Molecular Signature Identified by Systems Genetics Approach Predicts Prognosis in Oral Squamous Cell Carcinoma. PLoS ONE 2011, 6, e23452. [Google Scholar] [CrossRef]
  18. Sheu, J.J.; Hua, C.H.; Wan, L.; Lin, Y.J.; Lai, M.T.; Tseng, H.C.; Jinawath, N.; Tsai, M.H.; Chang, N.W.; Lin, C.F.; et al. Functional Genomic Analysis Identified Epidermal Growth Factor Receptor Activation as the Most Common Genetic Event in Oral Squamous Cell Carcinoma. Cancer Res. 2009, 69, 2568–2576. [Google Scholar] [CrossRef] [PubMed] [Green Version]
  19. Kalish, L.H.; Kwong, R.A.; Cole, I.E.; Gallagher, R.M.; Sutherland, R.L.; Musgrove, E.A. Deregulated Cyclin D1 Expression Is Associated with Decreased Efficacy of the Selective Epidermal Growth Factor Receptor Tyrosine Kinase Inhibitor Gefitinib in Head and Neck Squamous Cell Carcinoma Cell Lines. Clin. Cancer Res. 2004, 10, 7764–7774. [Google Scholar] [CrossRef]
  20. Namazie, A.; Alavi, S.; Olopade, O.I.; Pauletti, G.; Aghamohammadi, N.; Aghamohammadi, M.; Gornbein, J.A.; Calcaterra, T.C.; Slamon, D.J.; Wang, M.B.; et al. Cyclin D1 Amplification and P16(Mts1/Cdk4i) Deletion Correlate with Poor Prognosis in Head and Neck Tumors. Laryngoscope 2002, 112, 472–481. [Google Scholar] [CrossRef]
  21. Sugahara, K.; Michikawa, Y.; Ishikawa, K.; Shoji, Y.; Iwakawa, M.; Shibahara, T.; Imai, T. Combination Effects of Distinct Cores in 11q13 Amplification Region on Cervical Lymph Node Metastasis of Oral Squamous Cell Carcinoma. Int. J. Oncol. 2011, 39, 761–769. [Google Scholar]
  22. Liu, H.S.; Lu, H.H.; Lui, M.T.; Yu, E.H.; Shen, W.; Chen, Y.P.; Chang, K.W.; Tu, H.F. Detection of Copy Number Amplification of Cyclin D1 (Ccnd1) and Cortactin (Cttn) in Oral Carcinoma and Oral Brushed Samples from Areca Chewers. Oral Oncol. 2009, 45, 1032–1036. [Google Scholar] [CrossRef] [PubMed]
  23. Pavelic, K.; Krizanac, S.; Cacev, T.; Hadzija, M.P.; Radosevic, S.; Crnic, I.; Levanat, S.; Kapitanovic, S. Aberration of Fhit Gene Is Associated with Increased Tumor Proliferation and Decreased Apoptosis-Clinical Evidence in Lung and Head and Neck Carcinomas. Mol. Med. 2001, 7, 442–453. [Google Scholar] [CrossRef]
  24. Nakaya, K.; Yamagata, H.D.; Arita, N.; Nakashiro, K.I.; Nose, M.; Miki, T.; Hamakawa, H. Identification of Homozygous Deletions of Tumor Suppressor Gene Fat in Oral Cancer Using Cgh-Array. Oncogene 2007, 26, 5300–5308. [Google Scholar] [CrossRef] [PubMed]
  25. Seethala, R.R.; Gooding, W.E.; Handler, P.N.; Collins, B.; Zhang, Q.; Siegfried, J.M.; Grandis, J.R. Immunohistochemical Analysis of Phosphotyrosine Signal Transducer and Activator of Transcription 3 and Epidermal Growth Factor Receptor Autocrine Signaling Pathways in Head and Neck Cancers and Metastatic Lymph Nodes. Clin. Cancer Res. 2008, 14, 1303–1309. [Google Scholar] [CrossRef]
  26. Lukas, J.; Aagaard, L.; Strauss, M.; Bartek, J. Oncogenic Aberrations of P16ink4/Cdkn2 and Cyclin D1 Cooperate to Deregulate G1 Control. Cancer Res. 1995, 55, 4818–4823. [Google Scholar] [PubMed]
  27. Chen, Y.J.; Lin, S.C.; Kao, T.; Chang, C.S.; Hong, P.S.; Shieh, T.M.; Chang, K.W. Genome-Wide Profiling of Oral Squamous Cell Carcinoma. J. Pathol. 2004, 204, 326–332. [Google Scholar] [CrossRef]
  28. Nakata, Y.; Uzawa, N.; Takahashi, K.; Sumino, J.; Michikawa, C.; Sato, H.; Sonoda, I.; Ohyama, Y.; Okada, N.; Amagasa, T. Egfr Gene Copy Number Alteration Is a Better Prognostic Indicator Than Protein Overexpression in Oral Tongue Squamous Cell Carcinomas. Eur. J. Cancer 2011, 47, 2364–2372. [Google Scholar] [CrossRef]
  29. Szabo, B.; Nelhubel, G.A.; Karpati, A.; Kenessey, I.; Jori, B.; Szekely, C.; Petak, I.; Lotz, G.; Hegedus, Z.; Hegedus, B.; et al. Clinical Significance of Genetic Alterations and Expression of Epidermal Growth Factor Receptor (Egfr) in Head and Neck Squamous Cell Carcinomas. Oral Oncol. 2011, 47, 487–496. [Google Scholar] [CrossRef] [PubMed]
  30. Sigismund, S.; Avanzato, D.; Lanzetti, L. Emerging Functions of the Egfr in Cancer. Mol. Oncol. 2018, 12, 3–20. [Google Scholar] [CrossRef] [PubMed]
  31. Chung, C.H.; Ely, K.; McGavran, L.; Varella-Garcia, M.; Parker, J.; Parker, N.; Jarrett, C.; Carter, J.; Murphy, B.A.; Netterville, J.; et al. Increased Epidermal Growth Factor Receptor Gene Copy Number Is Associated with Poor Prognosis in Head and Neck Squamous Cell Carcinomas. J. Clin. Oncol. 2006, 24, 4170–4176. [Google Scholar] [CrossRef]
  32. Huang, S.F.; Cheng, S.D.; Chien, H.T.; Liao, C.T.; Chen, I.H.; Wang, H.M.; Chuang, W.Y.; Wang, C.Y.; Hsieh, L.L. Relationship between Epidermal Growth Factor Receptor Gene Copy Number and Protein Expression in Oral Cavity Squamous Cell Carcinoma. Oral Oncol. 2012, 48, 67–72. [Google Scholar] [CrossRef]
  33. Ulanovski, D.; Stern, Y.; Roizman, P.; Shpitzer, T.; Popovtzer, A.; Feinmesser, R. Expression of Egfr and Cerb-B2 as Prognostic Factors in Cancer of the Tongue. Oral Oncol. 2004, 40, 532–537. [Google Scholar] [CrossRef]
  34. Myo, K.; Uzawa, N.; Miyamoto, R.; Sonoda, I.; Yuki, Y.; Amagasa, T. Cyclin D1 Gene Numerical Aberration Is a Predictive Marker for Occult Cervical Lymph Node Metastasis in Tnm Stage I and Ii Squamous Cell Carcinoma of the Oral Cavity. Cancer 2005, 104, 2709–2716. [Google Scholar] [CrossRef]
  35. Saunders, W.S.; Shuster, M.; Huang, X.; Gharaibeh, B.; Enyenihi, A.H.; Petersen, I.; Gollin, S.M. Chromosomal Instability and Cytoskeletal Defects in Oral Cancer Cells. Proc. Natl. Acad. Sci. USA 2000, 97, 303–308. [Google Scholar] [CrossRef]
  36. Wight, A.J.; Ogden, G.R. Possible Mechanisms by Which Alcohol May Influence the Development of Oral Cancer—A Review. Oral Oncol. 1998, 34, 441–447. [Google Scholar] [CrossRef]
  37. Urashima, M.; Hama, T.; Suda, T.; Suzuki, Y.; Ikegami, M.; Sakanashi, C.; Akutsu, T.; Amagaya, S.; Horiuchi, K.; Imai, Y.; et al. Distinct Effects of Alcohol Consumption and Smoking on Genetic Alterations in Head and Neck Carcinoma. PLoS ONE 2013, 8, e80828. [Google Scholar] [CrossRef]
  38. Michikawa, C.; Uzawa, N.; Sato, H.; Ohyama, Y.; Okada, N.; Amagasa, T. Epidermal Growth Factor Receptor Gene Copy Number Aberration at the Primary Tumour Is Significantly Associated with Extracapsular Spread in Oral Cancer. Br. J. Cancer 2011, 104, 850–855. [Google Scholar] [CrossRef]
  39. Huang, S.F.; Cheng, S.D.; Chuang, W.Y.; Chen, I.H.; Liao, C.T.; Wang, H.M.; Hsieh, L.L. Cyclin D1 Overexpression and Poor Clinical Outcomes in Taiwanese Oral Cavity Squamous Cell Carcinoma. World J. Surg. Oncol. 2012, 10, 40. [Google Scholar] [CrossRef]
  40. Lee, H.-H.; Wang, Y.-N.; Hung, M.-C. Non-Canonical Signaling Mode of the Epidermal Growth Factor Receptor Family. Am. J. Cancer Res. 2015, 5, 2944–2958. [Google Scholar]
  41. Takahashi, K.-I.; Uzawa, N.; Myo, K.; Okada, N.; Amagasa, T. Simultaneous Assessment of Cyclin D1 and Epidermal Growth Factor Receptor Gene Copy Number for Prognostic Factor in Oral Squamous Cell Carcinomas. Oral Sci. Int. 2009, 6, 8–20. [Google Scholar] [CrossRef] [Green Version]
  42. Hsieh, L.L.; Chien, H.T.; Chen, I.H.; Liao, C.T.; Wang, H.M.; Jung, S.M.; Wang, P.F.; Chang, J.T.; Chen, M.C.; Cheng, A.J. The Xrcc1 399gln Polymorphism and the Frequency of P53 Mutations in Taiwanese Oral Squamous Cell Carcinomas. Cancer Epidemiol. Biomark. Prev. 2003, 12, 439–443. [Google Scholar]
  43. Mermel, C.H.; Schumacher, S.E.; Hill, B.; Meyerson, M.L.; Beroukhim, R.; Getz, G. Gistic2.0 Facilitates Sensitive and Confident Localization of the Targets of Focal Somatic Copy-Number Alteration in Human Cancers. Genome Biol. 2011, 12, R41. [Google Scholar] [CrossRef] [PubMed]
  44. Bustin, S.A.; Benes, V.; Garson, J.A.; Hellemans, J.; Huggett, J.; Kubista, M.; Mueller, R.; Nolan, T.; Pfaffl, M.W.; Shipley, G.L.; et al. The Miqe Guidelines: Minimum Information for Publication of Quantitative Real-Time Pcr Experiments. Clin. Chem. 2009, 55, 611–622. [Google Scholar] [CrossRef] [PubMed]
Figure 1. Kaplan–Meier curves for disease-free survival (DFS) and overall survival (OS) based on analysis of EGFR gene copies (A,B) and CCND1 gene copies (C,D). Patients with CCND1 gene amplification had significantly worse DFS (p = 0.05) and OS (p = 0.01).
Cancers 11 00760 g001
Figure 2. Additive effects of EGFR and CCND1 copy number changes observed in DFS (A) and OS (B).
Cancers 11 00760 g002
Table 1. Clinicopathological characteristics of the OSCCs patients studied.
Characteristics500 K Array (n = 26)SNP 6.0 Array (n = 46)257 OSCC Cases for Further Analysis
Age (years)
Mean ± SD48.15 ± 11.3950.41 ± 10.7949.95 ± 11.23
Range27–7130–7426–78
Site of primary tumor [N (%)]
Tongue11 (42)26 (57)90 (35)
Bucca15 (58)20 (43)94 (37)
Others--73 (28)
Clinical stage [N (%)]
I/II2 (8)0 (0)65 (25)
III/IV24 (92)46 (100)192 (75)
Primary tumor status [N (%)]
T1/T29 (35)18 (39)121 (47)
T3/T417 (65)28 (61)136 (53)
Lymph node metastasis [N (%)]
No8 (31)10 (22)132 (51)
Yes18 (69)36 (78)125 (49)
Extra-capsular spread [N (%)] a
Yes14 (78)26 (72)76 (61)
No4 (22)10 (28)48 (39)
Tumor differentiation [N (%)]
Well differentiated9 (35)25 (35)98 (38)
Moderately/Poorly differentiated17 (65)47 (65)159 (62)
AQ chewing [N (%)]
Yes15 (58)36 (78)223 (87)
No11 (42)10 (22)34 (13)
Cigarette smoking [N (%)]
Yes11 (42)35 (76)220 (86)
No15 (58)11 (24)37 (14)
Alcohol drinking [N (%)]
Yes14 (54)20 (43)138 (54)
No12 (46)26 (57)119 (46)
AQ: areca quid; a One patient lacked the extra-capsular spread data.
Table 2. Summary of the 12 common CNAs obtained from 500 K and SNP 6.0 platform.
Cytogenetic LociGISTIC Wide Peak Region (Mb a)Size (Mb)Total Frequency (%, n = 72)Cases with CNAs by 500-K Platform (n = 26)Cases with CNAs by SNP 6.0 Platform (n = 46)Candidate Genes
Gains
7p11.2 b54.62–55.861.24511423SEC61G, EGFR
11q13.3 b68.96–70.321.36511423MYEOV1, CCND1, ORAOV1, FADD, CTTN
Losses
2q23.3–q24.2 b124.78–243.20118.241034ING5, LRP1B, DAPL1
3p14.2–p12.125.64–93.7868.14421218FHIT, MLH1, BAP1, SETD2, PBRM1
4q35.2 b187.48–188.240.7633816FAT1
7q33–q34 b97.61–159.1463.911867MIR335, ING3
9p21.3 b21.56–22.000.4426415CDKN2A
11q22.3–q24.3 b72.39–135.0162.62381017ATM, MRE11A, CHEK1, H2AFX
16q23.175.46–79.634.171126WWOX
18q11.2–q22.3 b18.69–78.0859.3940920DCC
21q21.110.19–29.1018.9133717CHODL
21q22.3 b44.30–48.133.8333618NDUFV3
a Mb: mega base; b CNAs also identified when validating the dataset extracted from the Gene Expression Omnibus data repository (accession number GSE25103).
Table 3. Associations between EGFR/CCND1 copy number and clinicopathological parameters.
EGFRCCND1EGFR/CCND1
DiPolyAmpP ValueNAmpP ValueDi/NeuOthersAmp/CNAP Value
Age (years)
<5090 (64)17 (12)34 (24)0.1163 (45)78 (55)0.3251 (36)51 (36)39 (28)0.04
≥5088 (76)10 (9)18 (16)0.04a59 (51)57 (49) 48 (41)51 (44)17 (15)0.06 a
Subsites
Tongue63 (70)9 (10)18 (20)0.9741 (46)49 (54)0.9038 (42)28 (31)24 (27)0.24
Bucca63 (67)10 (11)21 (22)0.82 a46 (49)48 (51) 35 (37)39 (41)20 (21)0.77 a
Others52 (71)8 (11)13 (18) 35 (48)38 (52) 26 (36)35 (48)12 (16)
Clinical stage
I/II52 (80)8 (12)5 (8)0.0138 (58)27 (44)0.0433 (51)24 (37)8 (12)0.03
III/IV126 (66)19 (10)47 (24)<0.01 a84 (44)108 (56) 66 (34)78 (41)48 (25)<0.01a
Primary tumor status
T1/T290 (74)12 (10)19 (16)0.2060 (50)61 (50)0.5251 (42)48 (40)22 (18)0.34
T3/T488 (65)15 (11)33 (24)0.07 a62 (46)74 (54) 48 (35)54 (40)34 (25)0.15 a
LNM c
No103 (78)14 (11)15 (11)<0.0180 (61)52 (39)<0.0167 (51)49 (37)16 (12)<0.01
Yes75 (60)13 (10)37 (30)<0.01 a42 (34)83 (66) 32 (26)53 (42)40 (32)<0.01a
ECSd
Yes45 (59)9 (12)22 (29)0.8232 (42)44 (58)0.0223 (30)31 (41)22 (29)0.33
No29 (60)4 (8)15 (31)0.95 a10 (21)38 (79) 9 (19)21 (44)18 (38)0.15 a
Tumor differentiation
Well77 (79)9 (9)12 (12)0.0363 (64)36 (36)<0.0157 (58)27 (27)15 (15)<0.01
Mod/Poor101 (64)18 (11)40 (25)<0.01 a59 (38)98 (62) 42 (27)74 (47)41 (26)<0.01 a
AQ e chewing
Yes156 (70)21 (9)46 (21)0.34110 (49)113 (51)0.1389 (40)88 (39)46 (21)0.39
No22 (65)6 (18)6 (18)0.88 a12 (35)22 (65) 10 (29)14 (41)10 (29)0.17 a
Cigarette smoking
Yes153 (70)23 (10)44 (20)0.97107 (49)113 (51)0.3686 (39)88 (40)46 (21)0.70
No25 (68)4 (11)8 (22)0.80 a15 (41)22 (59) 13 (35)14 (38)10 (27)0.46 a
Alcohol drinking
Yes96 (70)14 (10)28 (20)0.9857 (41)81 (59)0.0346 (33)61 (44)31 (22)0.16
No82 (69)13 (11)24 (20)0.96a65 (55)54 (45) 53 (45)41 (34)25 (21)0.18a
a By chi-square trend test; b EGFR CNA’s contain EGFR polysomy or EGFR amplification cases; c LNM: lymph node metastasis; d ECS: extra-capsular spread; e AQ: areca quid; Di: disomy; Poly: polysomy; Amp: amplification; Neu: copy number neutral.
Table 4. Univariate Cox proportional hazard analysis of prognostic covariates in 257 patients with OSCC regarding disease-free survival and overall survival.
Disease-Free SurvivalOverall Survival
CharacteristicHR (95% CI)P ValueHR (95% CI)P Value
Age (yrs)
<501 1
> = 500.901 (0.641–1.265)0.551.198 (0.883–1.626)0.25
Tumor differentiation
Well differentiated1 1
Moderately/poorly differentiated1.282 (0.903–1.821)0.171.258 (0.915–1.729)0.16
Primary tumor status
T1/T21 1
T3/T41.104 (0.788–1.546)0.571.487 (1.092–2.025)0.01
Lymph node status
LNM a−, ECS b1 1
LNM+, ECS−1.256 (0.777–2.030)0.351.643 (1.083–2.493)0.02
LNM+, ECS+2.354 (1.621–3.420)<0.012.360 (1.673–3.329)<0.01
EGFR copy number
Disomy1 1
Polysomy1.160 (0.682–1.973)0.581.358 (0.819–2.253)0.24
Amplification1.231 (0.802–1.891)0.341.264 (0.827–1.931)0.28
CCND1 copy number
Neutral1 1
Amplification1.402 (0.998–1.971)0.051.485 (1.091–2.021)0.01
EGFR and CCND1 CN status
EGFR disomy/CCND1 copy neutral1 1
Others1.332 (0.905–1.961)0.151.368 (0.926–2.022)0.12
EGFR CNAs c and CCND1 amplification1.501 (0.960–2.347)0.081.750 (1.126–2.719)0.01
a LNM: lymph node metastasis; b ECS: extra-capsular spread; c Subgroup of EGFR CNAs contains EGFR polysomy or amplification OSCC cases.

