Breast Cancer Prognosis Using a Machine Learning Approach

 ,
,  ,
,  , ,
, , 

Abstract
1. Introduction
2. Results
3. Discussion
4. Patients and Methods
5. Conclusions
Author Contributions
Funding
Conflicts of Interest
References
- Torre, L.A.; Bray, F.; Siegel, R.L.; Ferlay, J.; Lortet-Tieulent, J.; Jemal, A. Global cancer statistics, 2012. CA Cancer J. Clin. 2015, 65, 87–108. [Google Scholar] [CrossRef] [PubMed]
- Kourou, K.; Exarchos, T.P.; Exarchos, K.P.; Karamouzis, M.V.; Fotiadis, D.I. Machine learning applications in cancer prognosis and prediction. Comput. Struct. Biotechnol. J. 2014, 13, 8–17. [Google Scholar] [CrossRef] [PubMed]
- Delen, D.; Walker, G.; Kadam, A. Predicting breast cancer survivability: A comparison of three data mining methods. Artif. Intell. Med. 2005, 34, 113–127. [Google Scholar] [CrossRef] [PubMed]
- Kim, J.; Shin, H. Breast cancer survivability prediction using labeled, unlabeled, and pseudo-labeled patient data. J. Am. Med. Inform. Assoc. 2013, 20, 613–618. [Google Scholar] [CrossRef] [PubMed]
- Park, K.; Ali, A.; Kim, D.; An, Y.; Kim, M.; Shin, H. Robust predictive model for evaluating breast cancer survivability. Eng. Appl. Artif. Intell. 2013, 26, 2194–2205. [Google Scholar] [CrossRef]
- Sun, Y.; Goodison, S.; Li, J.; Liu, L.; Farmerie, W. Improved breast cancer prognosis through the combination of clinical and genetic markers. Bioinformatics 2007, 23, 30–37. [Google Scholar] [CrossRef] [PubMed]
- Burt, J.R.; Torosdagli, N.; Khosravan, N.; RaviPrakash, H.; Mortazi, A.; Tissavirasingham, F.; Hussein, S.; Bagci, U. Deep learning beyond cats and dogs: Recent advances in diagnosing breast cancer with deep neural networks. Br. J. Radiol. 2018, 91, 20170545. [Google Scholar] [CrossRef] [PubMed]
- Yousefi, B.; Ting, H.N.; Mirhassani, S.M.; Hosseini, M. Development of computer-aided detection of breast lesion using gabor-wavelet BASED features in mammographic images. In Proceedings of the 2013 IEEE International Conference on Control System, Computing and Engineering (ICCSCE), Penang, Malaysia, 29 November–1 December 2013; pp. 127–131. [Google Scholar]
- Hueman, M.T.; Wang, H.; Yang, C.Q.; Sheng, L.; Henson, D.E.; Schwartz, A.M.; Chen, D. Creating prognostic systems for cancer patients: A demonstration using breast cancer. Cancer Med. 2018, 7, 3611–3621. [Google Scholar] [CrossRef] [PubMed]
- Amin, M.B.; Edge, S.; Greene, F.; Byrd, D.R.; Brookland, R.K.; Washington, M.K.; Gershenwald, J.E.; Compton, C.C.; Hess, K.R.; Sullivan, D.C.; et al. (Eds.) AJCC Cancer Staging Manual, 8th ed.; Springer: New York, NY, USA, 2017. [Google Scholar]
- O’Sullivan, B.; Brierley, J.; Byrd, D.; Bosman, F.; Kehoe, S.; Kossary, C.; Piñeros, M.; Van Eycken, E.; Weir, H.K.; Gospodarowicz, M. The TNM classification of malignant tumours-towards common understanding and reasonable expectations. Lancet Oncol. 2017, 18, 849–851. [Google Scholar] [CrossRef]
- Gönen, M.; Alpaydın, E. Multiple kernel learning algorithms. J. Mach. Learn. Res. 2011, 12, 2211–2268. [Google Scholar]
- Ferroni, P.; Zanzotto, F.M.; Scarpato, N.; Riondino, S.; Nanni, U.; Roselli, M.; Guadagni, F. Risk assessment for venous thromboembolism in chemotherapy treated ambulatory cancer patients: A precision medicine approach. Med. Dec. Mak. 2017, 37, 234–242. [Google Scholar] [CrossRef] [PubMed]
- Ferroni, P.; Roselli, M.; Zanzotto, F.M.; Guadagni, F. Artificial Intelligence for cancer-associated thrombosis risk assessment. Lancet Haematol. 2018, 5, e391. [Google Scholar] [CrossRef]
- Cristianini, N.; Shawe-Taylor, J. An Introduction to Support Vector Machines and other kernel based learning methods. Ai Magazine 2000, 22, 190. [Google Scholar]
- Matyas, J. Random optimization. Automat. Rem. Control 1965, 26, 246–253. [Google Scholar]
- Fan, J.; Upadhye, S.; Worster, A. Understanding receiver operating characteristic (ROC) curves. Can. J. Emerg. Med. 2006, 8, 19–20. [Google Scholar] [CrossRef]
- Zhu, Q.L.; Xu, W.H.; Tao, M.H. Biomarkers of the Metabolic Syndrome and Breast Cancer Prognosis. Cancers 2010, 2, 721–739. [Google Scholar] [CrossRef] [PubMed]
- Ferroni, P.; Riondino, S.; Laudisi, A.; Portarena, I.; Formica, V.; Alessandroni, J.; D’Alessandro, R.; Orlandi, A.; Costarelli, L.; Cavaliere, F.; et al. Pre-treatment insulin levels as a prognostic factor for breast cancer progression. Oncologist 2016, 21, 1041–1049. [Google Scholar] [CrossRef] [PubMed]
- Yam, C.; Esteva, F.J.; Patel, M.M.; Raghavendra, A.S.; Ueno, N.T.; Moulder, S.L.; Hess, K.R.; Shroff, G.S.; Hodge, S.; Koenig, K.H.; et al. Efficacy and safety of the combination of metformin, everolimus and exemestane in overweight and obese postmenopausal patients with metastatic, hormone receptor-positive, HER2-negative breast cancer: A phase II study. Investig. New Drugs 2019. [Google Scholar] [CrossRef] [PubMed]
- Martin-Castillo, B.; Pernas, S.; Dorca, J.; Álvarez, I.; Martínez, S.; Pérez-Garcia, J.M.; Batista-López, N.; Rodríguez-Sánchez, C.A.; Amillano, K.; Domínguez, S.; et al. A phase 2 trial of neoadjuvant metformin in combination with trastuzumab and chemotherapy in women with early HER2-positive breast cancer: The METTEN study. Oncotarget 2018, 9, 35687–35704. [Google Scholar] [CrossRef] [PubMed]
- Thakur, S.S.; Li, H.; Chan, A.M.Y.; Tudor, R.; Bigras, G.; Morris, D.; Enwere, E.K.; Yang, H. The use of automated Ki67 analysis to predict Oncotype DX risk-of-recurrence categories in early-stage breast cancer. PLoS ONE 2018, 13, e0188983. [Google Scholar] [CrossRef] [PubMed]
- Gensheimer, M.F.; Henry, A.S.; Wood, D.J.; Hastie, T.J.; Aggarwal, S.; Dudley, S.A.; Pradhan, P.; Banerjee, I.; Cho, E.; Ramchandran, K.; et al. Automated survival prediction in metastatic cancer patients using high-dimensional electronic medical record data. J. Natl. Cancer Inst. 2019, 111, djy178. [Google Scholar] [CrossRef] [PubMed]
- Zhao, M.; Tang, Y.; Kim, H.; Hasegawa, K. Machine learning with k-means dimensional reduction for predicting survival outcomes in patients with breast cancer. Cancer Inf. 2018, 17, 1–7. [Google Scholar] [CrossRef] [PubMed]
- Cruz-Ramírez, N.; Acosta-Mesa, H.G.; Carrillo-Calvet, H.; Nava-Fernández, L.A.; Barrientos-Martínez, R.E. Diagnosis of breast cancer using Bayesian networks: A case study. Comput. Biol. Med. 2007, 37, 1553–1564. [Google Scholar] [CrossRef] [PubMed]
- Hammond, M.E.; Hayes, D.F.; Dowsett, M.; Allred, D.C.; Hagerty, K.L.; Badve, S.; Fitzgibbons, P.L.; Francis, G.; Goldstein, N.S.; Hayes, M.; et al. American Society of Clinical Oncology/College of American Pathologists guideline recommendations for immunohistochemical testing of estrogen and progesterone receptors in breast cancer. J. Clin. Oncol. 2010, 28, 2784–2795. [Google Scholar] [CrossRef] [PubMed]
- Wolff, A.C.; Hammond, M.E.; Schwartz, J.N.; Hagerty, K.L.; Allred, D.C.; Cote, R.J.; Dowsett, M.; Fitzgibbons, P.L.; Hanna, W.M.; Langer, A.; et al. American Society of Clinical Oncology/College of American Pathologists. American Society of Clinical Oncology/College of American Pathologists guideline recommendations for human epidermal growth factor receptor 2 testing in breast cancer. Arch. Pathol. Lab. Med. 2007, 131, 18–43. [Google Scholar] [PubMed]
- Goldhirsch, A.; Winer, E.P.; Coates, A.S.; Gelber, R.D.; Piccart-Gebhart, M.; Thürlimann, B.; Senn, H.J.; Panel Members. Personalizing the treatment of women with early breast cancer: Highlights of the St Gallen International Expert Consensus on the Primary Therapy of Early Breast Cancer 2013. Ann. Oncol. 2013, 24, 2206–2223. [Google Scholar] [CrossRef] [PubMed]
- Filice, S.; Castellucci, G.; Croce, D.; Basili, R. KeLP: A Kernel-based Learning Platform for Natural Language Processing. In Proceedings of the ACL-IJCNLP 2015 System Demonstrations, Beijing, China, 26–31 July 2015; pp. 19–24. [Google Scholar]


| ML Predictor | AUC (SE) | 95% CI | Sensitivity (95% CI) | Specificity (95% CI) | +LR | −LR |
|---|---|---|---|---|---|---|
| ML-RO-4 | 0.778 (0.0290) | 0.728–0.822 | 67.1 (55.4–77.5) | 88.4 (83.7–92.2) | 5.80 | 0.37 |
| ML-RO-1 | 0.769 (0.0293) | 0.719–0.814 | 65.8 (54.0–76.3) | 88.0 (83.2–91.8) | 5.49 | 0.39 |
| ML-RO-7 | 0.767 (0.0293) | 0.717–0.813 | 67.1 (55.4–77.5) | 86.4 (81.4–90.4) | 4.92 | 0.38 |
| ML-RO-3 | 0.759 (0.0296) | 0.708–0.805 | 65.8 (54.0–76.3) | 86.0 (80.9–90.1) | 4.68 | 0.40 |
| ML-RO-6 | 0.759 (0.0296) | 0.708–0.805 | 65.8 (54.0–76.3) | 86.0 (80.9–90.1) | 4.68 | 0.40 |
| ML-RO-8 | 0.755 (0.0297) | 0.703–0.801 | 65.8 (54.0–76.3) | 85.1 (80.0–89.4) | 4.42 | 0.40 |
| ML-RO-0 | 0.753 (0.0297) | 0.701–0.799 | 65.8 (54.0–76.3) | 84.7 (79.5–89.0) | 4.30 | 0.40 |
| ML-RO-2 | 0.748 (0.0299) | 0.697–0.795 | 64.5 (52.7–75.1) | 85.1 (80.0–89.4) | 4.33 | 0.42 |
| ML-RO-9 | 0.739 (0.0302) | 0.687–0.786 | 61.8 (50.0–72.8) | 86.0 (80.9–90.1) | 4.40 | 0.44 |
| ML-RO-5 | 0.722 (0.0306) | 0.669–0.770 | 59.2 (47.3–70.4) | 85.1 (80.0–89.4) | 3.98 | 0.48 |
| Method | Group | Sum of the Weights | Normalized Group Weights | ||||||||
|---|---|---|---|---|---|---|---|---|---|---|---|
| 1 | 2 | 3 | 4 | 5 | 1 | 2 | 3 | 4 | 5 | ||
| ML+RO-4 | 0.41890 | 1.04551 | 0.60311 | 0.33909 | 0.58969 | 2.996321 | 0.13980 | 0.34893 | 0.20128 | 0.11316 | 0.19680 |
| ML+RO-0 | 0.77299 | 1.86062 | 1.39445 | 0.90456 | 1.00740 | 5.940053 | 0.13013 | 0.31323 | 0.23475 | 0.15228 | 0.16959 |
| ML+RO-6 | 0.42756 | 0.91373 | 1.16514 | 0.39297 | 0.58755 | 3.486968 | 0.12261 | 0.26204 | 0.33414 | 0.11269 | 0.16849 |
| ML+RO-8 | 0.44878 | 1.28224 | 0.63075 | 0.44350 | 0.53398 | 3.339267 | 0.13439 | 0.38399 | 0.18888 | 0.13281 | 0.15991 |
| ML+RO-1 | 0.46149 | 1.17742 | 0.55782 | 0.34141 | 0.47660 | 3.014770 | 0.15307 | 0.39055 | 0.18503 | 0.11324 | 0.15809 |
| ML+RO-7 | 0.54682 | 1.40025 | 0.79264 | 0.59119 | 0.61023 | 3.941154 | 0.13874 | 0.35529 | 0.20112 | 0.15000 | 0.15483 |
| ML+RO-3 | 0.64274 | 1.13249 | 0.36078 | 0.39482 | 0.45241 | 2.983255 | 0.21545 | 0.37961 | 0.12093 | 0.13234 | 0.15165 |
| Performance Parameter | ML-RO-0 | ML-RO-4 | DSS Model a |
|---|---|---|---|
| F-measureb | 0.696 | 0.677 | 0.698 |
| Accuracy | 0.853 | 0.838 | 0.860 |
| Area under the curve (AUC) | 0.822 | 0.813 | 0.815 |
| (+)LR (95% CI) | 9.1 (4.3–20.8) | 8.5 (3.9–19.6) | 8.6 (4.2–18.0) |
| (−)LR (95% CI) | 0.4 (0.3–0.6) | 0.4 (0.3–0.6) | 0.4 (0.2–0.5) |
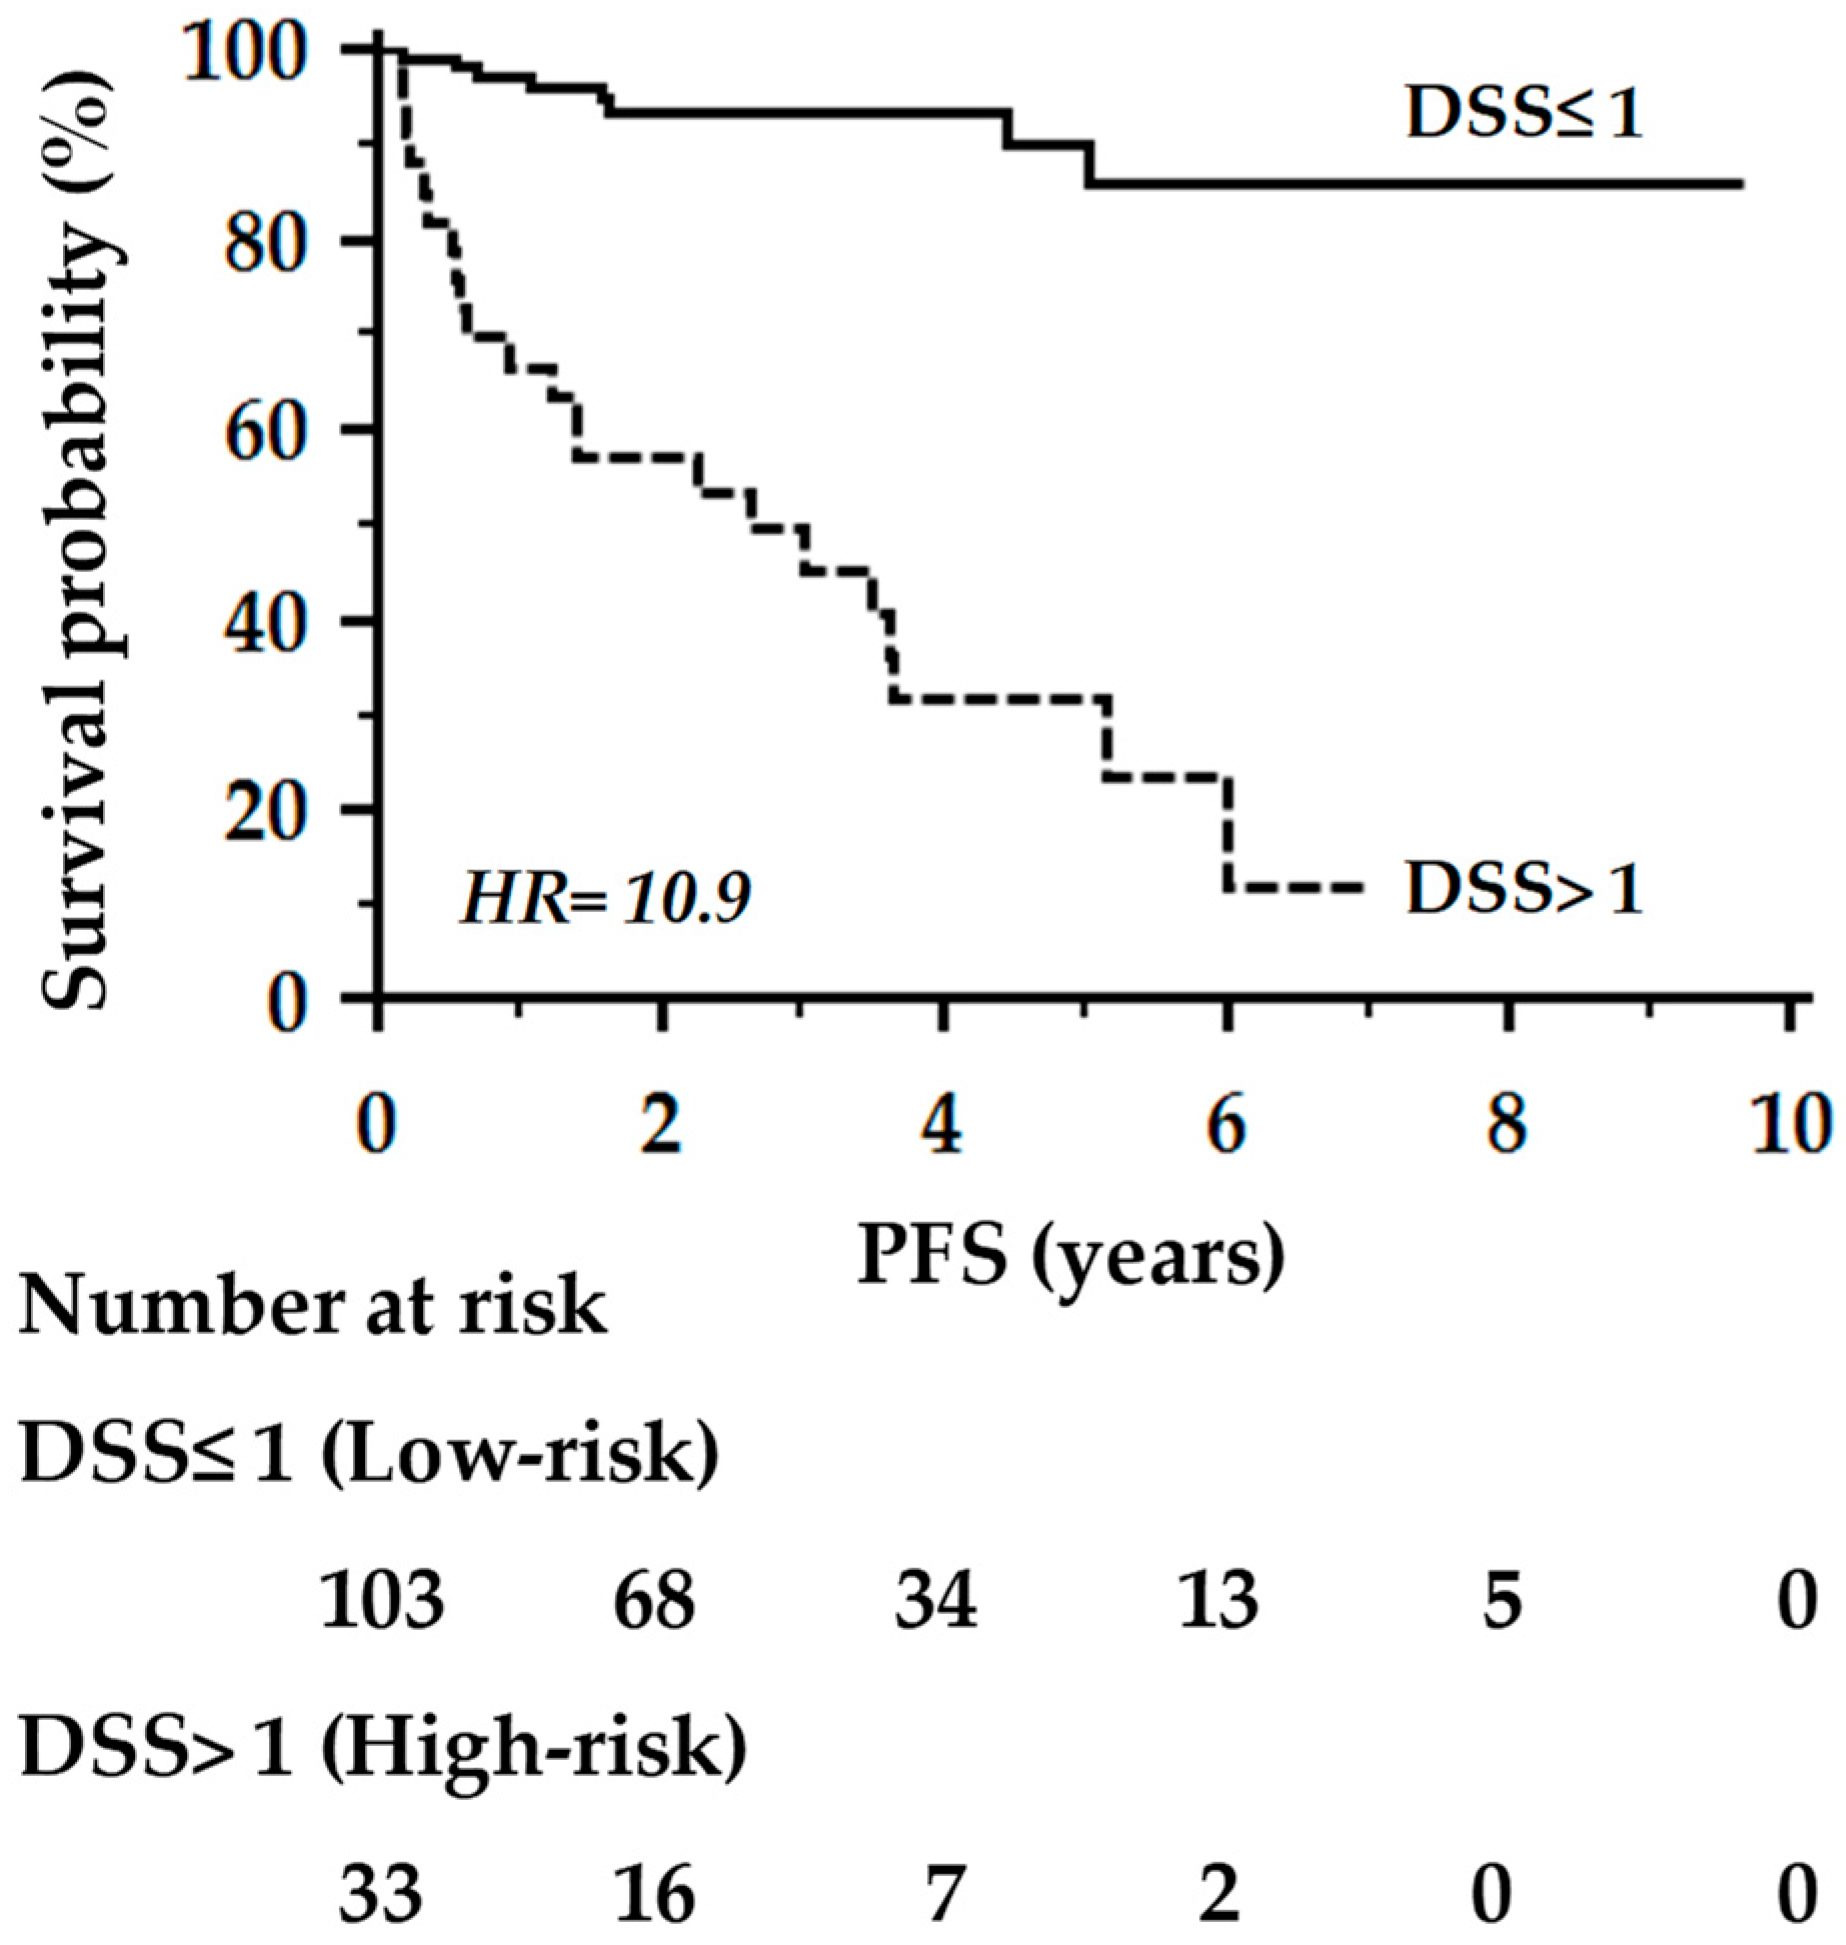
| HR (95% CI) | 10.7 (4.6–24.8) | 10.3 (4.5–23.7) | 10.9 (4.5–26.6) |
| Clinical-Pathological Characteristics | Training Set (n = 318) | Testing Set (n = 136) |
|---|---|---|
| Age (years), Mean ± SD | 56 ± 13 | 57 ± 12 |
| Menopausal status, N (%) | ||
| Pre | 141 (44) | 51 (38) |
| Post | 177 (56) | 85 (63) |
| Body Mass Index, Mean ± SD | 25.2 ± 4.5 | 25.7 ± 5.2 |
| Histological diagnosis, N (%) | ||
| Ductal | 263 (83) | 121 (89) |
| Lobular | 37 (12) | 9 (7) |
| Others | 18 (5) | 6 (4) |
| Molecular Type a, N (%) | ||
| Triple-negative | 39 (12) | 17 (12) |
| Luminal-like A | 97 (31) | 37 (27) |
| Luminal-like B | 172 (54) | 77 (57) |
| HER2 pos | 10 (3) | 5 (4) |
| Grading, N (%) b | ||
| 1 | 20 (7) | 15 (13) |
| 2 | 108 (39) | 45 (38) |
| 3 | 151 (54) | 58 (49) |
| Tumor, N (%) b | ||
| T1 | 141 (50) | 59 (50) |
| T2 | 91 (33) | 42 (36) |
| T3 | 28 (10) | 5 (4) |
| T4 | 19 (7) | 12 (10) |
| Node, N (%) b | ||
| N0 | 134 (48) | 54 (46) |
| N+ | 145 (52) | 64 (54) |
| Prognostic stage, N (%) | ||
| I | 177 (56) | 70 (50) |
| II | 53 (17) | 20 (15) |
| III | 45 (14) | 26 (19) |
| IV | 4 (1) | 2 (1) |
| Metastatic | 39 (12) | 18 (13) |
| Receptor status, N (%) c | ||
| ER+/PR+ | 235 (74) | 94 (69) |
| ER+/PR− | 29 (9) | 19 (14) |
| ER-/PR+ | 5 (2) | 1 (1) |
| ER-/PR− | 49 (15) | 22 (16) |
| HER2/neu+, N (%) c | 66 (21) | 34 (25) |
| Ki67 proliferation index ≥20%, N (%) c | 204 (67) | 93 (71) |
| Type 2 Diabetes, N (%) | 39 (12) | 11 (8%) |
| Glucose metabolic asset d | ||
| Fasting blood glucose (mg/dl), Mean ± SD | 105 ± 31 | 102 ± 32 |
| Fasting insulin (µIU/ml), Median (IQR) | 11.9 (6.4–27.0) | 10.6 (5.6–19.6) |
| HbA1c (%), Mean ± SD | 5.8 ± 0.8 | 5.8 ± 0.7 |
| HOMA Index, Mean ± SD | 3.0 (1.4–8.3) | 2.9 (1.2–6.3) |
| Follow-up (years) | ||
| Mean (range) | 3.4 (0.29–10.5) | 3.5 (0.26–9.65) |
| Patient-Related | Tumor-Related | Biochemical |
|---|---|---|
| Group 1: Age Menopausal status Body Mass Index | Group 2: Molecular type Histological diagnosis Grading TNM stage | Group 4: Total Bilirubin Creatinine |
| Group 5: Fasting glycemia Fasting insulinemia Glycosylated hemoglobin HOMA index (insulin resistance) Type 2 diabetes | ||
| Group 3: Estrogen receptors Progesterone receptors HER2/NEU Ki67 proliferation index |
© 2019 by the authors. Licensee MDPI, Basel, Switzerland. This article is an open access article distributed under the terms and conditions of the Creative Commons Attribution (CC BY) license (http://creativecommons.org/licenses/by/4.0/).
Share and Cite
Ferroni, P.; Zanzotto, F.M.; Riondino, S.; Scarpato, N.; Guadagni, F.; Roselli, M. Breast Cancer Prognosis Using a Machine Learning Approach. Cancers 2019, 11, 328. https://doi.org/10.3390/cancers11030328
Ferroni P, Zanzotto FM, Riondino S, Scarpato N, Guadagni F, Roselli M. Breast Cancer Prognosis Using a Machine Learning Approach. Cancers. 2019; 11(3):328. https://doi.org/10.3390/cancers11030328
Chicago/Turabian StyleFerroni, Patrizia, Fabio M. Zanzotto, Silvia Riondino, Noemi Scarpato, Fiorella Guadagni, and Mario Roselli. 2019. "Breast Cancer Prognosis Using a Machine Learning Approach" Cancers 11, no. 3: 328. https://doi.org/10.3390/cancers11030328
APA StyleFerroni, P., Zanzotto, F. M., Riondino, S., Scarpato, N., Guadagni, F., & Roselli, M. (2019). Breast Cancer Prognosis Using a Machine Learning Approach. Cancers, 11(3), 328. https://doi.org/10.3390/cancers11030328