Article

Higher CCL22+ Cell Infiltration is Associated with Poor Prognosis in Cervical Cancer Patients

1
Department of Obstetrics and Gynecology, University Hospital, LMU Munich, 80377 Munich, Germany
2
Department of Pathology, LMU Munich, 80377 Munich, Germany
*
Author to whom correspondence should be addressed.
Cancers 2019, 11(12), 2004; https://doi.org/10.3390/cancers11122004
Submission received: 20 November 2019 / Revised: 9 December 2019 / Accepted: 11 December 2019 / Published: 12 December 2019
(This article belongs to the Special Issue Chemokines and Chemokine Receptors: New Targets for Cancer Therapy)

Abstract

:
The chemokine CCL22 recruits regulatory T (T-reg) cells into tumor tissues and is expressed in many human tumors. However, the prognostic role of CCL22 in cervical cancer (CC) has not been determined. This study retrospectively analyzed the clinical significance of the expression of CCL22 and FOXP3 in 230 cervical cancer patients. Immunohistochemical staining analyses of CCL22 and FOXP3 were performed with a tissue microarray. Double immunofluorescence staining, cell coculture, and ELISA were used to determine CCL22 expressing cells and mechanisms. The higher number of infiltrating CCL22+ cells (CCL22high) group was associated with lymph node metastasis (p = 0.004), Fédération Internationale de Gynécologie et d’Obstétrique (FIGO) stages (p = 0.010), therapeutic strategies (p = 0.007), and survival status (p = 0.002). The number of infiltrating CCL22+ cells was positively correlated with that of infiltrating FOXP3+ cells (r = 0.210, p = 0.001). The CCL22high group had a lower overall survival rate (OS), compared to the CCL22low group (p = 0.001). However, no significant differences in progression free survival (PFS) were noted between the two groups. CCL22high was an independent predictor of shorter OS (HR, 4.985; p = 0.0001). The OS of the combination group CCL22highFOXP3high was significantly lower than that of the combination group CCL22lowFOXP3low regardless of the FIGO stage and disease subtype. CCL22highFOXP3high was an independent indictor of shorter OS (HR, 5.284; p = 0.009). The PFS of group CCL22highFOXP3high was significantly lower than that of group CCL22lowFOXP3low in cervical adenocarcinoma, but CCL22highFOXP3high was not an independent indicator (HR, 3.018; p = 0.068). CCL22 was primarily expressed in M2-like macrophages in CC and induced by cervical cancer cells. The findings of our study indicate that cervical cancer patients with elevated CCL22+ infiltrating cells require more aggressive treatment. Moreover, the results provide a basis for subsequent, comprehensive studies to advance the design of immunotherapy for cervical cancer.

1. Introduction

Cervical cancer is the second most prevalent tumor in developing countries and the fourth most common cause of cancer-related deaths among women. Over half a million new cervical cancer cases, and an estimated 265,700 deaths are reported each year worldwide [1,2]. Several factors including economic conditions, genetic factors, endocrine [3], and immunity play significant role in the progression of cervical cancer. High-risk human papilloma virus is the primary cause of cervical cancer (CC) [4]. Immunosuppression states like infection with HIV [5] or taking immunosuppressive drugs [6] increases susceptibility to HPV infection and which subsequently causes cervical cancer. The current cervical cancer treatments include surgery, chemotherapy, and radiotherapy, but these are not effective for the management of advanced local cervical cancer, metastatic and recurrent tumors [7]. Recently, immunotherapy, particularly the immune checkpoint inhibitors, has achieved a great breakthrough. For example, the use of Pembrolizumab, a PD-1 inhibitor, in the later-staged and recurrent CC was authorized [8]. However, not all CC patients are sensitive to Pembrolizumab. Additional immune-related molecules should, therefore, be identified to explain the pathogenesis and improve the treatment of cervical cancer.
The role and mechanism of immune cells in the development of cervical cancer has not been adequately studied. Previous studies showed that the number of FOXP3+ regulatory T-cells that could suppress the innate and adaptive immunity systems [9,10] was higher in cervical cancer compared to other types of tumors [11] and suppressed immune responses [12]. On the one hand, it was reported that cervical cancer cells could secrete indoleamine 2,3-dioxygenase (IDO) to recruit FOXP3+ regulatory T-cells [12]. On the other hand, cervical cancer cells can secrete a series of molecules such as PEG2, IL-6, CCL2, and IL-10 that differentiate and activate M2-like macrophages [13,14,15,16]. M2-like macrophages have been widely accepted to play a role in the poor prognostic effect in CC [17]. M2-like macrophages promoted the CC cell proliferation by the GM-CSF/HB-EGF paracrine loop [18]. The number of M2-like macrophages was related to invasion patterns [19] and lymph node metastasis [20]. M2-like macrophages participate in immune suppression in cancer [21], yet, its underlying mechanism in CC has not been sufficiently elucidated. Previous studies on cervical cancer indicated that M2-like macrophages could decrease the presence of HPV16 E7 specific CD8+ T cells by diminishing HLA-DR expression and increasing the expression of either IL-10 or CSF1R [22,23,24]. Activated macrophages may inhibit the number of CD4+ T cells by producing neopterin [25]. M2-like macrophages could decrease the percentage of HPV specific regulatory T cells by blocking IL-10 signaling [26]. However, the association of CCL22 from cervical cancer cells or macrophages and regulatory T cells is still elusive.
The C-C motif chemokine ligand 22 (CCL22) gene is a secreted protein that exerts chemotactic activity for monocytes, dendritic cells, natural killer cells, and for chronically activated T lymphocytes [27,28,29,30]. Accumulating studies indicate that CCL22 plays a tumor-promoting role in human cancer. In ovarian cancer, for instance, CCL22 was found to induce regulatory T (T-reg) cells into tumor mass and inhibit T cell immunity [31]. High expression of CCL22 in M2 macrophages confers resistance to 5-fluorouracil in colorectal cancer [32]. A previous study showed that the CCL22 mRNA expression level was higher in CC tissue than in a normal cervix [33]. However, the function of CCL22 in cervical cancer remains unknown.
The present study determined the functional role of CCL22 in infiltrating macrophages in cervical cancer. The expression level of CCL22 and the FOXP3+ regulatory T-cell marker was measured using a tissue microarray (TMA) with immunohistochemical staining. We further evaluated the correlation between clinical characteristics and CCL22 and FOXP3 expression. The findings of our study indicated that the number of CCL22+ cells was positively correlated with that of FOXP3+ cells (r = 0.210, p = 0.001). Moreover, group CCL22high had a significantly lower overall survival rate (OS), compared to the CCL22low group (p = 0.001). There was, however, no significant difference in progression free survival (PFS). The OS of the combination group CCL22highFOXP3high was significantly lower than that of group CCL22lowFOXP3low regardless of the FIGO stage and disease subtype (p < 0.05). The PFS of group CCL22highFOXP3high was significantly lower than that of group CCL22lowFOXP3low in cervical adenocarcinoma (p < 0.05). A double immunofluorescence staining indicated that M2-like macrophages primarily secreted CCL22. These results suggest that CCL22 secreted by M2 macrophages could recruit T-reg cells in cervical cancer and reduce the patient survival rate.

2. Results

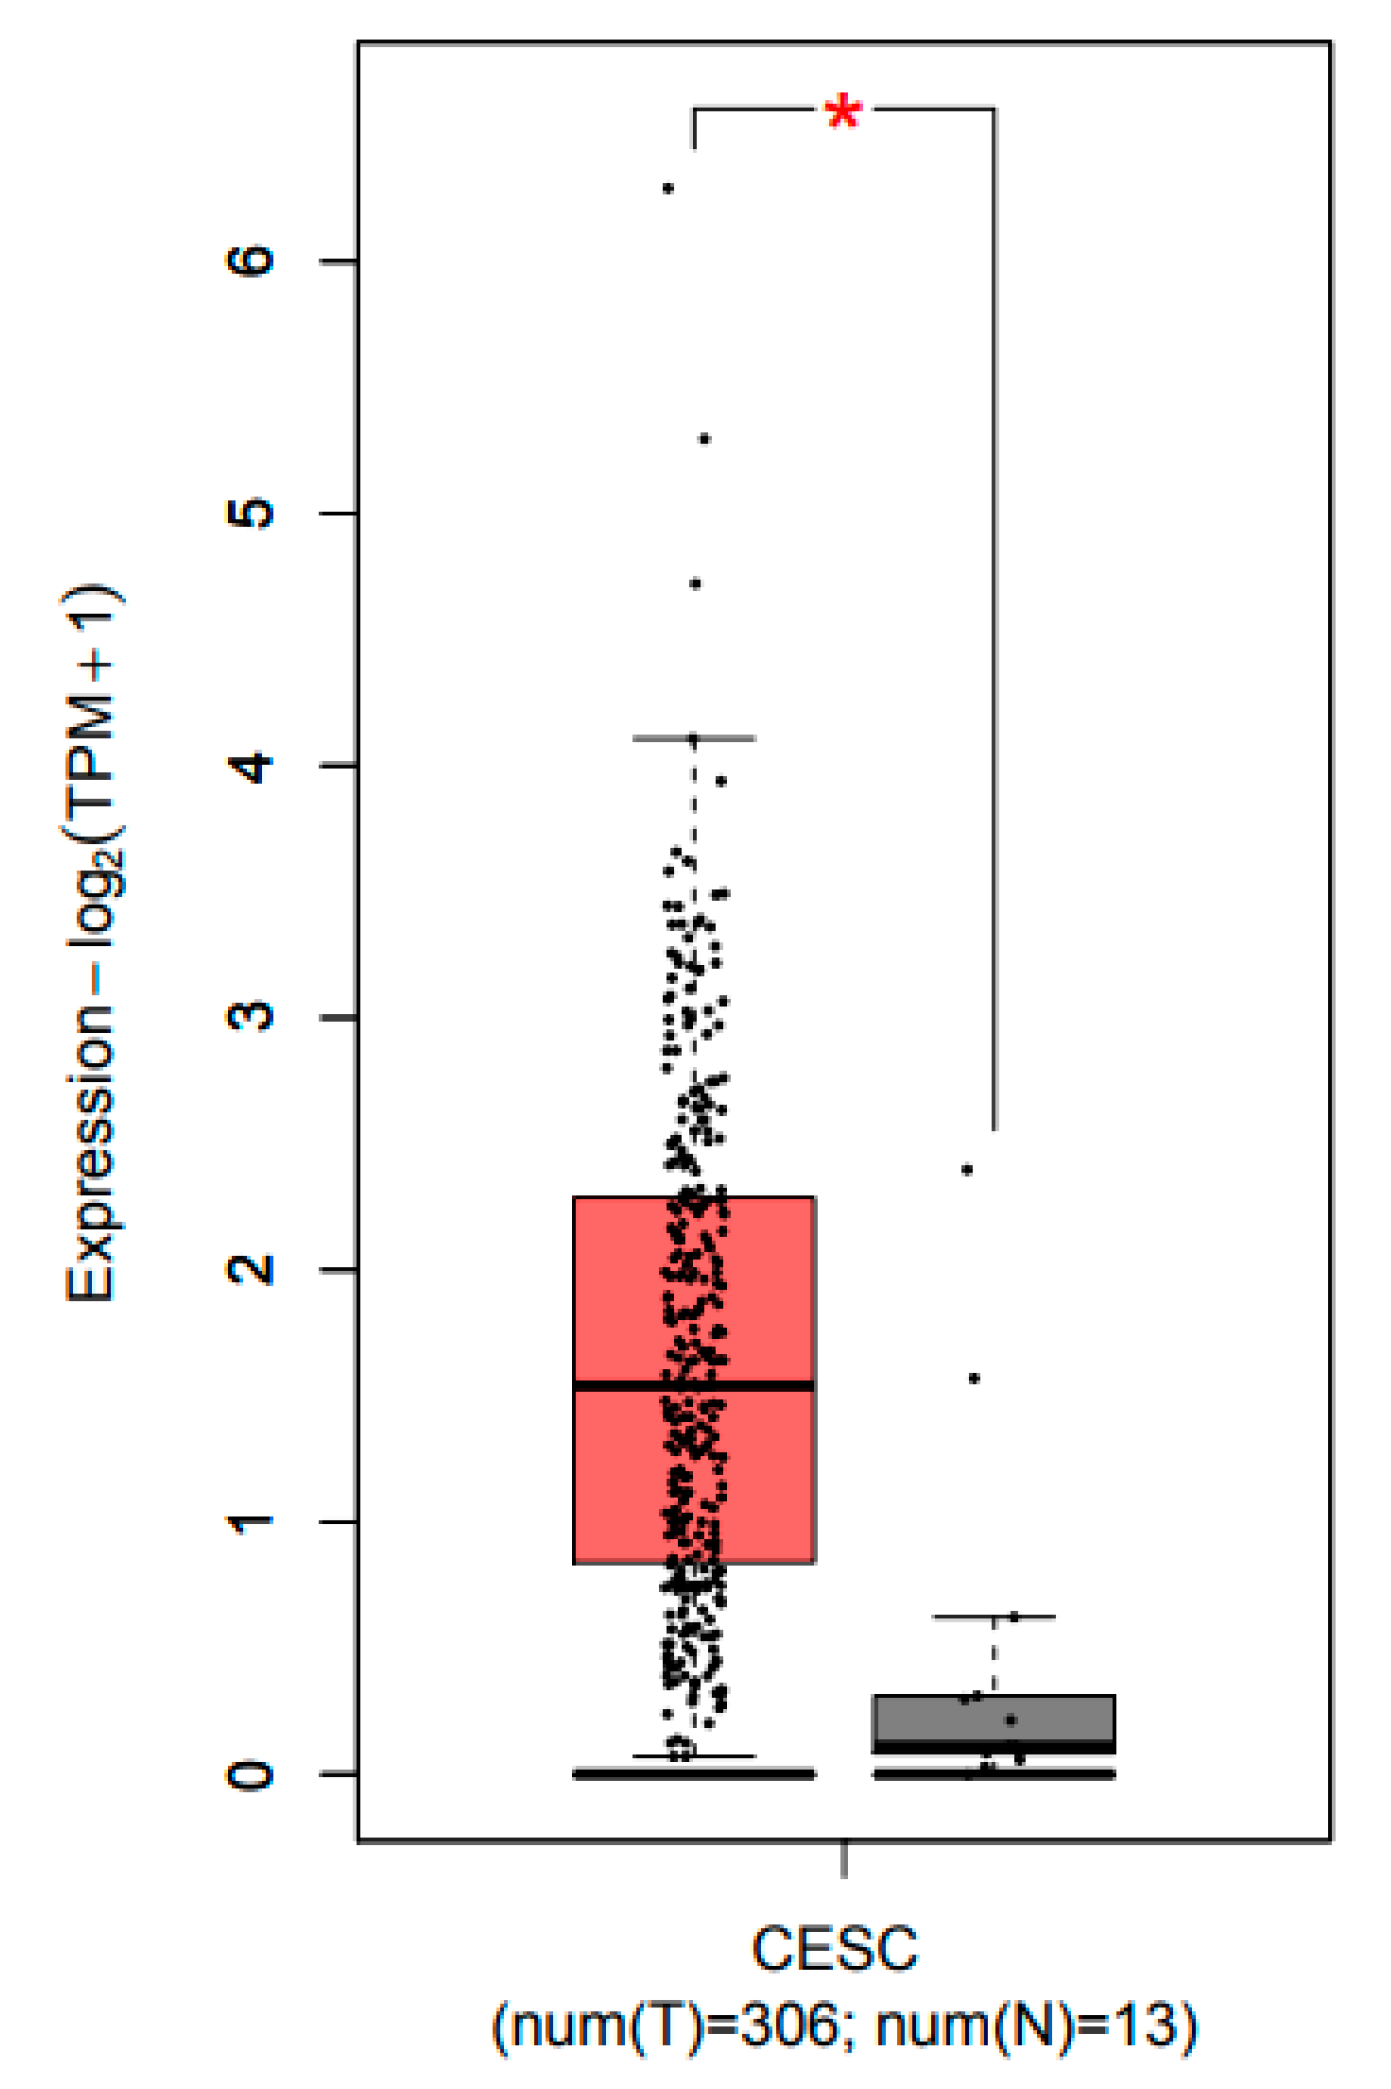
2.1. CCL22 Was Overexpressed in Cervical Squamous Cell Carcinoma and Endocervical Adenocarcinoma (CESC)

The GEPIA database was used to identify the expression profile of CCL22 (http://gepia.cancer-pku.cn/) [34]. Transcript expression analysis for CCL22 was carried out in a total of 319 samples including 13 normal and 306 CESC tissues across TCGA normal and GTEx data. Next, using the ANOVA method, 1 as the Log2FC cutoff value, 0.01 as the cutoff value of the significance level, the expression difference of CCL22 in CESC tissue was obtained (Figure 1). The CCL22 mRNA level in CESC tissue was much higher than that in normal cervical tissues.
TIMER database was also used to identify the correlation between T-regs, TAM2, and CCL22 (https://cistrome.shinyapps.io/timer/) [35]. MRC1 (also named CD206) and FOXP3 represent M2 macrophage and regulatory T-cells, respectively [12,36]. Correlation analysis for MRC1, FOXP3, and CCL22 was carried out in the CESC dataset from TCGA. The results showed that CCL22 was positively correlated with MRC1 and FOXP3 (r = 0.329, p = 4.45 × 10⁻⁹; r = 0.385, p = 4.31 × 10⁻¹², respectively). MRC1 was positively correlated with FOXP3 (r = 0.43, p = 0.001). The UALCAN database was used to analyze the survival rate in groups with differently expressed CCL22 in the CESC dataset from TCGA (http://ualcan.path.uab.edu/index.html) [37]. The result showed that although there was no significant difference, and the OS of the high CCL22 expression group was lower than that of the low CCL22 expression group in the long run (p = 0.069) (Figure S1).

2.2. The Association between the IRS of CCL22 in CC Cells, Infiltrating CCL22+ Cell and FOXP3+ Cell Counts with Clinical Characteristics

Tissue microarray by immunohistochemistry was performed to test the number of CCL22+ and FOXP3+ cells in a retrospective cohort of 230 cervical cancer cases, including 187 cases of squamous carcinoma and 43 cases of adenocarcinoma. As shown in Figure 2 and Figure 3, the immunoreactivity of CCL22 and FOXP3 protein were detected. The IRS of CCL22 expressed in cervical cancer cells was evaluated and the number of CCL22+ and FOXP3+ cells was counted. We found that CCL22 expressed in CC cells was significantly associated with the disease subtypes (p < 0.05). The higher number of CCL22+ cells was significantly associated with lymph node metastasis (p < 0.05), FIGO stages (p < 0.05), therapeutic strategies (p < 0.05), and survival status (p < 0.05). The group with lower number of CCL22 (+) cells had 42.7% (88/206) lymph node metastasis, 55.8% (115/206) FIGO stage I to II, 38.3% (79/206) cases treated by surgery, and 11.2% (23/206) in death. The group with the higher number (n > 11) of CCL22 (+) cells had 12.5% (3/24) of cancer with lymph node metastasis, 83.3% (20/24) FIGO stage I to II, 70.8% (17/24) cases treated by surgery, and 37.5% (9/24) of cancer with death. The higher number of FOXP3+ was significantly associated with grading (p < 0.05). The number of FOXP3+ cells was significantly associated with disease subtypes (p < 0.05). The higher number (n > 29) of FOXP3+ cells was noted in 94.1% (32/34) with squamous carcinoma, while a lower number of FOXP3+ cells was observed in 79.1% (155/196) with squamous carcinoma (Table 1).

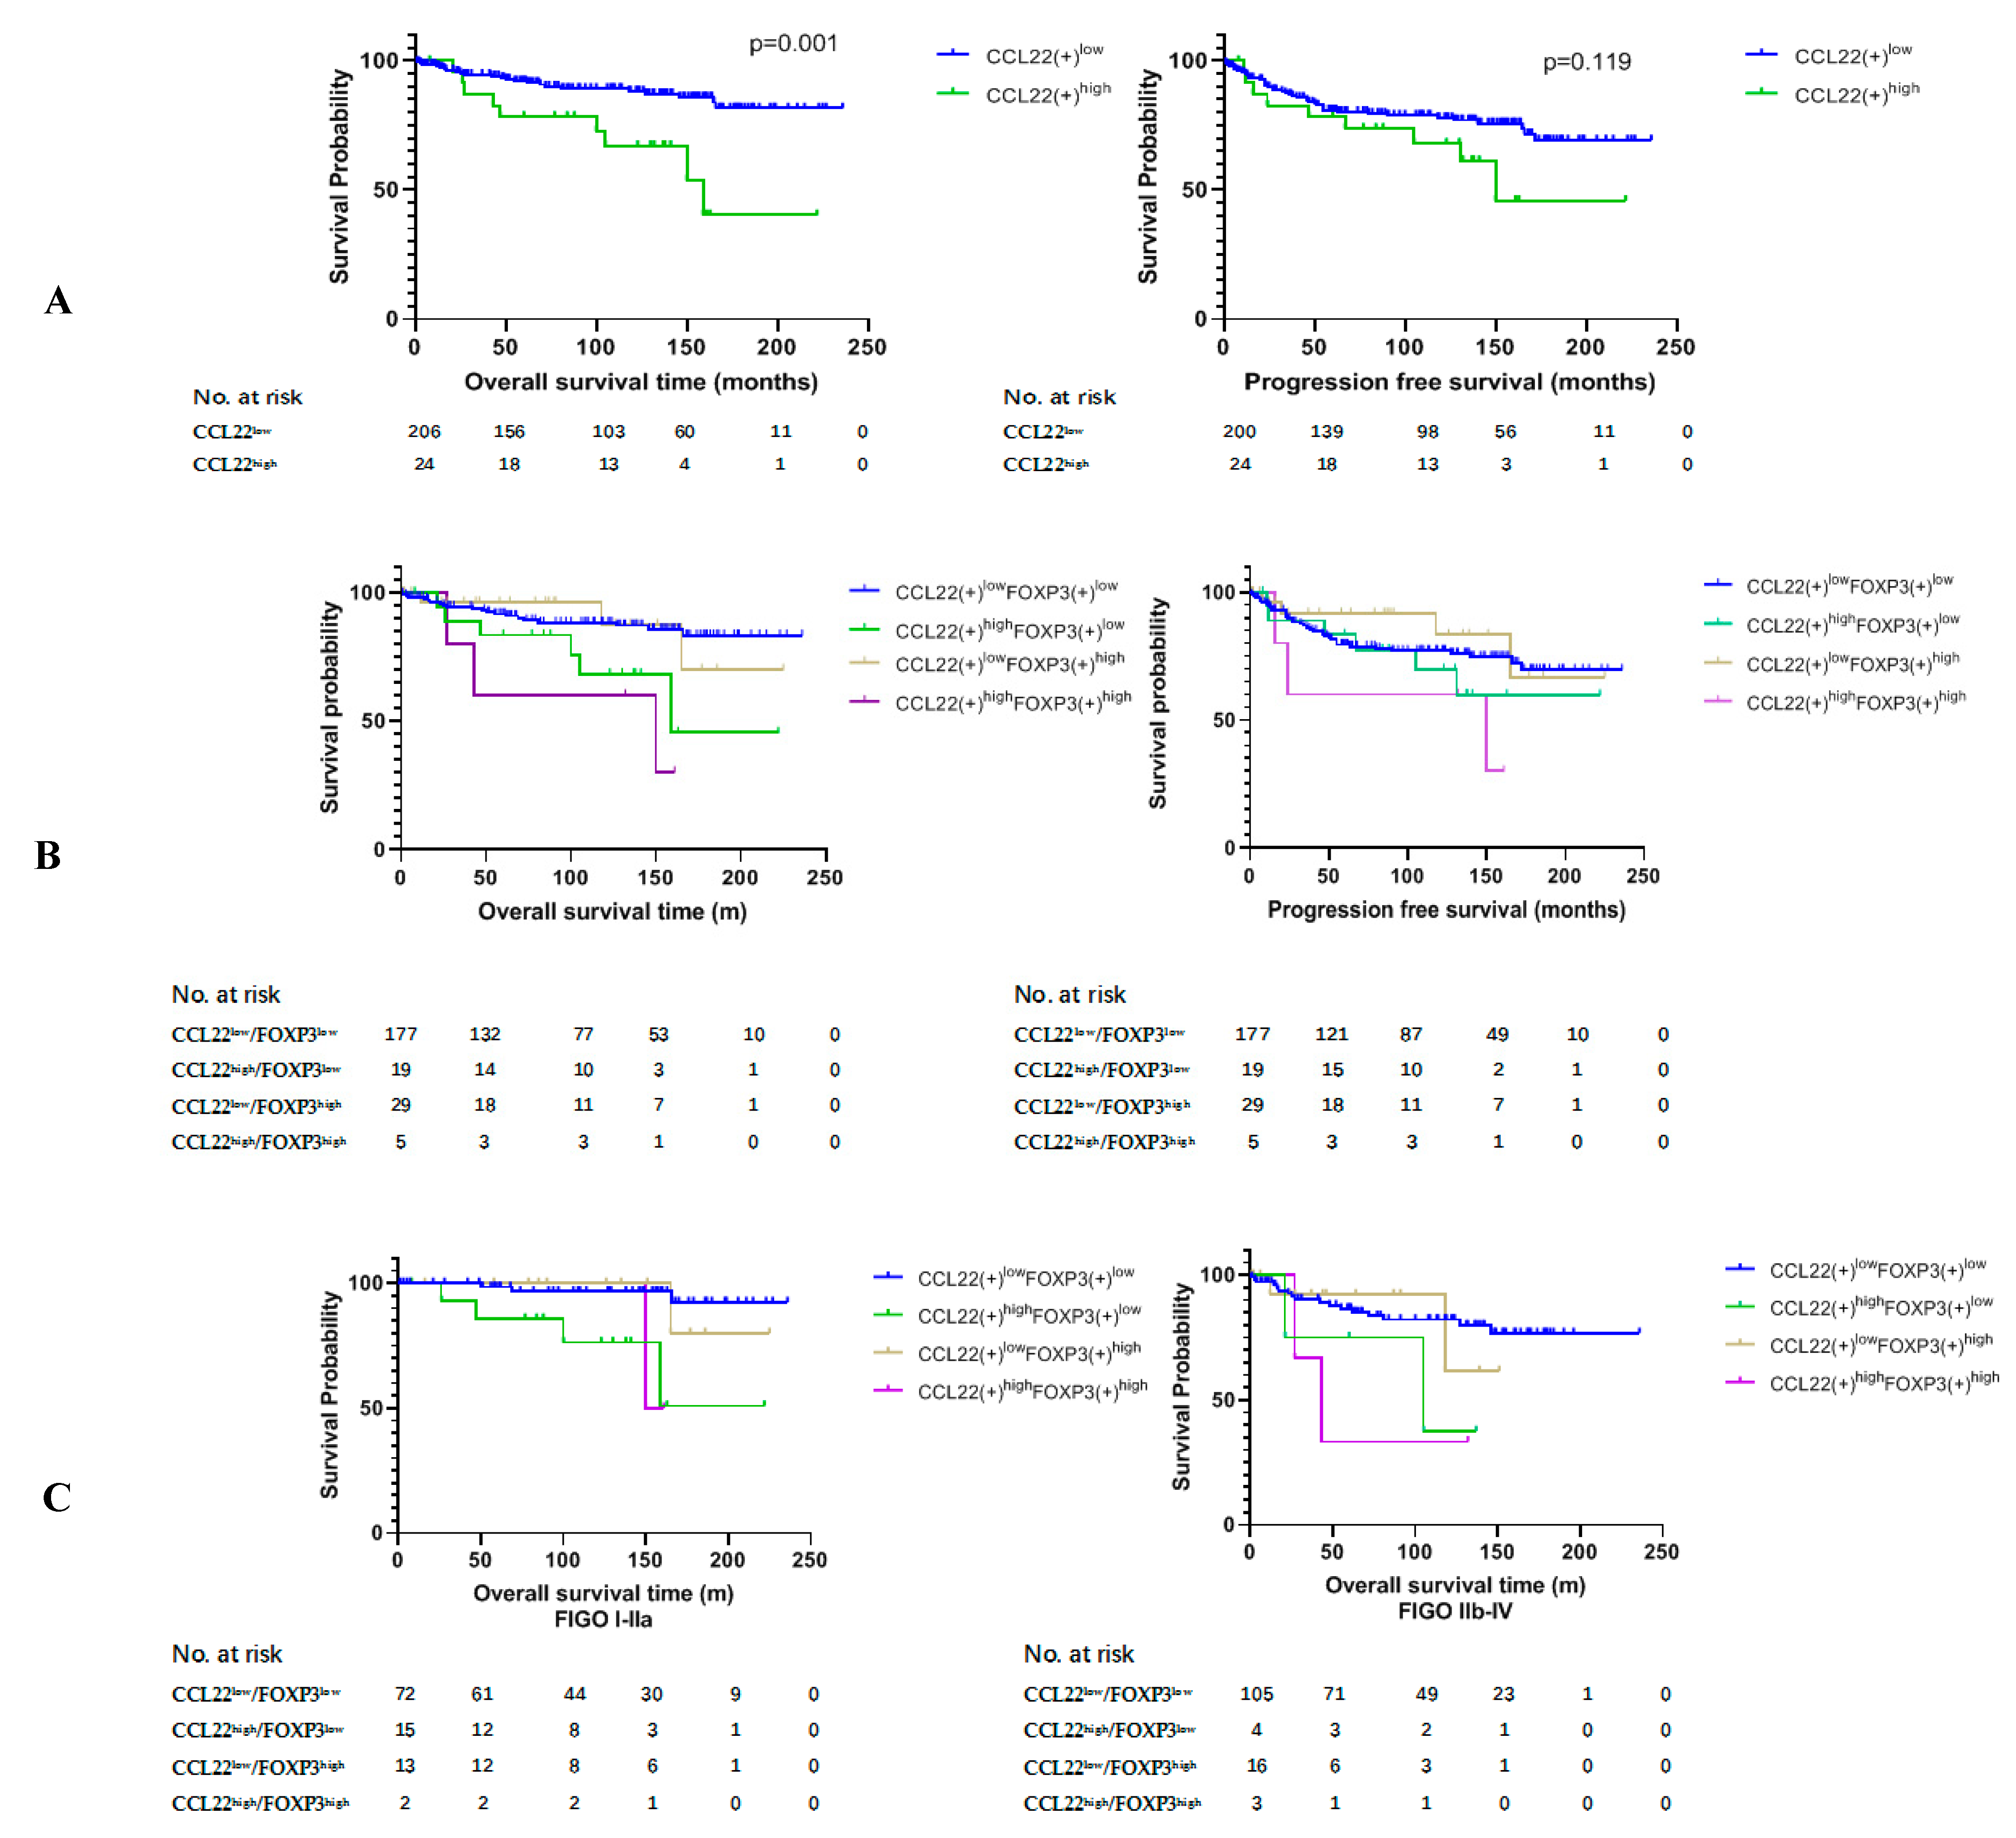
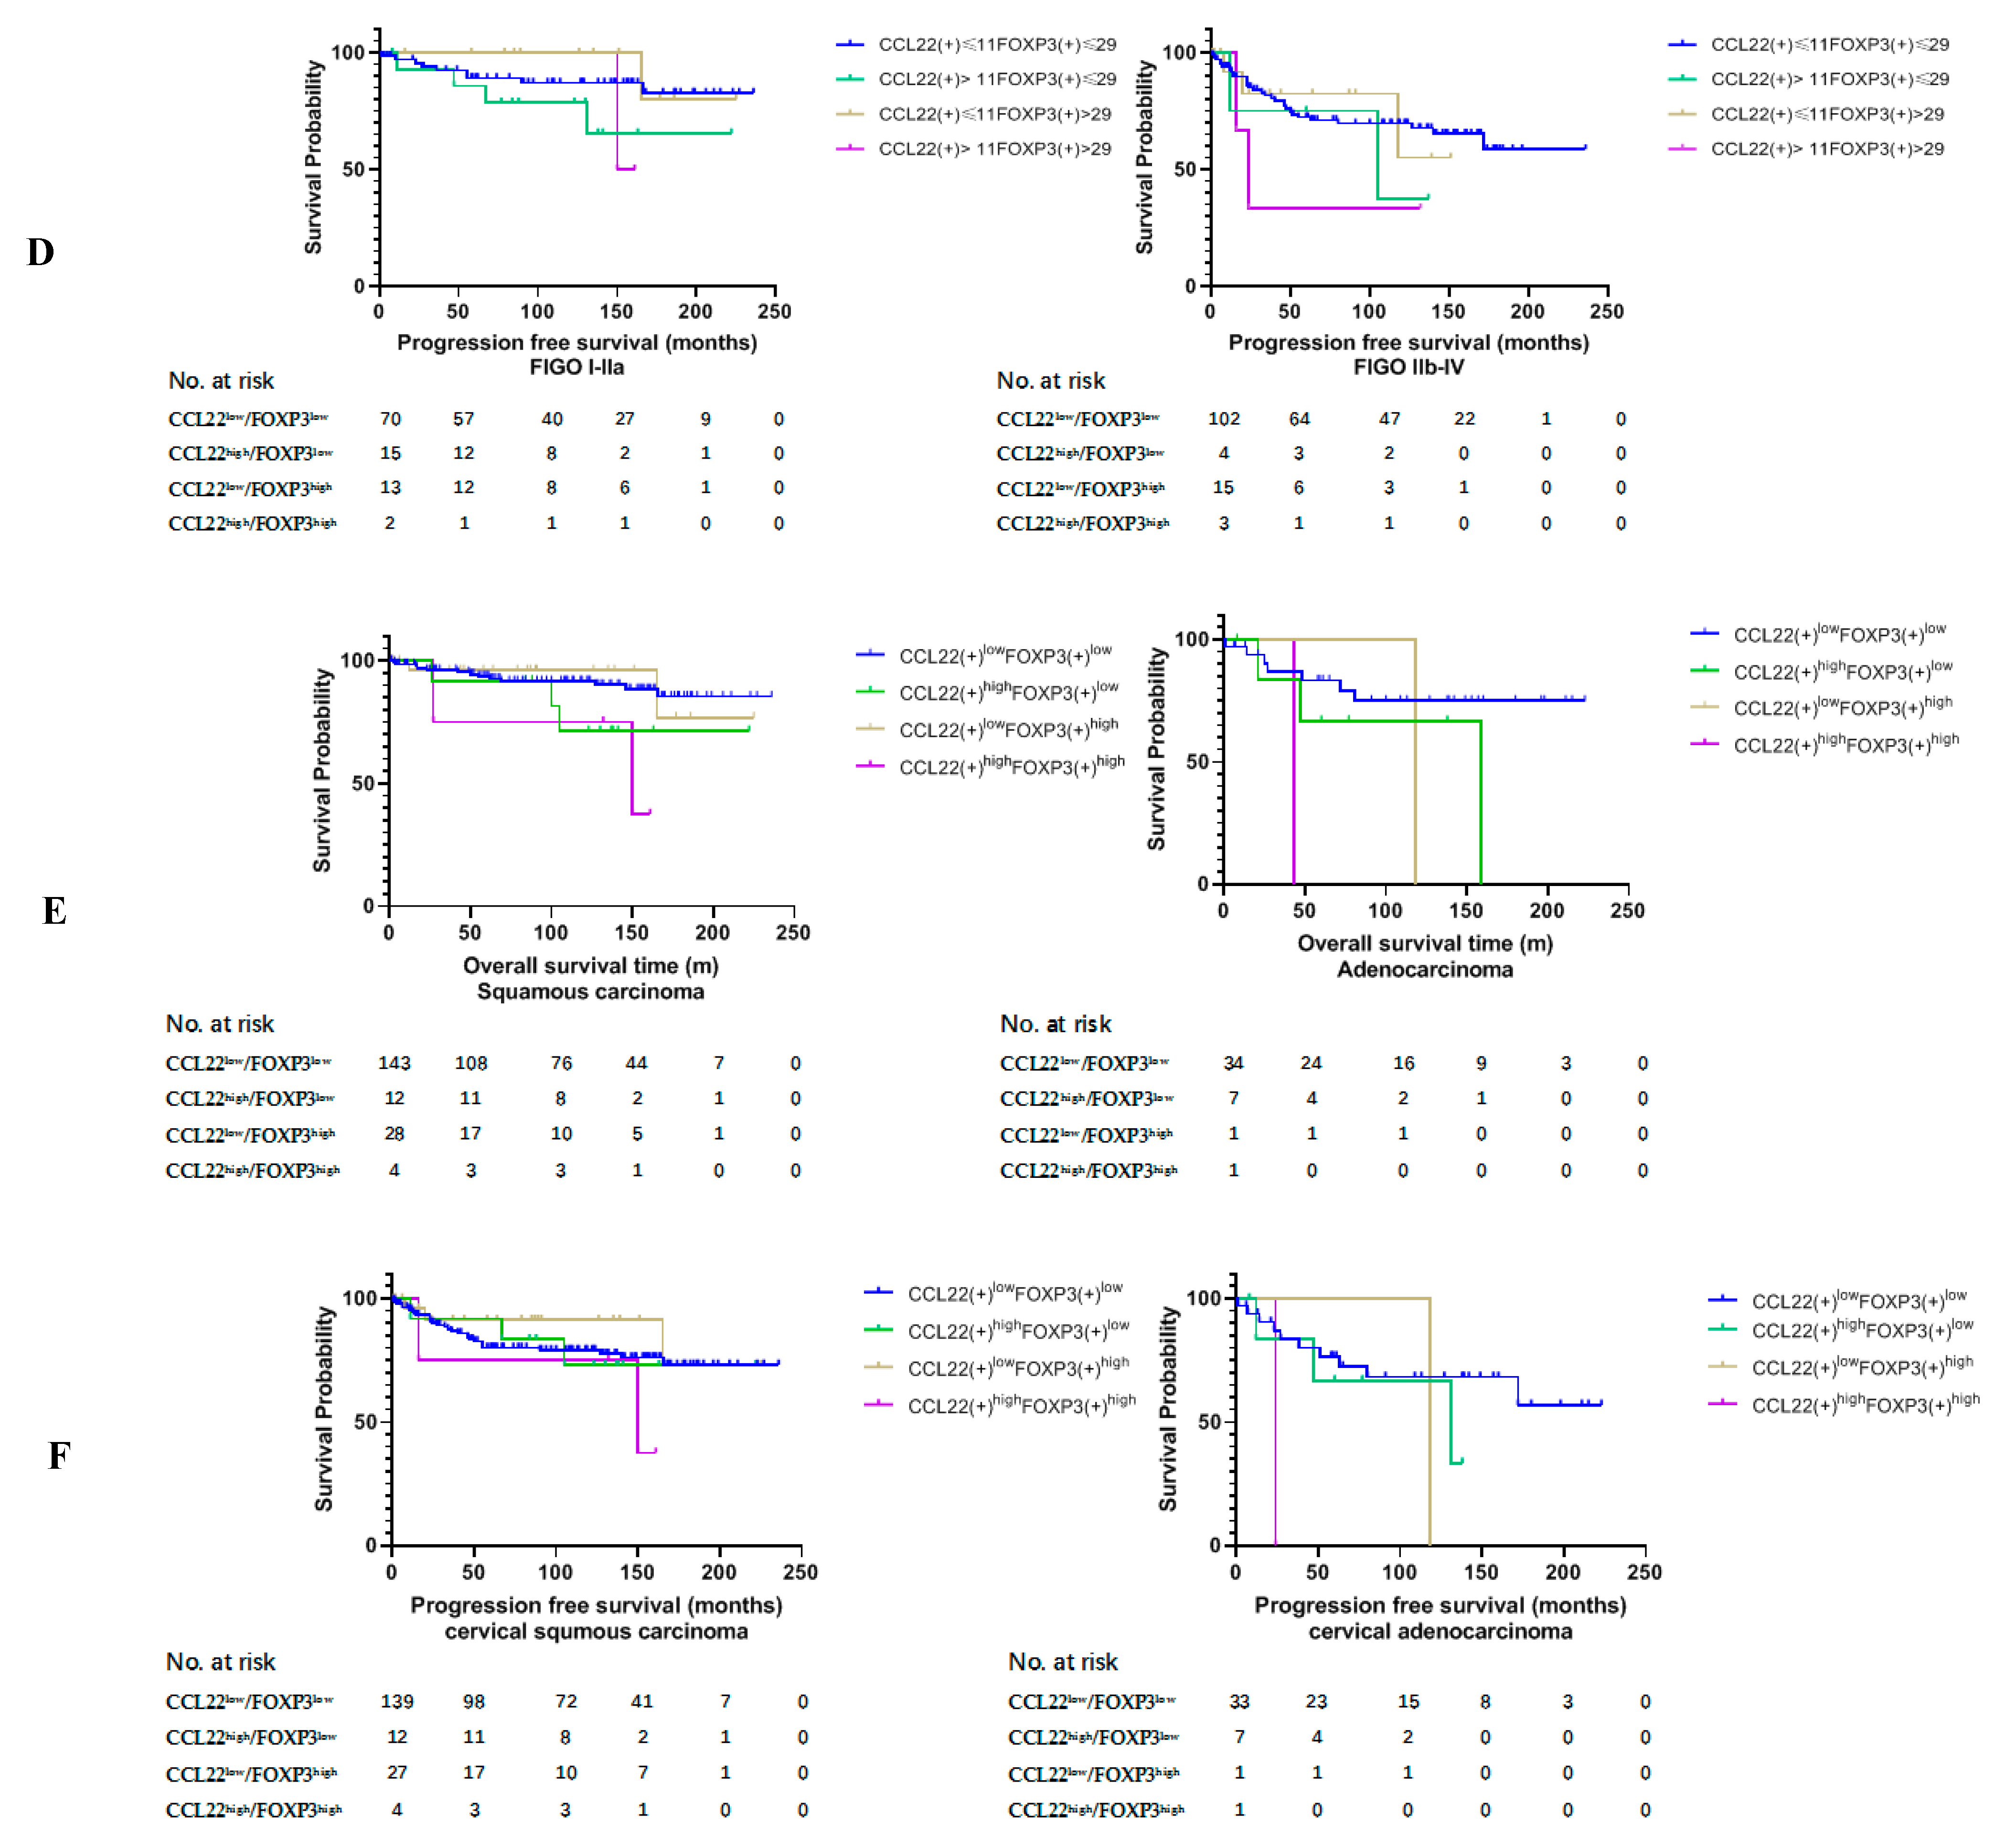
2.3. Higher Number of CCL22+ Cells Predicts Poor Prognosis of Patients with Cervical Cancer

We compared the overall survival rate (OS) and progression free survival (PFS) between group CCL22low and group CCL22high and the combined groups of CCL22 and FOXP3. The results of this study revealed that the OS of group CCL22high was significantly lower than that of group CCL22low (p = 0.001) (Figure 2A, left). The OS of group CCL22highFOXP3low was significantly lower than that of group CCL22lowFOXP3low (p = 0.022), while the OS of group CCL22highFOXP3high was significantly lower than that of group CCL22lowFOXP3low (p = 0.003). The OS of group CCL22high FOXP3high was significantly lower than that of group CCL22low FOXP3high (p = 0.019) (Figure 2B, left, Table 2). There was no significant difference in PFS between group CCL22low and group CCL22high (Figure 2A, right), but PFS of group CCL22highFOXP3high was significantly lower than that of group CCL22lowFOXP3high (Figure 2B, right, Table 3).
We further compared the OS and PFS of the four groups in low and high FIGO stages, respectively. We found that the OS of CCL22highFOXP3low and CCL22highFOXP3high groups were significantly lower than those of the CCL22lowFOXP3low group in FIGO stage I–IIA (p = 0.001, p = 0.013, respectively) (Figure 2C, left, Table 4). The OS of the CCL22highFOXP3high group was significantly lower than that of the CCL22lowFOXP3low group in FIGO stage IIB–IV (p = 0.029) (Figure 2C, right, Table 4). However, there was no significant difference in PFS among different groups in both low and high FIGO stages (p > 0.05) (Figure 2D, Table 5).
Due to the significant difference in the distribution of FOXP3(+) cells in cervical squamous carcinoma and adenocarcinoma (Table 1), we further compared the OS and PFS of the four groups in the two disease types, respectively. We found that the OS of the CCL22highFOXP3high group was significantly lower than that of the CCL22lowFOXP3high and CCL22lowFOXP3low groups in cervical squamous carcinoma (p = 0.023, p = 0.020, respectively) (Figure 2E, left, Table 6). The OS of group CCL22highFOXP3high was significantly lower than that of group CCL22low FOXP3low in cervical adenocarcinoma (p = 0.043) (Figure 2E, right, Table 6). There was no significant difference in PFS in cervical squamous carcinoma (p > 0.05) (Figure 2F, left, Table 7). The PFS of group CCL22highFOXP3high was significantly lower than that of group CCL22lowFOXP3low in cervical adenocarcinoma (p = 0.041) (Figure 2F, right, Table 7).
Subsequently, a multivariate analysis was done using the COX proportional hazards model for variables that were significant in the univariate analysis was performed. For the OS analysis, we constructed two models with CCL22low vs. CCL22high or with CCL22lowFOXP3low vs. CCL22highFOXP3high. For the PFS, one model with CCL22lowFOXP3low vs. CCL22highFOXP3high was constructed. The results showed that CCL22high and CCL22highFOXP3high were independent predictors of shorter OS (HR 4.985, p = 0.0001; HR 5.284, p = 0.009; respectively). Although there were significant differences in PFS between group CCL22highFOXP3high and group CCL22lowFOXP3low, CCL22highFOXP3high was not an independent predictor of PFS (HR, 3.018; p = 0.068) (Table 8).

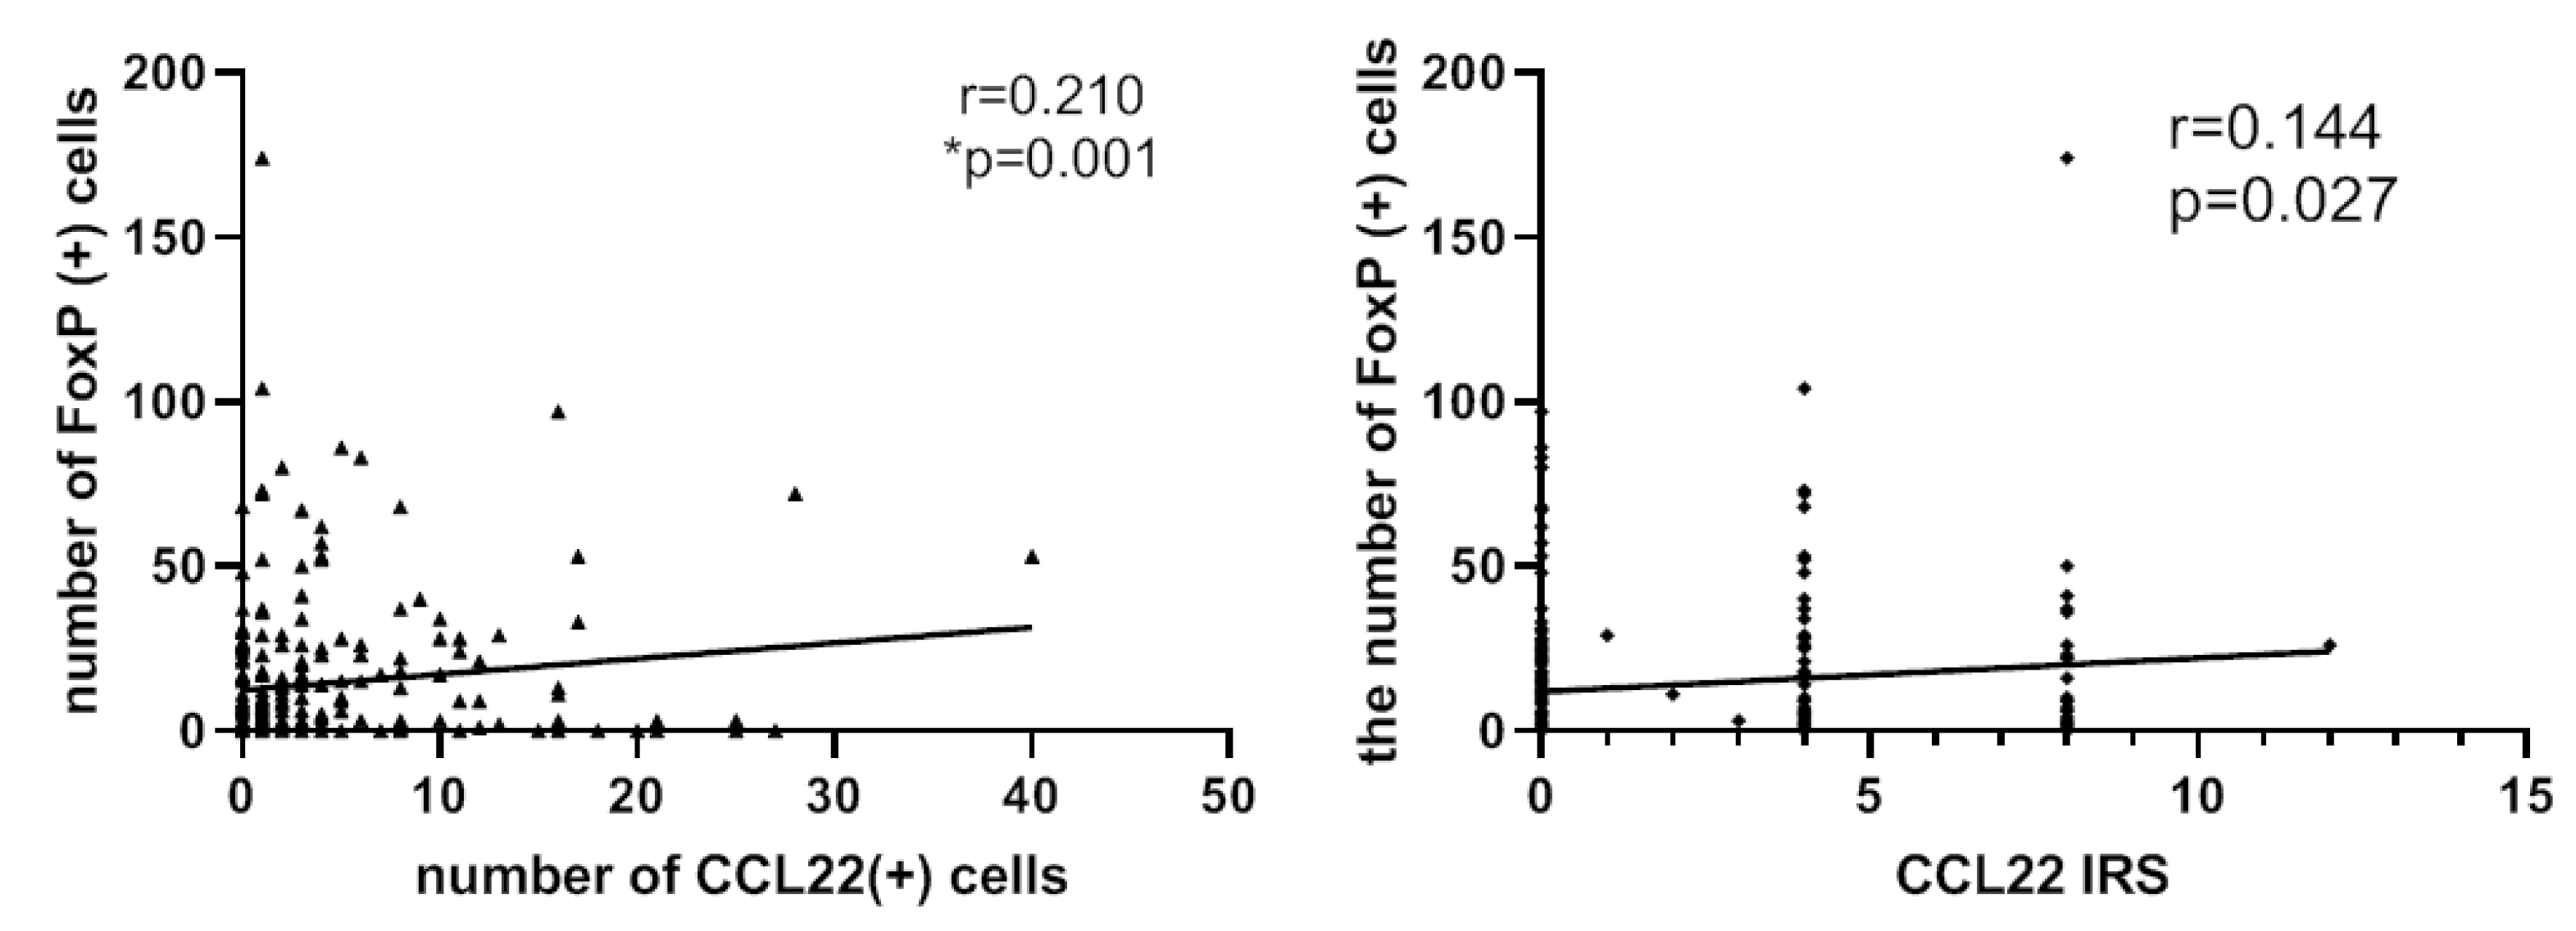
2.4. Correlation Analysis between CCL22+ Expression and FOXP3+ Cells

FoxP3 has been employed as a marker of regulatory T-cells. We postulated that the number of CCL22+ cells or the CCL22 expression in cervical cancer cells is correlated to the number of FOXP3+ cells in cervical cancer specimens. This hypothesis was tested by determining the expression of CCL22 and FOXP3 proteins by tissue microarray with IHC (Figure 3). A spearman correlation analysis indicated that both the number of CCL22+ cells and the CCL22 expression in cervical cancer cells were positively correlated with that of FOXP3+ cells (r = 0.210, p = 0.002; r = 0.144, p = 0.027, respectively) (Figure 4).

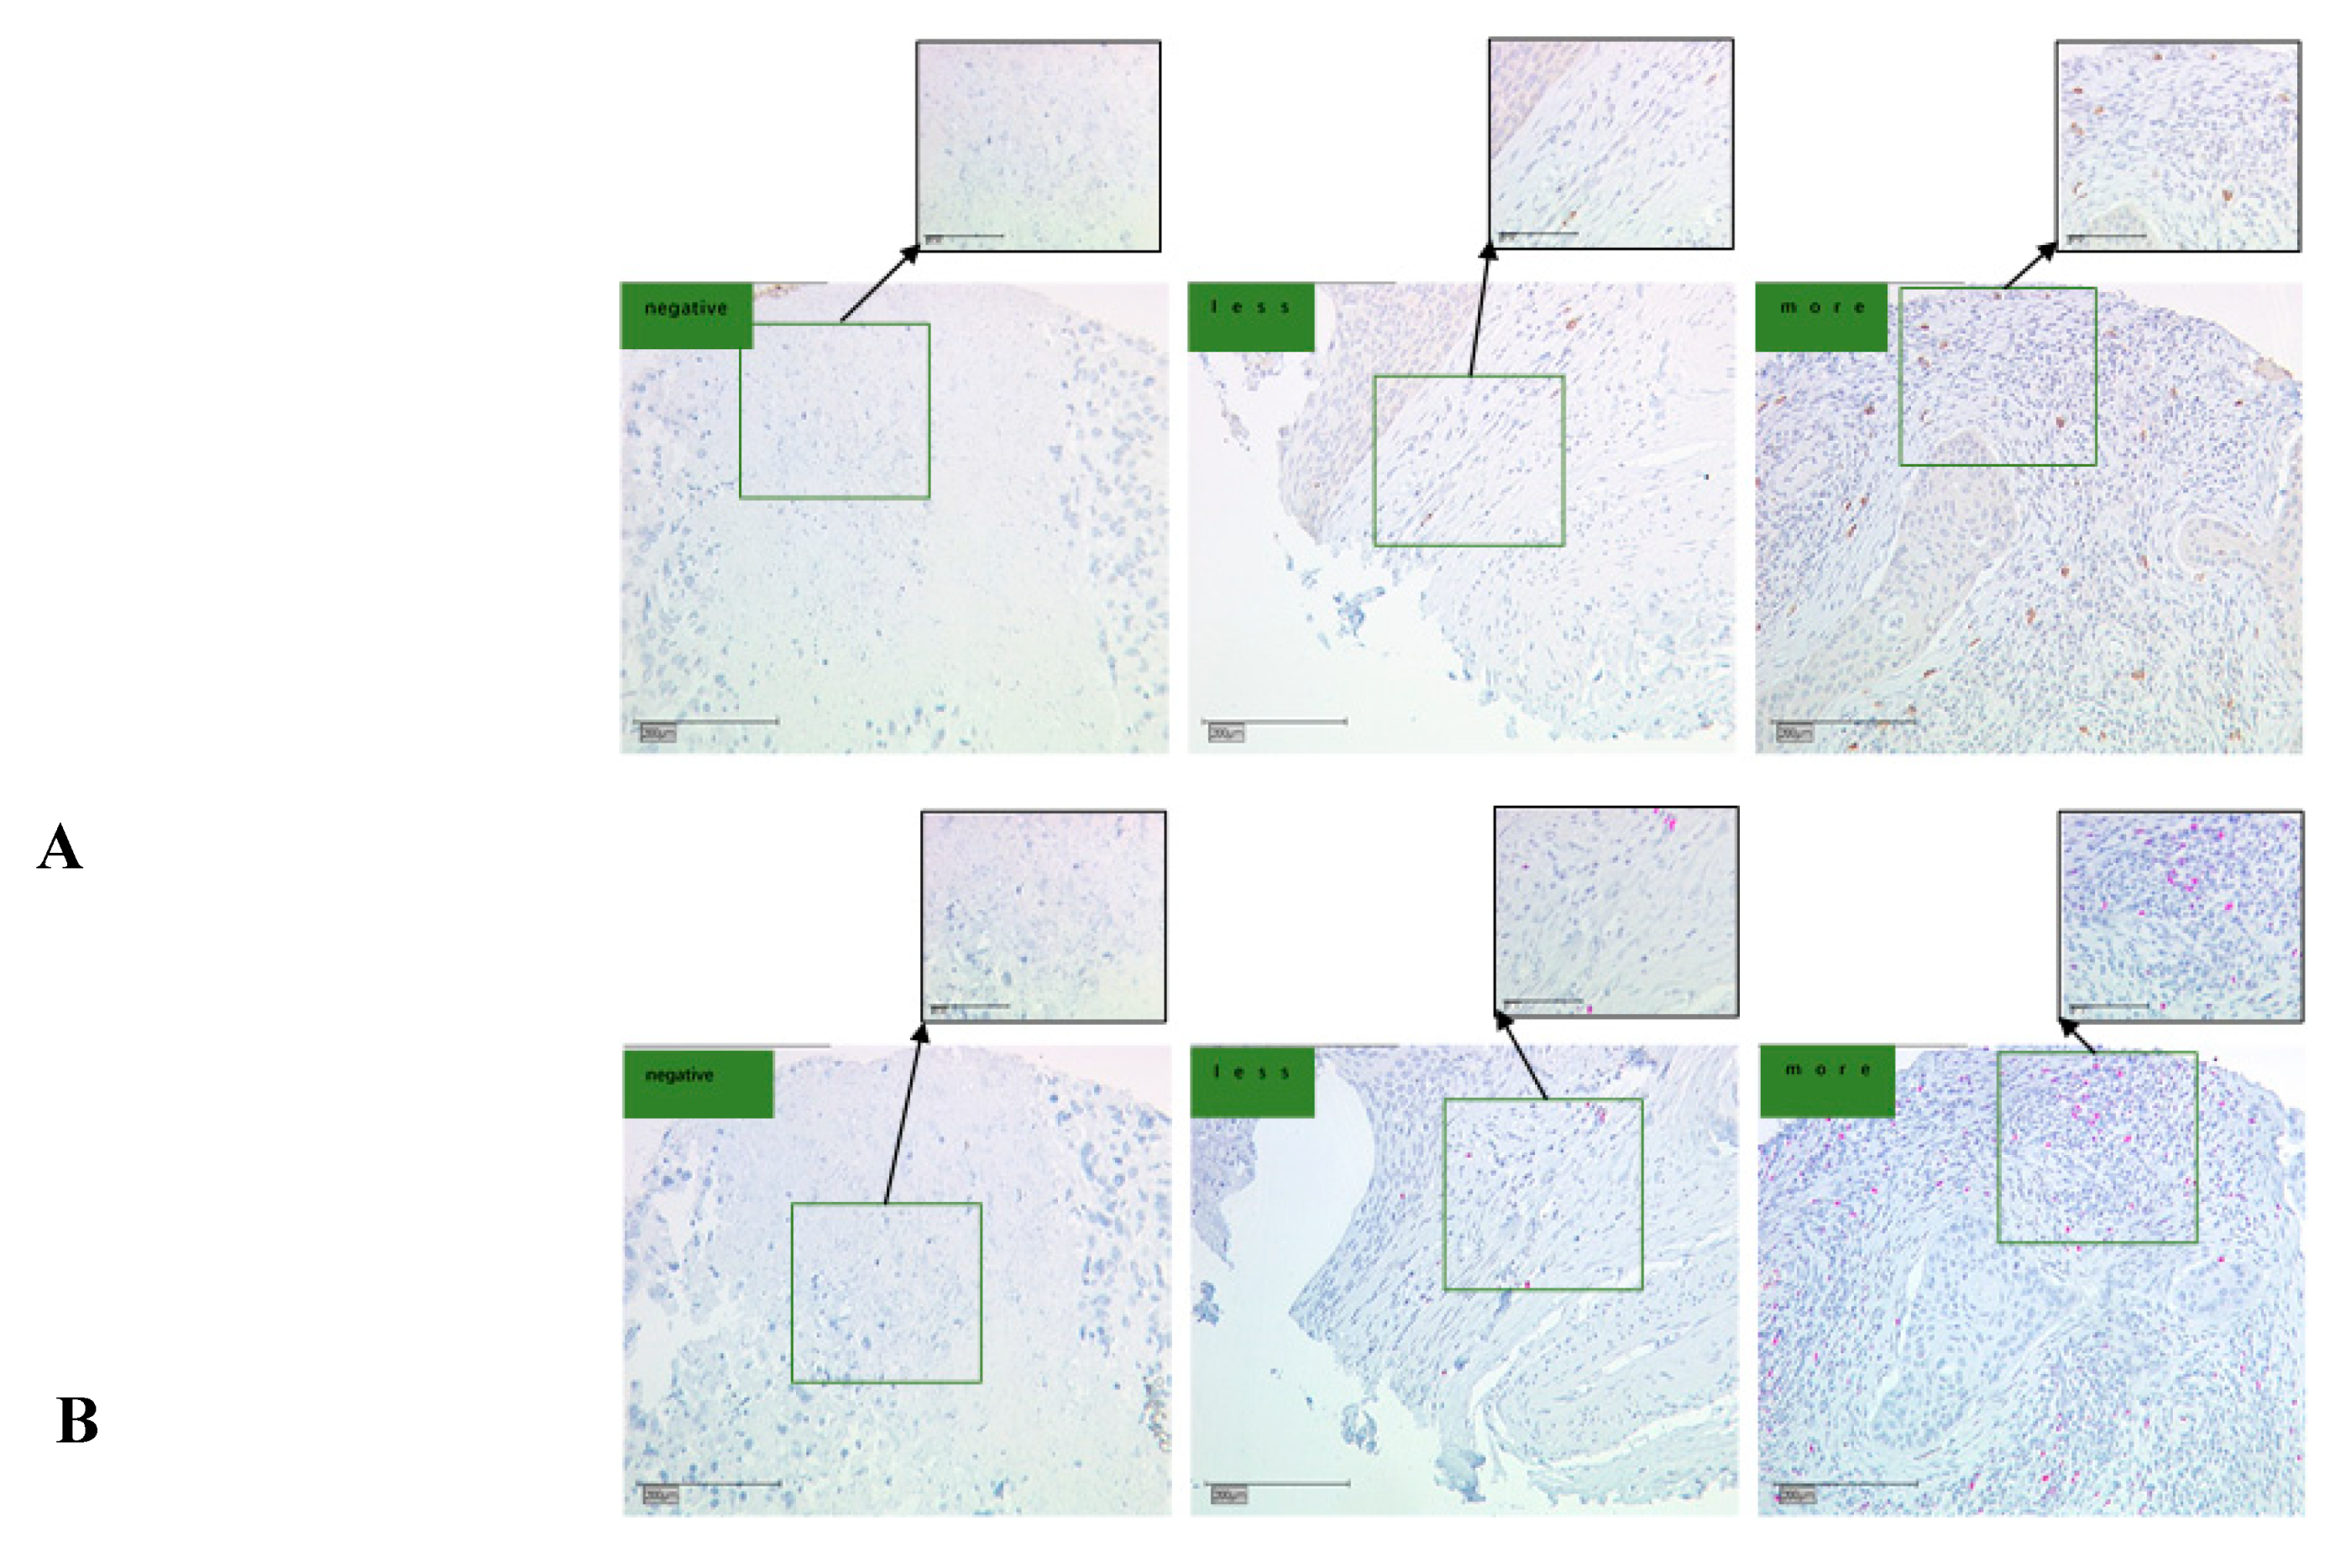
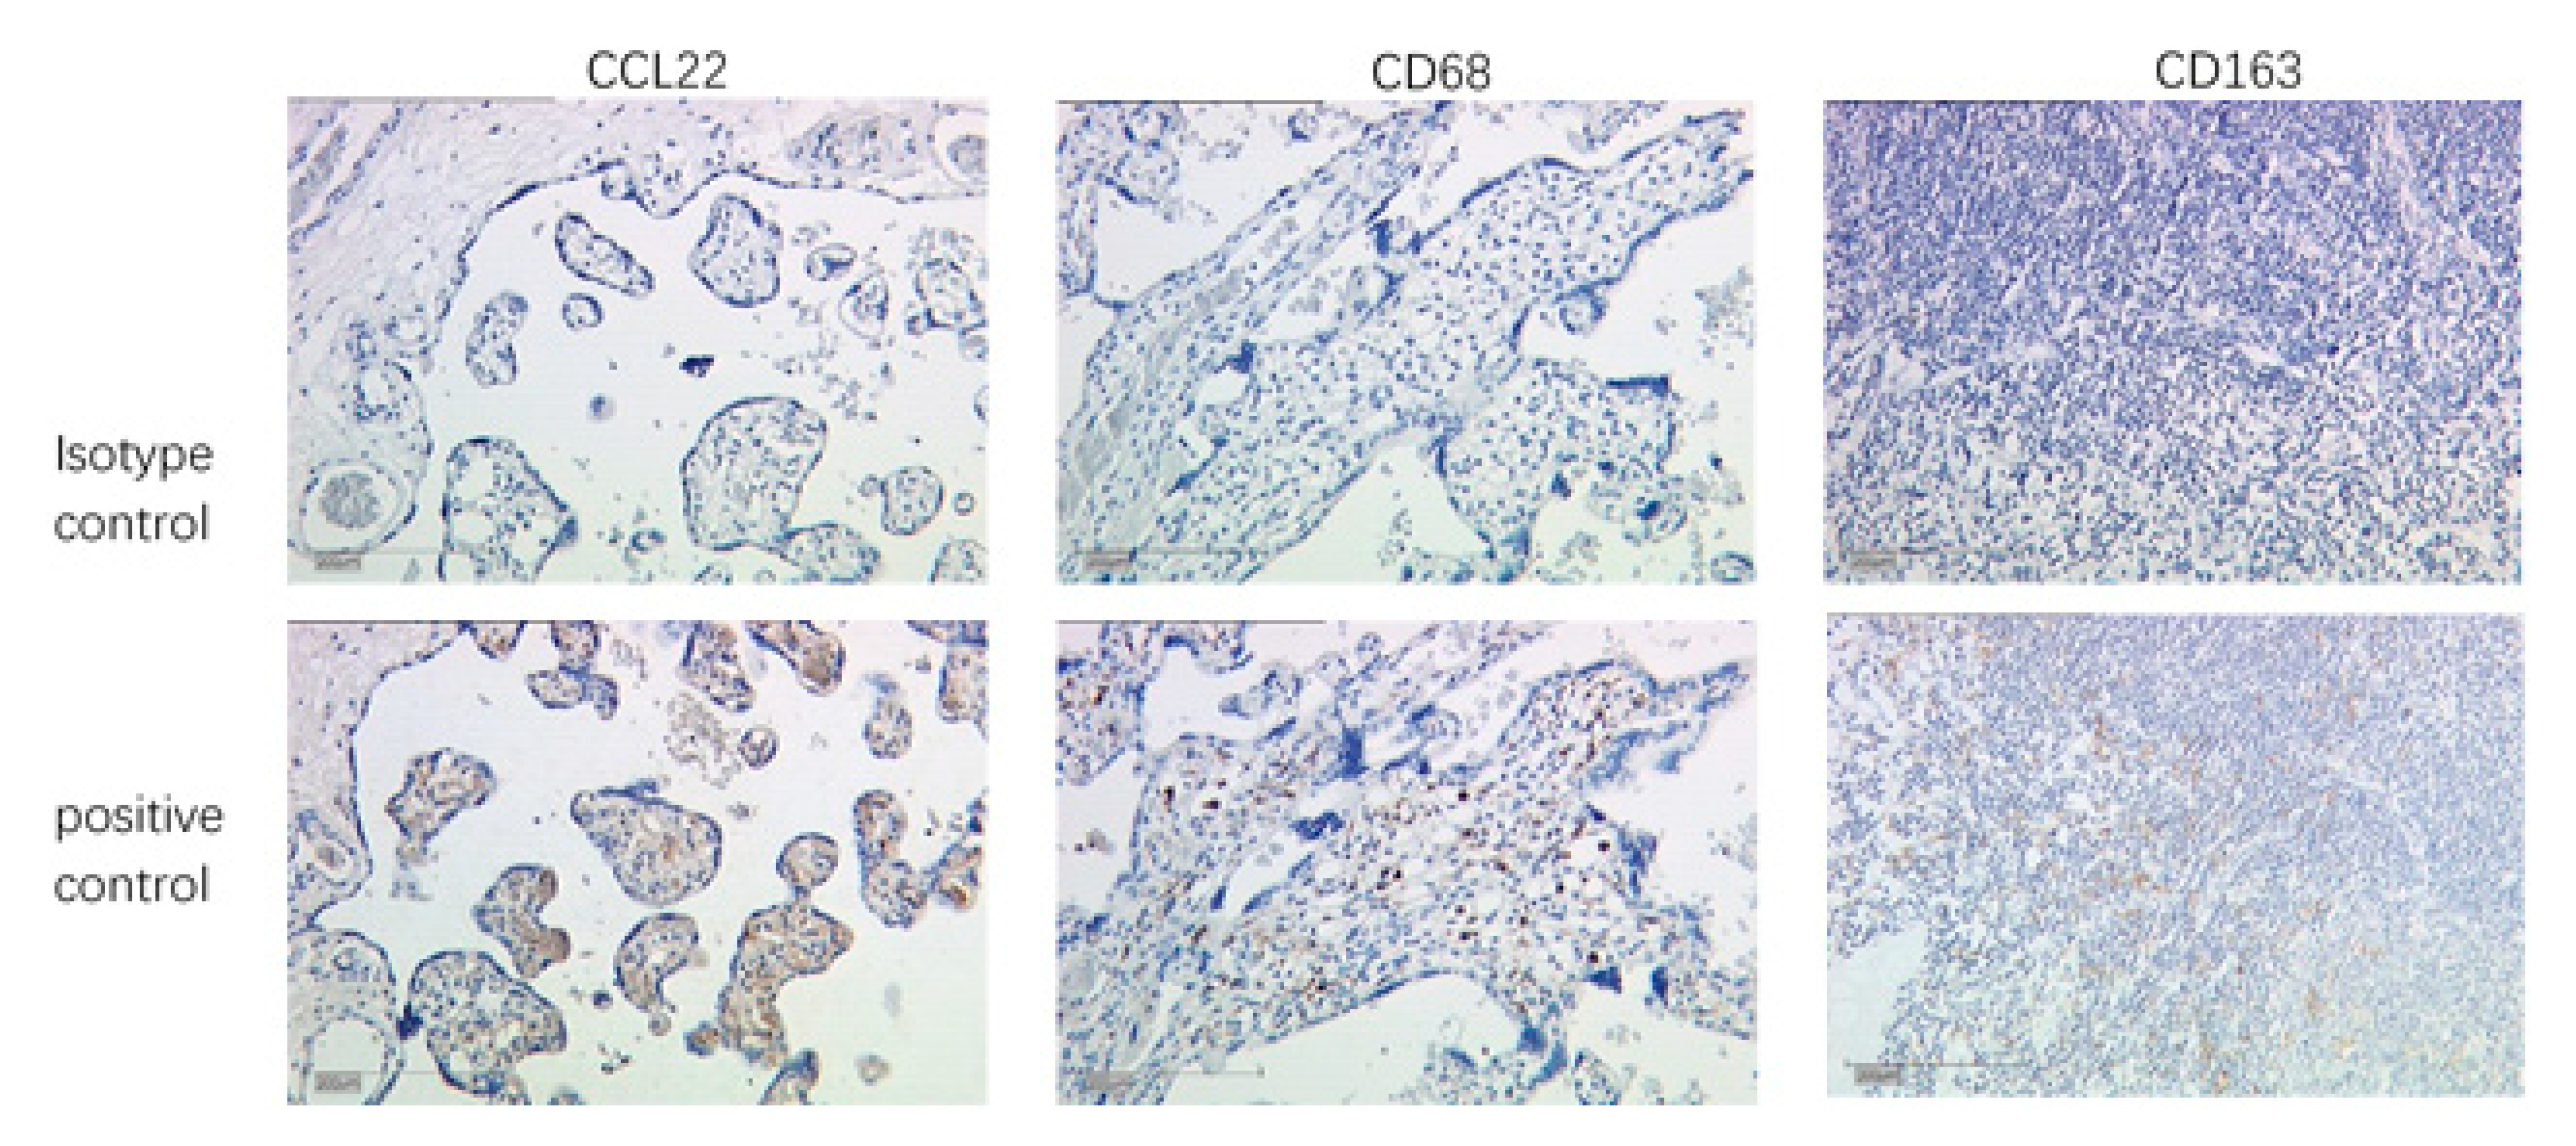
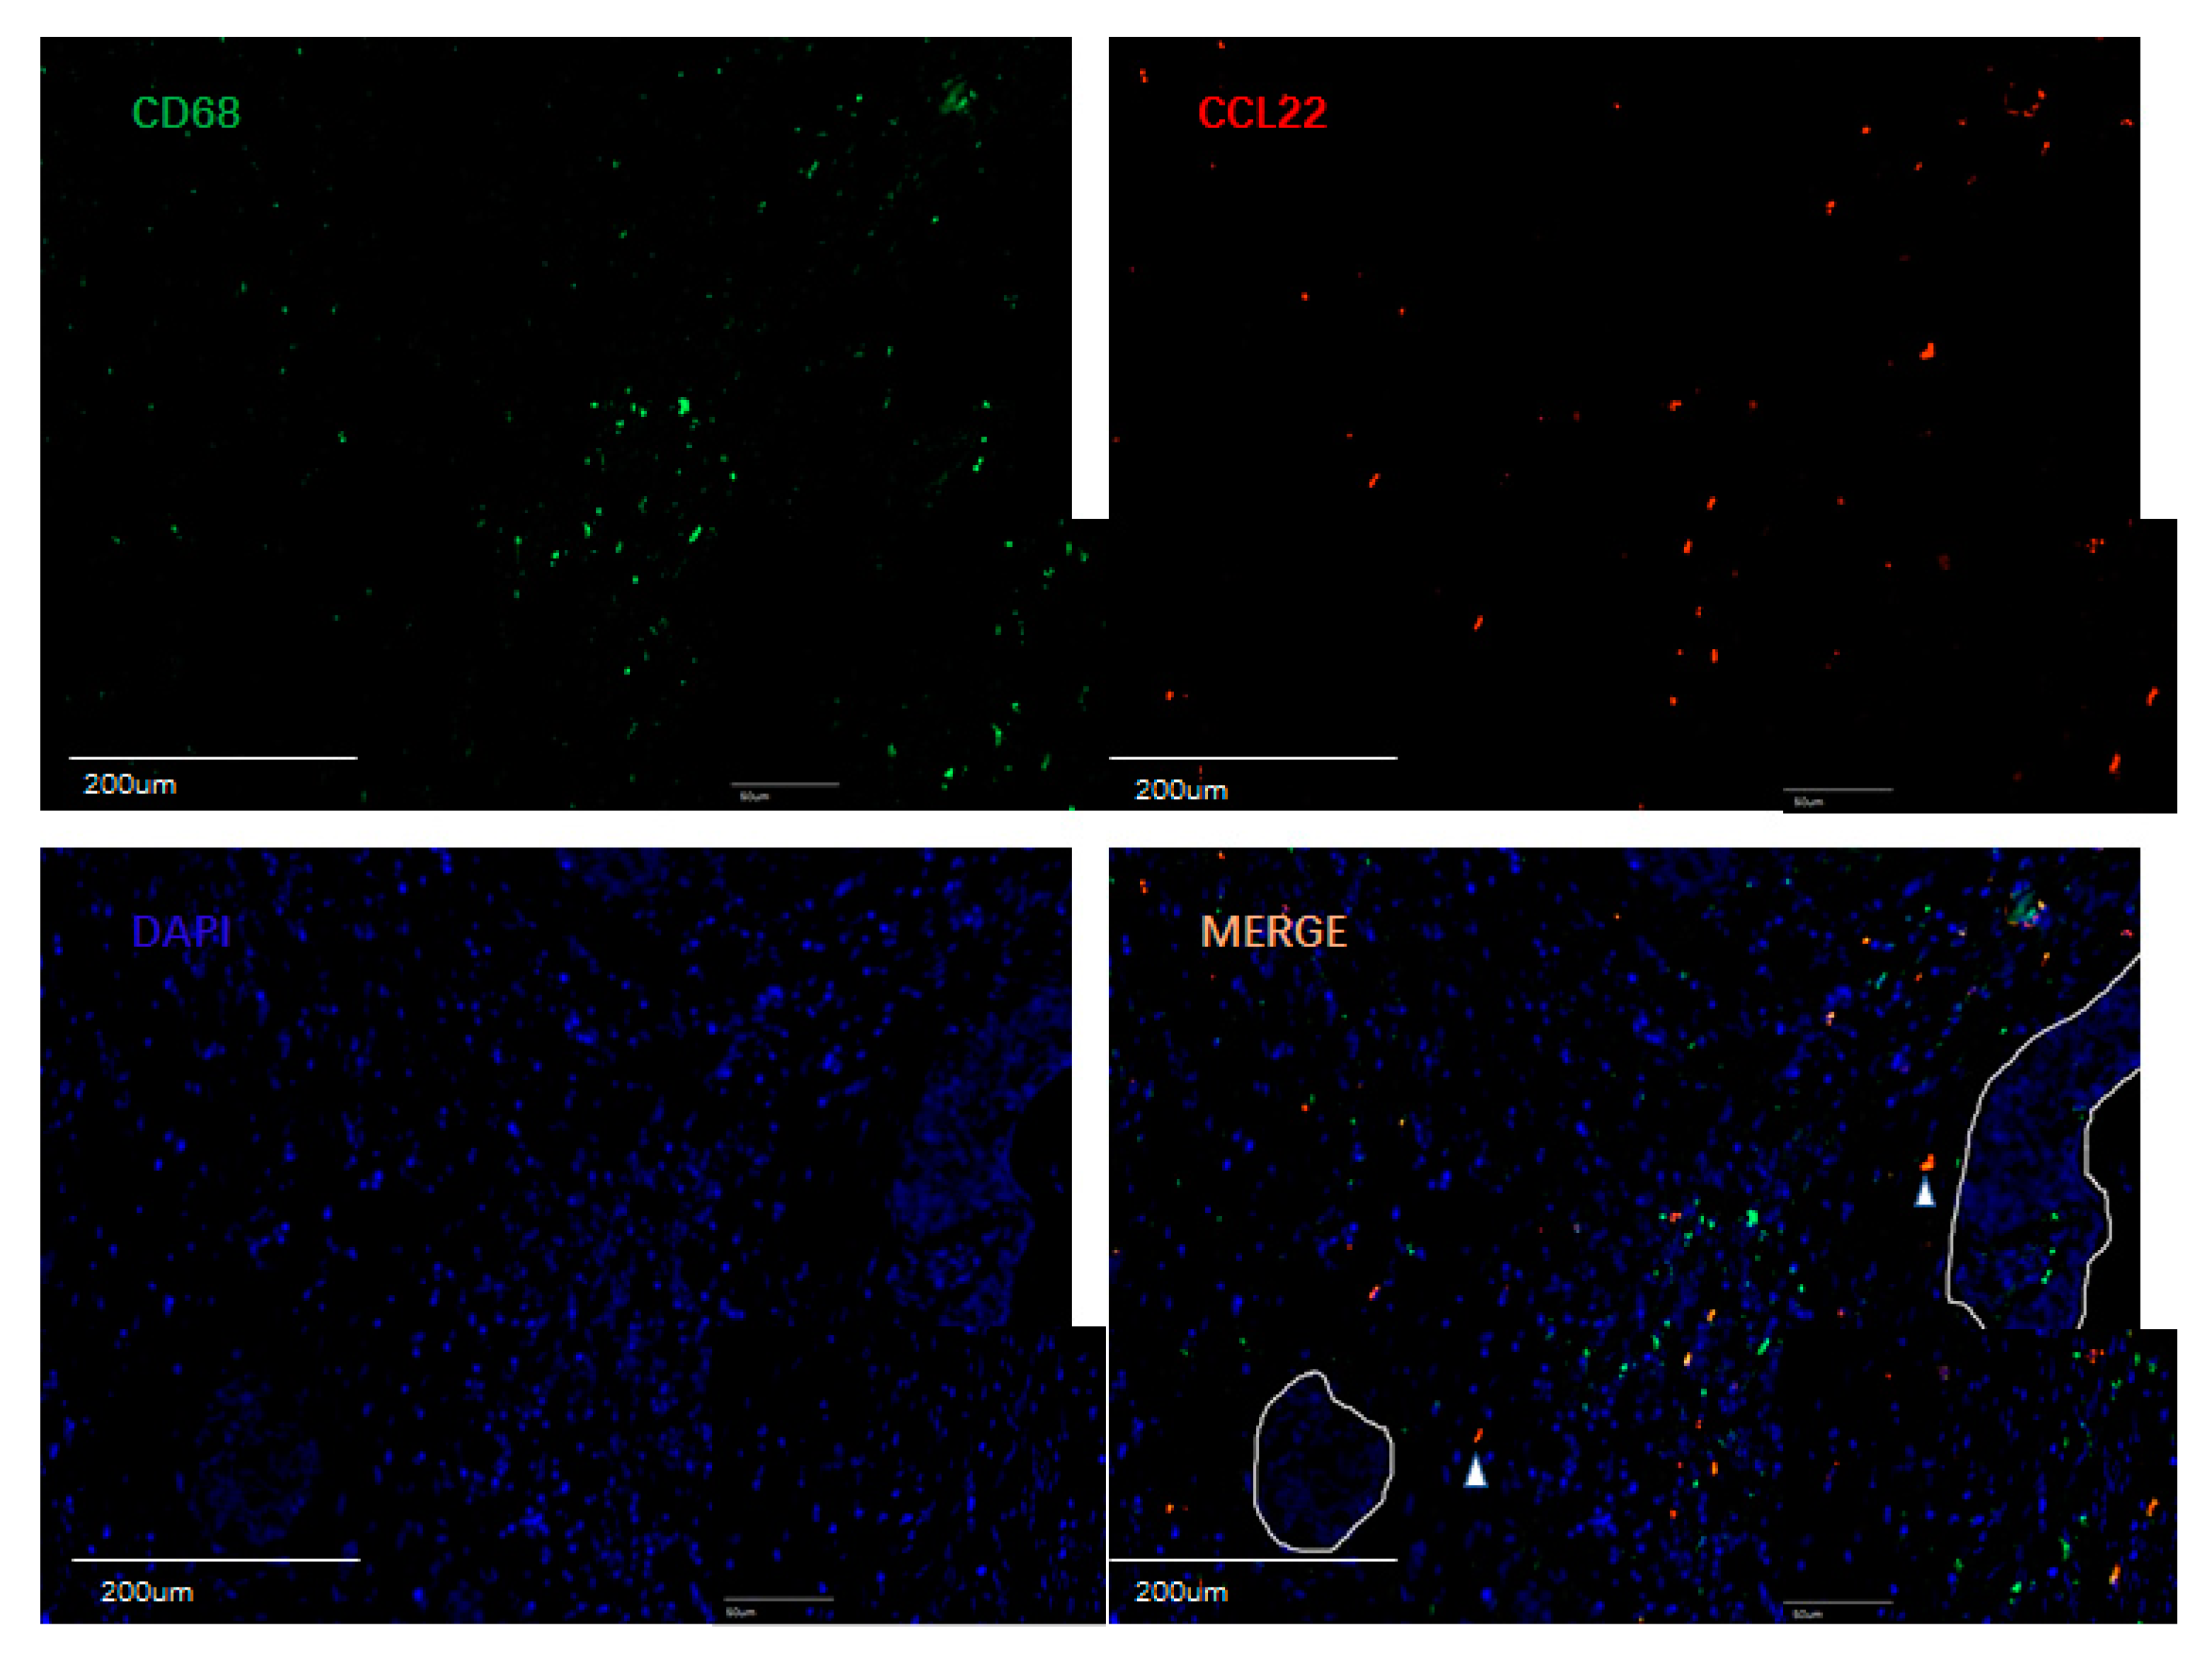
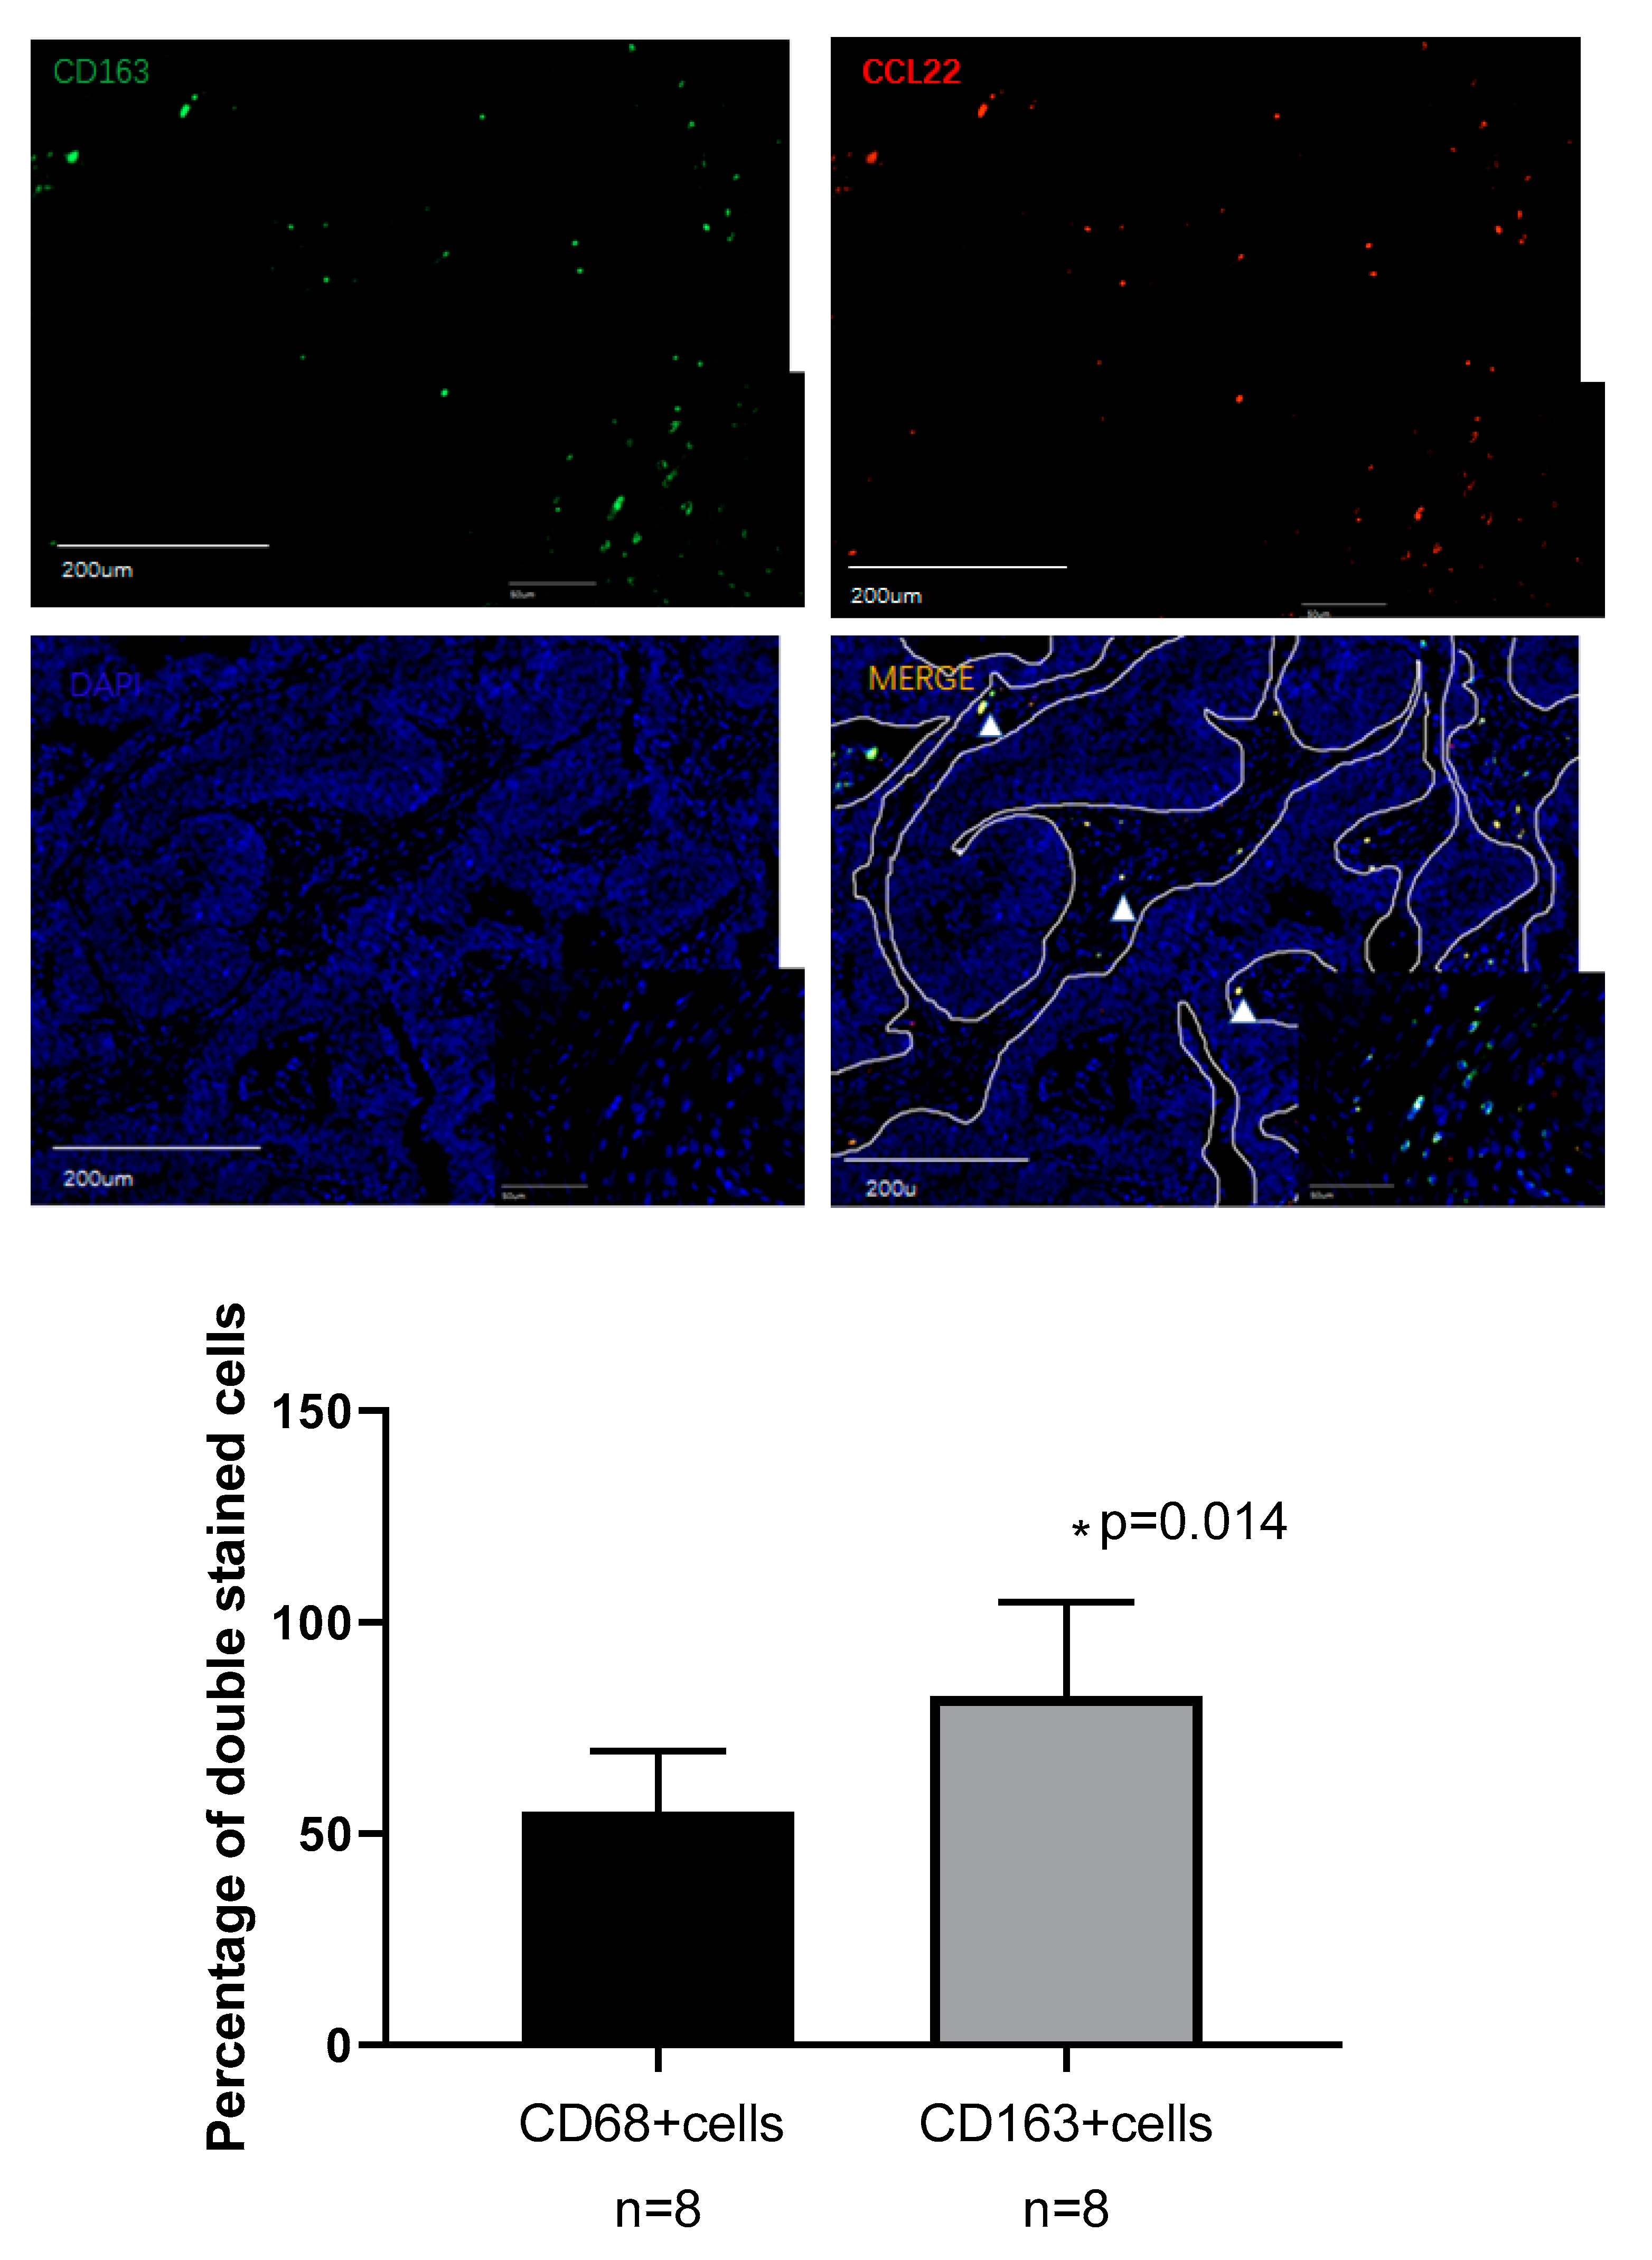
2.5. Identification of CCL22 Expressing Cells in Cervical Cancer

Placenta tissue was used as a positive control for CCL22 and CD68, and appendix tissue as a positive control tissue for CD163. Negative control regents with normal IgG were applied to check CCL22 (rabbit IgG), CD68 (mouse IgG), and CD163 (mouse IgG) antibody specificity (Figure 5 and Figure 6).
A previous study reported that CCL22 is expressed in myeloid cells such as dendritic cells and macrophages in the steady state [38]. This study, therefore, performed double immunofluorescence staining for CCL22, CD68, and CD163 to ascertain the expression of CCL22 in CC macrophages. CD68 and CD163 are specific markers for macrophages and M2-like macrophages, respectively [39]. We analyzed the percentage of CD68+/CCL22-, CD68+/CCL22+ and CD163+/CCL22-, CD163+/CCL22+ cells with eight slides. Our results showed that 55.22% (±14.32%) CCL22+CD68+ cells were found on CD68+ cells, but 82.55% (±22.23%) CCL22+CD163+ cells were found on CD163+ cells (p = 0.014, Student’s t test). The results of our study indicate that M2-like macrophages primarily secrete CCL22.

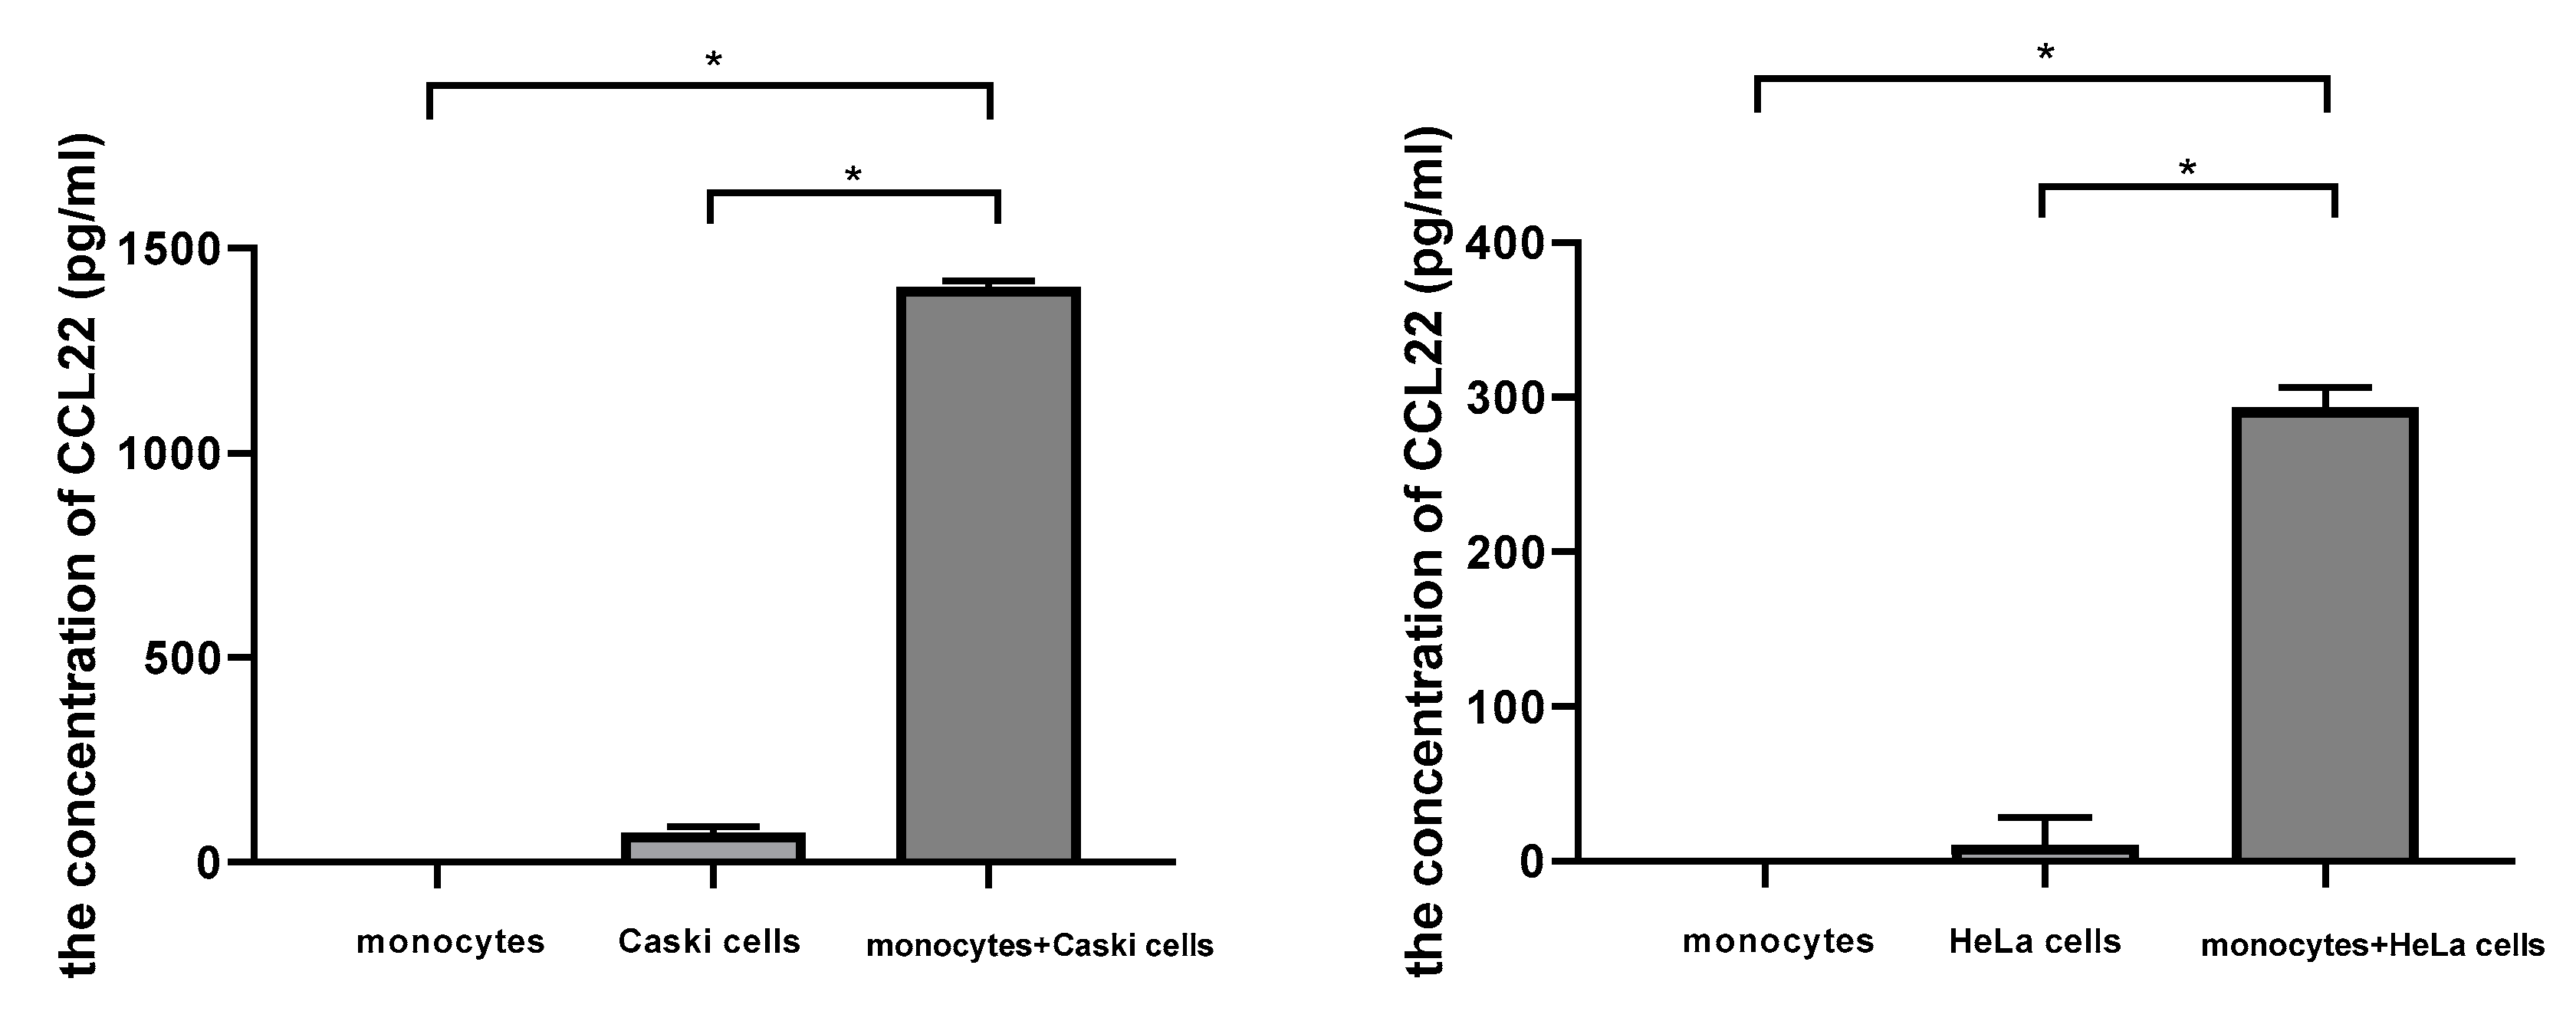
2.6. Cervical Cancer Cells Induced CCL22 in Monocytes

We cocultured monocytes with cervical cancer cells in a noncontact transwell system, which allowed the exchange of soluble factors, but prevented direct cell-cell contact. After coculture, ELISA assay demonstrated that the concentration of CCL22 in the supernatant of the lower chamber of cocultures was significantly higher (1405.4 ± 15.8, p < 0.05; 293.2 ± 13.3, p < 0.05; with Caski cells and Hela cells, respectively) than that of monocytes (0.000007 ± 0.0000004) or cervical cancer cells alone (73.3 ± 13.7, p < 0.05; 10.4 ± 18.1, p < 0.05; Caski and HeLa cells, respectively) (Figure 7). These results indicated that cervical cancer cells could induce CCL22 in monocytes.

3. Materials and Methods

3.1. Bioinformatics

The GEPIA database was used to identify the expression profile of CCL22 (http://gepia.cancer-pku.cn/) [34]. Transcript expression analysis for CCL22 was carried out in a total of 316 samples including 13 normal and 303 CESC tissues across TCGA normal and GTEx data. Next, using ANOVA method, 1 as the Log2FC cutoff value, 0.01 as the cutoff value of the significance level, the expressing difference of CCL22 in CESC tissue was obtained. TIMER database was used to identify the correlation between T-regs, TAM2, and CCL22 (https://cistrome.shinyapps.io/timer/) [35]. UALCAN database was used to analyze survival rate in groups with differently expressed CCL22 in CESC dataset from TCGA (http://ualcan.path.uab.edu/index.html) [37].

3.2. Clinical Sample

The Institutional Review Board of the Ludwig-Maximilian University, Munich, (Number of approval: 337-06, 29 December 2006) approved this study. All patients provided written informed consent. Human cervical cancer tissue microarrays contained 230 samples from the patients diagnosed with CC between January 1994 and September 2002 consecutively from the Department of Obstetrics and Gynecology, LMU Munich. The age was from 22 to 83 years with a median age of 49 years. Clinicopathologic characteristics of patients are available in Table 1. Staging was performed according to the FIGO staging system. Primary treatment of CC consisted of type 3 radical hysterectomy with pelvic lymph-node dissection. Data including age, stage, lymph node metastasis, distant metastasis, and survival status were obtained from medical records. Data on tumor size, tumor grade, and lymph-node metastases were reviewed from pathology reports.

3.3. Tissue Microarray Construction

TMAs were constructed from 230 formalin-fixed, paraffin-embedded cervical cancer tissue specimens, including 187 cervical squamous cancer and 43 cervical adenocarcinoma. Briefly, to define representative tumor areas, an institutional pathologist reviewed the hematoxylin and eosin (HE)-stained whole-mount sections to define representative tumor areas. Subsequently, after retrieval of four 1.0-mm diameter tissue cores from the formalin-fixed paraffin-embedded tissue blocks of which consisted tumor specimens, they were arrayed on a 38 × 25 recipient paraffin block using an MTA-1 manual tissue array (Beecher Instruments Inc., Silver Spring, MD, USA). Then, 3 μm sections were cut on a microtome and placed on glass slides for two replicates. One series was for staining CCL22 and the other was for staining FoxP3. The presence of tumor tissue on the sections was verified by HE staining.

3.4. Immunohistochemistry

The TMA sections were deparaffinized in xylol for 20 min and rinsed in 100% ethanol. Then, 20 min H2O2 incubation was performed to inhibit endogenous peroxidase reaction. Afterwards, the specimens were rehydrated in deescalating alcohol gradients, starting with 100% ethanol and ending with distilled water. The pressure pot contained a sodium citrate buffer (pH = 6.0), which consisted of 0.1 m citric acid and 0.1 mM sodium citrate in distilled water. Then, samples were washed in PBS twice and incubated with a blocking solution (Regent 1, ZytoChem Plus HRP Polymer System (Mouse/Rabbit), Zytomed, Berlin, Germany) for 5 min. Incubation with the primary antibody was performed at 4 °C for 16 h. All antibodies used are listed in Table 4. Samples were washed twice in PBS (pH = 7.4) following every subsequent step. The blocking solutions (Regent 2) was applied for 20 min and HRP-Polymer (Regent 3) for 30 min. The chromogen-substrate staining was carried out using the Liquid DAB+ Substrate Chromogen System (Dako Scientifi, Glostrup, Denmark). The reaction was stopped by applying distilled water. Finally, the slides were counterstained with Hemalaun for 2 min and blued in tap water. The slides were dehydrated in an ascending alcohol gradient and cover slipped with Eukitt quick hardening mounting medium (Sigma Aldrich, St.Lousis, MO, USA). Human tonsil tissue was applied as positive control. All slides were analyzed using the microscope Leitz Wetzlar (Wetzlar, Germany; Type 307-148.001 514686). The immunoreactive score (IRS) was used for evaluation of the intensity and distribution pattern of antigen expression. The semiquantitative score was calculated as follows: the optical staining intensity (grades: 0 = none, 1 = weak, 2 = moderate, 3 = strong staining) was multiplied by the total percentage of positively stained cells (0 = none, 1 = 10%, 2 = 11–50%, 3 = 51–80%, and 4 = 81% of the cells). This multiplication has a minimum of 0 and a maximum of 12. Two experience staff members analyzed the slides independently. Total number of CCL22+ cells and FOXP3+ cells were counted in a magnification field of 40× lens three times each in three different areas of each slide. The cutoff value was calculated by ROC curve. Cutoff values of 11 and 27 were applied for CCL22+ cells and FOXP3+ cells, respectively.

3.4.1. Evaluation of CCL22+ Cells as Macrophages

For the visualization of CCL22 expressing cells in CC infiltrating cells, the same tissue samples with TMA were used. The antibodies are shown in Table 4. Double immunofluorescence staining for CCL22 and CD68 as a specific macrophage marker was performed to identify the CCL22 expression in macrophages.

3.4.2. Evaluation of CCL22+ Cells as M2-Like Macrophages

In order to identify which subtype of macrophages express CCL22, the same tissue samples with TMA were used. The antibodies are shown in Table 9. Double immunofluorescence staining for CCL22 and CD163 as a specific M2-like macrophage marker was performed.

3.5. Cell Coculture

To determine the effect of cervical cancer cells on the induction of CCL22 in macrophages, monocytes were cocultured with HeLa cells and Caski cells, respectively. Transwell core size was 0.4 μm. First, we picked up the ordered buffy coat and purified the PBMCs using the Ficoll–Hypaque method. We counted the PBMCs and seeded 0.2 million PBMCs per well into 24-well plates. Then plastic adherence was in the incubator overnight. The next day, adhered monocytes were washed gently with 1 × PBS, digested by 0.25% trypsin with 0.25% EDTA and ended by complete medium. Monocytes were plated in the lower chamber and 107 cervical cells were plated in the upper chamber in 24 wells. They were cultured in 500 μL culture medium in each chamber with RPMI 1640 medium and 10% fetal calf serum. Cocultures were incubated for 48 h and the supernatant of the lower chambers were harvested followed by Elisa. 0.2 million monocytes with inserts and 107 Caski and 107 HeLa cells with inserts cultured with RPMI 1640 medium with 10% fetal cow serum were as the control. Elisa was performed after 48 h.

3.6. Elisa

Serum of all groups were collected and stored in −80 °C before analysis. ELISA assay was performed according to the manufacturer’s instructions of the ELISA kits (Catalog No. DMD00, R&D Systems, Minneapolis, MN, USA). The OD value at 450 nm was measured. The concentrations of CCL22 was calculated according to the standard curve.

3.7. Statistical Analysis

Clinical data are presented as number (percentage of the amount of relevant clinicopathology). Statistical analysis of the number of CCL22+ and FOXP3+ cells were performed using chi-square test. Correlation analysis of the number of CCL22+ and FOXP3+ cells were performed using Spearman correlation. The Kaplan–Meier method was used to calculate the OS curve and further survival analysis was performed using the log-rank test. The Cox proportional hazard model was used to estimate hazard ratios and 95% confidence intervals in both univariate and multivariate models. CCL22 concentration was presented as mean ± standard deviation. ANOVA analysis was performed using Welch ANOVA and Games-Howell. Statistical analyses were performed using SPSS version 23.0 (SPSS Inc., Chicago, IL, USA). p < 0.05 was considered statically significant.

4. Discussion

Our study revealed a correlation between the expression of CCL22 and FOXP3 in cervical cancer. This study is the first to report the relationship between CCL22 expression and the prognosis of cervical cancer (CC) patients. The group with a higher number of CCL22+ infiltrating cells shows a lower overall survival rate (OS) than that of the group of lower number of CCL22+ infiltrating cells in cervical cancer. However, the expression of CCL22 in cervical cancer cells seems not to affect the survival rate of CC patients. Moreover, the OS of the group combining higher CCL22+ and FOXP3+ infiltrating cells is lower than that of the group with a combined lower number of CCL22+ and FOXP3+ infiltrating cells.
In recent years, several studies have investigated the prognostic value of new immune checkpoints such as CCL22. CCL22 belongs to a family of secreted proteins that play various roles in immunoregulatory and inflammatory processes [27]. Previous research has reported that CCL22 is a prognostic predictor of various cancers. For instance, a report by Li et al. indicated that tumor secretion by CCL22 is an independent prognostic predictor of breast cancer [40]. Another study proved that the levels of serum macrophage-derived CCL22 are associated with glioma risk and survival period [41]. Besides, CCL22 predicts postoperative prognosis in patients with stage II/III gastric cancer [42]. The prognostic value of CCL22 in cervical cancer has, however, not been investigated. This study reveals that the CCL22high group had a lower OS, compared to the CCL22low group (p = 0.001). CCL22high was an independent predictor of shorter OS (HR, 4.985; p = 0.0001). The OS of the combination group CCL22highFOXP3high was significantly lower than that of the combination group CCL22lowFOXP3low regardless of the FIGO stage and disease subtype. CCL22highFOXP3high was an independent indictor of shorter OS (HR, 5.284; p = 0.009). The PFS of group CCL22highFOXP3high was significantly lower than that of group CCL22lowFOXP3low in cervical adenocarcinoma, but CCL22highFOXP3high was not an independent indicator (HR, 3.018; p = 0.068). Therefore, the CCL22+ infiltrating cells or the combination of CCL22 (+) and FOXP3 (+) cells are novel biomarkers that can be potentially used for cervical cancer prognosis. Since this study only had 5/230 samples with both a high number of CCL22+ and FOXP3+ infiltrating cells, increasing the sample size might provide a more reliable result.
Previous studies reported that CCL22 could recruit FOXP3 (+) regulatory T-cells. Increased CCL22 mRNA levels are correlated with increased FoxP3 mRNA levels in oral cancer specimens [43]. In a B16F10 melanoma model, imiquimod (IQM) has been shown to reduce T-regs at the tumor site by the downregulation of CCL22 production [44]. In cervical cancer, the CCL22 mRNA levels of neoplastic foci and tumor periphery is positively correlated with FOXP3 [45]. In cervical cancer, however, the correlation between protein expression levels of CCL22 and FOXP3, and the cell source of CCL22 have not been determined. This study revealed a similar trend, that the protein level of CCL22 from both cervical cancer cells and infiltrating cells was positively correlated with FOXP3. This correlation was defined by calculating the IRS of CCL22 expression in cervical cancer cells and counting the number of CCL22+ and FOXP3+ cells. The association of the latter was better than the former. Therefore, both cervical cancer cell-derived and infiltrating cell-derived cells might recruit T-regs, and the role of CCL22 from infiltrating cells was found to be more significant than that of CCL22 from cervical cancer cells.
Several studies have investigated the source of CCL22. For instance, Huang et al. proved that CCL22 was overexpressed in head and neck cancer cells [43]. CCL22 was found in macrophages of tongue squamous cell carcinoma [46]. Additionally, the secretion of CCL22 by M2-like macrophages in colorectal cancer was proven [32]. However, CCL22 expression in cervical cancer has not been previously determined. By performing a tissue microarray (TMA) using immunohistochemistry (IHC), we showed that CCL22 could be secreted by cervical cancer cells. Besides, double immunofluorescence of CD163 and CCL22 showed that 82.55% (±22.23%) of CD163(+) cells were overlapped with CCL22 (+) infiltrating cells. Therefore, CCL22 is secreted by M2-like macrophages and cervical cancer cells in cervical cancer. Moreover, many studies proved that cervical cancer cells could induce monocytes into M2 macrophages [18,42] which was consistent with the result in our study to some degree that CCL22 in monocytes could be induced by cervical cancer cells. However, further studies need to be performed to show the effect of cervical cancer cells on M2 macrophages and the regulatory mechanisms of CCL22 needs to be studied in the future. In conclusion, our findings suggest that the increase in CCL22 (+) infiltrating M2-like macrophage cells may recruit more T-regs in CC tissue and cause a poor prognosis for cervical cancer patients. CCL22 could be a prognostic predictor and therapeutic target to identify and treat cervical cancer patients with poorer clinical outcomes.

5. Conclusions

Our study demonstrates that high CCL22(+) infiltrating cells particularly M2-like macrophage cells, is associated with a poor outcome of cervical cancer patients. CCL22 expression is positively correlated with FoxP3 expression in cervical cancer. Thus, CCL22 may be a novel prognostic marker and therapeutic target for the treatment of cervical cancer.

Supplementary Materials

The following are available online at https://www.mdpi.com/2072-6694/11/12/2004/s1, Figure S1: Correlation analysis of CCL22, MRC1 and FOXP3 in CESC tissue as explored by the TIMER database.

Author Contributions

H.H.H.: project development, data collection. Q.W.: experiments, manuscript writing. H.H.H., B.P.K. and A.V.: data collection, manuscript editing. H.H.H. and Q.W. and T.V.: data analyses. E.S., D.M. and U.J.: supervision, data analyses. C.K. and Q.W.: experiments, methodology. S.M.: data analyses, supervision.

Funding

The China Scholarship Council (CSC) funded this study for Qun Wang.

Conflicts of Interest

S.M. reports grants and personal fees from AstraZeneca, personal fees from Clovis, grants and personal fees from Medac, grants and personal fees from MSD. He also reports personal fees from Novartis, grants and personal fees from PharmaMar, grants and personal fees from Roche, personal fees from Sensor Kinesis, grants and personal fees from Tesaro, grants and personal fees from Teva, outside the submitted work. All other authors declare no conflict of interest.

References

  1. Torre, L.A.; Bray, F.; Siegel, R.L.; Ferlay, J.; Lortet-Tieulent, J.; Jemal, A. Global cancer statistics, 2012. CA Cancer J. Clin. 2015, 65, 87–108. [Google Scholar] [CrossRef] [PubMed] [Green Version]
  2. Ch, P.N.; Gurram, L.; Chopra, S.; Mahantshetty, U. The management of locally advanced cervical cancer. Curr. Opin. Oncol. 2018, 30, 323–329. [Google Scholar] [CrossRef]
  3. Kessler, T.A. Cervical Cancer: Prevention and Early Detection. Semin. Oncol. Nurs. 2017, 33, 172–183. [Google Scholar] [CrossRef] [PubMed]
  4. Walboomers, J.M.; Jacobs, M.V.; Manos, M.M.; Bosch, F.X.; Kummer, J.A.; Shah, K.V.; Snijders, P.J.F.; Peto, J.; Meijer, C.J.L.M.; Munoz, N. Human papillomavirus is a necessary cause of invasive cervical cancer worldwide. J. Pathol. 1999, 189, 12–19. [Google Scholar] [CrossRef]
  5. Clifford, G.M.; Tully, S.; Franceschi, S. Carcinogenicity of Human Papillomavirus (HPV) Types in HIV-Positive Women: A Meta-Analysis From HPV Infection to Cervical Cancer. Clin. Infect. Dis. 2017, 64, 1228–1235. [Google Scholar] [CrossRef] [PubMed]
  6. Feldman, C.H.; Liu, J.; Feldman, S.; Solomon, D.H.; Kim, S.C. Risk of high-grade cervical dysplasia and cervical cancer in women with systemic lupus erythematosus receiving immunosuppressive drugs. Lupus 2017, 26, 682–689. [Google Scholar] [CrossRef]
  7. Duenas-Gonzalez, A.; Campbell, S. Global strategies for the treatment of early-stage and advanced cervical cancer. Curr. Opin. Obs. Gynecol. 2016, 28, 11–17. [Google Scholar] [CrossRef]
  8. Borcoman, E.; Le Tourneau, C. Pembrolizumab in cervical cancer: Latest evidence and clinical usefulness. Adv. Med. Oncol. 2017, 9, 431–439. [Google Scholar] [CrossRef]
  9. Toker, A.; Ohashi, P.S. Expression of costimulatory and inhibitory receptors in FOXP3(+) regulatory T cells within the tumor microenvironment: Implications for combination immunotherapy approaches. Adv. Cancer Res. 2019, 144, 193–261. [Google Scholar] [CrossRef]
  10. Miyara, M.; Sakaguchi, S. Natural regulatory T cells: Mechanisms of suppression. Trends Mol. Med. 2007, 13, 108–116. [Google Scholar] [CrossRef]
  11. Loddenkemper, C.; Hoffmann, C.; Stanke, J.; Nagorsen, D.; Baron, U.; Olek, S.; Huehn, J.; Ritz, J.-P.; Stein, H.; Kaufmann, A.M.; et al. Regulatory (FOXP3+) T cells as target for immune therapy of cervical intraepithelial neoplasia and cervical cancer. Cancer Sci. 2009, 100, 1112–1117. [Google Scholar] [CrossRef]
  12. Visser, J.; Nijman, H.W.; Hoogenboom, B.N.; Jager, P.; Van Baarle, D.; Schuuring, E.; Abdulahad, W.; Miedema, F.; Van Der Zee, A.G.; Daemen, T. Frequencies and role of regulatory T cells in patients with (pre)malignant cervical neoplasia. Clin. Exp. Immunol. 2007, 150, 199–209. [Google Scholar] [CrossRef] [PubMed] [Green Version]
  13. Heusinkveld, M.; De Vos van Steenwijk, P.J.; Goedemans, R.; Ramwadhdoebe, T.H.; Gorter, A.; Welters, M.J.; Van Hall, T.; Van der Burg, S.H. M2 macrophages induced by prostaglandin E2 and IL-6 from cervical carcinoma are switched to activated M1 macrophages by CD4+ Th1 cells. J. Immunol. 2011, 187, 1157–1165. [Google Scholar] [CrossRef] [PubMed] [Green Version]
  14. Sierra-Filardi, E.; Nieto, C.; Dominguez-Soto, A.; Barroso, R.; Sanchez-Mateos, P.; Puig-Kroger, A.; Lopez-Bravo, M.; Joven, J.; Ardavin, C.; Rodrguez-Fernandez, J.L.; et al. CCL2 shapes macrophage polarization by GM-CSF and M-CSF: Identification of CCL2/CCR2-dependent gene expression profile. J. Immunol. 2014, 192, 3858–3867. [Google Scholar] [CrossRef] [PubMed] [Green Version]
  15. Riley, J.K.; Takeda, K.; Akira, S.; Schreiber, R.D. Interleukin-10 receptor signaling through the JAK-STAT pathway. Requirement for two distinct receptor-derived signals for anti-inflammatory action. J. Biol. Chem. 1999, 274, 16513–16521. [Google Scholar] [CrossRef] [Green Version]
  16. Kim, J.; Bae, J.S. Tumor-Associated Macrophages and Neutrophils in Tumor Microenvironment. Mediat. Inflamm. 2016, 2016, 6058147. [Google Scholar] [CrossRef] [Green Version]
  17. Davidson, B.; Goldberg, I.; Kopolovic, J. Inflammatory response in cervical intraepithelial neoplasia and squamous cell carcinoma of the uterine cervix. Pathol. Res. Pract. 1997, 193, 491–495. [Google Scholar] [CrossRef]
  18. Rigo, A.; Gottardi, M.; Zamo, A.; Mauri, P.; Bonifacio, M.; Krampera, M.; Damiani, E.; Pizzolo, G.; Vinante, F. Macrophages may promote cancer growth via a GM-CSF/HB-EGF paracrine loop that is enhanced by CXCL12. Mol. Cancer 2010, 9, 273. [Google Scholar] [CrossRef] [Green Version]
  19. Punt, S.; Thijssen, V.L.; Vrolijk, J.; De Kroon, C.D.; Gorter, A.; Jordanova, E.S. Galectin-1, -3 and -9 Expression and Clinical Significance in Squamous Cervical Cancer. PLoS ONE 2015, 10, e0129119. [Google Scholar] [CrossRef] [Green Version]
  20. Chen, X.J.; Han, L.F.; Wu, X.G.; Wei, W.F.; Wu, L.F.; Yi, H.Y.; Yan, R.-M.; Bai, X.; Zhong, M.; Yu, Y.; et al. Clinical Significance of CD163+ and CD68+ Tumor-associated Macrophages in High-risk HPV-related Cervical Cancer. J. Cancer 2017, 8, 3868–3875. [Google Scholar] [CrossRef] [Green Version]
  21. Hartwig, T.; Montinaro, A.; Von Karstedt, S.; Sevko, A.; Surinova, S.; Chakravarthy, A.; Taraborrelli, L.; Draber, P.; Lafont, E.; Vargas, F.A.; et al. The TRAIL-Induced Cancer Secretome Promotes a Tumor-Supportive Immune Microenvironment via CCR2. Mol. Cell 2017, 65, 730–742. [Google Scholar] [CrossRef] [PubMed] [Green Version]
  22. Lepique, A.P.; Daghastanli, K.R.; Cuccovia, I.M.; Villa, L.L. HPV16 tumor associated macrophages suppress antitumor T cell responses. Clin. Cancer Res. 2009, 15, 4391–4400. [Google Scholar] [CrossRef] [PubMed] [Green Version]
  23. Hilders, C.G.; Munoz, I.M.; Nooyen, Y.; Fleuren, G.J. Altered HLA expression by metastatic cervical carcinoma cells as a factor in impaired immune surveillance. Gynecol. Oncol. 1995, 57, 366–375. [Google Scholar] [CrossRef] [PubMed]
  24. Walentowicz-Sadlecka, M.; Koper, A.; Krystyna, G.; Koper, K.; Basta, P.; Mach, P.; Skret-Magierlo, J.; Dutsch-Wicherek, M.; Sikora, J.; Grabiec, M.; et al. The analysis of metallothionein immunoreactivity in stromal fibroblasts and macrophages in cases of uterine cervical carcinoma with respect to both the local and distant spread of the disease. Am. J. Reprod. Immunol. 2013, 70, 253–261. [Google Scholar] [CrossRef] [PubMed]
  25. Melichar, B.; Solichova, D.; Freedman, R.S. Neopterin as an indicator of immune activation and prognosis in patients with gynecological malignancies. Int. J. Gynecol. Cancer 2006, 16, 240–252. [Google Scholar] [CrossRef] [PubMed]
  26. Bolpetti, A.; Silva, J.S.; Villa, L.L.; Lepique, A.P. Interleukin-10 production by tumor infiltrating macrophages plays a role in Human Papillomavirus 16 tumor growth. BMC Immunol. 2010, 11, 27. [Google Scholar] [CrossRef] [Green Version]
  27. Godiska, R.; Chantry, D.; Raport, C.J.; Sozzani, S.; Allavena, P.; Leviten, D.; Mantovani, A.; Gray, P.W. Human macrophage-derived chemokine (MDC), a novel chemoattractant for monocytes, monocyte-derived dendritic cells, and natural killer cells. J. Exp. Med. 1997, 185, 1595–1604. [Google Scholar] [CrossRef] [Green Version]
  28. Chang, M.; McNinch, J.; Elias, C., 3rd; Manthey, C.L.; Grosshans, D.; Meng, T.; Boone, T.; Andrew, D. Molecular cloning and functional characterization of a novel CC chemokine, stimulated T cell chemotactic protein (STCP-1) that specifically acts on activated T lymphocytes. J. Biol. Chem. 1997, 272, 25229–25237. [Google Scholar] [CrossRef] [Green Version]
  29. Schaniel, C.; Pardali, E.; Sallusto, F.; Speletas, M.; Ruedl, C.; Shimizu, T.; Seidl, T.; Andersson, J.; Melchers, F.; Rolink, A.G.; et al. Activated murine B lymphocytes and dendritic cells produce a novel CC chemokine which acts selectively on activated T cells. J. Exp. Med. 1998, 188, 451–463. [Google Scholar] [CrossRef] [Green Version]
  30. Mantovani, A.; Gray, P.A.; Van Damme, J.; Sozzani, S. Macrophage-derived chemokine (MDC). J. Leukoc. Biol. 2000, 68, 400–404. [Google Scholar]
  31. Curiel, T.J.; Coukos, G.; Zou, L.; Alvarez, X.; Cheng, P.; Mottram, P.; Evdemon-Hogan, M.; Conejo-Garcia, J.R.; Zhang, L.; Burow, M.; et al. Specific recruitment of regulatory T cells in ovarian carcinoma fosters immune privilege and predicts reduced survival. Nat. Med. 2004, 10, 942–949. [Google Scholar] [CrossRef] [PubMed]
  32. Wei, C.; Yang, C.; Wang, S.; Shi, D.; Zhang, C.; Lin, X.; Xiong, B. M2 macrophages confer resistance to 5-fluorouracil in colorectal cancer through the activation of CCL22/PI3K/AKT signaling. OncoTargets Ther. 2019, 12, 3051–3063. [Google Scholar] [CrossRef] [PubMed] [Green Version]
  33. Zhao, M.; Li, Y.; Wei, X.; Zhang, Q.; Jia, H.; Quan, S.; Cao, D.; Wang, L.; Yang, T.; Zhao, J.; et al. Negative immune factors might predominate local tumor immune status and promote carcinogenesis in cervical carcinoma. Virol. J. 2017, 14, 5. [Google Scholar] [CrossRef] [PubMed] [Green Version]
  34. Tang, Z.; Li, C.; Kang, B.; Gao, G.; Li, C.; Zhang, Z. GEPIA: A web server for cancer and normal gene expression profiling and interactive analyses. Nucleic Acids Res. 2017, 45, W98–W102. [Google Scholar] [CrossRef] [PubMed] [Green Version]
  35. Li, T.; Fan, J.; Wang, B.; Traugh, N.; Chen, Q.; Liu, J.S.; Li, B.; Liu, X.S. TIMER: A Web Server for Comprehensive Analysis of Tumor-Infiltrating Immune Cells. Cancer Res. 2017, 77, e108–e110. [Google Scholar] [CrossRef] [PubMed] [Green Version]
  36. Pedraza-Brindis, E.J.; Sanchez-Reyes, K.; Hernandez-Flores, G.; Bravo-Cuellar, A.; Jave-Suarez, L.F.; Aguilar-Lemarroy, A.; Gomez-Lomeli, P.; Lpez-Lopez, B.A.; Ortiz-Lazareno, P.C. Culture supernatants of cervical cancer cells induce an M2 phenotypic profile in THP-1 macrophages. Cell. Immunol. 2016, 310, 42–52. [Google Scholar] [CrossRef]
  37. Chandrashekar, D.S.; Bashel, B.; Balasubramanya, S.A.H.; Creighton, C.J.; Ponce-Rodriguez, I.; Chakravarthi, B.; Varambally, S. UALCAN: A Portal for Facilitating Tumor Subgroup Gene Expression and Survival Analyses. Neoplasia 2017, 19, 649–658. [Google Scholar] [CrossRef]
  38. Vissers, J.L.; Hartgers, F.C.; Lindhout, E.; Teunissen, M.B.; Figdor, C.G.; Adema, G.J. Quantitative analysis of chemokine expression by dendritic cell subsets in vitro and in vivo. J. Leukoc. Biol. 2001, 69, 785–793. [Google Scholar]
  39. Jiang, S.; Yang, Y.; Fang, M.; Li, X.; Yuan, X.; Yuan, J. Co-evolution of tumor-associated macrophages and tumor neo-vessels during cervical cancer invasion. Oncol. Lett. 2016, 12, 2625–2631. [Google Scholar] [CrossRef] [Green Version]
  40. Li, Y.Q.; Liu, F.F.; Zhang, X.M.; Guo, X.J.; Ren, M.J.; Fu, L. Tumor secretion of CCL22 activates intratumoral Treg infiltration and is independent prognostic predictor of breast cancer. PLoS ONE 2013, 8, e76379. [Google Scholar] [CrossRef]
  41. Zhou, M.; Bracci, P.M.; McCoy, L.S.; Hsuang, G.; Wiemels, J.L.; Rice, T.; Zheng, S.; Kelsey, K.T.; Wrensch, M.R.; Wiencke, J.K. Serum macrophage-derived chemokine/CCL22 levels are associated with glioma risk, CD4 T cell lymphopenia and survival time. Int. J. Cancer 2015, 137, 826–836. [Google Scholar] [CrossRef] [PubMed]
  42. Wu, S.; He, H.; Liu, H.; Cao, Y.; Li, R.; Zhang, H.; Li, H.; Shen, Z.; Qin, J.; Xu, J. C-C motif chemokine 22 predicts postoperative prognosis and adjuvant chemotherapeutic benefits in patients with stage II/III gastric cancer. Oncoimmunology 2018, 7, e1433517. [Google Scholar] [CrossRef]
  43. Huang, Y.H.; Chang, C.Y.; Kuo, Y.Z.; Fang, W.Y.; Kao, H.Y.; Tsai, S.T.; Wu, L.-W. Cancer-associated fibroblast-derived interleukin-1beta activates the pro-tumor CCL22 signaling in head and neck cancer. Cancer Sci. 2019, 110, 2783–2793. [Google Scholar] [CrossRef] [PubMed] [Green Version]
  44. Furudate, S.; Fujimura, T.; Kambayashi, Y.; Kakizaki, A.; Hidaka, T.; Aiba, S. Immunomodulatory Effect of Imiquimod Through CCL22 Produced by Tumor-associated Macrophages in B16F10 Melanomas. Anticancer Res. 2017, 37, 3461–3471. [Google Scholar] [CrossRef] [PubMed] [Green Version]
  45. Zhao, M.Y.; Zhao, J.; Yang, T.; Wang, L.; Pei, M.L.; Tian, S.J.; Yu, Y.; Yang, X.-F. Aberrant Expressions of Immune Factors Facilitate the Disequilibrium of Immune Status in Cervical Cancer. Zhongguo Yi Xue Ke Xue Yuan Xue Bao 2016, 38, 522–527. [Google Scholar] [CrossRef] [PubMed]
  46. Kimura, S.; Nanbu, U.; Noguchi, H.; Harada, Y.; Kumamoto, K.; Sasaguri, Y.; Nakayama, T. Macrophage CCL22 expression in the tumor microenvironment and implications for survival in patients with squamous cell carcinoma of the tongue. J. Oral Pathol. Med. 2019, 48, 677–685. [Google Scholar] [CrossRef]
Figure 1. Transcripts expression level of CCL22 in CESC tissue explored using the GEPIA database. Red and grey colors denote the expression level in tumor tissue and normal tissue, respectively. CESC, cervical squamous cell carcinoma and endocervical adenocarcinoma. The asterisk (*) indicate significant higher CCL22 expression in tumor tissue compared to normal tissue.
Cancers 11 02004 g001
Figure 2. Kaplan–Meier estimates of overall survival rate and progression-free survival. (A) Overall survival rate (OS) (left) and progression free survival (PFS) (right) of group CCL22low and CCL22high. (B) OS (left) and PFS (right) of the combined groups. (C) OS of the combined groups at different FIGO stages. (D) PFS of the combined groups at different FIGO stages. (E) OS of the combined groups in different disease subtypes. (F) PFS of the combined groups in different disease subtypes.
Cancers 11 02004 g002aCancers 11 02004 g002b
Figure 3. CCL22 and FOXP3 expression in cervical cancer (CC) tissue microarray as determined by IHC. (A) IHC for CCL22. The scale is 100 and 200 μm, respectively; (B) IHC for FOXP3. The scale is 100 and 200 μm, respectively. The number of CCL22+ and FOXP3+ cells was counted and classified as either negative, less, or more.
Cancers 11 02004 g003
Figure 4. Left: number of CCL22+ cells is associated with that of FOXP3+ cells (r = 0.210, p = 0.001). Right: IRS of CCL22 expressed in cervical cancer cells is associated with the number of FOXP3+ cells (r = 0.144, p = 0.027). The number of cells was counted at a magnification of 25× lens and calculated three times each in three different areas of the tissue microarray (TMA). The IRS of CCL22 in cervical cancer cells was evaluated at a magnification of 25× and evaluated by two independent researchers.
Cancers 11 02004 g004
Figure 5. Validation of antibody specificity by IHC. Placenta as positive control tissue for CCL22 and CD68, and appendix as positive control tissue for CD163. The scale is 200 μm.
Cancers 11 02004 g005
Figure 6. Double fluorescence staining of cervical cancer detecting CD68+CCL22+ cells and CD163+CCL22+cells. Immunofluorescent staining of CCL22+ cells (in red) expressing CD68 (macrophages in green) and CD163 (M2 macrophages in green). These two sets of pictures of different cervical tumor samples are representative of eight tumors analyzed. Arrowheads in the merged picture (lower right) designate double-positive cells located in the stroma. 55.22% (±14.32%) CCL22+CD68+ cells were found on CD68+ cells, but 82.55% (±22.23%) CCL22+CD163+ cells were found on CD163+ cells (p = 0.014, Student’s t test). The solid line in white indicates a barrier between stroma and tumor nest. The image was shown in original magnification of 10× and 40×.
Cancers 11 02004 g006aCancers 11 02004 g006b
Figure 7. Cervical cancer cells induced CCL22 in monocytes. The left column graph representing the concentration of CCL22 in the supernatant from monocytes, Caski cells, and the cocultures of monocytes and Caski cells, respectively. The right column graph represents the concentration of CCL22 in the supernatant from monocytes, HeLa cells, and the cocultures of monocytes and HeLa cells, respectively. Each experiment was triplicated. * p < 0.05.
Cancers 11 02004 g007
Table 1. The association between the number of CCL22+ cells and FOXP3+ cells and clinicopathological characteristics.
Clinicopathological CharacteristicsTotal (%)IRS of CCL22 in CC CellspQuantity of CCL22+ (n%)pQuantity of FOXP3+ (n%)p
Low (IRS < 4)High (IRS ≥ 4)Small (n ≤ 11)Large (n > 11)Small (n ≤ 29)Large (n > 29)
All cases230134 (58.3%)96 (41.7%)206 (89.6%)24 (10.4%)196 (85.2%)34 (14.8%)
Age (year)
≤50132 (57.4%)80 (59.7%)52 (54.2%)0.403114 (55.3%)18 (75.0%)0.065115 (58.7%)17 (50.0%)0.345
>5098 (42.6%)54 (40.3%)44 (45.8%)92 (44.7%)6 (25.0%)81 (41.3%)17 (50.0%)
Tumor Size (cm)
<22 (0.9%)2 (1.5%)0 (0%)0.0802 (1.0%)0 (0%)0.0902 (1.0%)0 (0%)0.905
2–4120 (52.2%)75 (56%)45 (46.9%)103 (50.0%)17 (70.8%)102 (52%)18 (52.9%)
>4107 (46.5%)57 (42.5%)51 (53.1%)101 (49.0%)7 (29.2%)92 (46.9%)16 (47.1%)
PN
Without lymph node metastasis139 (60.4%)81 (60.4%)58 (60.4%)0.996118 (57.3%)21 (87.5%)0.004 *122 (62.2%)17 (50.0%)0.178
With lymph node metastasis91 (39.6%)53 (39.6%)38 (39.6%)88 (42.7%)3 (12.5%)74 (37.8%)17 (50.0%)
PM
Without metastasis219 (95.2%)127 (94.8%)92 (95.8%)0.709195 (94.7%)24 (100%)0.115187 (95.4%)32 (94.1%)0.752
With metastasis11 (4.8%)7 (5.2%)4 (4.2%)11 (5.3%)0 (0%)9 (4.6%)2 (5.9%)
FIGO
I–IIA102 (44.3%)62 (46.3%)40 (41.7%)0.48885 (41.3%)17 (70.8%)0.006 *87 (60.2%)15 (50.0%)0.265
IIB–IV128 (55.7%)55 (53.7%)40 (58.3%)121 (58.7%)7 (29.2%)109 (39.8%)19 (50.0%)
Grade
119 (8.3%)10 (7.8%)9 (9.5%)0.67617 (8.9%)2 (6.1%)0.65313 (6.7%)4 (12.1%)0.243
2129 (56.1%)72 (56.3%)58 (60.0%)112 (58.9%)17 (51.5%)123 (63.1%)12 (36.4%)
375 (32.6%)46 (35.9%)29 (30.5%)61 (32.1%)14 (42.4%)59 (30.3%)17 (51.50%)
NA7 (3.0%)
Subtype
Squamous carcinoma187 (81.3%)95 (70.9%)92 (95.8%)0.001 *171 (83.0%)16 (66.7%)0.091155 (79.1%)32 (94.1%)0.038 *
Adenocarcinoma43 (18.7%)39 (29.1%)4 (4.2%)35 (17.0%)8 (33.3%)41 (20.9%)2 (5.9%)
Progression
No175 (76.1%)99 (75.0%)76 (80.0%)0.377160 (78.8%)15 (62.5%)0.072149 (76.8%)26 (78.8%)0.802
Yes52 (22.6%)33 (25.0%)19 (20.0%)43 (21.2%)9 (37.5%)45 (23.2%)7 (21.2%)
NA3 (1.3%)
Therapeutic Strategy
Surgery96 (41.7%)59 (44.0%)37 (38.5%)0.67579 (38.3%)17 (70.8%)0.007 *83 (42.3%)13 (38.2%)0.494
Preoperative chemoradiotherapy6 (2.6%)3 (2.2%)3 (3.1%)6 (2.9%)0 (0.0%)4 (2.0%)2 (5.9%)
Chemoradiotherapy128 (55.7%)72 (53.7%)56 (58.3%)121 (58.7%)7 (29.2%)109 (55.6%)19 (55.9%)
Survival State
Alive198 (86.1%)114 (85.1%) 84 (87.5%)0.600183 (88.8%)15 (62.5%)0.002 *170 (86.7%)28 (82.4%)0.507
Death32 (13.9%)20 (14.9%)12 (12.5%)23 (11.2%)9 (37.5%)26 (13.3%)6 (17.6%)
NA, not applicable as data not available. * p < 0.05.
Table 2. Pairwise comparison of overall survival rate.
GroupCCL22low FOXP3lowCCL22high FOXP3lowCCL22low FOXP3highCCL22high FOXP3high
X2p-ValueX2p-ValueX2p-ValueX2p-Value
Log Rank (Mantel–Cox)CCL22low FOXP3low5.2500.022 *0.0050.9468.7320.003 *
CCL22high FOXP3low5.2500.022 *2.4660.1160.4690.494
CCL22low FOXP3high0.0050.9462.4660.1165.4860.019 *
CCL22high FOXP3high8.7320.003 *0.4690.4945.4860.019 *
* p < 0.05.
Table 3. Pairwise comparison of progression-free survival.
GroupCCL22low FOXP3lowCCL22high FOXP3lowCCL22low FOXP3highCCL22high FOXP3high
X2p-ValueX2p-ValueX2p-ValueX2p-Value
Log Rank (Mantel–Cox)CCL22low FOXP3low0.5190.4710.4900.4843.3200.068
CCL22high FOXP3low0.5190.4711.4310.2320.3530.552
CCL22low FOXP3high0.4900.4841.4310.2324.0690.044 *
CCL22high FOXP3high3.3200.0680.3530.5524.0690.044 *
* p < 0.05.
Table 4. Pairwise comparison of overall survival rate in different FIGO stages.
GroupCCL22low FOXP3lowCCL22high FOXP3lowCCL22low FOXP3highCCL22high FOXP3high
X2p-ValueX2p-ValueX2p-ValueX2p-Value
I–IIaLog Rank (Mantel–Cox)CCL22low FOXP3low10.5470.001 *0.2630.6086.1070.013 *
CCL22high FOXP3low10.5470.001 *3.1220.0770.0100.920
CCL22low FOXP3high0.2630.6083.1220.0773.0000.083
CCL22high FOXP3high6.1070.013 *0.0100.9203.0000.083
IIb-IVLog Rank (Mantel–Cox)CCL22low FOXP3low2.5750.1090.0130.9114.7610.029 *
CCL22high FOXP3low2.5750.1090.8960.3440.1190.730
CCL22low FOXP3high0.0130.9110.8960.3441.8910.169
CCL22high FOXP3high4.7610.029 *0.1190.7301.8910.169
* p < 0.05.
Table 5. Pairwise comparison of progression-free survival rate in different FIGO stages.
GroupCCL22low FOXP3lowCCL22high FOXP3lowCCL22low FOXP3highCCL22high FOXP3high
X2p-ValueX2p-ValueX2p-ValueX2p-Value
I–IIaLog Rank (Mantel–Cox)CCL22low FOXP3low1.9670.1610.3010.5831.4130.235
CCL22high FOXP3low1.9670.1612.8880.0890.0290.864
CCL22low FOXP3high0.3010.5832.8880.0893.0000.083
CCL22high FOXP3high1.4130.2350.0290.8643.0000.083
IIb–IVLog Rank (Mantel–Cox)CCL22low FOXP3low0.6030.4370.0040.9502.5150.113
CCL22high FOXP3low0.6030.4370.3670.5440.1190.730
CCL22low FOXP3high0.0040.9500.3670.5441.1600.282
CCL22high FOXP3high2.5150.1130.1190.7301.1600.282
Table 6. Pairwise comparison of overall survival rate in different disease subtypes.
GroupCCL22low FOXP3lowCCL22high FOXP3lowCCL22low FOXP3highCCL22high FOXP3high
X2p-ValueX2p-ValueX2p-ValueX2p-Value
Squamous carcinomaLog Rank (Mantel–Cox)CCL22low FOXP3low2.1330.1440.0110.9175.3990.020
CCL22high FOXP3low2.1330.1441.3870.2390.2080.648
CCL22low FOXP3high0.0110.9171.3870.2395.1390.023 *
CCL22high FOXP3high5.3990.020 *0.2080.6485.1390.023
AdenocarcinomaLog Rank (Mantel–Cox)CCL22low FOXP3low1.8020.1791.3630.2434.0930.043 *
CCL22high FOXP3low1.8020.1790.2640.6081.8240.177
CCL22low FOXP3high1.3630.2430.2640.6081.0000.317
CCL22high FOXP3high4.0930.043 *1.8240.1771.0000.317
* p < 0.05.
Table 7. Pairwise comparison of progression-free survival in different disease subtypes.
GroupCCL22low FOXP3lowCCL22high FOXP3lowCCL22low FOXP3highCCL22high FOXP3high
X2p-ValueX2p-ValueX2p-ValueX2p-Value
Squamous carcinomaLog Rank (Mantel–Cox)CCL22low FOXP3low0.0110.9180.7390.3901.3270.249
CCL22high FOXP3low0.0110.9180.6870.4070.2460.620
CCL22low FOXP3high0.7390.3900.6870.4073.4380.064
CCL22high FOXP3high1.3270.2490.2460.6203.4380.064
AdenocarcinomaLog Rank (Mantel–Cox)CCL22low FOXP3low0.7700.3800.7960.3724.1750.041 *
CCL22high FOXP3low0.7700.3800.2640.6081.8240.177
CCL22low FOXP3high0.7960.3720.2640.6081.0000.317
CCL22high FOXP3high4.1750.041 *1.8240.1771.0000.317
* p < 0.05.
Table 8. Univariate and multivariate Cox regression analysis.
Clinicopathological VariablesUnivariate AnalysisMultivariate Analysis
PFSOSPFSOS (model 1)OS (model 2)
Age (≤50 years vs. >50 years)
HR1.3841.804---
95%CI0.804–2.3850.897–3.629---
p0.2410.098---
Tumor Size (≤4 cm vs. >4 cm)
HR3.0634.1882.6525.5645.487
95%CI1.710–5.4861.924–9.1121.063–6.6171.538–20.1301.504–20.011
p0.001 *0.001 *0.037 *0.009 *0.010 *
PN (Without Lymph Node Metastasis vs. Lymph Lode Metastasis)
HR1.8512.3551.5552.6092.547
95%CI1.065–3.2181.162–4.7740.756–3.2001.032–6.5960.988–6.562
p0.029 *0.017 *0.2310.043 *0.053
PM (Without Metastasis vs. Metastasis)
HR1.7103.303---
95%CI0.531–5.5080.999–10.924---
p0.3690.050---
FIGO (I–IIa vs. IIb–IV)
HR2.6302.9131.0880.5840.599
95%CI1.439–4.8081.340–6.3320.360–3.2880.134–2.5360.136–2.633
p0.002 *0.007 *0.8810.4730.498
Grade (I vs. II–III)
HR1.6721.054---
95%CI0.520–5.3750.320–3.472---
p0.3880.931---
Disease Subtype (Squamous Carcinoma vs. Adenocarcinoma)
HR1.9012.8821.9182.8242.830
95%CI1.043–3.4661.408–5.8991.038–3.5451.359–5.8691.361–5.883
p0.036 *0.004 *0.038 *0.005 *0.005 *
Number of CCL22+ cells (CCL22low vs. CCL22high)
HR-3.41-4.985-
95%CI-1.567–7.419-2.206–11.266-
p-0.002 *-0.0001 *-
Number of CCL22+FOXP3+ cells (CCL22lowFOXP3low vs. CCL22highFOXP3high)
HR2.8065.3553.018-5.284
95%CI0.864–9.1151.580–18.1540.923–9.869-1.513–18.456
p0.0860.007 *0.068-0.009 *
* p < 0.05
Table 9. Antibodies used for immunohistochemical characterization and double immunofluorescence of cervical cancer samples.
AntibodyIsotypeCloneDilutionSource
CCL22rabbit IgGpolyclonal1:400 in PBS a
1:400 in Dako b
Perprotech; DAKO(S322); Carpentera, CA, USA
FoxP3mouse IgGmonoklonal1:300 in PBS aAbcam
CD68mouse IgGpolyclonal1:1000 in PBS a
1:1000 in Dako b
Sigma; DAKO(S322); Carpentera, CA, USA
CD163mouse IgGmonoklonal1:800 in PBS a
1:800 in Dako b
Abcam; DAKO(S322); Carpentera, CA, USA
Cy-3 bgoat IgG anti-rabbitpolyclonal1:500 b in Dako bDianova, Hamburg, Germany
Cy-2 bgoat IgG anti-mousepolyclonal1:100 b in Dako bDianova, Hamburg, Germany
a antibodies used for immunohistochemistry, b antibodies used for immunofluorescence.

