Cerebrospinal Fluid MicroRNA Signatures as Diagnostic Biomarkers in Brain Tumors

 , ,
, , 
Abstract
1. Introduction
2. Material and Methods
2.1. Collection of Clinical Samples and CSF Processing and Storage
2.2. RNA Isolation
2.3. Small RNA Sequencing
2.4. cDNA Synthesis and qRT-PCR
2.5. Data Analysis
3. Results
4. Discussion
5. Conclusions
Author Contributions
Funding
Conflicts of Interest
References
- De Robles, P.; Fiest, K.M.; Frolkis, A.D.; Pringsheim, T.; Atta, C.; St Germaine-Smith, C.; Day, L.; Lam, D.; Jette, N. The worldwide incidence and prevalence of primary brain tumors: A systematic review and meta-analysis. Neuro. Oncol. 2015, 17, 776–783. [Google Scholar] [CrossRef] [PubMed]
- Nayak, L.; Lee, E.Q.; Wen, P.Y. Epidemiology of brain metastases. Curr. Oncol. Rep. 2012, 14, 48–54. [Google Scholar] [CrossRef] [PubMed]
- Altieri, R.; Agnoletti, A.; Quattrucci, F.; Garbossa, D.; Calamo Specchia, F.M.; Bozzaro, M.; Fornaro, R.; Mencarani, C.; Lanotte, M.; Spaziante, R.; et al. Molecular biology of gliomas: Present and future challenges. Transl. Med. UniSa 2014, 10, 29–37. [Google Scholar] [PubMed]
- Ostrom, Q.T.; Bauchet, L.; Davis, F.G.; Deltour, I.; Fisher, J.L.; Langer, C.E.; Pekmezci, M.; Schwartzbaum, J.A.; Turner, M.C.; Walsh, K.M.; et al. Response to “the epidemiology of glioma in adults: A ‘state of the science’ review”. Neuro Oncol. 2015, 17, 624–626. [Google Scholar] [CrossRef]
- Sahm, F.; Schrimpf, D.; Stichel, D.; Jones, D.T.W.; Hielscher, T.; Schefzyk, S.; Okonechnikov, K.; Koelsche, C.; Reuss, D.E.; Capper, D.; et al. DNA methylation-based classification and grading system for meningioma: A multicentre, retrospective analysis. Lancet Oncol. 2017, 18, 682–694. [Google Scholar] [CrossRef]
- Sanson, M.; Kalamarides, M. Epigenetics: A new tool for meningioma management? Lancet Oncol. 2017, 18, 569–570. [Google Scholar] [CrossRef]
- Shaikh, N.; Dixit, K.; Raizer, J. Recent advances in managing/understanding meningioma. F1000Research 2018, 7. [Google Scholar] [CrossRef]
- Kamar, F.G.; Posner, J.B. Brain metastases. Semin. Neurol. 2010, 30, 217–235. [Google Scholar] [CrossRef]
- Kopkova, A.; Sana, J.; Fadrus, P.; Slaby, O. Cerebrospinal fluid microRNAs as diagnostic biomarkers in brain tumors. Clin. Chem. Lab. Med. 2018, 56, 869–879. [Google Scholar] [CrossRef]
- Shalaby, T.; Grotzer, M.A. Tumor-Associated CSF MicroRNAs for the Prediction and Evaluation of CNS Malignancies. Int. J. Mol. Sci. 2015, 16, 29103–29119. [Google Scholar] [CrossRef]
- Sana, J.; Hajduch, M.; Michalek, J.; Vyzula, R.; Slaby, O. MicroRNAs and glioblastoma: Roles in core signalling pathways and potential clinical implications. J. Cell. Mol. Med. 2011, 15, 1636–1644. [Google Scholar] [CrossRef] [PubMed]
- Weber, J.A.; Baxter, D.H.; Zhang, S.; Huang, D.Y.; Huang, K.H.; Lee, M.J.; Galas, D.J.; Wang, K. The microRNA spectrum in 12 body fluids. Clin. Chem. 2010, 56, 1733–1741. [Google Scholar] [CrossRef] [PubMed]
- Baraniskin, A.; Kuhnhenn, J.; Schlegel, U.; Maghnouj, A.; Zollner, H.; Schmiegel, W.; Hahn, S.; Schroers, R. Identification of microRNAs in the cerebrospinal fluid as biomarker for the diagnosis of glioma. Neuro Oncol. 2012, 14, 29–33. [Google Scholar] [CrossRef] [PubMed]
- Teplyuk, N.M.; Mollenhauer, B.; Gabriely, G.; Giese, A.; Kim, E.; Smolsky, M.; Kim, R.Y.; Saria, M.G.; Pastorino, S.; Kesari, S.; et al. MicroRNAs in cerebrospinal fluid identify glioblastoma and metastatic brain cancers and reflect disease activity. Neuro Oncol. 2012, 14, 689–700. [Google Scholar] [CrossRef]
- Drusco, A.; Bottoni, A.; Lagana, A.; Acunzo, M.; Fassan, M.; Cascione, L.; Antenucci, A.; Kumchala, P.; Vicentini, C.; Gardiman, M.P.; et al. A differentially expressed set of microRNAs in cerebro-spinal fluid (CSF) can diagnose CNS malignancies. Oncotarget 2015, 6, 20829–20839. [Google Scholar] [CrossRef]
- Croce, C.M. Causes and consequences of microRNA dysregulation in cancer. Nat. Rev. Genet. 2009, 10, 704–714. [Google Scholar] [CrossRef]
- Mishra, P.J. MicroRNAs as promising biomarkers in cancer diagnostics. Biomark. Res. 2014, 2, 19. [Google Scholar] [CrossRef]
- Qu, K.; Lin, T.; Pang, Q.; Liu, T.; Wang, Z.; Tai, M.; Meng, F.; Zhang, J.; Wan, Y.; Mao, P.; et al. Extracellular mirna-21 as a novel biomarker in glioma: Evidence from meta-analysis, clinical validation and experimental investigations. Oncotarget 2016, 7, 33994–34010. [Google Scholar] [CrossRef]
- Regazzo, G.; Terrenato, I.; Spagnuolo, M.; Carosi, M.; Cognetti, G.; Cicchillitti, L.; Sperati, F.; Villani, V.; Carapella, C.; Piaggio, G.; et al. A restricted signature of serum mirnas distinguishes glioblastoma from lower grade gliomas. J. Exp. Clin. Cancer Res. 2016, 35, 124. [Google Scholar] [CrossRef]
- Guan, Y.; Mizoguchi, M.; Yoshimoto, K.; Hata, N.; Shono, T.; Suzuki, S.O.; Araki, Y.; Kuga, D.; Nakamizo, A.; Amano, T.; et al. Mirna-196 is upregulated in glioblastoma but not in anaplastic astrocytoma and has prognostic significance. Clin. Cancer Res. 2010, 16, 4289–4297. [Google Scholar] [CrossRef]
- Guan, Y.; Chen, L.; Bao, Y.; Qiu, B.; Pang, C.; Cui, R.; Wang, Y. High mir-196a and low mir-367 cooperatively correlate with unfavorable prognosis of high-grade glioma. Int. J. Clin. Exp. Pathol. 2015, 8, 6576–6588. [Google Scholar] [PubMed]
- Yan, W.; Li, R.; Liu, Y.; Yang, P.; Wang, Z.; Zhang, C.; Bao, Z.; Zhang, W.; You, Y.; Jiang, T. Microrna expression patterns in the malignant progression of gliomas and a 5-microrna signature for prognosis. Oncotarget 2014, 5, 12908–12915. [Google Scholar] [CrossRef] [PubMed]
- Visani, M.; de Biase, D.; Marucci, G.; Cerasoli, S.; Nigrisoli, E.; Bacchi Reggiani, M.L.; Albani, F.; Baruzzi, A.; Pession, A. Expression of 19 micrornas in glioblastoma and comparison with other brain neoplasia of grades i-iii. Mol. Oncol. 2014, 8, 417–430. [Google Scholar] [CrossRef] [PubMed]
- Zhang, W.; Zhao, W.; Ge, C.; Li, X.; Yang, X.; Xiang, Y.; Sun, Z. Decreased let-7b is associated with poor prognosis in glioma. Medicine 2019, 98, e15784. [Google Scholar] [CrossRef] [PubMed]
- Malzkorn, B.; Wolter, M.; Liesenberg, F.; Grzendowski, M.; Stuhler, K.; Meyer, H.E.; Reifenberger, G. Identification and functional characterization of micrornas involved in the malignant progression of gliomas. Brain Pathol. 2010, 20, 539–550. [Google Scholar] [CrossRef] [PubMed]
- Kopkova, A.; Sana, J.; Fadrus, P.; Machackova, T.; Vecera, M.; Vybihal, V.; Juracek, J.; Vychytilova-Faltejskova, P.; Smrcka, M.; Slaby, O. MicroRNA isolation and quantification in cerebrospinal fluid: A comparative methodical study. PLoS ONE 2018, 13, e0208580. [Google Scholar] [CrossRef]


| Group | Discovery Cohort | Validation Cohort |
|---|---|---|
| N = 89 | N = 126 | |
| controls (hydrocephalus) | 19 | 21 |
| glioblastoma | 32 | 41 |
| low-grade glioma | 14 | 8 |
| meningiomas | 11 | 44 |
| brain metastasis | 13 | 12 |
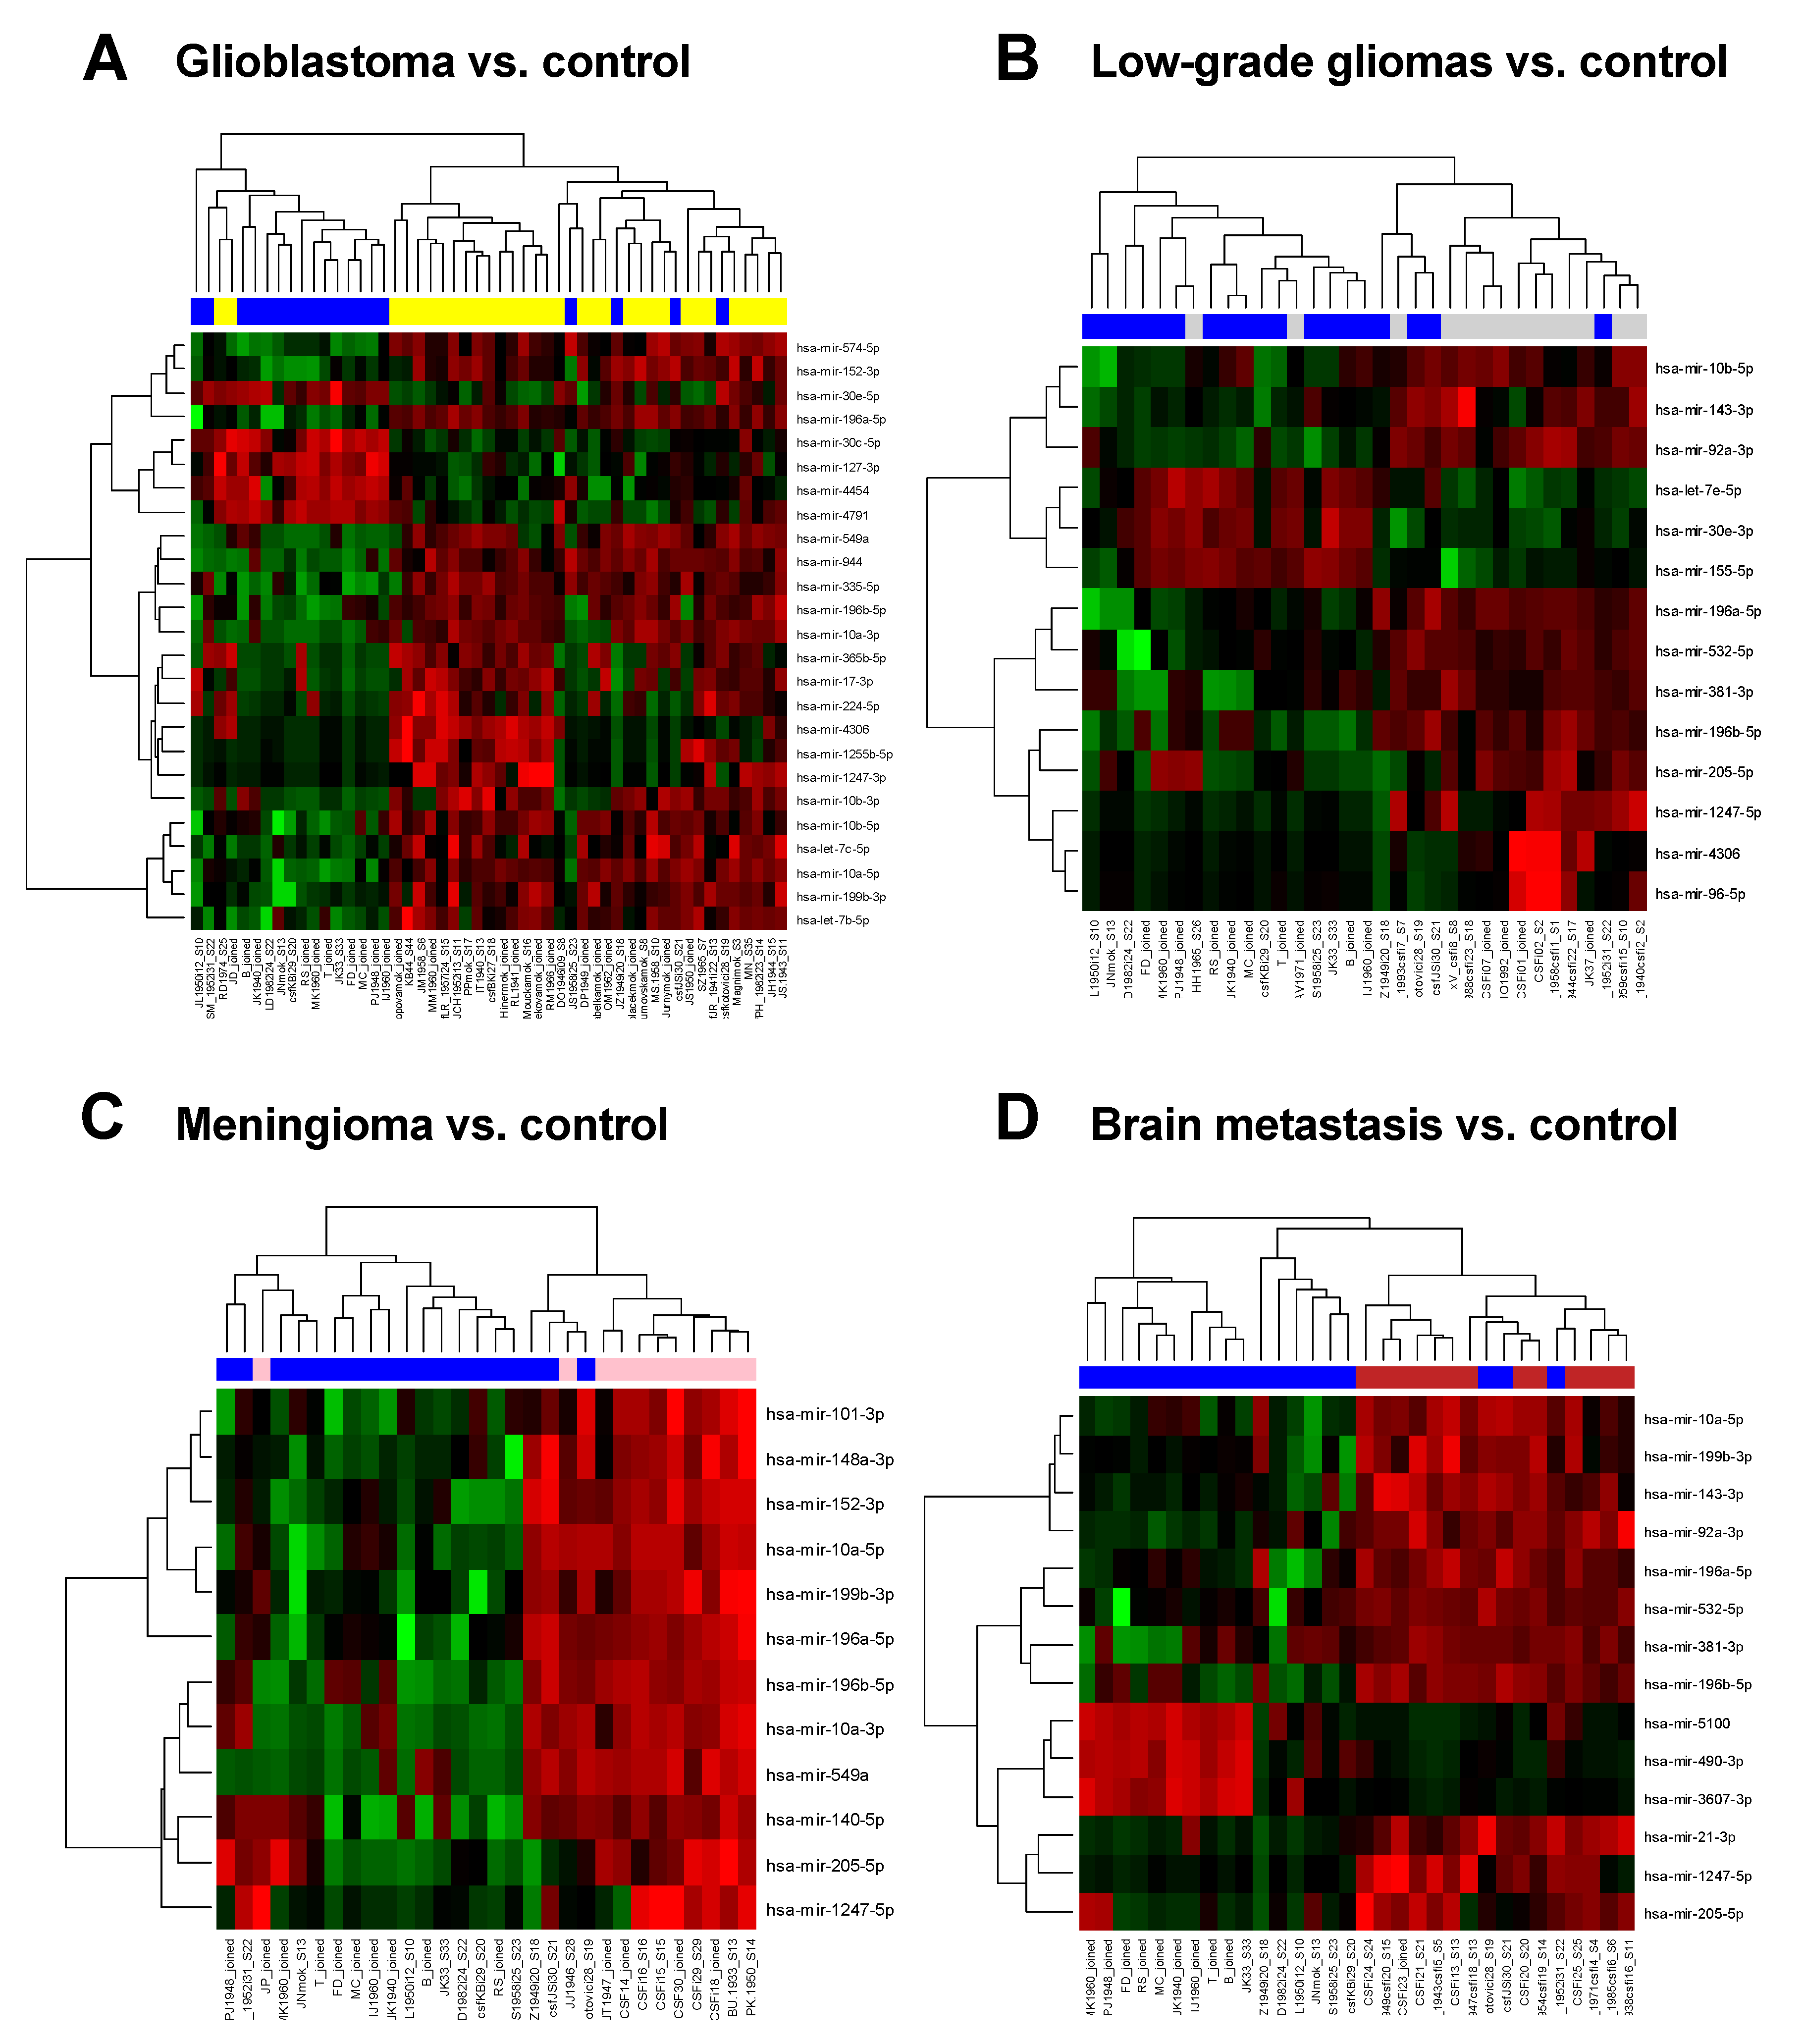
| Genes | logFC | Average Expression | p-Value | Adjusted p-Value |
|---|---|---|---|---|
| miR-196a-5p | 4.22 | 9.76 | <0.00001 | <0.00001 |
| miR-4306 | 3.99 | 1.75 | <0.00001 | <0.00001 |
| miR-10a-5p | 2.64 | 14.78 | <0.00001 | <0.00001 |
| miR-4791 | −4.01 | 3.37 | <0.00001 | <0.00001 |
| miR-30c-5p | −2.20 | 7.87 | <0.00001 | <0.00001 |
| miR-1255b-5p | 3.18 | 1.41 | <0.00001 | <0.00001 |
| miR-30e-5p | −1.21 | 10.67 | <0.00001 | <0.00001 |
| miR-549a | 4.06 | 3.71 | <0.00001 | <0.00001 |
| miR-10b-5p | 2.21 | 16.15 | <0.00001 | <0.00001 |
| miR-196b-5p | 3.76 | 5.32 | <0.00001 | <0.00001 |
| miR-199b-3p | 1.53 | 14.09 | <0.00001 | <0.00001 |
| miR-127-3p | −1.79 | 7.98 | <0.00001 | 0.00027 |
| let-7b-5p | 1.13 | 17.84 | <0.00001 | 0.00011 |
| miR-574-5p | 1.45 | 10.21 | <0.00001 | 0.00027 |
| miR-152-3p | 1.39 | 10.42 | <0.00001 | 0.00027 |
| miR-1247-3p | 2.43 | 0.43 | <0.00001 | 0.00033 |
| miR-944 | 3.55 | 3.33 | <0.00001 | 0.00033 |
| let-7c-5p | 1.22 | 15.75 | <0.00001 | 0.00022 |
| miR-224-5p | 3.05 | 2.21 | <0.00001 | 0.00039 |
| miR-4454 | −3.39 | 5.10 | <0.00001 | 0.00039 |
| miR-335-5p | 3.38 | 4.92 | <0.00001 | 0.00039 |
| miR-17-3p | 2.84 | 2.29 | <0.00001 | 0.00039 |
| miR-365b-5p | 2.96 | 1.62 | <0.00001 | 0.00059 |
| miR-10b-3p | 3.10 | 2.45 | <0.00001 | 0.00072 |
| miR-10a-3p | 3.71 | 4.25 | <0.00001 | 0.00078 |
| miR-140-5p | 1.89 | 4.77 | 0.01080 | 0.05594 |
| miR-21-3p | 1.14 | 1.97 | 0.11732 | 0.27104 |
| Genes | logFC | Average Expression | p-Value | Adjusted p-Value |
|---|---|---|---|---|
| miR-381-3p | 3.37 | 5.97 | 0.00000 | 0.00334 |
| miR-205-5p | 4.31 | 4.29 | 0.00011 | 0.03741 |
| miR-92a-3p | 1.88 | 13.27 | 0.00013 | 0.03741 |
| miR-532-5p | 2.28 | 8.05 | 0.00031 | 0.05360 |
| miR-1247-5p | 2.72 | 1.55 | 0.00032 | 0.05360 |
| miR-155-5p | −2.15 | 8.63 | 0.00049 | 0.06435 |
| miR-196a-5p | 2.45 | 9.76 | 0.00054 | 0.06435 |
| miR-196b-5p | 2.94 | 5.32 | 0.00087 | 0.07357 |
| miR-96-5p | 1.79 | −0.24 | 0.00148 | 0.09360 |
| miR-4306 | 2.55 | 1.75 | 0.00157 | 0.09360 |
| miR-30e-3p | −1.36 | 10.03 | 0.00139 | 0.09360 |
| miR-143-3p | 1.27 | 14.69 | 0.00088 | 0.07357 |
| hsa-let-7e-5p | −0.87 | 11.75 | 0.00143 | 0.09360 |
| miR-10b-5p | 1.58 | 16.15 | 0.00088 | 0.07357 |
| let-7b-5p | 0.25 | 17.84 | 0.36461 | 0.77936 |
| let-7c-5p | −0.06 | 15.75 | 0.86022 | 0.95823 |
| miR-10a-5p | 1.46 | 14.78 | 0.00520 | 0.14588 |
| miR-140-5p | 2.24 | 4.77 | 0.00914 | 0.20606 |
| miR-21-3p | 1.00 | 1.97 | 0.27474 | 0.73439 |
| Genes | logFC | Average Expression | p-Value | Adjusted p-Value |
|---|---|---|---|---|
| miR-196a-5p | 4.01 | 9.76 | <0.00001 | 0.00001 |
| miR-10a-5p | 2.82 | 14.78 | <0.00001 | 0.00003 |
| miR-549a | 4.69 | 3.71 | <0.00001 | 0.00059 |
| miR-196b-5p | 4.06 | 5.32 | <0.00001 | 0.00103 |
| miR-199b-3p | 1.65 | 14.09 | 0.00001 | 0.00109 |
| miR-101-3p | 1.56 | 11.93 | 0.00001 | 0.00118 |
| miR-152-3p | 1.62 | 10.42 | 0.00001 | 0.00137 |
| miR-10a-3p | 4.37 | 4.25 | 0.00003 | 0.00315 |
| miR-148a-3p | 1.70 | 11.92 | 0.00005 | 0.00489 |
| miR-140-5p | 3.39 | 4.77 | 0.00008 | 0.00695 |
| miR-1247-5p | 3.26 | 1.55 | 0.00011 | 0.00841 |
| miR-205-5p | 4.45 | 4.29 | 0.00014 | 0.00953 |
| miR-10b-5p | 1.77 | 16.15 | 0.00039 | 0.01893 |
| let-7b-5p | 0.69 | 17.84 | 0.01600 | 0.13214 |
| let-7c-5p | 0.83 | 15.57 | 0.00830 | 0.09333 |
| miR-30e-5p | −0.05 | 10.67 | 0.84957 | 0.95825 |
| miR-21-3p | 0.75 | 1.97 | 0.44158 | 0.76889 |
| Genes | logFC | Average Expression | p-Value | Adjusted p-Value |
|---|---|---|---|---|
| miR-5100 | −5.28 | 2.33 | <0.00001 | 0.00011 |
| miR-92a-3p | 2.50 | 13.27 | <0.00001 | 0.00011 |
| miR-143-3p | 1.86 | 14.69 | <0.00001 | 0.00023 |
| miR-196a-5p | 3.34 | 9.76 | <0.00001 | 0.00033 |
| miR-196b-5p | 4.08 | 5.32 | <0.00001 | 0.00033 |
| miR-490-3p | −4.82 | 1.37 | <0.00001 | 0.00036 |
| miR-1247-5p | 3.70 | 1.55 | <0.00001 | 0.00036 |
| miR-199b-3p | 1.67 | 14.09 | <0.00001 | 0.00036 |
| miR-21-3p | 4.22 | 1.97 | 0.00001 | 0.00062 |
| miR-3607-3p | −4.21 | 0.79 | 0.00001 | 0.00067 |
| miR-205-5p | 4.87 | 4.29 | 0.00001 | 0.00067 |
| miR-532-5p | 2.77 | 8.05 | 0.00001 | 0.00067 |
| miR-381-3p | 3.24 | 5.97 | 0.00001 | 0.00067 |
| miR-10a-5p | 2.28 | 14.78 | 0.00001 | 0.00067 |
| miR-10b-5p | 1.72 | 16.15 | 0.00041 | 0.00919 |
| let-7b-5p | 0.43 | 17.84 | 0.11602 | 0.38548 |
| let-7c-5p | 0.39 | 15.75 | 0.21442 | 0.51985 |
| miR-140-5p | 2.60 | 4.77 | 0.00247 | 0.03024 |
| miR-30e-5p | −0.47 | 10.67 | 0.08626 | 0.32384 |
© 2019 by the authors. Licensee MDPI, Basel, Switzerland. This article is an open access article distributed under the terms and conditions of the Creative Commons Attribution (CC BY) license (http://creativecommons.org/licenses/by/4.0/).
Share and Cite
Kopkova, A.; Sana, J.; Machackova, T.; Vecera, M.; Radova, L.; Trachtova, K.; Vybihal, V.; Smrcka, M.; Kazda, T.; Slaby, O.; et al. Cerebrospinal Fluid MicroRNA Signatures as Diagnostic Biomarkers in Brain Tumors. Cancers 2019, 11, 1546. https://doi.org/10.3390/cancers11101546
Kopkova A, Sana J, Machackova T, Vecera M, Radova L, Trachtova K, Vybihal V, Smrcka M, Kazda T, Slaby O, et al. Cerebrospinal Fluid MicroRNA Signatures as Diagnostic Biomarkers in Brain Tumors. Cancers. 2019; 11(10):1546. https://doi.org/10.3390/cancers11101546
Chicago/Turabian StyleKopkova, Alena, Jiri Sana, Tana Machackova, Marek Vecera, Lenka Radova, Karolina Trachtova, Vaclav Vybihal, Martin Smrcka, Tomas Kazda, Ondrej Slaby, and et al. 2019. "Cerebrospinal Fluid MicroRNA Signatures as Diagnostic Biomarkers in Brain Tumors" Cancers 11, no. 10: 1546. https://doi.org/10.3390/cancers11101546
APA StyleKopkova, A., Sana, J., Machackova, T., Vecera, M., Radova, L., Trachtova, K., Vybihal, V., Smrcka, M., Kazda, T., Slaby, O., & Fadrus, P. (2019). Cerebrospinal Fluid MicroRNA Signatures as Diagnostic Biomarkers in Brain Tumors. Cancers, 11(10), 1546. https://doi.org/10.3390/cancers11101546