Article

Expression of Neural Crest Markers GLDC and ERRFI1 is Correlated with Melanoma Prognosis

1
Skin Cancer Unit, German Cancer Research Center (DKFZ), D-69121 Heidelberg, Germany
2
Department of Dermatology, Venereology and Allergology, University Medical Center Mannheim, Ruprecht-Karl University of Heidelberg, 68167 Mannheim, Germany
3
Department of Clinical Pharmacology, Central South University, Changsha 410083, China
4
Institute for Medical Statistics, Medical Faculty Mannheim, Ruprecht-Karl University of Heidelberg, 68167 Mannheim, Germany
5
Department of Dermatology and Venereology, University Hospital Hamburg-Eppendorf (UKE), 20246 Hamburg, Germany
*
Author to whom correspondence should be addressed.
These authors contributed equally to this work.
Cancers 2019, 11(1), 76; https://doi.org/10.3390/cancers11010076
Submission received: 21 November 2018 / Revised: 14 December 2018 / Accepted: 14 December 2018 / Published: 11 January 2019
(This article belongs to the Collection Drug Resistance and Novel Therapies in Cancers)

Abstract

:
Regulation of particular genes during the formation of neural crest (NC) cells is also described during progression of malignant melanoma. In this context, it is of paramount importance to develop neural crest models allowing the identification of candidate genes, which could be used as biomarkers for melanoma prognosis. Here, we used a human induced Pluripotent Stem Cells (iPSC)-based approach to present novel NC-associated genes, expression of which was upregulated in melanoma. A list of 8 candidate genes, based on highest upregulation, was tested for prognostic value in a tissue microarray analysis containing samples from advanced melanoma (good versus bad prognosis) as well as from high-risk primary melanomas (early metastasizing versus non or late-metastasizing). CD271, GLDC, and ERRFI1 showed significantly higher expression in metastatic patients who died early than the ones who survived at least 30 months. In addition, GLDC and TWIST showed a significantly higher immunohistochemistry (IHC) score in primary melanomas from patients who developed metastases within 12 months versus those who did not develop metastases in 30 months. In conclusion, our iPSC-based study reveals a significant association of NC marker GLDC protein expression with melanoma prognosis.

1. Introduction

Malignant melanoma is a malignant tumor originating from the melanocytic cell system. Due to the tendency for metastasis, melanoma is a very aggressive skin cancer showing a high mortality index in advanced stages [1]. Melanocytes are pigment-producing cells of the skin originating from neural crest cells (NC cells). During embryonic development, pluripotent stem cells differentiate into multipotent NC cells, which can further differentiate into melanoblasts and finally mature into melanocytes [2]. Recent studies suggest a regain of NC properties in malignant melanoma cells, which are able to sustain the tumor growth and promote metastasis [3,4,5]. It is therefore important to get a better understanding of the NC-associated genes and their associated function in melanoma pathogenesis.
Tumor thickness, ulceration, and metastasis in regional lymph nodes are major risk factors in melanoma patients and are used as prognostic markers [6]. Unfortunately, these markers often do not predict accurately the patient’s outcome. In order to predict the prognosis more precisely, a better understanding of melanoma genesis and its marker and mechanisms is needed. By using gene expression profiling approaches, we first display in this current article a number of genes which are not only expressed in NC cells but also overly expressed in melanoma and investigated their ability to state a prognosis for clinical daily use. Additionally, CD271 and Ki67 were investigated regarding the patients’ prognosis. CD271 is a known NC cell marker, which seems to play an important role in invasion and migration processes of melanoma [3]. As a known proliferation marker, Ki67 can be used as a predictive and prognostic marker in tumor tissue [7].

2. Results

2.1. Detection of Novel Neural Crest Cell-Associated Markers in Melanoma Cells

Many investigations have now shown a reactivation of the embryonic neural crest (NC) signaling pathways during melanomagenesis and during tumor progression to metastasis. The tumor heterogeneity could be described by the presence in the tumor of different clonal subpopulations of cells characteristic of which is to present an undifferentiated and highly invasive phenotype [8]. For example, NC-related gene TWIST1 is highly expressed in metastatic melanoma [9] and expression of MSX1 in melanocytes induced a dedifferentiated phenotype [10].
Our aim was therefore to identify new candidate genes, expression of which was upregulated both in NC cells and in melanoma cells (compared to normal melanocytes). For this purpose, we were able to differentiate human induced Pluripotent Stem Cells (hiPSCs) into NC cells according to a protocol we have set up in the laboratory [11]. The transcriptome profile of these NC cells was compared to that of parental hiPSCs and top upregulated genes were selected. We also compared the transcriptome profile of melanoma cell lines to normal human melanocytes (NHM) and selected top regulated genes.
We focused on a list of 8 candidate genes including two genes known to be expressed in NC (TWIST1 and MSX1) and six new genes (TNFRSF12A, GLDC, ERRFI, IGFBP2, PTPRF) (Figure 1A). Compared to the average expression value of 3 independent NHM samples, the expression values of all candidate genes from the transcriptome analysis were significantly upregulated in NC and in melanoma cells (log2-fold change > 1) (Figure 1B). As a confirmation of the microarray data, we analyzed the candidate gene’s expression by qPCR and observed a significant increase in six melanoma cell lines as well as in the NC cells when compared to NHM (Figure 1C). Because of the high variation in expression between cell lines, some genes showed high upregulation (TWIST1, TNFRSF21, GLDC, and PTPRF, left panel) and some others showed lower upregulation (IGFBP2, TNFRSF12A, MSX1, and ERFFI, right panel).

2.2. High CD271, GLDC, and ERRFI1 Protein Expression is Associated with Reduced Survival in Stage IV Melanoma Patients

Tumor samples from patients who died within 12 months (survival group A) were compared to tumor samples from patients who survived at least 30 months (survival group B) after distant metastasis. Samples from survival group A showed a significantly higher mean overall immunohistochemistry (IHC) score for Anti-CD271, Anti-GLDC, and Anti-ERRFI1 (p-value < 0.05) (Figure 2). In survival group A, the mean overall IHC for Anti-CD271 was 8.81 compared to 5.57 in survival group B, p-value = 0.01. Anti-GLDC showed an overall IHC score of 8.76 for survival group A vs. 6.85 in survival group B, p-value = 0.05. For the antibody against ERRFI1, the mean overall IHC score was 10.57 in survival group A and 6.69 in survival group B, p-value < 0.001.
Samples from survival group A showed a higher mean overall IHC score for Anti-MSX1, Anti-TWIST, Anti-Ki67, Anti-PTPRF, Anti-TNFRSF21, and Anti-TNFRSF12a but without significance (Figure S1). Anti-MSX1 showed in survival group A a mean overall IHC score of 9.83 and 7.79 in survival group B, p-value = 0.07. In survival group A, the mean overall IHC score for Anti-TWIST was 9.41 and 8.31 in survival group B, p-value = 0.29. The mean overall IHC score of Ki67 was 10.14 in survival group A and 8.58 in survival group B. In survival group A, the mean overall IHC score of Anti-PTPRF was 7.49 vs. 6.19 in survival group B, p-value = 0.28. Anti-TNFRSF21 showed a mean overall IHC score of 9.03 in survival group A and 8 in survival group B, p-value = 0.41. In survival group A, the mean overall IHC score of Anti-TNFRSF12a was 9.31 versus 8.07, p-value = 0.3. Anti-IGFBP2 showed in survival group A a mean overall IHC score of 5.07 versus 5.19 in survival group B, p-value = 0.91 (Table 1 and Table 2).
According to our study, antibodies against CD271, GLDC, and ERRFI1 could be used as a tool to predict prognosis of overall survival at stage IV disease of malignant melanoma. Malignant melanoma patients with tumor samples with an IHC score > 8 for Anti-CD271, >8 for Anti-GLDC, and >9 for Anti-ERRFI1 are more likely to die early and therefore show a poorer prognosis after diagnosis stage IV in comparison with patients with smaller IHC scores for the described antibodies.

2.3. High TWIST and GLDC Protein Expression are Associated with Metastasis Development in High-Risk Primary Melanomas

Tumor samples of primary melanoma from patients who were at high risk to metastasize (primary lesion ≥ 2 mm) were compared regarding the time until metastasis occurred. In high-risk group A, patients were included who metastasized in 12 months. Patients who did not metastasize in 30 months or longer were included in the second group (high-risk group B). Due to low sample number (n = 7), we assumed a non-normal distribution in high-risk group B. Samples from high-risk group A showed a significantly higher mean overall IHC score for Anti-TWIST and Anti-GLDC in comparison to high-risk group B (Figure 3). The mean overall IHC score for anti-TWIST was 9.76 in high-risk group A, compared to 7.55 in high-risk group B, p-value = 0.04. Anti-GLDC showed a mean overall IHC score of 9.76 in high-risk group A versus 6.14 in high-risk group B, p-value = 0.007.
Tumor samples from high-risk group A showed a higher mean overall IHC score for Anti-MSX1, Anti-CD271, Anti-ERRFI1, Anti-PTPRF, Anti-TNFRSF21, Anti-TNFRSF12a, and Anti-IGFBP2, but without significance (Figure S2). The mean overall IHC score for Anti-MSX1 was 9.56 in high-risk group A and 8.75.
In high-risk group B, p-value = 0.5. Anti-CD271 showed a mean overall IHC score of 8.79 in high-risk group A vs. 7.67 in high-risk group B, p-value = 0.37. The mean overall IHC score in high-risk group A was 9.23 and 7.28 in high-risk group B for Anti-ERRFI1, p-value = 0.35. For Anti-Ki67, the mean in high-risk group A was 7.47 versus 8.80 in high-risk group B. Anti-PTPRF showed a mean overall IHC score of 7.71 in high-risk group A vs. 7.12 in high-risk group B, p-value = 0.67, and 9.89 was the mean overall IHC score in high-risk group A and 8.63 in high-risk group B for Anti-TNFRSF21, p-value = 0.21. For Anti-TNFRSF12a, the mean overall IHC score was 10.33 in high-risk group A versus 9.38 in high-risk group B, p-value = 0.25. In high-risk group A, the mean overall IHC score was 13.53 versus 8.5 for Anti-IGFBP2 (Table 3 and Table 4).

3. Discussion

Next to tumor thickness and ulceration of primary melanoma, the extent of regional and distant metastasis only lactate dehydrogenase (LDH) is used as a prognostic marker in the TMN classification system of the American Joint Committee on Cancer (AJCC) 2017. However, these markers are used for staging and often do not predict accurately the patient’s outcome. LDH is only used as a prognostic marker in clinic when distant metastasis already occurred [12]. Additionally, LDH is not specific for malignancy as it is also elevated in cases of cell damage, inflammatory processes, and hemolysis [13]. In our study, we show that genes that are highly expressed not only in neural crest cells but also in malignant melanoma cells are associated with prognosis. Upregulation of CD271, ERRFI1, and GLDC is in line with a bad prognosis. Additionally, upregulation of TWIST and GLDC is associated with early metastasis and therefore can be used as prognostic markers before metastasis occurred.
The role of CD271 in tumor transformation and progression has been widely investigated. It has also been suggested as a marker of cancer stem cell-like population in human melanoma tissues [3]. The results of these studies are, however, not always on the same line. CD271 has been described as a dual mediator by suppressing melanoma cell proliferation and promoting metastasis while highly expressed in malignant melanoma cells [14]. Furthermore, CD271 was identified as a T cell-suppressive molecule and, therefore, might be interesting for antimelanoma immunotherapy [15]. However, a study based on xenograft transplantations derived from 7 melanoma patients showed variable expression level of CD271 after propagation of the same tumor into different mice. In addition, no correlation was found between the expression of CD271 and the tumorigenicity of the samples [16,
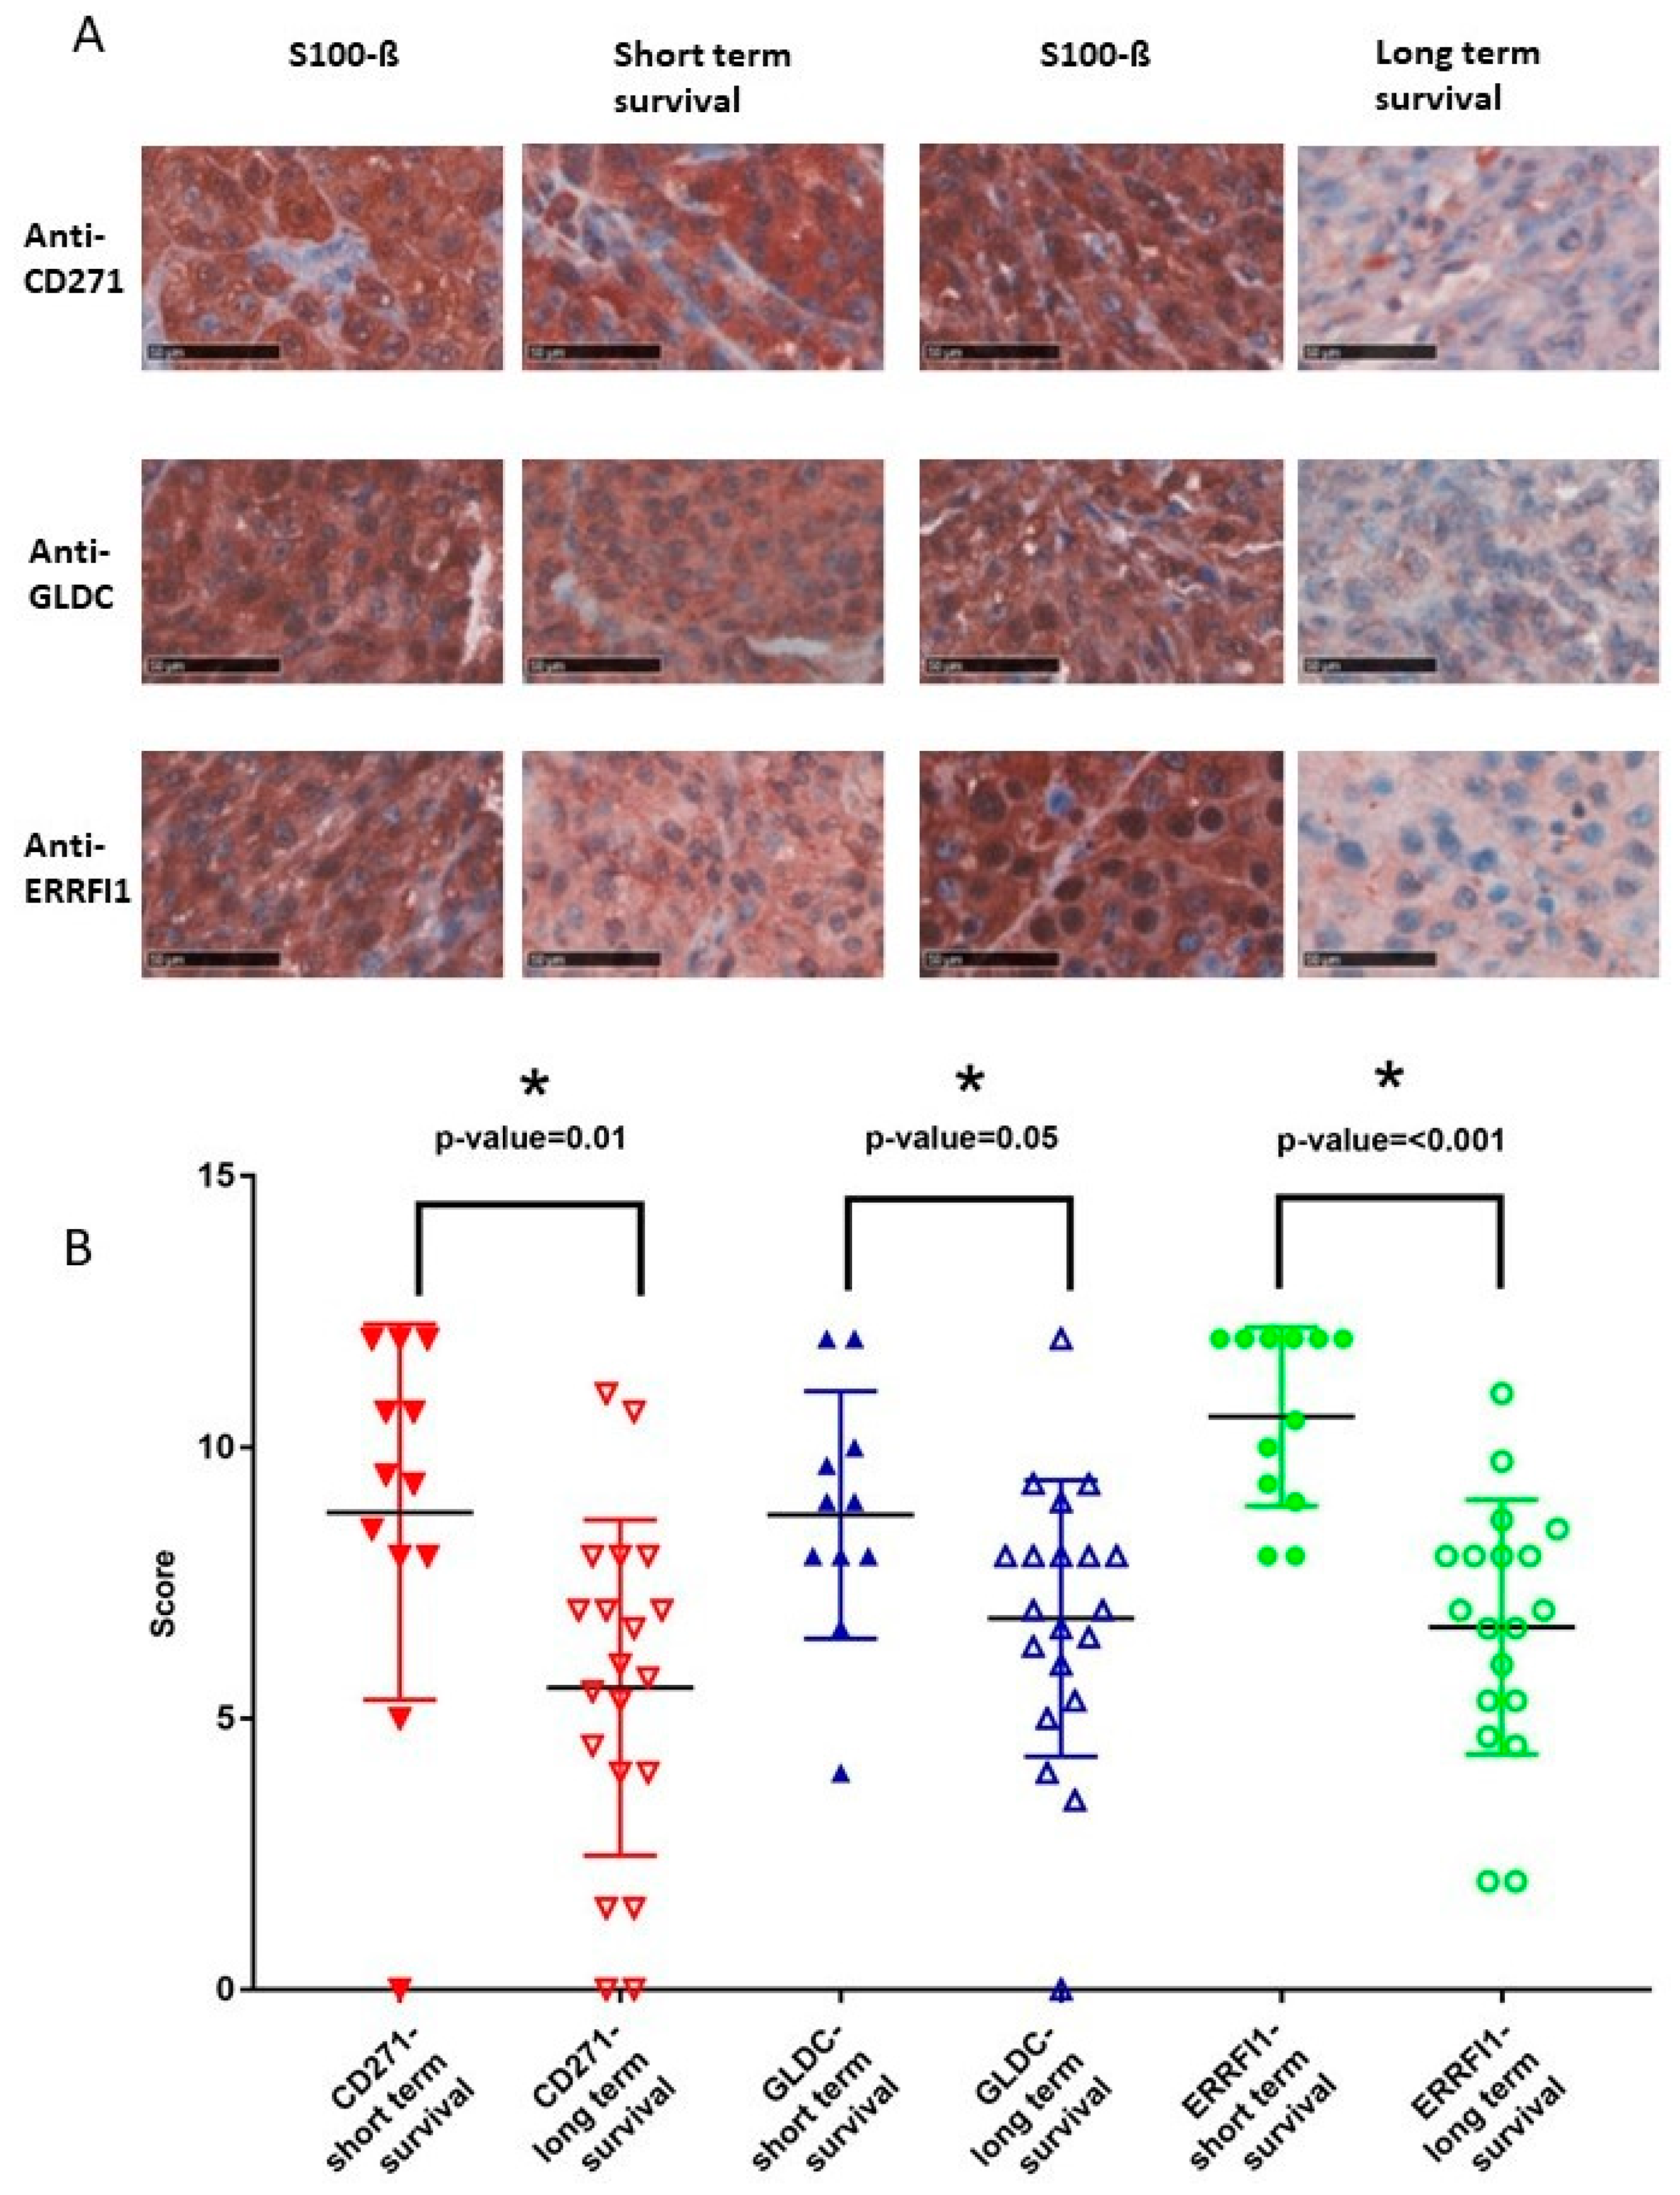
17]. Our results show that a higher expression of CD271 is associated with a poor prognosis. The cut-off point for Anti-CD271 was 8 overall IHC score. For patients with an overall IHC score > 8 there is a 12 times greater risk to belong in survival group A and, therefore, to die earlier. The validity of this model is 80%. Because this marker is not commonly accepted, these data have to be taken with caution.
As part of a multienzyme complex, glycine decarboxylase (GLDC) is involved in the biosynthesis of serine. It has been shown that GLDC is a metabolic oncogene and its expression is strongly correlated with rates of cancer proliferation and greater mortality, e.g., in breast cancer [18,
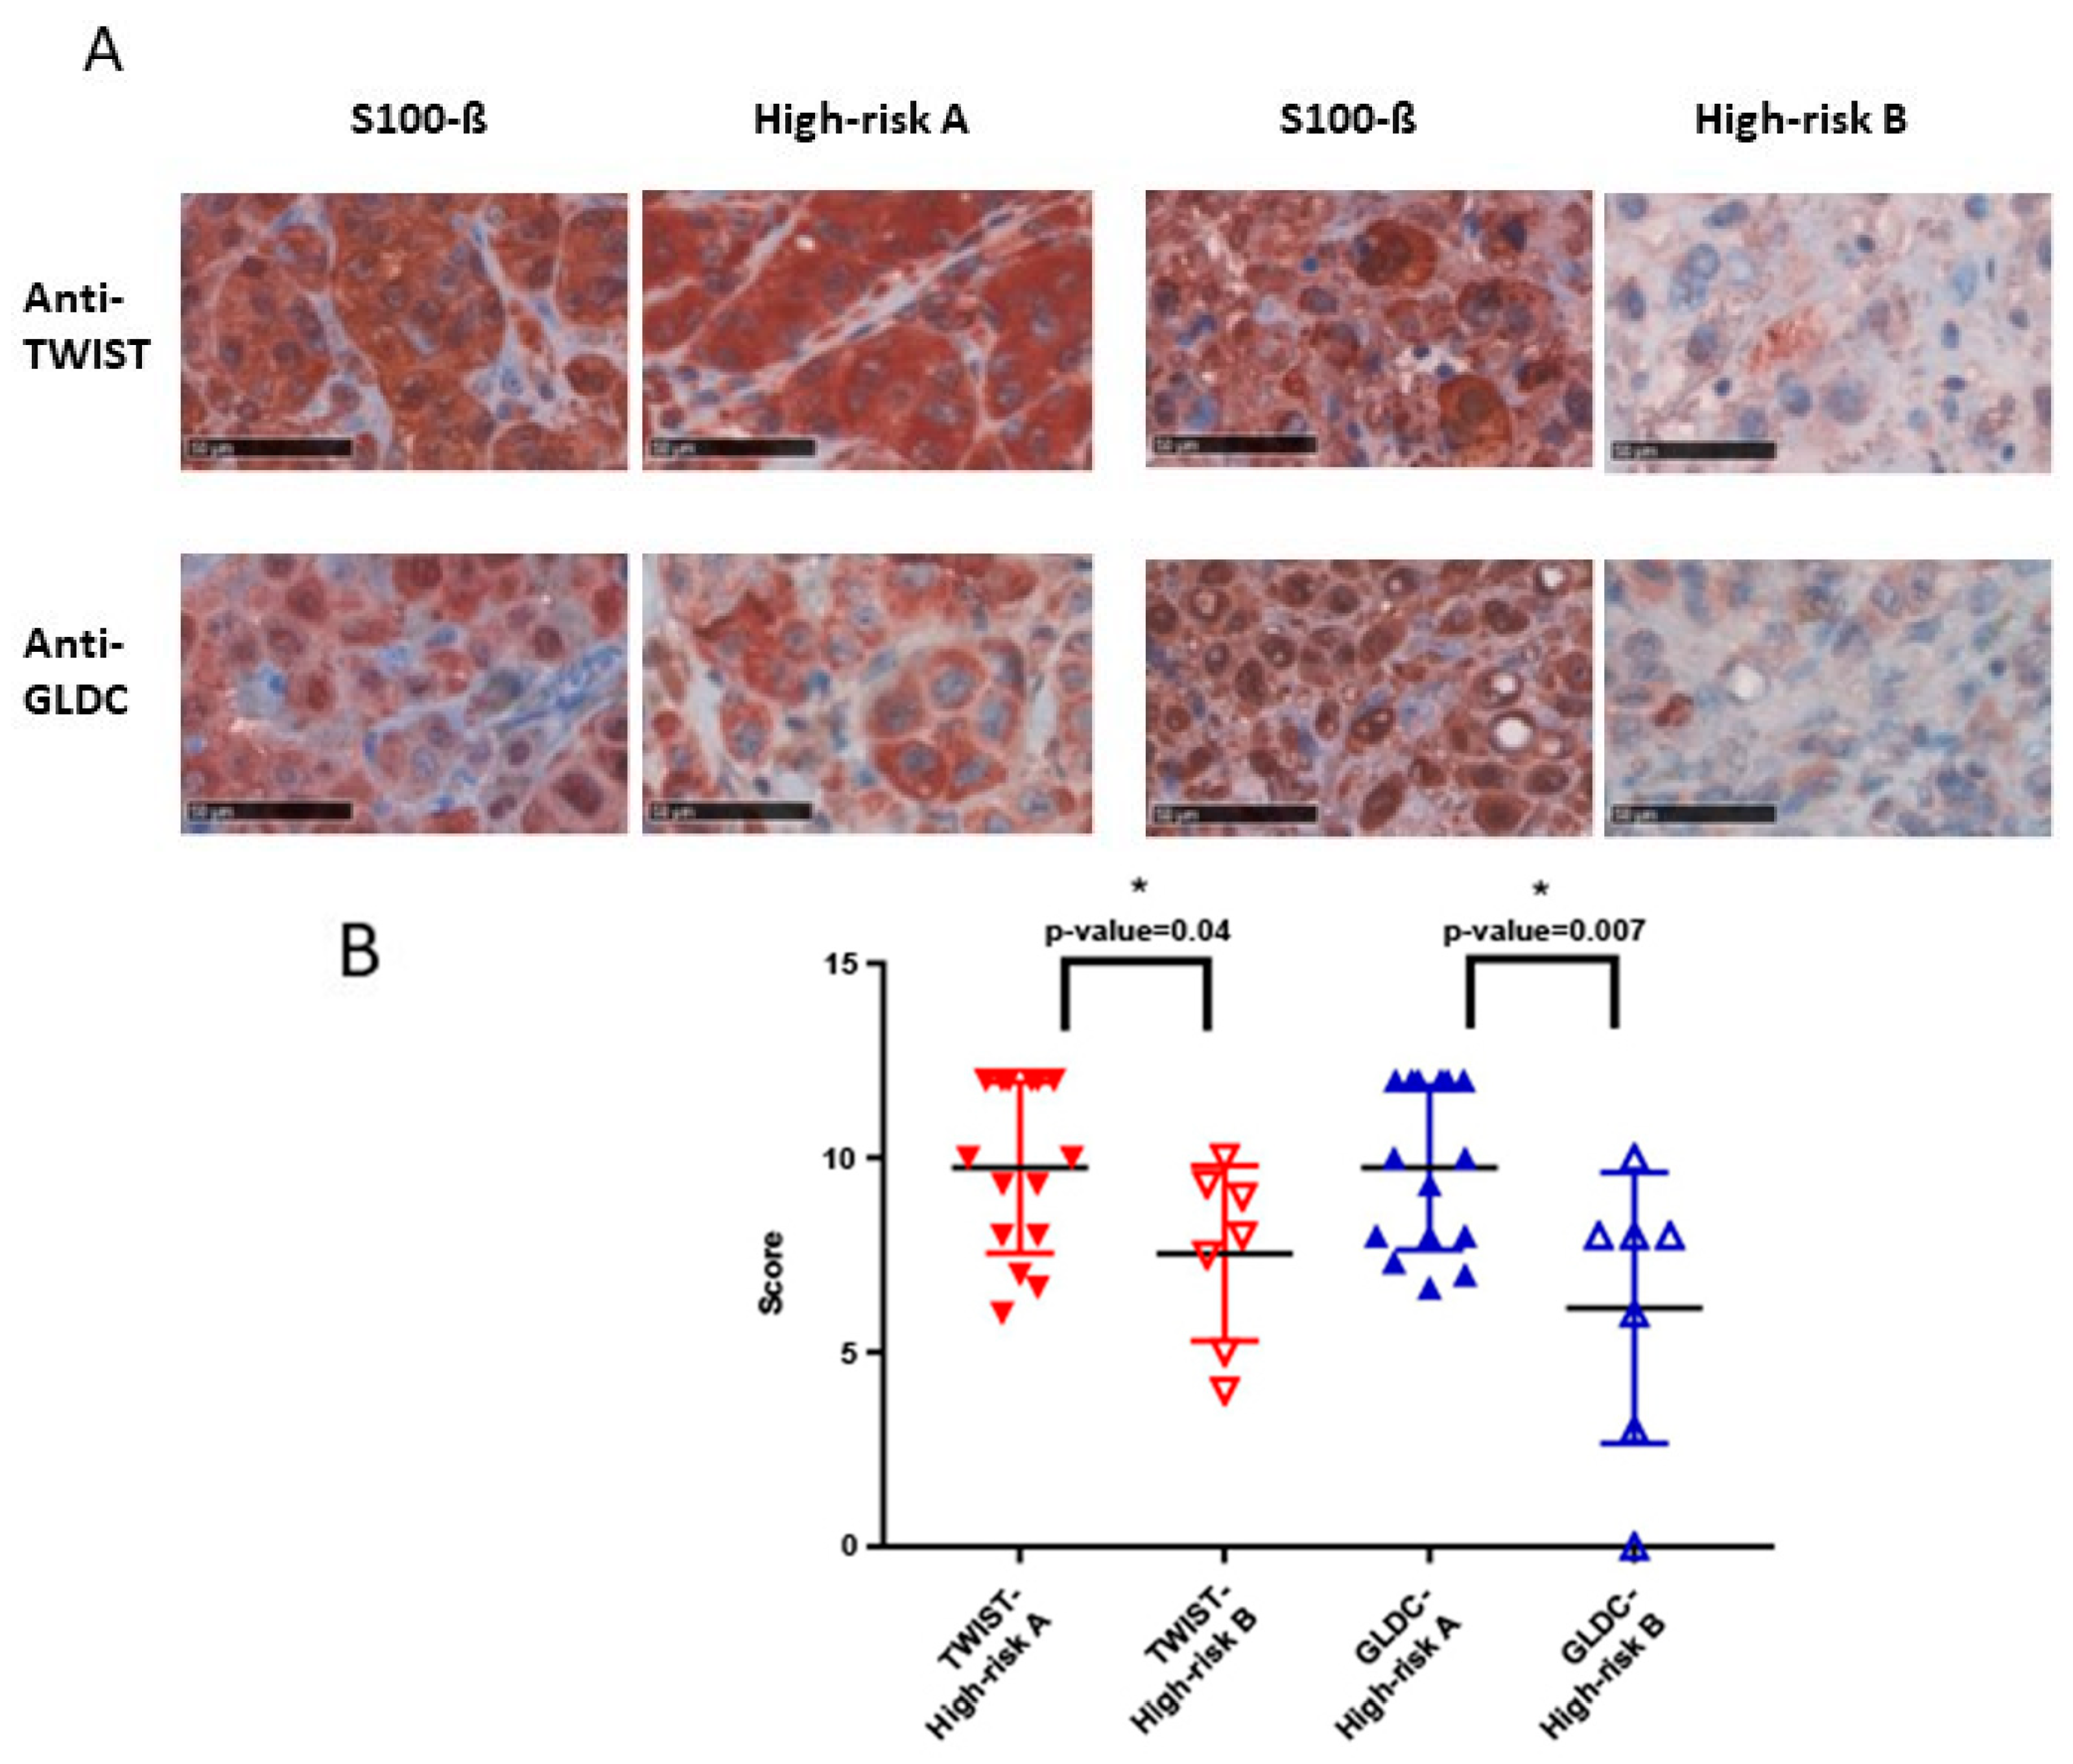
19]. Our study reveals that a greater expression, which can be seen in a greater overall IHC score, is in line with a poor prognosis. The calculated cut-off point for Anti-GLDC was also 8. Patients with an overall IHC score > 8 are 4.5 times more likely to be part of survival group A. The validity of this model is 73.6%. In addition, our results show that a greater expression of the GLDC protein (IHC score > 9.33) in primary melanoma increases the risk for early metastasis. Patients with an IHC score > 9.33 are 5.7 times more likely to belong to high-risk group A and, therefore, develop a metastasis within a shorter term. The validity of this model is 96%.
ERRFI1 is known as a tumor suppressor by directly inhibiting the epidermal-growth-factor-receptor and, therefore, its downstream pathways initializing cell growth [20,21]. In addition, ERFFI1 inhibits another receptor family (Erbb), activation of which leads to cell survival, proliferation, migration, and invasion [22]. It has been shown that ERRFI1 alters negatively invasion and migration processes in malignant melanoma. However, new findings suggest that the role of ERRFI1 depends on the EGFR level. Therefore, the downregulation of ERRFI1 in an EGFR low environment leads to a higher migration rate and promotes cellular growth [23,24]. In our work, the EGFR level was not determined, so further investigations are needed to evaluate the validity of ERRFI1 as a prognostic marker in different subtypes of malignant melanoma. The calculated cut-off point for the antibody against ERRFI1 was 9. Patients with an overall IHC score > 9 are 17 times more likely to belong in survival group A. The validity of the model is 92.1%.
MSX1 is a transcription factor, which plays a part in the epithelial-to-mesenchymal transition during the embryonic development of the melanocyte lineage from the neural crest cells [25]. It could be shown that reactivation of the transcription factor MSX1 in melanoma cells leads to neural crest precursor-like properties, like migration and plasticity [10]. In our studies, no significant difference could be shown, but patients with a poorer prognosis did show a higher IHC (p-value = 0.07). A bigger population group would be needed in order to clarify if MSX1 is usable as a significant tool. TWIST, like MSX1, is a transcription factor, which is part of the epithelial-to-mesenchymal transition. It therefore plays an important role in cell movement, invasion, and survival and is often overexpressed in cancer diseases [26]. It has been shown that TWIST especially promotes metastasis processes and has no influence of primary melanoma growth [27,28,29]. Similar to MSX1, TWIST is involved in metastasis processes. In our study, primary melanomas which are at great risk to metastasis (tumor thickness ≥ 2 mm) with a greater TWIST expression showed earlier metastasis compared to those with lower expression. The calculated cut-off point for TWIST was IHC > 12, the validity for this model is 75.2%. As 12 is the maximal IHC score that can be reached, further investigations are needed to specify the cut-off point as a clinical tool. In addition, there has been a difference for Anti-TWIST between survival group A and survival group B, but without significance. Further investigations are needed in order to display an increasing development of MSX1 and TWIST expression during tumor progression.
Ki67 is not to be found in neural crest cells but is an established proliferation marker, which is expressed in dividing cells [30]. It is used as a predictive and prognostic marker, e.g., in breast cancer [7]. As described above, there is a non-significant difference in Ki67 expression between the two groups.
PTPRF encodes the tyrosine-phosphate-receptor-type F, which controls EGFR signaling. PTPRF is overexpressed in primary melanoma and metastasis of malignant melanoma [31]. The fact that PTPRF is not only overexpressed in metastasis but also in primary melanoma suggests that there is no relevant trend in expression during tumor progression. In our studies, no significant difference in PTPRF expression between the two groups was shown.
TNFRSF21 and TNFRSF12a are members of the tumor necrosis receptor family and contribute to the activation of NF-kappaB, which plays a role in tumorigenesis [32,33]. The IHC scores of the two groups for both antibodies suggest a greater expression during tumor progression; therefore, further investigations are needed in order to confirm the validity.
Finally, IGFBP2 is a tool for proliferation, apoptosis, and migration of cells during embryonic development and tumor cells [34,35]. However, Anti-IGFBP2 did not show a significant difference between the two groups investigated in our study.
One limitation of this study is the small-analyzed population size. In order to improve validity of this study, a bigger population group would be needed. Also, gender distribution, especially in the high-risk group, does not fit the normal distribution in Germany [36]. Here might be a bias as male patients have a shorter overall survival and a greater risk for metastasis compared to women [37,38]. In high-risk group A, patients were included which were already metastasized at time of diagnosis. In these cases, it cannot be certainly said how many months have passed between occurrence of tumor and metastasis. However, considering experience with course of disease and tumor parameter thickness, the time in-between is negligible in these cases.

4. Materials and Methods

4.1. Cell Lines

Human melanoma cell lines (C32, HT144, SKmel173, WM266-4, MZ7, and RPMI) were cultured in DMEM (Gibco, Life Technologies, Darmstadt, Germany) with 10% FBS (Biochrom, Berlin, Germany), 0.1 mM β-mercapthoethanol (Gibco, Life Technologies), 1% non-essential amino acids (NEAA) and 1% Penicillin/Streptomycin (Sigma-Aldrich, St. Louis, MO, USA). Normal human melanocytes (NHM) were isolated from donor foreskins according to the ethical regulation (Ethics committee II, University Medical Center Manheim, Mannheim, Germany) and were cultivated in medium 254 (Gibco, Life Technologies) supplemented with 100× human melanocyte growth supplement (HMGS) (Gibco, Life Technologies). Human neural crest cells were derived from hiPSC and cultured in the same medium as for melanoma cell lines.

4.2. RNA Isolation and cDNA Synthesis

Total RNA isolation from all melanoma cell lines (C32, HT144, SKmel173, WM266-4, MZ7, and RPMI), human neural crest cells (NC) and normal human melanocytes (NHM) was done using RNeasy Mini kit (Qiagen, Düsseldorf, Germany) according to the manufacturer’s protocol. The RNA was treated with DNase I on the column. RNA concentration and quality were measured by NanoDrop ND1000 spectrophotometer. cDNA was synthesized using the Revert Aid First Strand cDNA synthesis kit (Thermo scientific, Darmstadt, Germany) according to the manufacturer’s protocol.

4.3. Microarray Gene Expression Profiling

Biotinylated cRNA was hybridized to whole-genome BeadChip Sentrix arrays HumanHT-12 v4 from ILLUMINA (Santa Clara, CA, USA) following the manufacturer’s indications. Microarray scanning was carried out using an iScan array scanner. As test for significance, a Bayes test was used on the bead expression values of the two groups of interest. The average expression value is calculated as mean of the measured expressions of beads together with the standard deviation of the beads. After selecting the genes, which p-values were inferior to 0.05, log2-expression values of the differentially expressed genes were represented.
Gene expression datasets were uploaded on GEO database: GSE123686.

4.4. qPCR

Quantitative real-time PCR (qPCR) was performed using SYBR Green (Applied Biosystems, Life technologies, Darmstadt, Germany) on a 7500 real-time PCR system (Applied Biosystems, Life technologies). In all experiments, rRNA 18s was used as the housekeeping gene and the values were normalized to it. Relative gene expressions were quantified by calculating (∆∆Ct). Primers used are as follow (Table 5):

4.5. Patient’s Sample

In this study, histopathologic tumor samples (primary melanoma and metastasis) of patients diagnosed with malignant melanoma between 1989 and 2013 were collected and assigned into two groups. All patients did not receive novel immunotherapeutic or targeted therapeutic drugs that have an impact on overall survival. This study was performed in accordance to the ethical vote (2014-835R-MA).
In the first group (survival group A) were included tumor samples of patients who died within 12 months after diagnosis of stage IV melanoma (n = 12). Only metastases were analyzed. Patients who survived 30 months or longer were included in the second group (n = 20; survival group B). In survival group A, eight patients were male and four female. The mean age at initial diagnosis in the first group was 52 years. The mean Breslow tumor thickness of primary melanoma in Survival group A was 2.8 mm. In survival group B, the mean age at initial diagnosis was 61 years. Nine patients were male and eleven female. The mean Breslow tumor thickness of primary melanoma in survival group B was 3.3 mm (see also Table 6). Classifications were made according to system of the American Joint Committee on Cancer (AJCC) of 2009.
In addition, tumor samples of patients with tumors ≥ 2 mm showing high risks to metastasize were identified and assigned to two groups. In the first group (high-risk group A), patients were included who developed metastasis within the first 12 month (n = 16) and the second group contained patients who did not metastasize within 30 months (n = 7; high-risk group B). In this group, only primary melanomas were analyzed. In high-risk group A, four patients were female and twelve patients male. The mean age in this group at initial diagnosis was 76 years. The mean Breslow tumor thickness of primary melanoma in this group was 5 mm. In high-risk group B, five patients were female and two male. The mean age at initial diagnosis was 68 years and the mean Breslow tumor thickness was 2.5 mm (see also Table 7).

4.6. Tissue Microarray

Representative tumor areas were detected on HE sections and tissue punch samples (diameter 2 mm) were taken from paraffin-embedded tumor block and displayed on Tissue Microarrays (TMA) according to a previous report [39]. For one tumor sample up to four punches were taken.

4.7. Immunohistochemistry

An amount of 0.9 µm slices of the in paraffin-embedded tumors on the TMA were stained using standard protocols 11 times with the following antibodies: Anti-GLDC (Atlas Antibodies, Bromma, Sweden, HPA002318), Anti-CD271 (BP Pharmingen, Heidelberg, Germany, 557194), Anti-ERRIF1 (Atlas Antibodies HPA027206), Anti-MSX1 (abcam, Cambridge, UK, ab49153), Anti-TNFRSFR12A (Atlas Antibodies HPA007853), Anti-Ki67 (abcam ab1667), Anti-PTPRF (Atlas Antibodies HPA012710), Anti-TNFRSFR21 (Atlas Antibodies HPA006746), Anti-TWIST (abcam ab50581), Anti-IGFBP2 (Cell signaling, Denver, MA, USA, #3922), and Anti-S100 (Dako, Santa Clara, CA, USA, Z0311). As a negative control, stainings were made according to standard protocol without using primary antibodies. As secondary antibodies, the Dako EnVision™ System-HRP (Dako Kit, Rabbit K4009) was used for Anti-GLDC, Anti-ERRFI1, Anti-MSX1, Anti-TNFRSFR12a, Anti-Ki67, Anti-PTPRF, Anti-TNFRSFR21, Anti-TWIST, Anti-IGFBP2, and Anti-S100. The Dako EnVision™ System-HRP (Dako Kit, Mouse K4005) was used for Anti-CD271. For antibody dilution, Dako Antibody Diluents (Dako S0809) has been used. Antibody dilutions were made according to the manufacturers’ information sheet.

4.8. Analysis of Stained Tumor Samples and Statistics

Stained tumor samples were analyzed and an IHC (immunohistochemistry) score assigned to each sample.
IHC score was defined as the product of the immunopositivity score (0: <10%, 1: 10–25%; 2: 26–50%; 3: 51–75% and 4: >75%) and the immunointensity score (0: negative, 1: mild, 2: moderate, 3: strong). This score was made for each punch (min: 0; max: 12), except for antibody Anti-Ki67. As described above, up to four punches of one tumor sample were taken. Out of IHC scores from each punch, a mean IHC score of each tumor sample was calculated. For an overall IHC score, the mean value form scoring of the two investigators was calculated. For samples stained with Anti-Ki67, the percentage of stained cell nuclei was determined. Two investigators performed scoring independently. One investigation was performed blinded to detect potential bias. Figure 2a and Figures S3 and S4 give examples for immunointensity scores for each antibody.
Overall IHC scores were calculated for all samples and data comparison from survival group A and survival group B, also from high-risk group A and high-risk group B were statistically analyzed with two-tailed t-test. As mean and median did not differ much, we could assume data normally distributed. For Anti-Ki67 and Anti-IGFBP in high-risk group A and B, analyses were made with Mann–Whitney U-Test, as in these cases the data was not normally distributed. Equality of variances was tested using f-test. For each significant antibody, a cut-off point was determined by using logistic regression in order to objectify the informative value of the IHC scores. It was shown that patients with an overall IHC above the cut-off point have a greater risk to belong to group A. Therefore, the risk was calculated using odds ratios. In order to validate this prediction, the association of predicted probabilities and observed responses was put in relation.

5. Conclusions

In conclusion, this study shows that genes highly expressed in both neural crest cells and malignant melanoma cells are associated with prognosis. Indeed, an upregulation of CD271, GLDC, and ERRFI1 in metastatic melanoma is in line with a bad prognosis. In addition, GLDC upregulation in primary melanoma correlates with a risk for early metastasis. Overall, these data highlight the benefit provided by hiPSC-based neural crest models to identify new prognosis markers in neural crest-derived tumors such as melanoma.

Supplementary Materials

The following are available online at https://www.mdpi.com/2072-6694/11/1/76/s1, Figure S1: IHC score of short-term survival and long-term survival. IHC score analyses of the two subgroups (short-term survival and long-term survival) are displayed in this chart. Y-axis shows the overall IHC score (0–12), which was calculated as the product of quantity and intensity of the staining. Displayed antibodies did not show significant difference. Figure S2: IHC score in high-risk group A and high-risk group B. IHC score analyses of the two subgroups (high-risk group A and high-risk group B) are displayed in this chart. Y-axis shows the overall IHC score (0–12), which was calculated as the product of quantity and intensity of the staining (not significant). Figure S3: Intensity of TMA stainings. Immunohistochemical stainings are shown for survival group (CD271, GLDC, and ERRFI1) in S100-β-positive melanoma cells. Samples with, mild, moderate, and strong intensity (12× and 80× magnifications) are shown. Figure S4: Intensity of TMA stainings. Immunohistochemical stainings with mild, moderate, and strong intensity are shown for Anti-MSX1, Anti-TWIST, Anti-TNFRSF12a, Anti-IGFBP2, Anti-TNFRSFR21, and Anti-PTPRF in S100-β-positive sections (12× and 80× magnifications are shown).

Author Contributions

Conceptualization, L.L. and K.J.; Methodology, K.J. and C.W.; Validation, L.L., K.J. and C.W.; Formal Analysis, K.J. and L.L.; Resources, J.U., C.G. and H.W.; Data Curation, K.J. and L.L.; Writing-Original Draft Preparation, K.J.; Writing-Review & Editing, L.L. and K.J.; Supervision, L.L. and K.J.; Project Administration and Funding Acquisition, J.U.

Funding

This work was funded by a grant of the RTG2099 “Hallmarks of skin cancer”.

Acknowledgments

This work is part of the MD thesis of Katharina Jäger. We thank Sayran Arif-Said for providing excellent technical assistance. We wish to thank the Tissue Bank of the National Center for Tumor Diseases for TMA preparation and automated slide scanning.

Conflicts of Interest

The authors declare no conflict of interest.

References

  1. Balch, C.M.; Gershenwald, J.E.; Soong, S.J.; Thompson, J.F.; Atkins, M.B.; Byrd, D.R.; Buzaid, A.C.; Cochran, A.J.; Coit, D.G.; Ding, S.; et al. Final version of 2009 AJCC melanoma staging and classification. J. Clin. Oncol. 2009, 27, 6199–6206. [Google Scholar] [CrossRef] [PubMed]
  2. Larribere, L.; Utikal, J. De- and re-differentiation of the melanocytic lineage. Eur. J. Cell Boil. 2014, 93, 30–35. [Google Scholar] [CrossRef] [PubMed]
  3. Boiko, A.D.; Razorenova, O.V.; van de Rijn, M.; Swetter, S.M.; Johnson, D.L.; Ly, D.P.; Butler, P.D.; Yang, G.P.; Joshua, B.; Kaplan, M.J.; et al. Human melanoma-initiating cells express neural crest nerve growth factor receptor CD271. Nature 2010, 466, 133–137. [Google Scholar] [CrossRef] [PubMed]
  4. Civenni, G.; Walter, A.; Kobert, N.; Mihic-Probst, D.; Zipser, M.; Belloni, B.; Seifert, B.; Moch, H.; Dummer, R.; van den Broek, M.; et al. Human CD271-positive melanoma stem cells associated with metastasis establish tumor heterogeneity and long-term growth. Cancer Res. 2011, 71, 3098–3109. [Google Scholar] [CrossRef]
  5. Schatton, T.; Murphy, G.F.; Frank, N.Y.; Yamaura, K.; Waaga-Gasser, A.M.; Gasser, M.; Zhan, Q.; Jordan, S.; Duncan, L.M.; Weishaupt, C.; et al. Identification of cells initiating human melanomas. Nature 2008, 451, 345–349. [Google Scholar] [CrossRef] [Green Version]
  6. Balch, C.M.; Gershenwald, J.E.; Soong, S.-J.; Thompson, J.F. Update on the melanoma staging system: The importance of sentinel node staging and primary tumor mitotic rate. J. Surg. Oncol. 2011, 104, 379–385. [Google Scholar] [CrossRef]
  7. Jurikova, M.; Danihel, L.; Polak, S.; Varga, I. Ki67, PCNA, and MCM proteins: Markers of proliferation in the diagnosis of breast cancer. Acta Histochem. 2016, 118, 544–552. [Google Scholar] [CrossRef] [PubMed]
  8. Kulesa, P.M.; Kasemeier-Kulesa, J.C.; Teddy, J.M.; Margaryan, N.V.; Seftor, E.A.; Seftor, R.E.B.; Hendrix, M.J.C. Reprogramming metastatic melanoma cells to assume a neural crest cell-like phenotype in an embryonic microenvironment. Proc. Natl. Acad. Sci. USA 2006, 103, 3752–3757. [Google Scholar] [CrossRef] [Green Version]
  9. Shirley, S.H.; Greene, V.R.; Duncan, L.M.; Torres Cabala, C.A.; Grimm, E.A.; Kusewitt, D.F. Slug expression during melanoma progression. Am. J. Pathol. 2012, 180, 2479–2489. [Google Scholar] [CrossRef]
  10. Heppt, M.V.; Wang, J.X.; Hristova, D.M.; Wei, Z.; Li, L.; Evans, B.; Beqiri, M.; Zaman, S.; Zhang, J.; Irmler, M.; et al. MSX1-Induced Neural Crest-Like Reprogramming Promotes Melanoma Progression. J. Investig. Dermatol. 2018, 138, 141–149. [Google Scholar] [CrossRef] [Green Version]
  11. Wu, H.; Larribere, L.; Sun, Q.; Novak, D.; Sachindra, S.; Granados, K.; Umansky, V.; Utikal, J. Loss of neural crest-associated gene FOXD1 impairs melanoma invasion and migration via RAC1B downregulation. Int. J. Cancer 2018, 143, 2962–2972. [Google Scholar] [CrossRef] [PubMed]
  12. Gershenwald, J.E.; Scolyer, R.A.; Hess, K.R.; Sondak, V.K.; Long, G.V.; Ross, M.I.; Lazar, A.J.; Faries, M.B.; Kirkwood, J.M.; McArthur, G.A.; et al. Melanoma staging: Evidence-based changes in the American Joint Committee on Cancer eighth edition cancer staging manual. CA Cancer J. Clin. 2017, 67, 472–492. [Google Scholar] [CrossRef] [PubMed] [Green Version]
  13. Vereecken, P.; Cornelis, F.; Van Baren, N.; Vandersleyen, V.; Baurain, J.-F. A synopsis of serum biomarkers in cutaneous melanoma patients. Dermatol. Res. Pract. 2012, 2012, 260643. [Google Scholar] [CrossRef] [PubMed]
  14. Restivo, G.; Diener, J.; Cheng, P.F.; Kiowski, G.; Bonalli, M.; Biedermann, T.; Reichmann, E.; Levesque, M.P.; Dummer, R.; Sommer, L. low neurotrophin receptor CD271 regulates phenotype switching in melanoma. Nat. Commun. 1988, 8, 1988. [Google Scholar] [CrossRef] [PubMed]
  15. Furuta, J.; Inozume, T.; Harada, K.; Shimada, S. CD271 on melanoma cell is an IFN-gamma-inducible immunosuppressive factor that mediates downregulation of melanoma antigens. J. Investig. Dermatol. 2014, 134, 1369–1377. [Google Scholar] [CrossRef]
  16. Boyle, S.E.; Fedele, C.G.; Corbin, V.; Wybacz, E.; Szeto, P.; Lewin, J.; Young, R.J.; Wong, A.; Fuller, R.; Spillane, J.; et al. CD271 Expression on Patient Melanoma Cells Is Unstable and Unlinked to Tumorigenicity. Cancer Res. 2016, 76, 3965–3977. [Google Scholar] [CrossRef] [PubMed] [Green Version]
  17. Quintana, E.; Shackleton, M.; Foster, H.R.; Fullen, D.R.; Sabel, M.S.; Johnson, T.M.; Morrison, S.J. Phenotypic heterogeneity among tumorigenic melanoma cells from patients that is reversible and not hierarchically organized. Cancer Cell 2010, 18, 510–523. [Google Scholar] [CrossRef] [PubMed]
  18. Go, M.K.; Zhang, W.C.; Lim, B.; Yew, W.S. Glycine decarboxylase is an unusual amino acid decarboxylase involved in tumorigenesis. Biochemistry 2014, 53, 947–956. [Google Scholar] [CrossRef]
  19. Jain, M.; Nilsson, R.; Sharma, S.; Madhusudhan, N.; Kitami, T.; Souza, A.L.; Kafri, R.; Kirschner, M.W.; Clish, C.B.; Mootha, V.K. Metabolite profiling identifies a key role for glycine in rapid cancer cell proliferation. Science 2012, 336, 1040–1044. [Google Scholar] [CrossRef]
  20. Chen, Y.-C.; Colvin, E.S.; Maier, B.F.; Mirmira, R.G.; Fueger, P.T. Mitogen-inducible gene 6 triggers apoptosis and exacerbates ER stress-induced beta-cell death. Mol. Endocrinol. 2013, 27, 162–171. [Google Scholar] [CrossRef]
  21. Zhang, Y.-W.; Vande Woude, G.F. Mig-6, signal transduction, stress response and cancer. Cell Cycle 2007, 6, 507–513. [Google Scholar] [CrossRef] [PubMed]
  22. Baselga, J.; Swain, S.M. Novel anticancer targets: Revisiting ERBB2 and discovering ERBB3. Nat. Rev. Cancer 2009, 9, 463–475. [Google Scholar] [CrossRef] [PubMed]
  23. Cairns, J.; Fridley, B.L.; Jenkins, G.D.; Zhuang, Y.; Yu, J.; Wang, L. Differential roles of ERRFI1 in EGFR and AKT pathway regulation affect cancer proliferation. EMBO Rep. 2018, 19, 3. [Google Scholar] [CrossRef] [PubMed]
  24. Vu, H.L.; Rosenbaum, S.; Capparelli, C.; Purwin, T.J.; Davies, M.A.; Berger, A.C.; Aplin, A.E. MIG6 Is MEK Regulated and Affects EGF-Induced Migration in Mutant NRAS Melanoma. J. Investig. Dermatol. 2016, 136, 453–463. [Google Scholar] [CrossRef] [PubMed]
  25. Gouti, M.; Briscoe, J.; Gavalas, A. Anterior Hox genes interact with components of the neural crest specification network to induce neural crest fates. Stem Cells 2011, 29, 858–870. [Google Scholar] [CrossRef] [PubMed]
  26. Khan, M.A.; Chen, H.; Zhang, D.; Fu, J. Twist: A molecular target in cancer therapeutics. Tumour Biol. J. Int. Soc. Oncodev. Biol. Med. 2013, 34, 2497–2506. [Google Scholar] [CrossRef] [PubMed]
  27. Stoletov, K.; Kato, H.; Zardouzian, E.; Kelber, J.; Yang, J.; Shattil, S.; Klemke, R. Visualizing extravasation dynamics of metastatic tumor cells. J. Cell Sci. 2010, 123, 2332–2341. [Google Scholar] [CrossRef] [Green Version]
  28. Tang, H.; Massi, D.; Hemmings, B.A.; Mandala, M.; Hu, Z.; Wicki, A.; Xue, G. AKT-ions with a TWIST between EMT and MET. Oncotarget 2016, 7, 62767–62777. [Google Scholar] [CrossRef]
  29. Yang, J.; Mani, S.A.; Donaher, J.L.; Ramaswamy, S.; Itzykson, R.A.; Come, C.; Savagner, P.; Gitelman, I.; Richardson, A.; Weinberg, R.A. Twist, a master regulator of morphogenesis, plays an essential role in tumor metastasis. Cell 2004, 117, 927–939. [Google Scholar] [CrossRef]
  30. Gerdes, J.; Schwab, U.; Lemke, H.; Stein, H. Production of a mouse monoclonal antibody reactive with a human nuclear antigen associated with cell proliferation. Int. J. Cancer 1983, 31, 13–20. [Google Scholar] [CrossRef]
  31. Liu, W.; Peng, Y.; Tobin, D.J. A new 12-gene diagnostic biomarker signature of melanoma revealed by integrated microarray analysis. PeerJ 2013, 1, e49. [Google Scholar] [CrossRef] [PubMed]
  32. Pan, G.; Bauer, J.H.; Haridas, V.; Wang, S.; Liu, D.; Yu, G.; Vincenz, C.; Aggarwal, B.B.; Ni, J.; Dixit, V.M. Identification and functional characterization of DR6, a novel death domain-containing TNF receptor. FEBS Lett. 1998, 431, 351–356. [Google Scholar] [CrossRef] [Green Version]
  33. Winkles, J.A.; Tran, N.L.; Berens, M.E. TWEAK and Fn14: New molecular targets for cancer therapy? Cancer Lett. 2006, 235, 11–17. [Google Scholar] [CrossRef]
  34. Fukushima, T.; Kataoka, H. Roles of insulin-like growth factor binding protein-2 (IGFBP-2) in glioblastoma. Anticancer Res. 2007, 27, 3685–3692. [Google Scholar] [PubMed]
  35. Yao, X.; Sun, S.; Zhou, X.; Guo, W.; Zhang, L. IGF-binding protein 2 is a candidate target of therapeutic potential in cancer. Tumour Boil. J. Int. Soc. Oncodev. Boil. Med. 2016, 37, 1451–1459. [Google Scholar] [CrossRef] [PubMed]
  36. Deutsche Krebsgesellschaft (DKG); Deutsche Krebshilfe, A. S3-Leitlinie zur Diagnostik, Therapie und Nachsorge des Malignen Melanoms; Deutsche Krebsgesellschaft e.V.: Berlin, Germany, 2016; pp. 1–275. [Google Scholar]
  37. Lasithiotakis, K.; Leiter, U.; Meier, F.; Eigentler, T.; Metzler, G.; Moehrle, M.; Breuninger, H.; Garbe, C. Age and gender are significant independent predictors of survival in primary cutaneous melanoma. Cancer 2008, 112, 1795–1804. [Google Scholar] [CrossRef] [Green Version]
  38. Scoggins, C.R.; Ross, M.I.; Reintgen, D.S.; Noyes, R.D.; Goydos, J.S.; Beitsch, P.D.; Urist, M.M.; Ariyan, S.; Sussman, J.J.; Edwards, M.J.; et al. Gender-related differences in outcome for melanoma patients. Ann. Surg. 2006, 243, 693–700. [Google Scholar] [CrossRef]
  39. Wagner, N.B.; Weide, B.; Reith, M.; Tarnanidis, K.; Kehrel, C.; Lichtenberger, R.; Pflugfelder, A.; Herpel, E.; Eubel, J.; Ikenberg, K.; et al. Diminished levels of the soluble form of RAGE are related to poor survival in malignant melanoma. Int. J. Cancer 2015, 137, 2607–2617. [Google Scholar] [CrossRef] [Green Version]
Figure 1. Detection of novel neural crest cell associated markers in melanoma cells. (A) Schematic of the workflow. Transcriptome of neural crest (NC) cells and melanoma cell lines were compared to either parental human induced Pluripotent Stem Cells (hiPSCs) or normal human melanocytes (NHM). The 8 most upregulated genes in both conditions were selected. (B) Gene expression values of the 8 candidate markers from the transcriptome analysis in NC and melanoma cell lines compared to NHM. (C) qPCR-based gene expression of the 8 candidate markers in NC and melanoma cell lines compared to NHM. rRNA 18S was used as an endogenous expression control. Data are shown as mean ± SD of biological triplicates.
Cancers 11 00076 g001aCancers 11 00076 g001b
Figure 2. Neural crest marker CD271, GLDC, and ERRFI1 are highly expressed in advanced melanoma patients with bad prognosis. (A) Immunohistochemical stainings for CD271, GLDC, and ERRFI1 for short-term survival and long-term survival. Scale bar: 50 µm. (B) Overall IHC score analyses for CD271, GLDC, and ERRFI1 for short- and long-term survival. Y-axis shows the overall IHC score (0–12), which was calculated from the means of the products of quantity and intensity of the stainings. The displayed antibodies showed p-values < 0.05 (*) analyzed with two-tailed t-test.
Cancers 11 00076 g002
Figure 3. TWIST and GLDC high protein expressions are associated with metastasis development in high-risk primary melanomas. (A) Immunohistochemical stainings of high-risk primary melanomas are shown for TWIST and GLDC in high-risk group A and high-risk group B. Scale bar: 50 µm (B) Overall IHC score analyses of the two subgroups (high-risk group A and high-risk group B) are displayed in this chart. Y-axis shows the overall IHC score (0–12), which was calculated from the means of the products of quantity and intensity of the stainings. The displayed antibodies showed p-values < 0.05 (*) analyzed with two-tailed t-test.
Cancers 11 00076 g003
Table 1. Immunohistochemistry (IHC) scores for each antibody (survival group).
Patient NumberAnti-CD271Anti-GLDCAnti-ERRFI1Anti-TWISTAnti-MSX1Anti-Ki67Anti-PTPRFAnti-TNFRSF21Anti-TNFRSF12AAnti-IGFBP2
Short-Term Survivors
18.508.009.008.758.503.007.009.0011.002.67
29.509.0010.009.0010.008.753.758.0010.001.50
312.0012.0010.5012.0010.503.008.0012.0012.004.00
412.008.0012.0012.0012.002.7510.0011.009.753.00
512.009.0012.009.0012.001.0012.0012.0012.008.00
610.6710.0012.009.0010.0012.506.509.0012.006.50
78.008.008.0010.5012.0025.008.0010.0012.0010.00
80.004.0012.000.000.0010.000.000.000.000.00
98.508.009.008.758.503.007.009.0011.002.67
1012.0012.0010.5012.0010.503.008.0012.0012.004.00
1112.008.0012.0012.0012.002.7510.0011.009.753.00
1210.679.6712.0012.0012.0012.5012.0012.0012.0010.00
Long-Term Survivors
137.008.006.008.006.009.338.008.008.002.00
146.006.004.508.008.501.008.003.506.000.00
158.0012.008.0012.0010.0010.0012.0012.006.0010.00
168.008.008.508.008.0010.008.008.0012.008.00
177.006.506.6712.008.006.007.5011.008.005.50
188.008.008.0010.0011.009.005.7511.0012.005.50
194.007.007.008.0010.004.507.0011.009.006.00
200.008.002.004.008.002.004.006.008.006.00
215.757.008.0011.007.502.007.0010.007.006.00
226.676.338.006.338.6715.0010.6712.006.003.67
231.505.007.006.0010.005.507.0010.007.008.00
241.505.332.004.001.5013.505.001.0010.008.00
255.339.336.679.338.003.338.009.338.003.67
267.003.509.757.256.251.503.506.755.256.00
275.509.335.338.2510.008.758.0010.676.502.67
284.004.008.678.009.331.331.336.678.676.00
2910.678.005.3310.678.0026.004.008.0012.005.33
3011.009.0011.006.0010.007.755.009.0012.003.75
314.506.674.677.337.0030.004.006.0010.007.67
320.000.00n.d.12.000.005.000.000.000.000.00
n.d. = not determined.
Table 2. Data comparison of short-term survivors vs. long-term survivors.
AntibodyShort-Term SurvivorsLong-Term Survivorsp-ValueCut-Off PointValidity
Anti-CD2718.81 (6.61–11.0; CI 95%)5.57 (4.12–7.02; CI 95%)0.01880%
Anti-GLDC8.76 (7.22–10.29; CI 95%)6.85 (5.66–8.04; CI 95%)0.05873.6%
Anti-ERRFI110.57 (9.52–11.61; CI 95%)6.69 (5.56–7.82; CI 95%)<0.001992.1%
Anti-TWIST9.41 (7.30–11.52; CI 95%)8.31 (7.17–9.44; CI 95%)0.29n.d.n.d.
Anti-MSX18.81 (6.61–11.0; CI 95%)7.79 (6.49–9.08; CI 95%)0.07n.d.n.d.
Ki6710.14 (5.64–14.64)8.58 (4.92–12.22; CI 95%)0.57n.d.n.d.
Anti-PTPRF7.49 (5.13–9.86; CI 95%)6.19 (4.83–7.55; CI 95%)0.28n.d.n.d.
Anti-TNFRSF219.03 (6.96–11.09; CI 95%)8 (6.4–9.6; CI 95%)0.41n.d.n.d.
Anti-TNFRSF12a9.31 (6.92–11.71; CI 95%)8.07 (6.71–9.43; CI 95%)0.3n.d.n.d.
Anti-IGFBP25.07 (3.01–7.13; CI 95%)5.19 (3.95–6.43; CI 95%)0.91n.d.n.d.
CI = confidence interval; n.d. = not determined.
Table 3. IHC scores for each antibody (high-risk group).
Patient NumberAnti-CD271Anti-GLDCAnti-ERRFI1Anti-TWISTAnti-MSX1Anti-Ki67Anti-PTPRFAnti-TNFRSF21Anti-TNFRSF12AAnti-IGFBP2
High-Risk Group A (Short Term until Metastasis)
337.337.338.007.009.336.006.3310.679.009.33
3410.0012.0012.0012.008.005.009.0010.008.0012.00
3510.0012.008.0012.0012.002.008.0010.0012.0012.00
368.0012.0012.00n.d.12.000.004.008.0012.0012.00
375.507.006.676.008.00n.d.4.008.0012.008.00
3810.0010.008.0010.008.001.0010.0010.0012.008.00
397.0010.0012.0010.007.002.006.0010.0012.008.00
4012.009.339.339.336.0013.339.339.338.0010.00
4110.0012.008.0012.0012.00n.d.12.0012.0012.008.00
429.336.676.679.337.337.009.339.3310.6712.00
435.008.007.336.677.3311.674.335.008.004.67
448.6712.0010.0012.0012.007.0012.0012.0012.0011.00
456.008.0012.008.0012.006.505.0010.0010.003.00
4611.0012.0010.678.0012.0025.0012.0012.009.339.33
4712.008.008.0012.008.0015.008.0012.008.001.00
48n.d.n.d.9.0012.0012.000.504.00n.d.n.d.4.00
High-Risk Group B (Long Term until Metastasis)
499.338.004.679.3310.001.009.3310.0010.008.00
506.333.008.005.006.251.334.005.2510.006.50
51n.d.8.00n.d.9.006.0030.003.00n.d.8.006.00
52n.d.6.0012.008.0012.0015.338.0012.0012.000.00
536.008.0012.0010.0012.006.676.008.0010.679.33
54n.d.0.000.004.00n.d.1.0012.008.008.008.00
559.0010.007.007.506.256.257.508.507.004.00
n.d. = not determined.
Table 4. Data comparison of high-risk group A (short term until metastasis) vs. high-risk group B (long term until metastasis).
AntibodyHigh-Risk Group AHigh-Risk Group Bp-ValueCut-Off PointValidity
Anti-TWIST9.76 (8.53–10.97; CI 95%)7.55 (5.46–9.64; CI 95%)0.041275.2%
Anti-GLDC9.76 (8.58–10.93; CI 95%)6.14 (2.92–9.37; CI 95%)0.0079.3362%
Anti-MSX19.56 (8.33–10.8; CI 95%)8.75 (5.68–11.82; CI 95%)0.5n.d.n.d.
Anti-CD2718.79 (7.55–10.03; CI 95%)7.67 (4.9–10.44; CI 95%)0.37n.d.n.d.
Anti-ERRFI19.23 (8.18–10.27; CI 95%)7.28 (2.47– 12.09; CI 95%)0.35n.d.n.d.
Ki677.478.80u-value = 1n.d.n.d.
Anti-PTPRF7.71 (6.13–9.3; CI 95%)7.12 (4.25–9.98; CI 95%)0.67n.d.n.d.
Anti-TNFRSF219.89 (8.84–10.94; CI 95%)8.63 (6.26–10.99; CI 95%)0.21n.d.n.d.
Anti-TNFRSF12a10.33 (9.35–11.32; CI 95%)9.38 (7.75–11.02; CI 95%)0.25n.d.n.d.
Anti-IGFBP213.538.5u-value = 0.1n.d.n.d.
CI = confidence interval; n.d. = not determined.
Table 5. Primers used for gene expressions.
Symbol Primer SequenceAccession Number
18SF:GAGGATGAGGTGGAACGTGTX03205.1
R:TCTTCAGTCGCTCCAGGTCT
MSX1F:TCCTCAAGCTGCCAGAAGATP28360
F:TACTGCTTCTGGCGGAACTT
TNFRSF12AF:CTGGCTCCAGAACAGAAAGGQ9NP84
R:GGGCCTAGTGTCAAGTCTGC
GLDCF:GGACCGGCCTTATTCCAGAGP23378
R:TCATCAATCCGGGCAATCGT
ERRFIF:TCTAGGCCTCTTCCACCGTTQ9UJM3
ERRFIR:CGCCTGCCAGGAACATCATA
IGFBP2F:CCTCAAGTCGGGTATGAAGGP18065
IGFBP2R:ACCTGGTCCAGTTCCTGTTG
PTPRFF:CAGAGGAGTCCGAGGACTATGAP10586
PTPRFR:ACTGCACCTGTTGTAGTGACA
TWIST1F:TCTCAAGAGGTCGTGCCAATQ15672
TWIST1R:ATGGTTTTGCAGGCCAGTTT
Table 6. Clinical data of stage I6 melanoma short-term survivors and long-term survivors.
Patient NumberSexAge (Initial Diagnosis)Stage at Initial DiagnosisBreslow Tumor Thickness of Primary Melanoma (in mm)Clark Level of Primary MelanomaM-Classification (2009)Month Stage I.II until MetastasisMonth Between Stage IV and DeathLocalization of Analyzed Metastasis
Short-Term Survivors
1male72IIIn.d.n.d.M1b09soft tissue
2male51II65M1b1411lung tissue
3male23IIIn.d.n.d.M1a011subcutaneous
4female54I1.74M1c379bone
5male41II1.4n.d.M1a135skin
6male51III2.84M1b010skin
7male43IV1.84M1c07lymph node
8female69IVn.d.n.d.M1c07skin
9male51III2.7n.d.M1c07soft tissue
10female78II4.34M1b06skin
11female67III3.54M1b011lung tissue
12male28I0.72M1b1166skin
Long-Term Survivors
13female47IIn.d.n.d.M1an.d.60skin
14female70n.d.n.d.4M1a1961skin
15male55III1.84M1a3343skin
16male62I1.93M1b934lung tissue
17female51II7.04n.d.037lymph node
18female60III3.24M1a047skin
19male52IVn.d.n.d.M1a7449subcutaneous
20male60II5.04M1a058skin
21female75II11.75M1b10570lymph node
22male75II1.32M1c058skin
23female54II2.04M1c061lymph node
24female84III1.64M1a1043skin
25male34II2.54M1a040skin
26male47III3.84M1a045lymph node
27male70I1.43n.d.168skin
28female68I-IIn.d.n.d.M1c380lymph node
29male66II4.54M1b1104lymph node
30female66II5.04M1a161skin
31female61II3.14M1cn.d.31skin
32female68I1.54n.d.n.d.80skin
n.d. = not determined.
Table 7. Clinical data of patients with high-risk primary melanoma and short term until metastasis (high-risk group A) and long term until metastasis (high-risk group B).
Patient-NumberSexAge at Initial DiagnosisStage II until First Metastasis (in Month)Months Between First Diagnosis and Analyzed TissueTumorLocalizationBreslow Tumor Thickness of Primary Melanoma (in mm)Clark Level of Primary MelanomaMitotic Rate (Mitosis/mm²) of Primary MelanomaUlceration of Primary MelanomaStage at Initial Diagnosis
High-Risk Group A (Short Term until Metastasis)
33male7160primary melanomamucosa5n.d.n.d.yesII
34female7610primary melanomaskin9.2n.d.n.d.yesII
35male6100primary melanomaskin6.84n.d.yesIII
36female6400primary melanomaskin3.5n.d.n.d.yesII
37male4000primary melanomaskin3.636yesIII
38male5300primary melanomaskin3.53n.d.noIII
39male7550primary melanomaskin2.848noII
40male9060primary melanomaskin7.759yesII
41female8110primary melanomaskin3.54n.d.yesII
42male6550primary melanomaskin6.5410yesII
43male4100primary melanomaskin3.24n.d.n.d.III
44male8800primary melanomaskin54n.d.n.d.III
45male5100primary melanomaskin2.84n.d.n.d.III
46male7750primary melanomaskin95n.d.n.d.II
47male6630primary melanomaskin4.54n.d.n.d.II
48female6700primary melanomaskin3.54n.d.n.d.III
High-Risk Group B (Long Term until Metastasis)
49male65400primary melanomaskin2.1n.d.2n.d.II
50male78310primary melanomaskin2.5n.d.n.d.yesII
51male75470primary melanomaskin2.64n.d.noII
52female66340primary melanomaskin2.44n.d.yesII
53male48390primary melanomaskin2.247noII
54female76320primary melanomaskin3.34n.d.noII
55male70390primary melanomaskin2.34n.d.yesII
n.d. = not determined.

