2.1. Cisplatin Resistant Cell Lines Lead to Increased ROS Levels
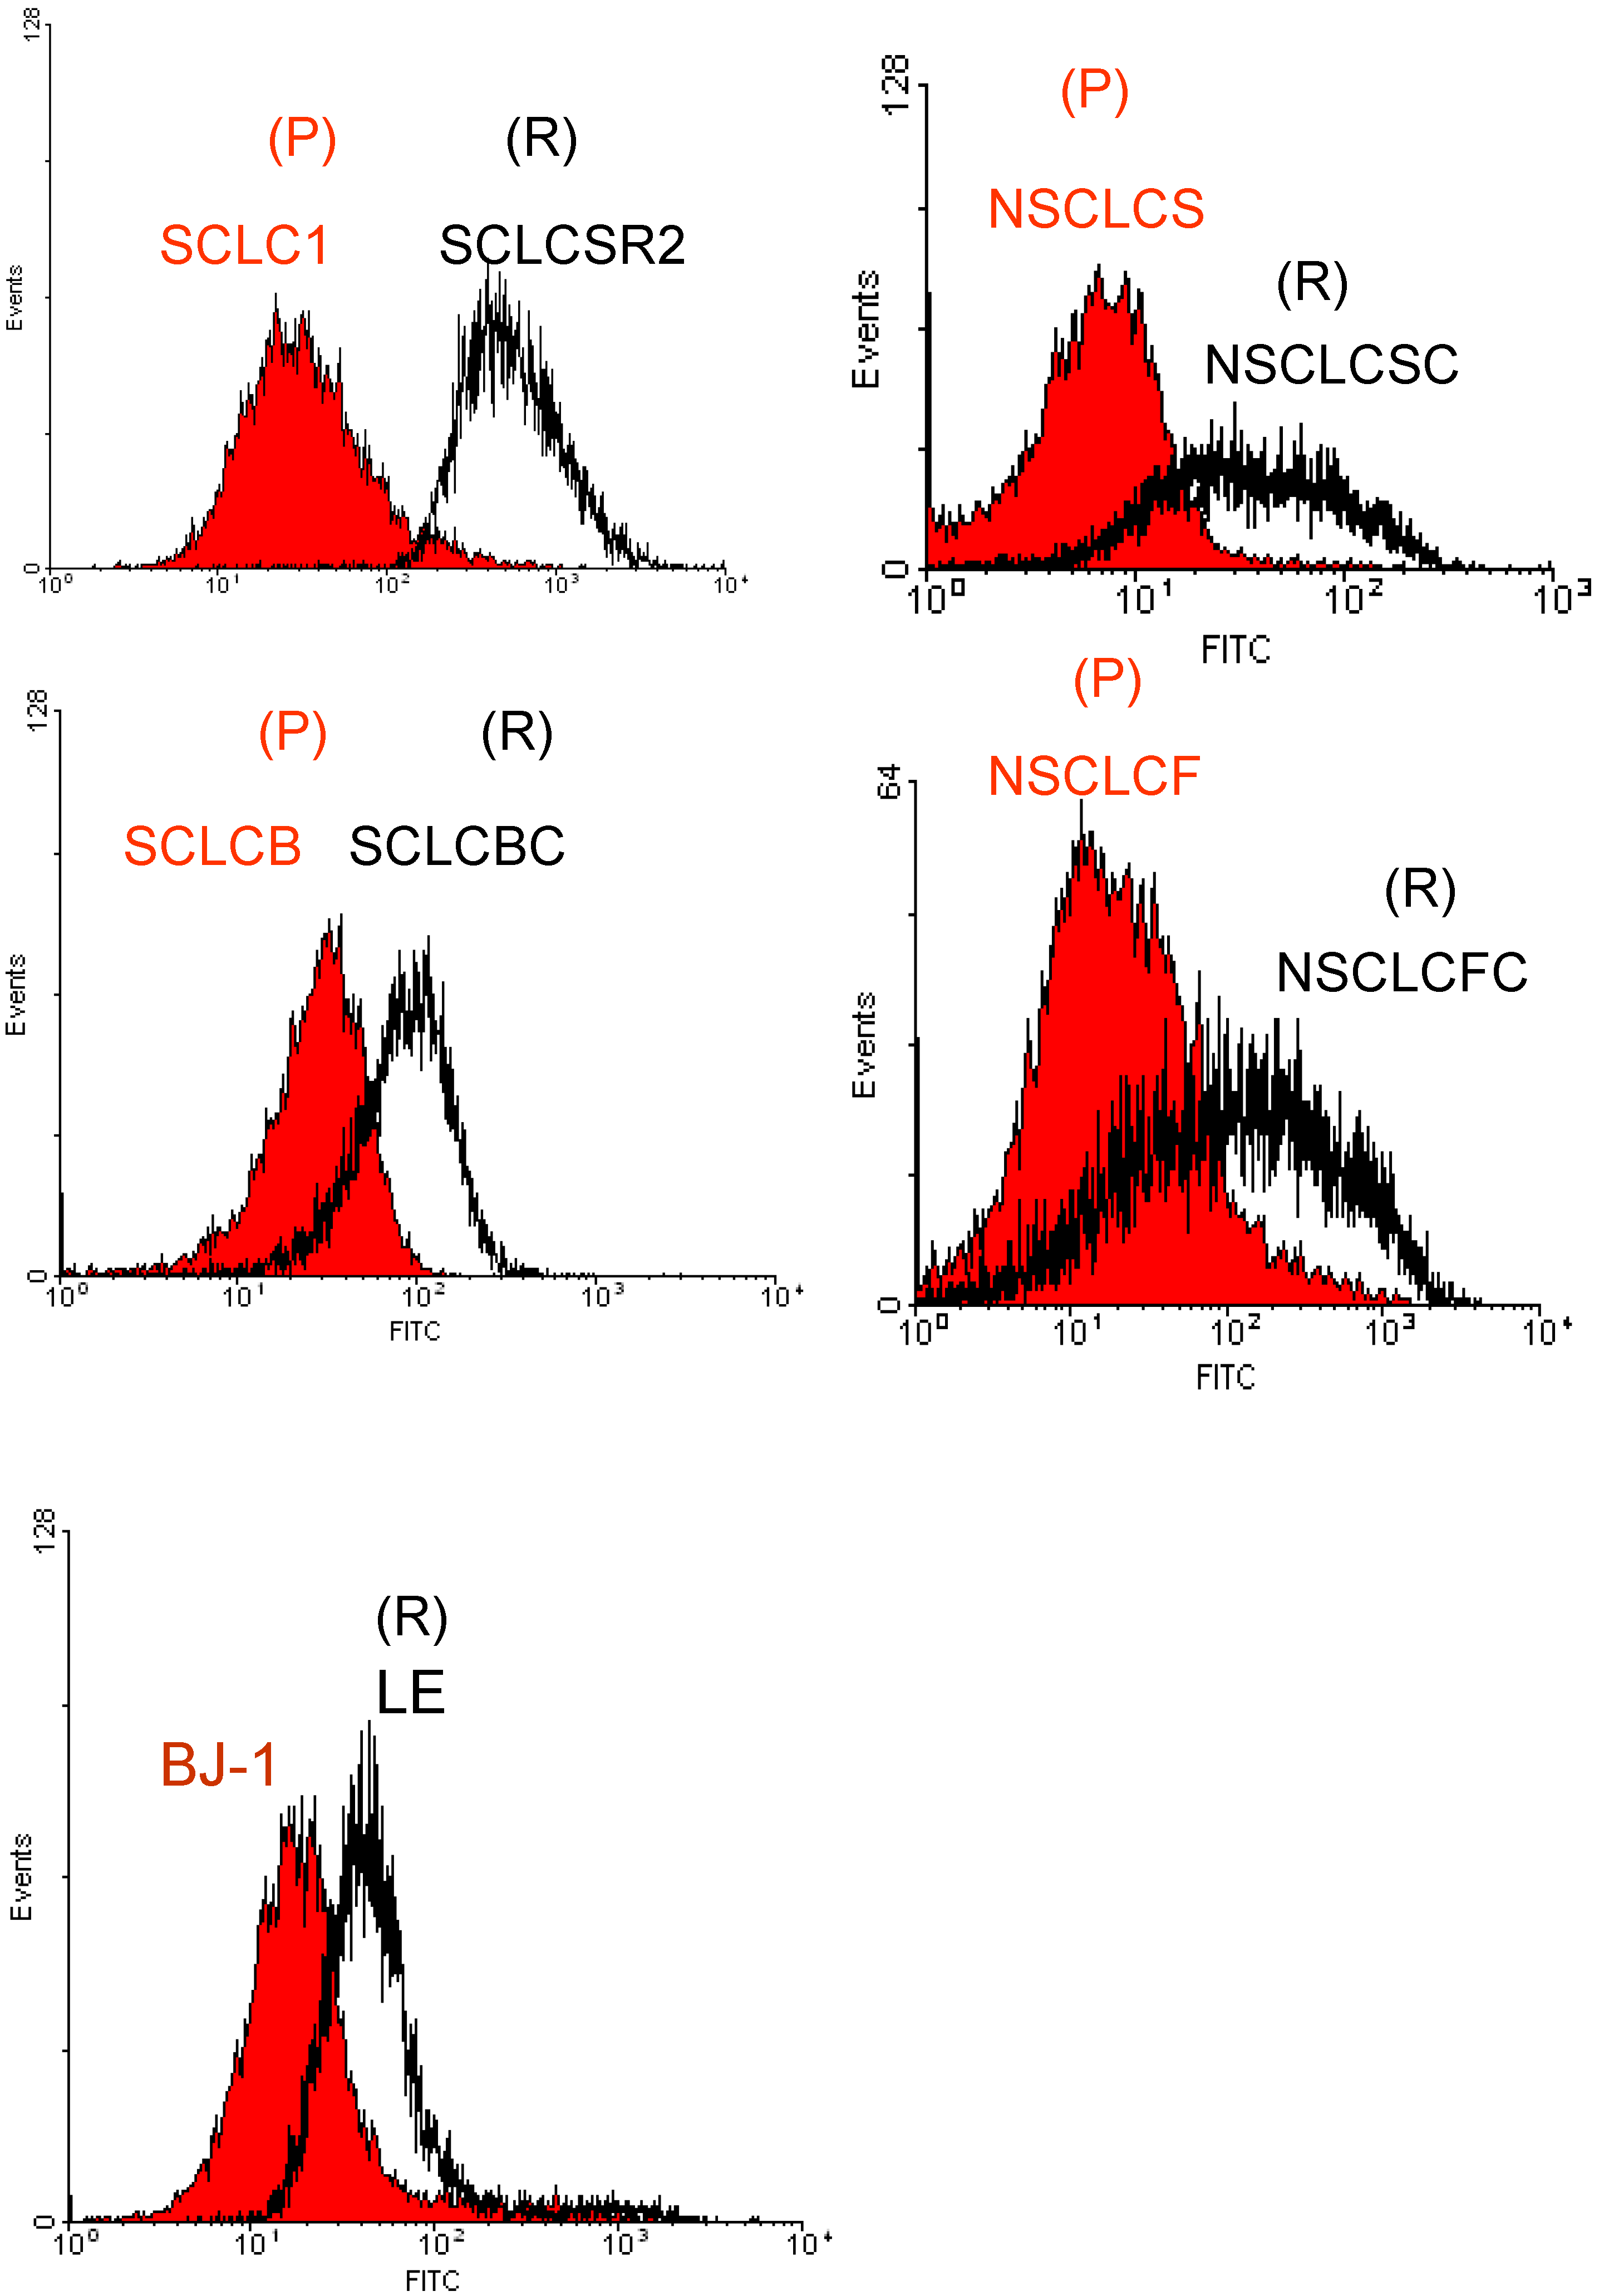
We have studied two pairs of small cell lung cancer (SCLC), two pairs of non small cell lung cancer (NSCLC) and their cisplatin resistant counterparts as well as normal fibroblast cell line, BJ-1 (see Experimental section for ID
50 response). Our results showed that ROS is increased in all cisplatin resistant cell lines when compared to their parental counterpart cells. In addition, we also evaluated the level of ROS in primary tumor cell cultures from a patient who failed cisplatin (cell line LE). Since no parental cells were available for comparison with LE cell line, normal cells BJ-1 were used as control. Similarly to cisplatin-resistant cell lines, primary tumor cells were also found to have high levels of ROS as compared with BJ-1 (
Figure 1).
To further confirm that cisplatin resistant cell lines possess high basal ROS levels, we assayed H
2O
2 levels in the cell line pairs and the cisplatin-resistant primary culture using H
2O
2 specific APFB probe. The results are shown in
Figure 2. All cisplatin-resistant cell lines clearly expressed high levels of H
2O
2 when compared to their parental cell counterparts. Again, normal BJ-1 cells were used for comparison with the primary cisplatin-resistant cells. Our data strongly indicate that cisplatin resistant cell lines possess intrinsically high basal ROS levels than their parental counterparts and normal cells.
Figure 1.
Flow cytometry analysis of ROS in various lung cancer cell lines detected by DCF-DA probe. The cisplatin resistant variants (R) are shown to possess higher basal levels of ROS when compared to parental cells counterpart (P). Each histogram is representative of three experiments (average P < 0.03, parental vs. resistant). BJ-1 was used as control.
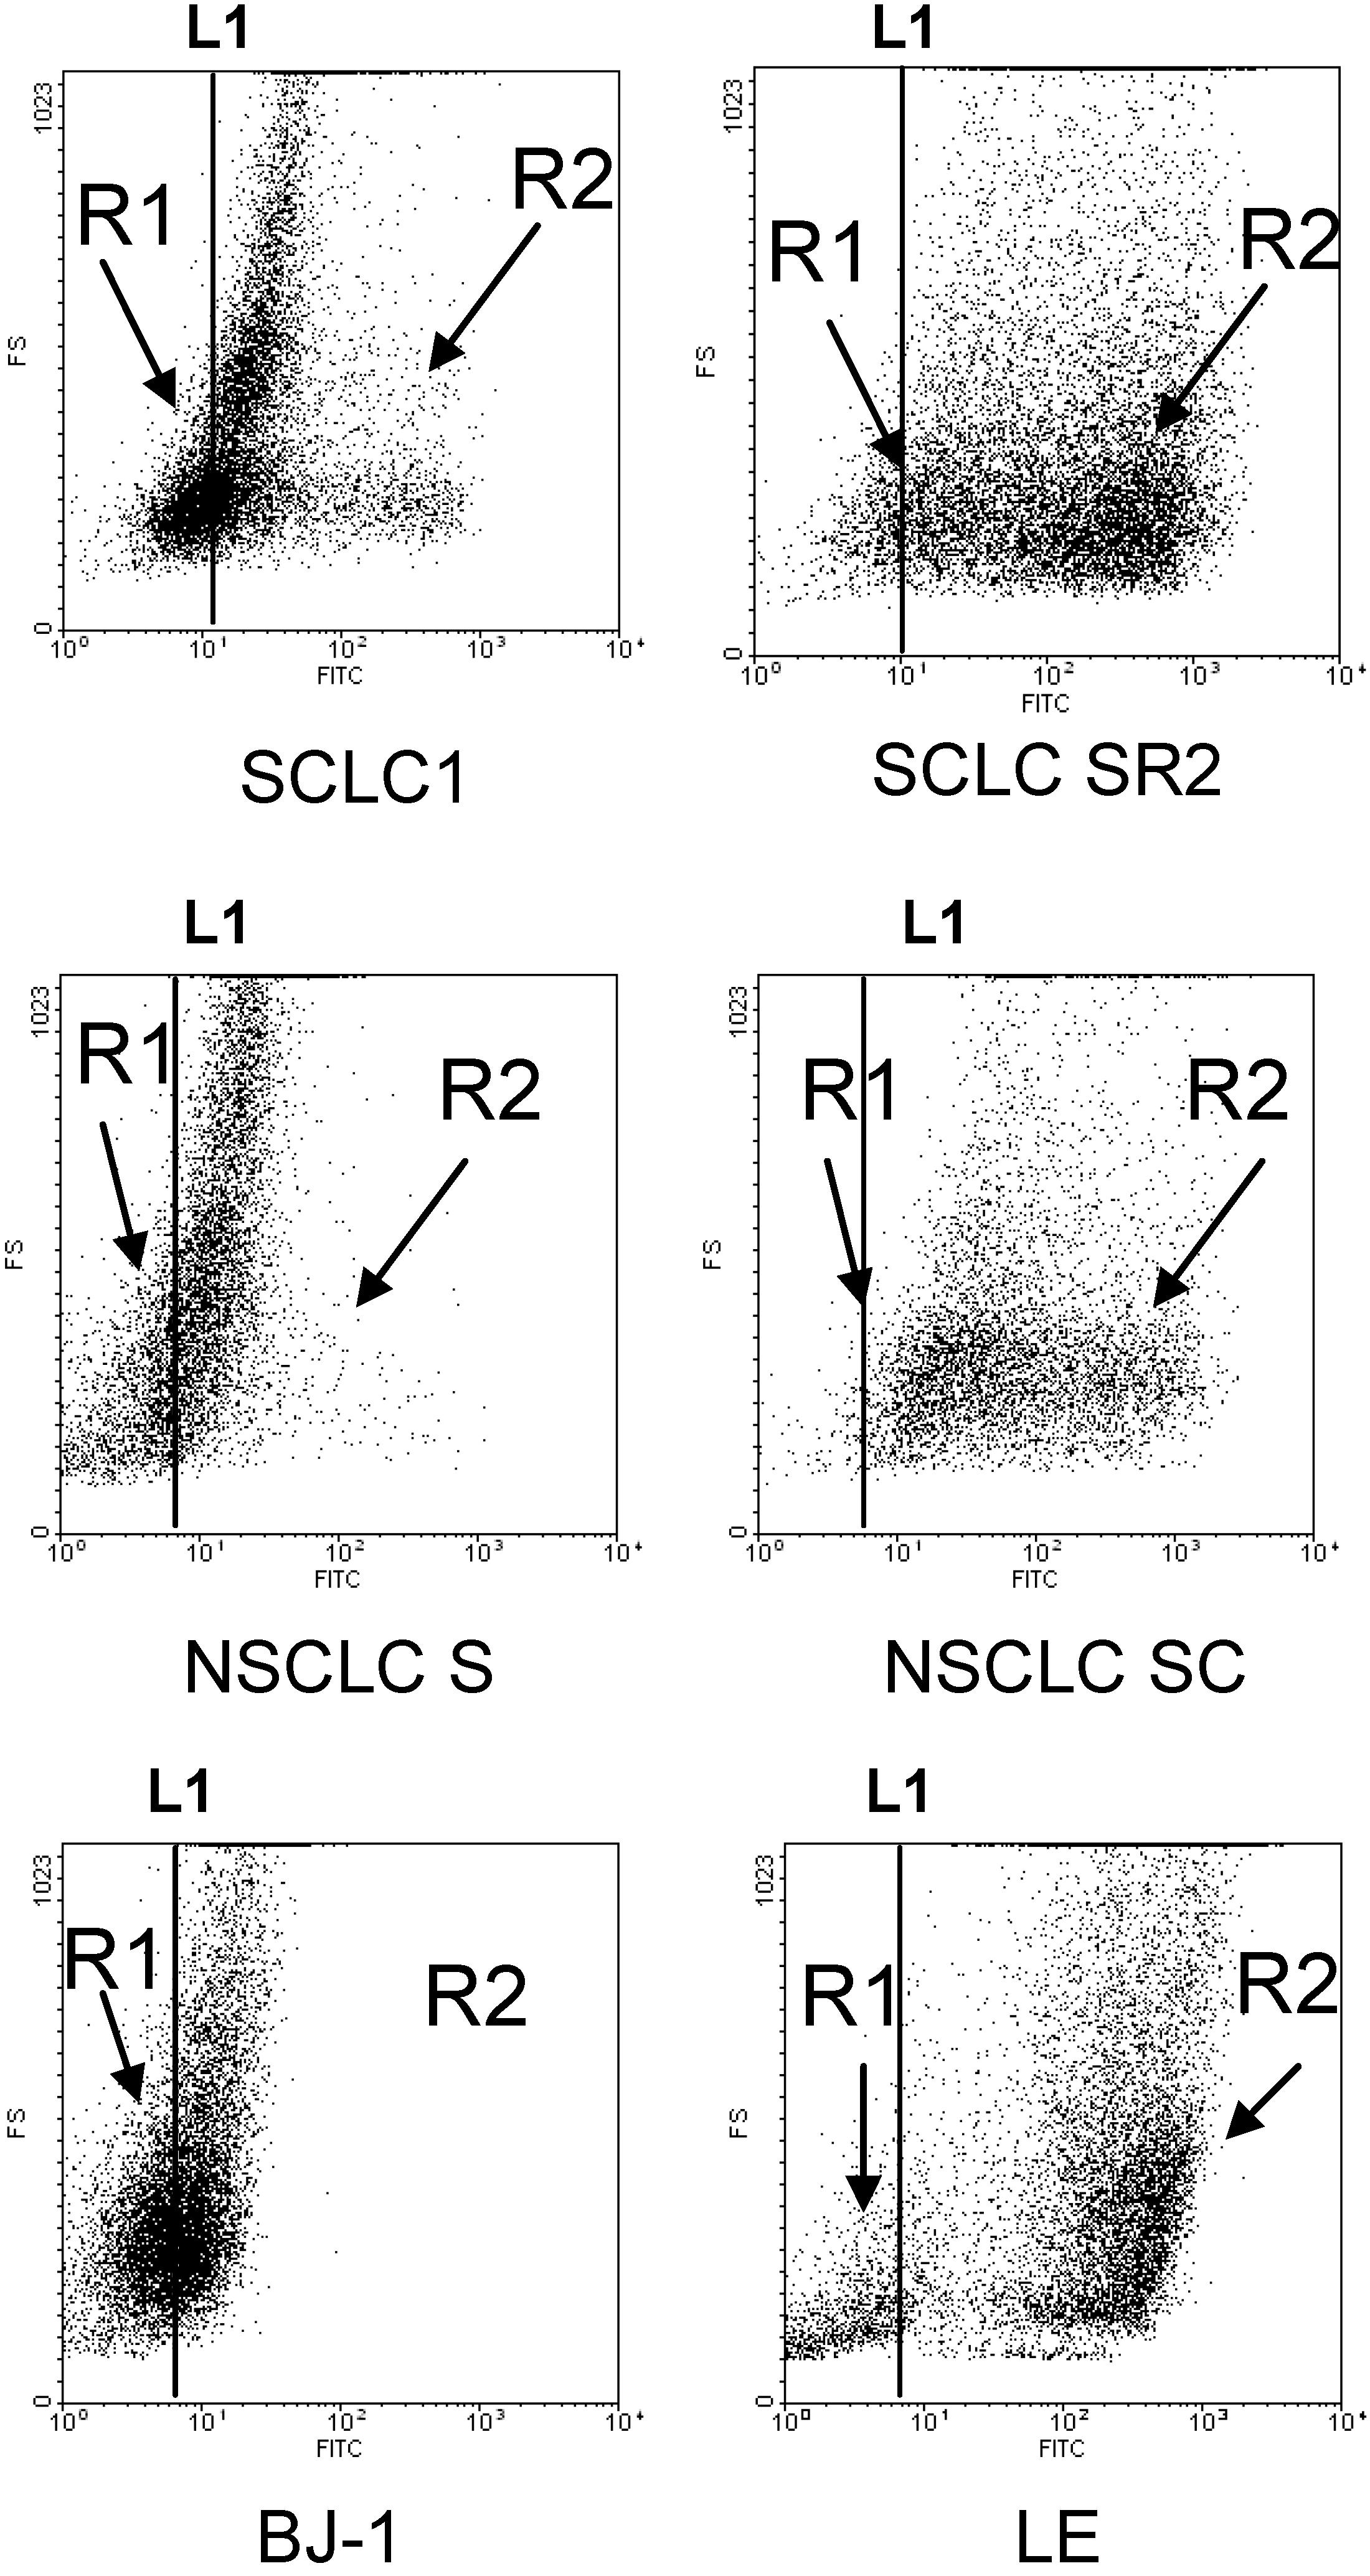
Figure 2.
Flow cytometry analysis of H2O2 in lung cancer cell lines detected by APFB probe indicated that there are 2 populations of cells: R1 (low H2O2 production) and R2 (high H2O2 production). Resistant cells SCLCSR2, NSCLCSC, and LE have more R2 population than cisplatin sensitive cells and BJ-1. Each dot plot is representative of three experiments. All cisplatin resistant cell lines have more R2 than R1 population with an average P < 0.005. Line L1 is arbitrarily set as the average H2O2 production in the parental cells counterpart.
2.2. Growth Inhibitory Effect of Elesclomol on Cisplatin Resistant Cell Lines
Since cisplatin resistant cell lines expressed substantially high level of ROS, we hypothesized that compounds that generate ROS may increase the ROS levels beyond the threshold of tolerability in cisplatin-resistant cells resulting in cell death while sparing normal cells. To confirm this concept, we have treated both parental and resistant cells with elesclomol, a compound known to increase ROS for 48 h [
6]. The data are shown in
Figure 3.
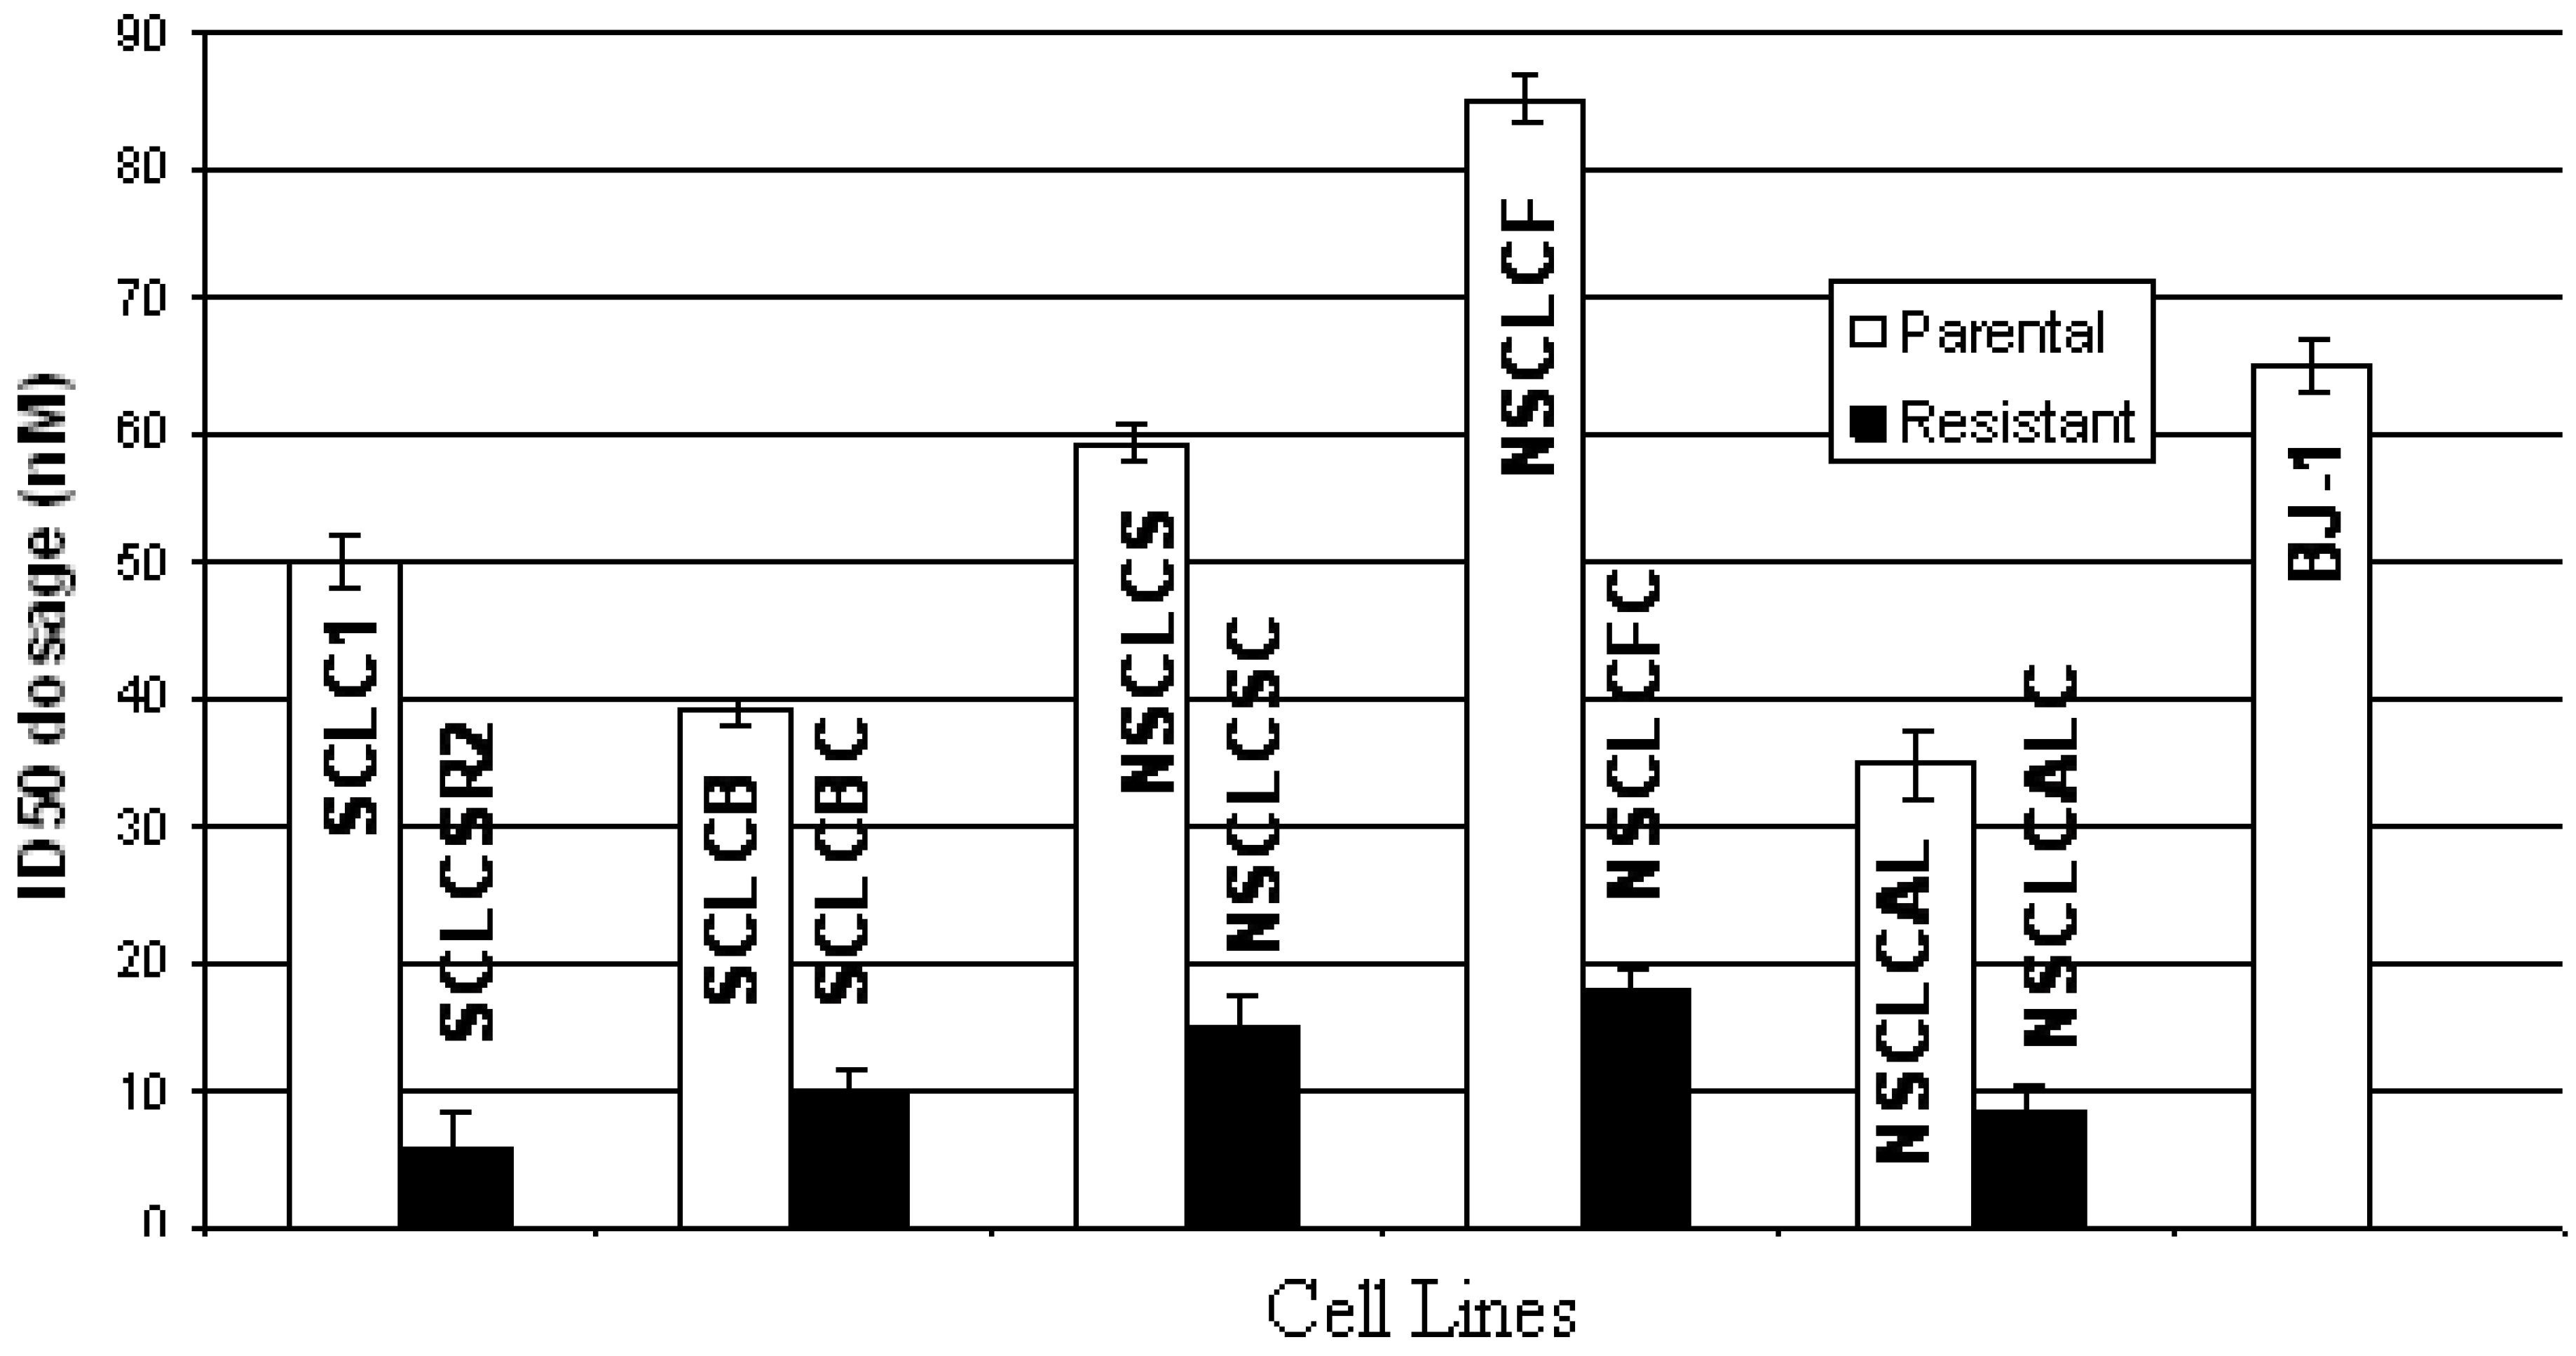
Our results clearly demonstrated that elesclomol selectively kills cisplatin resistant cells. The growth inhibitory dosages (ID
50) of elesclomol in cisplatin resistant cell lines are 4–10 times lower than their parental cells counterpart. We have also measured cell death and caspase activity by flow cytometry. Cell death resulting from the addition of 10 nM of elesclomol ranged from 60%–80% in cisplatin resistant cells and only 5%–10% in parental cells using the same dosage and only 2% cell death in BJ-1. A representative assay from each cell pair is shown in
Figure 4.
Figure 3.
ID50 dosage of elesclomol in parental and cisplatin resistant lung cancer cell lines. (SD of three experiments, average p values < 0.005; parental vs. resistant). BJ-1 was used as control.
Figure 3.
ID50 dosage of elesclomol in parental and cisplatin resistant lung cancer cell lines. (SD of three experiments, average p values < 0.005; parental vs. resistant). BJ-1 was used as control.
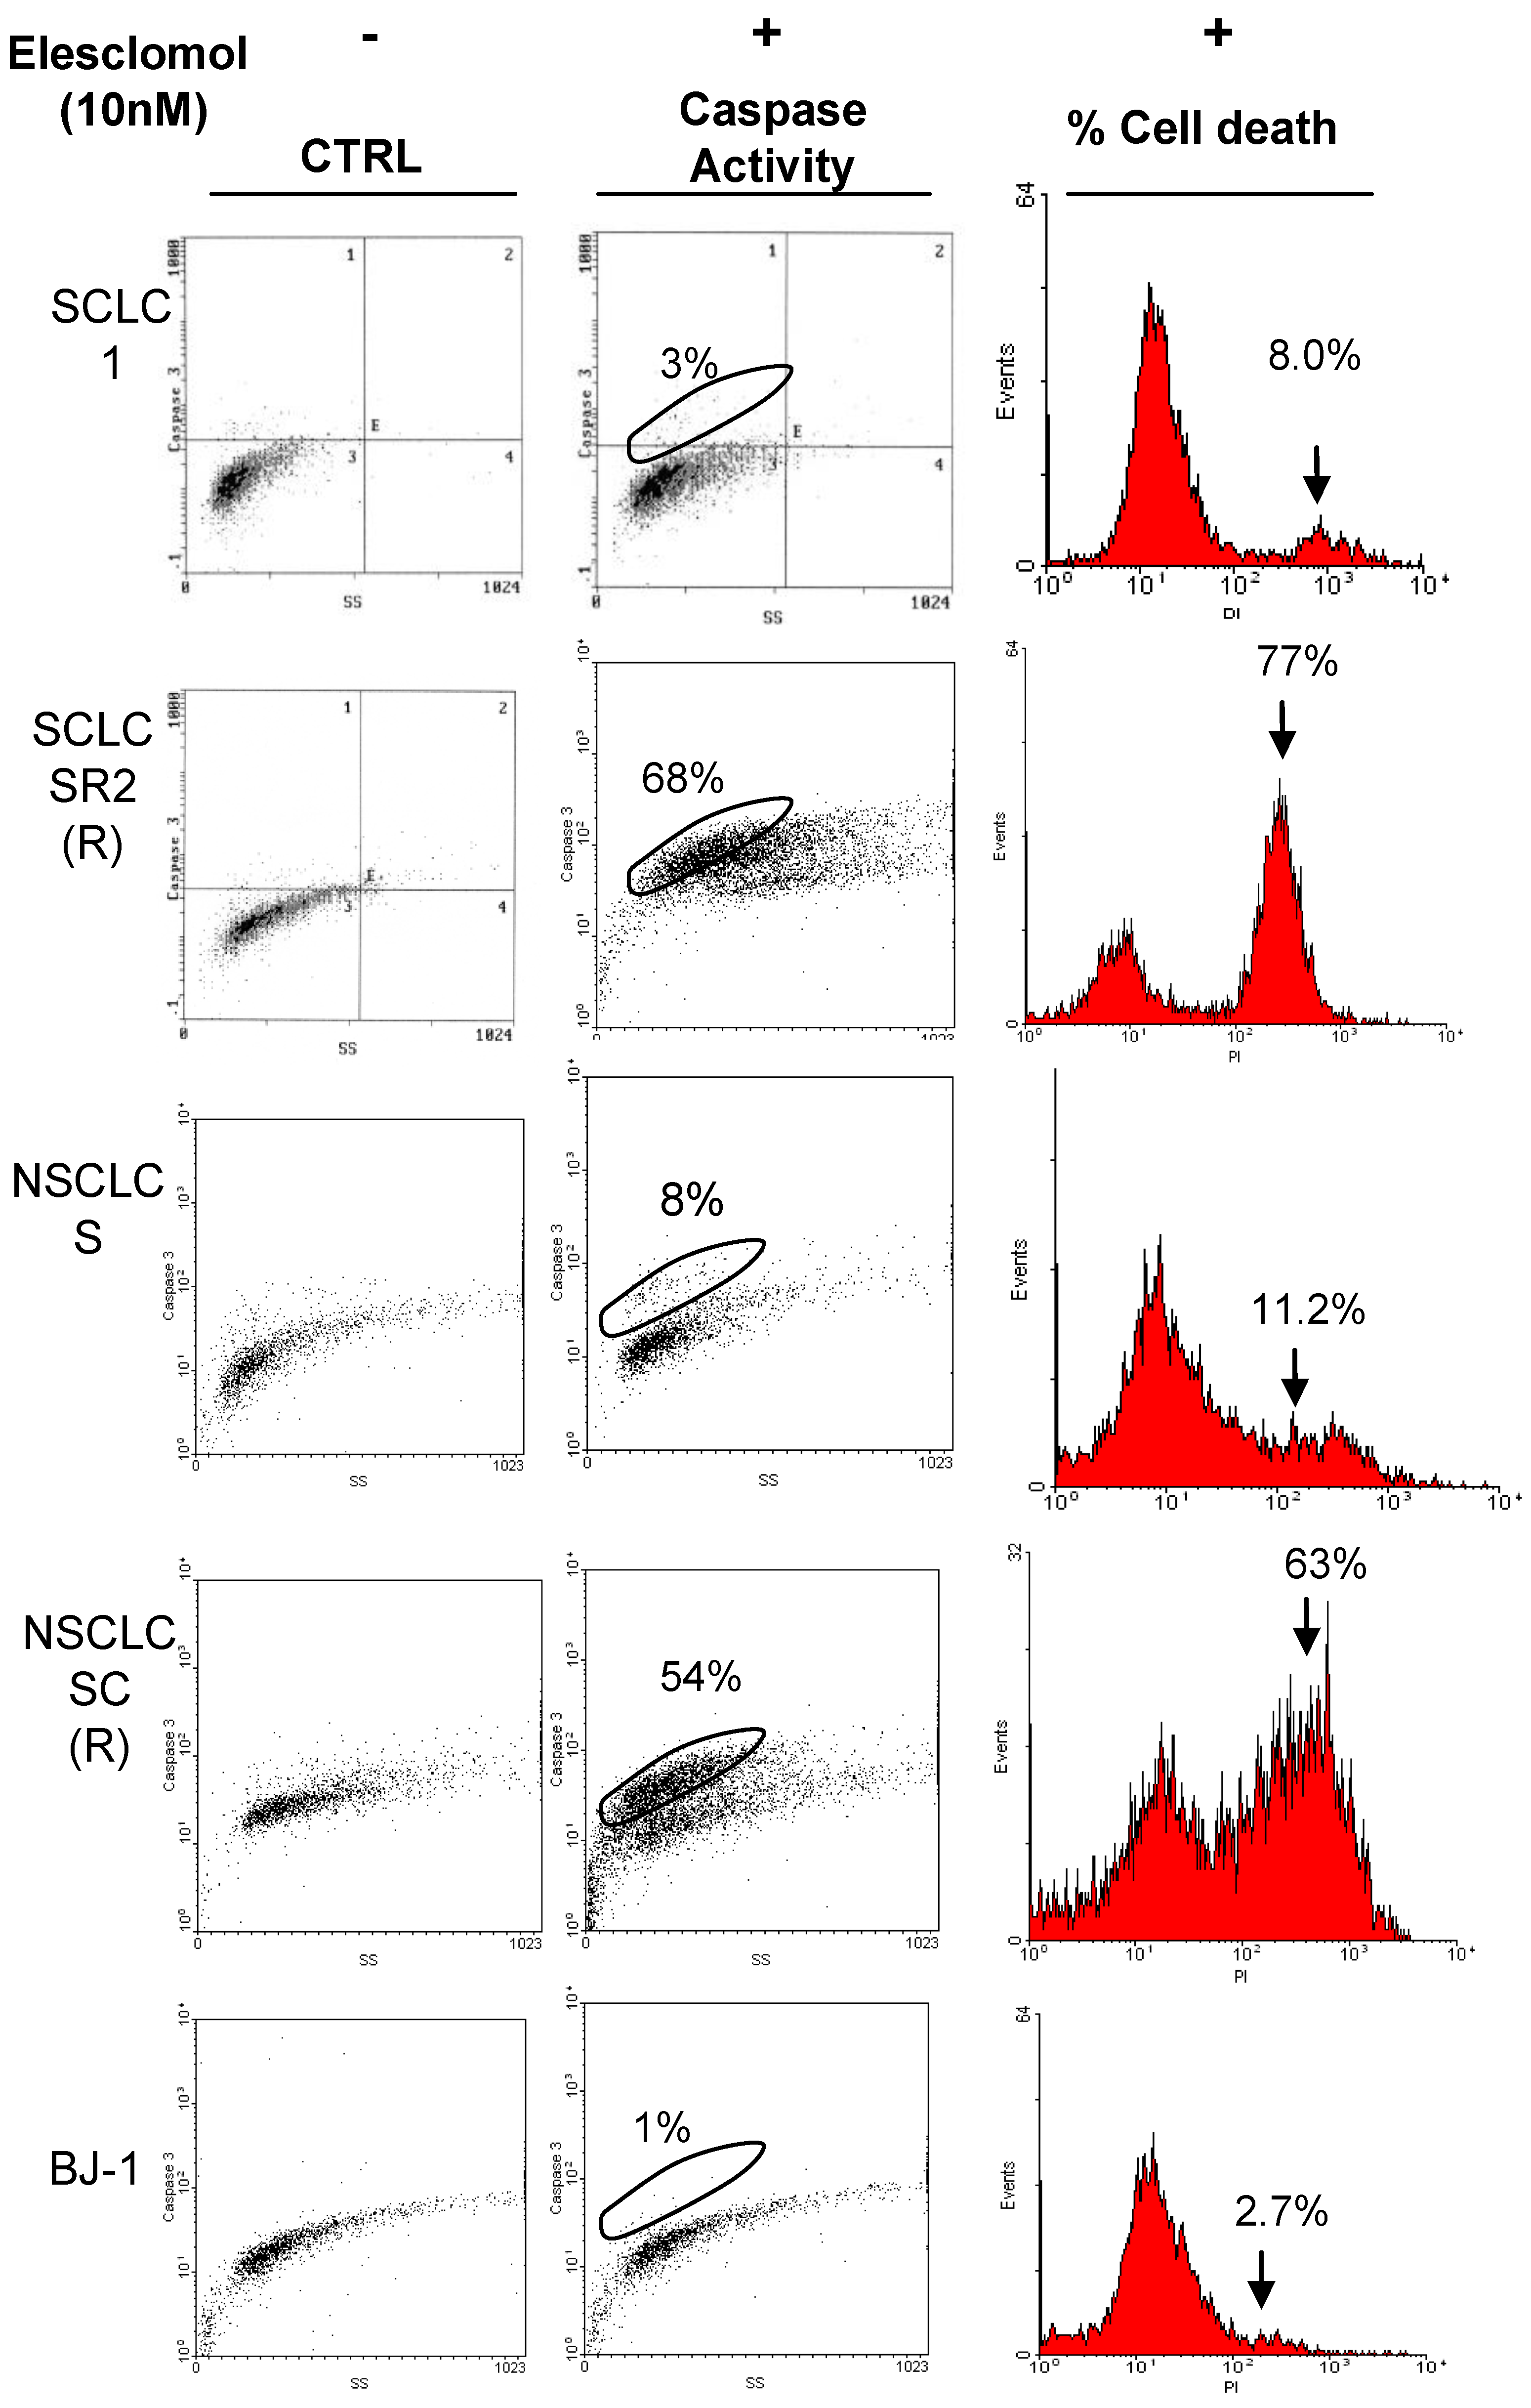
Figure 4.
Elesclomol greatly stimulates caspase activity and cell death in cisplatin resistant cell line. Representative groups of SCLC and NSCLC were treated with 10 nM of elesclomol for 48 h and followed by caspase activity probe FMK-Fluoroscein. The percentage of caspase activation is correlated with percentage of cell death which was detected by PI staining. Elesclomol also has no effect against normal fibroblast BJ-1. Each dot plots and histograms are representative of two experiments.
2.3. Elesclomol Increased Levels of ROS and H2O2 in Cisplatin Resistant Cell Lines
To determine whether ROS is increased after treatment with elesclomol, we have treated these two pairs of SCLC, NSCLC, and BJ-1 cells with 10 nM of elesclomol for 24h. Despite the short period of exposure time, the ROS levels are increased more in resistant cells after elesclomol treatment while no significant change occurred in parental cells or normal cells, BJ-1 (
Figure 5).
To further confirm this finding, we have also assayed H
2O
2 production pre and post elesclomol treatment. The results are shown in
Figure 6. Similar to ROS, H
2O
2 production also increased after treatment with elesclomol in cisplatin resistant cells. In contrast, H
2O
2 production is decreased in parental cells and normal cells when treated with this ROS inducing agent. These results are interesting since parental cells and normal cells may have the ability to effectively turn on the antioxidant system to eliminate H
2O
2 accumulation.
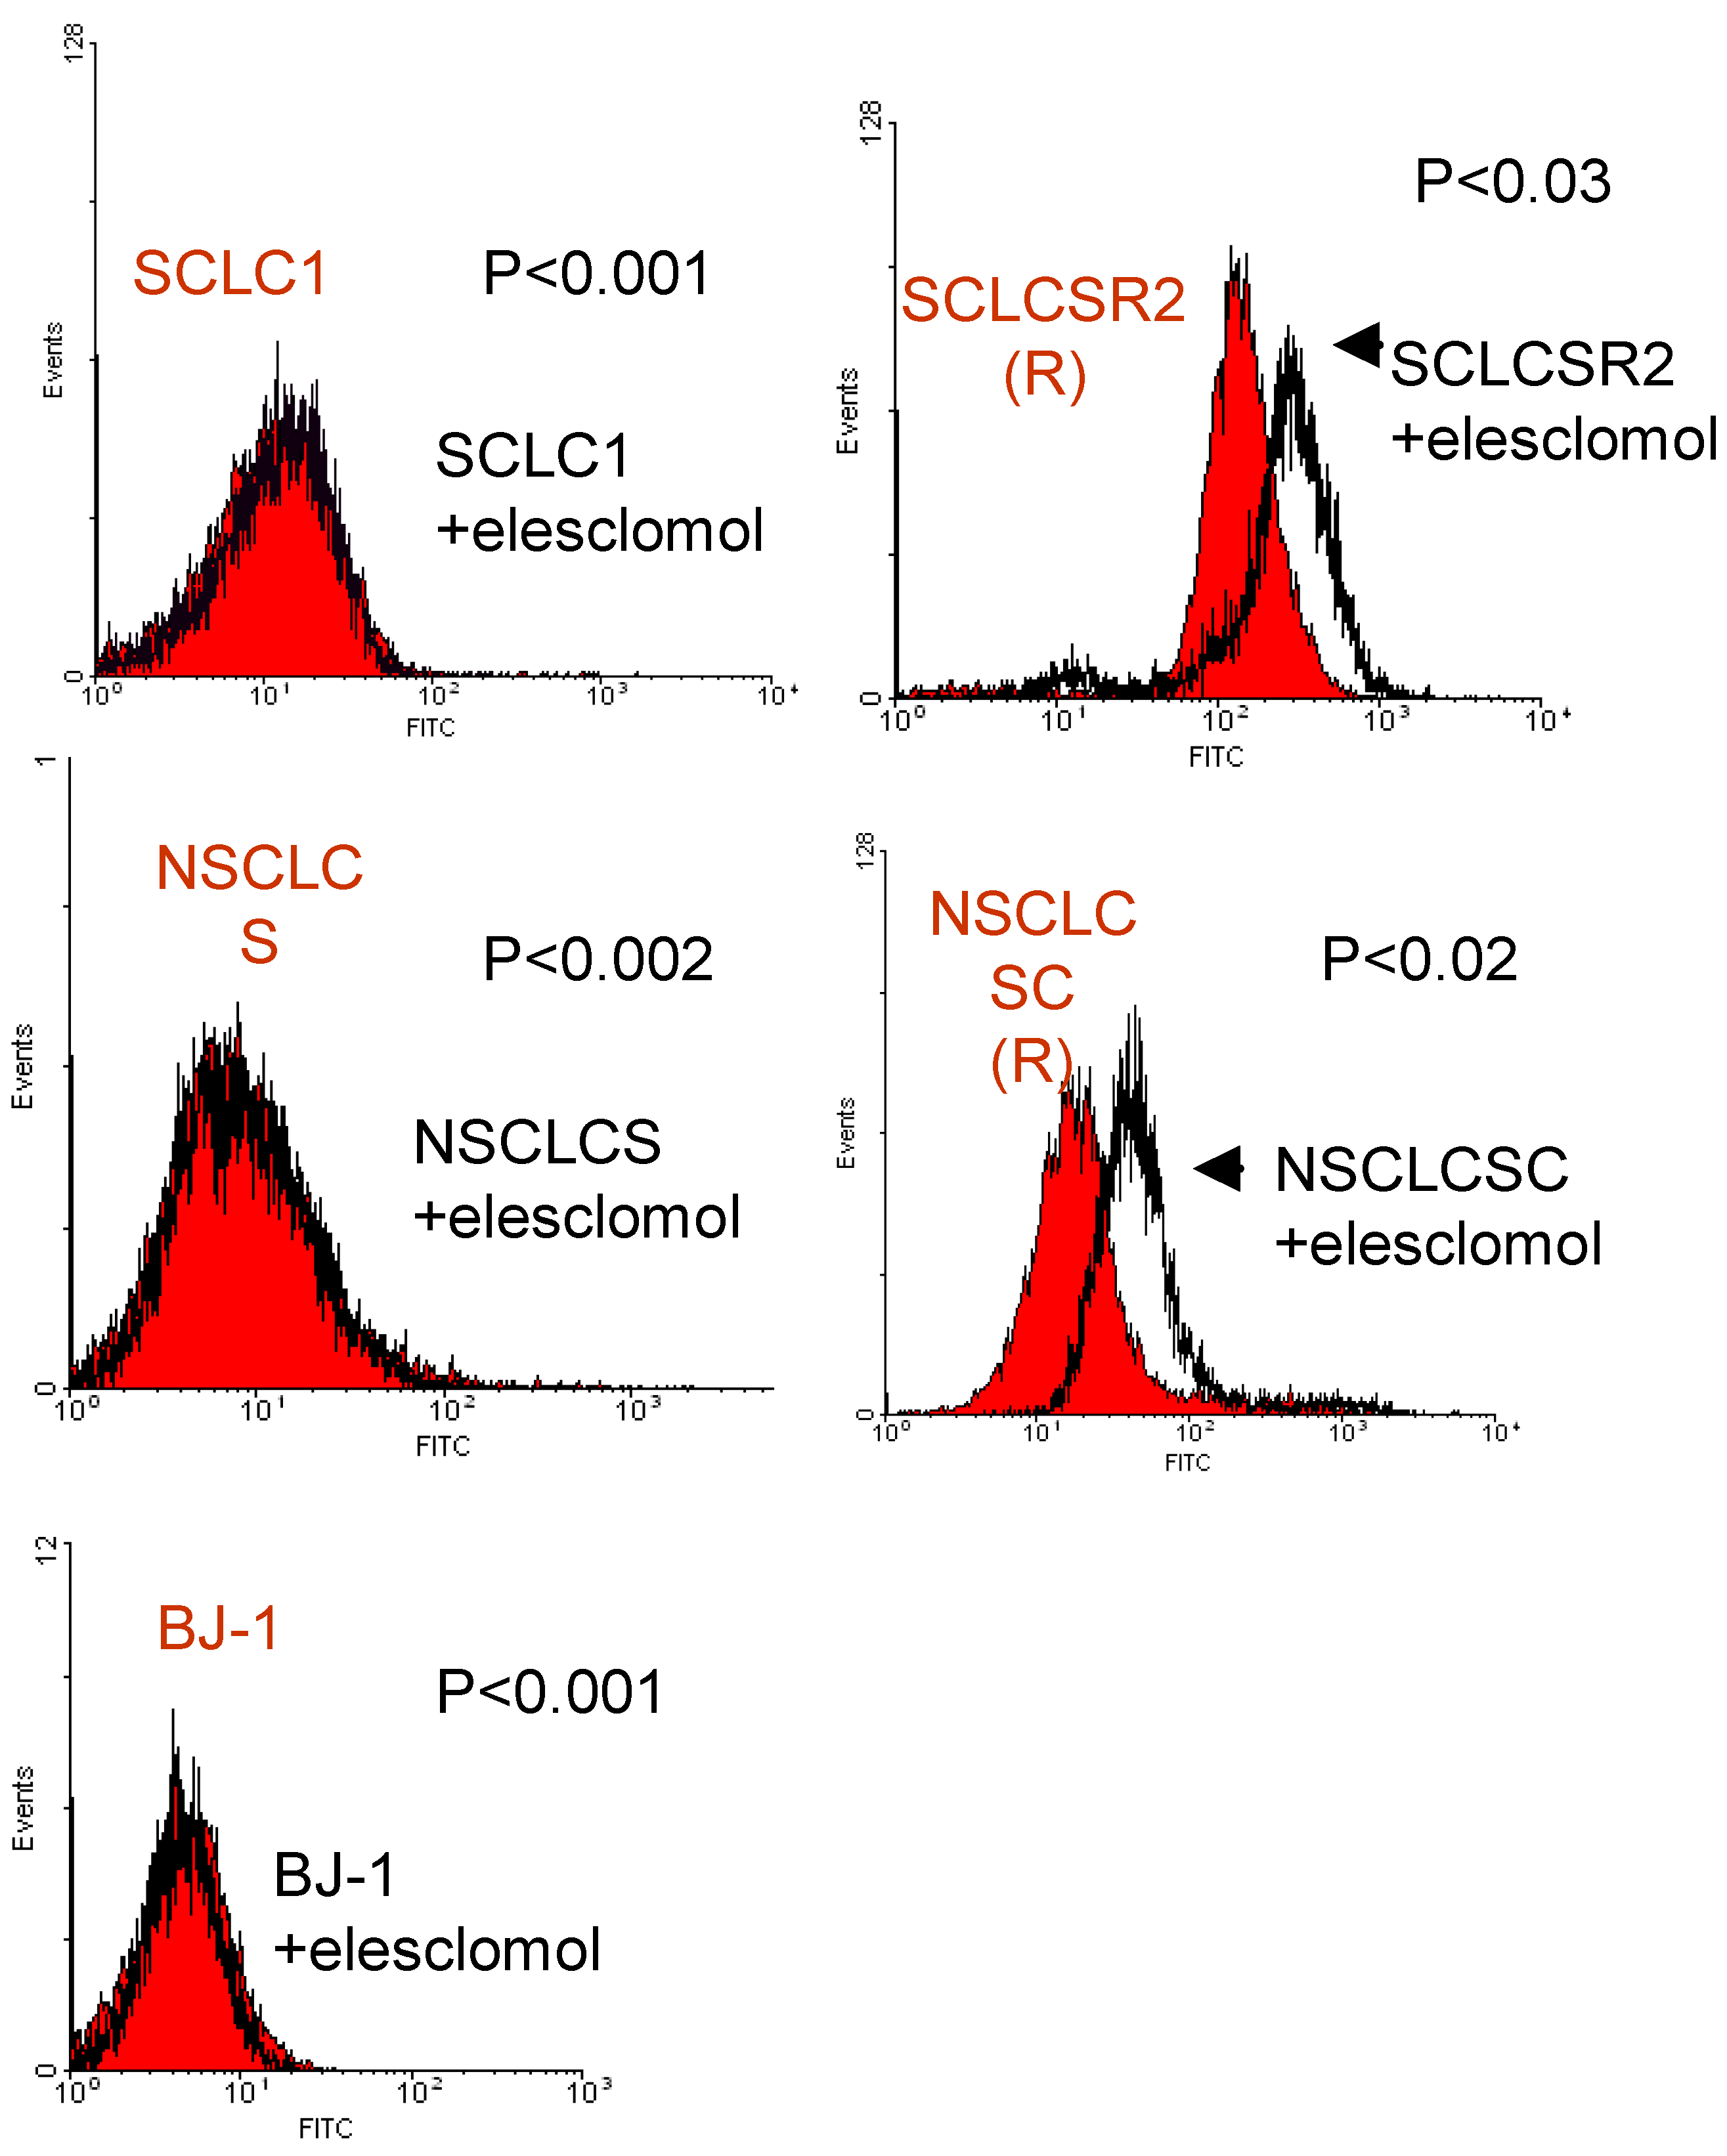
Figure 5.
Flow cytometry analysis of ROS in a pair of SCLC and NSCLC cell lines detected by DCF-DA probe. 10 nM of elesclomol for 24 h greatly induced intracellular ROS levels in the resistant (R) cell lines SCLCSR2 and NSCLCSC whereas in parental cell lines (SCLC1 and NSCLCS) and BJ-1, no significant increase of ROS was seen. Each histogram is representative of three experiments; (nontreated vs. treated).
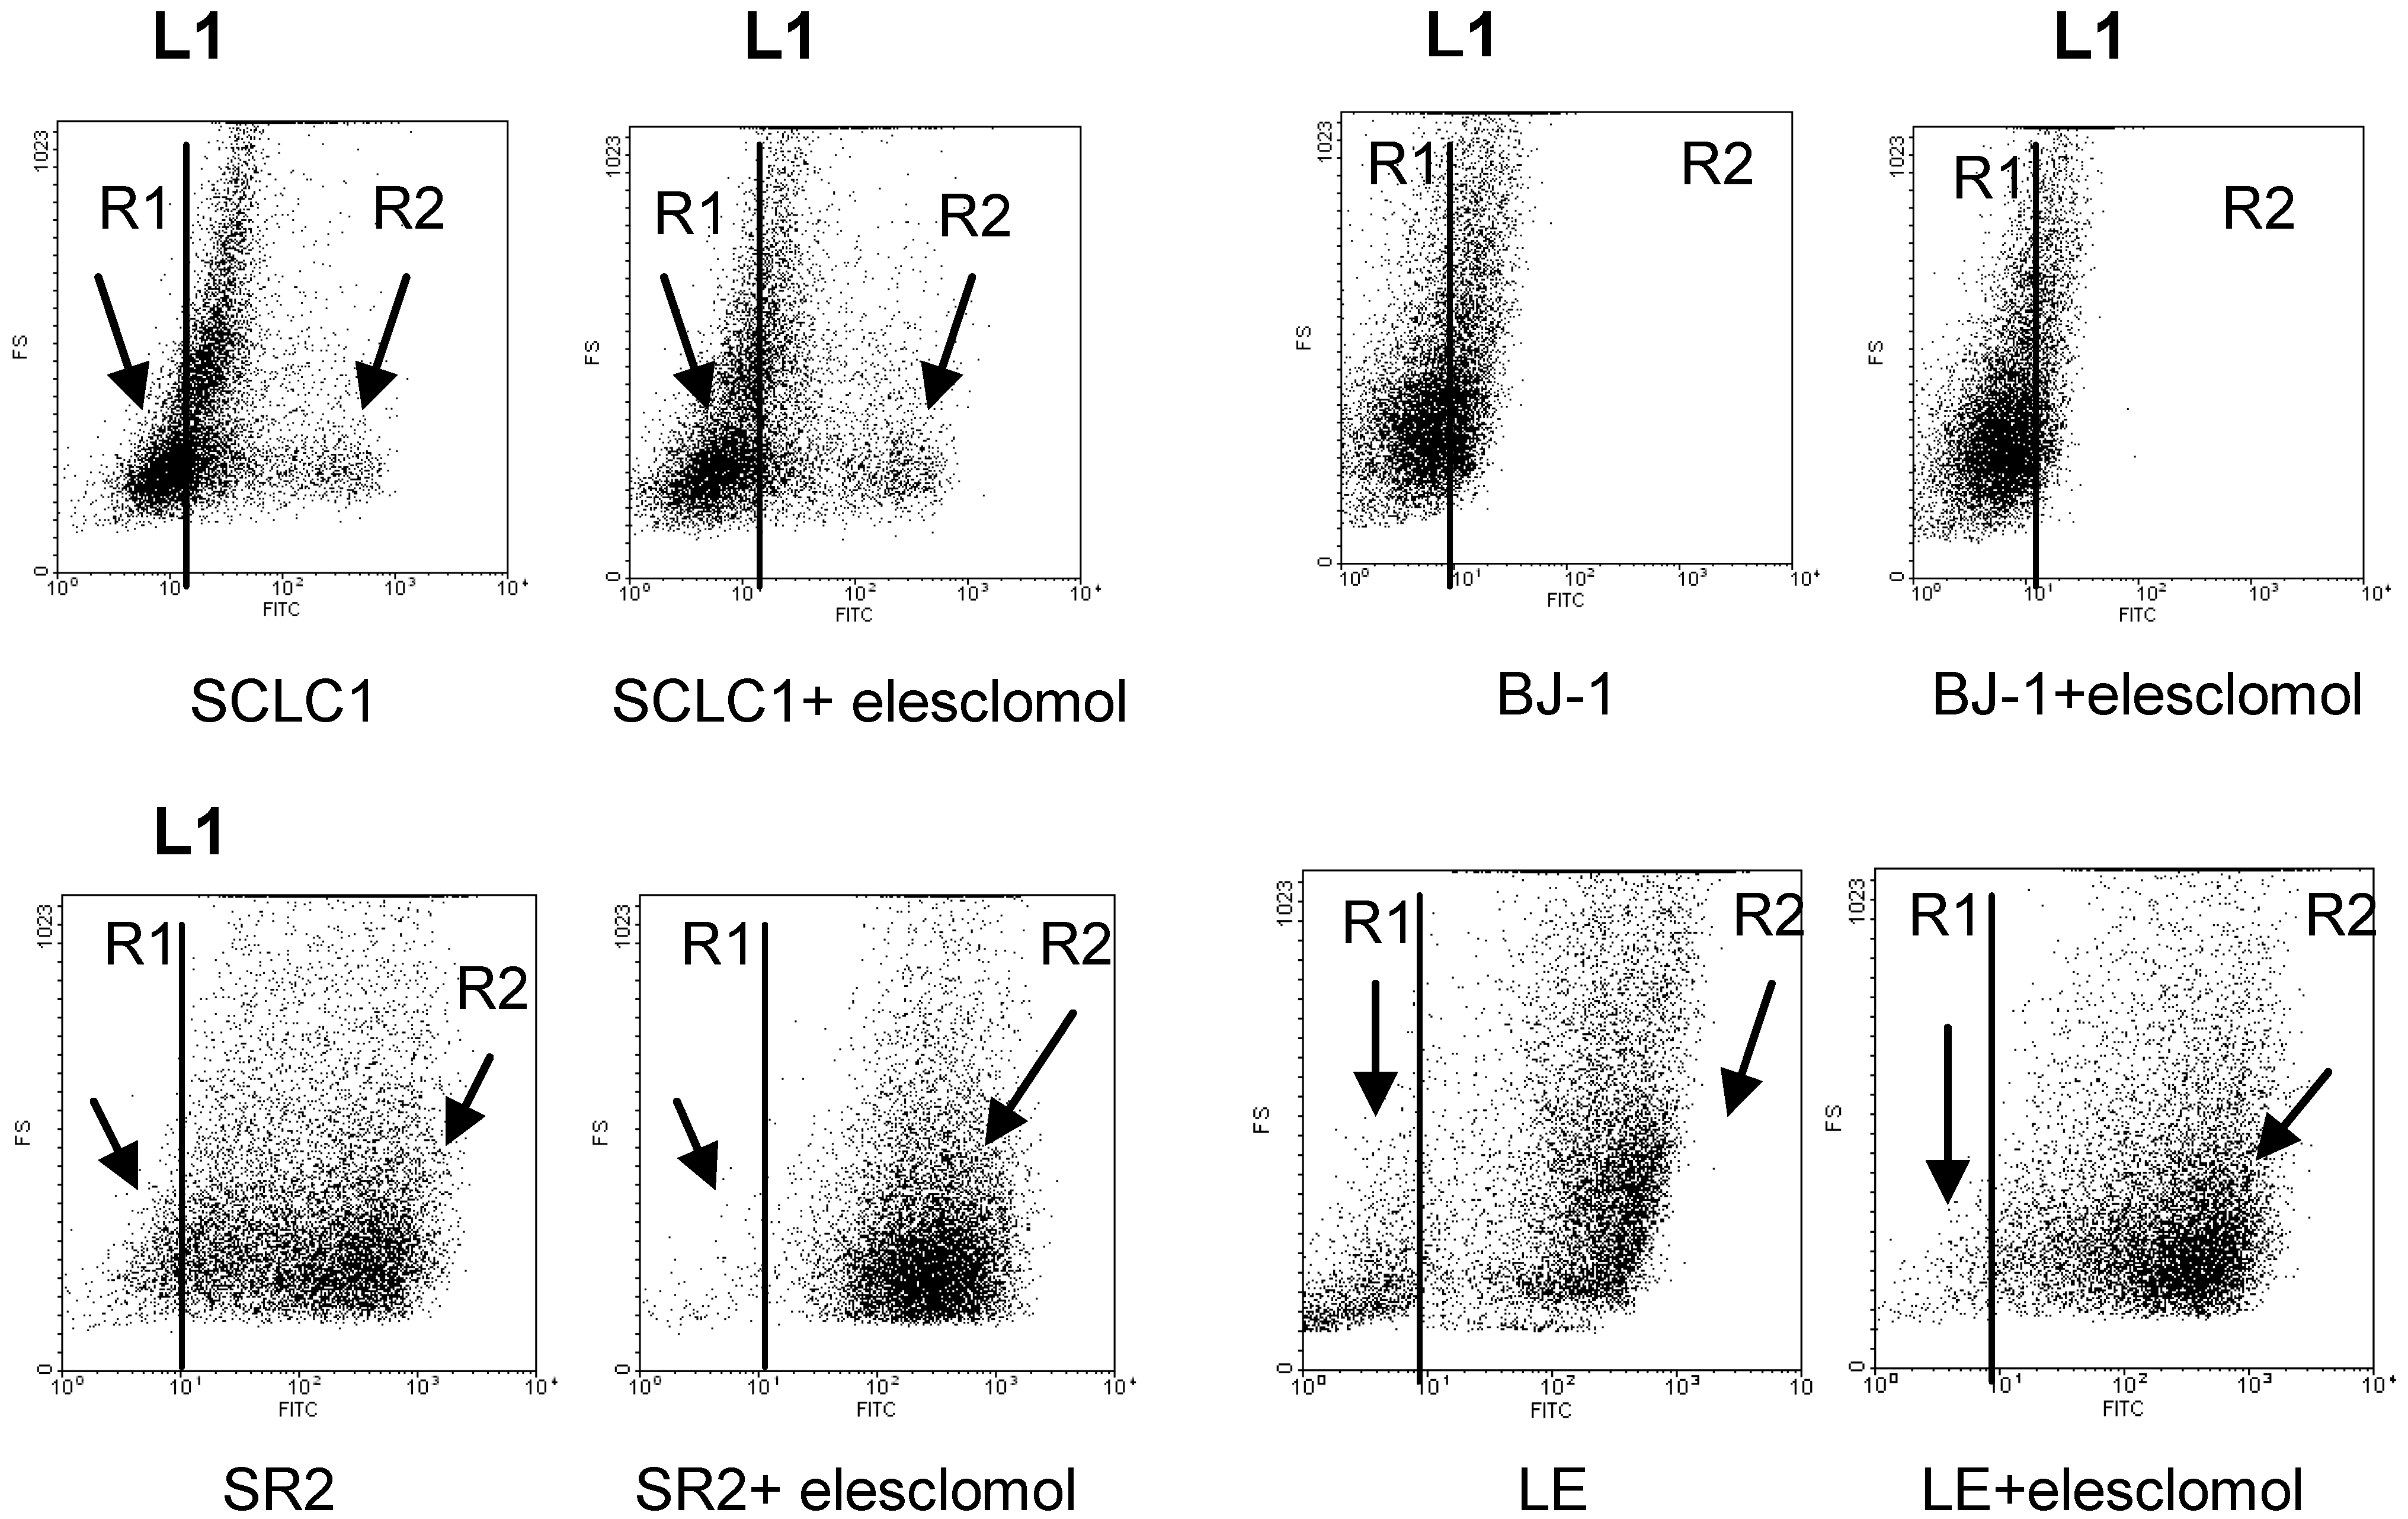
Figure 6.
Flow cytometry analysis of H2O2 in lung cancer cell lines detected by APFB probe indicated that there are 2 populations of cell: R1 (low H2O2) and R2 (high H2O2). The levels of H2O2 decreased in parental lines (SCLC1) and normal cells (BJ-1) when treated with 10 nM of elesclomol for 24 h as indicated by the population of cells moved to the left of line L1 (more R1 population). SR2 and LE have more R2 population than cisplatin sensitive cells. Treatment with elesclomol increased the level of H2O2 production in the resistant cell line SR2 as well as in primary culture, LE as indicated by the shifting of R1 population to R2. Each dot plot is representative of three experiments (average P < 0.005; R1 vs. R2).
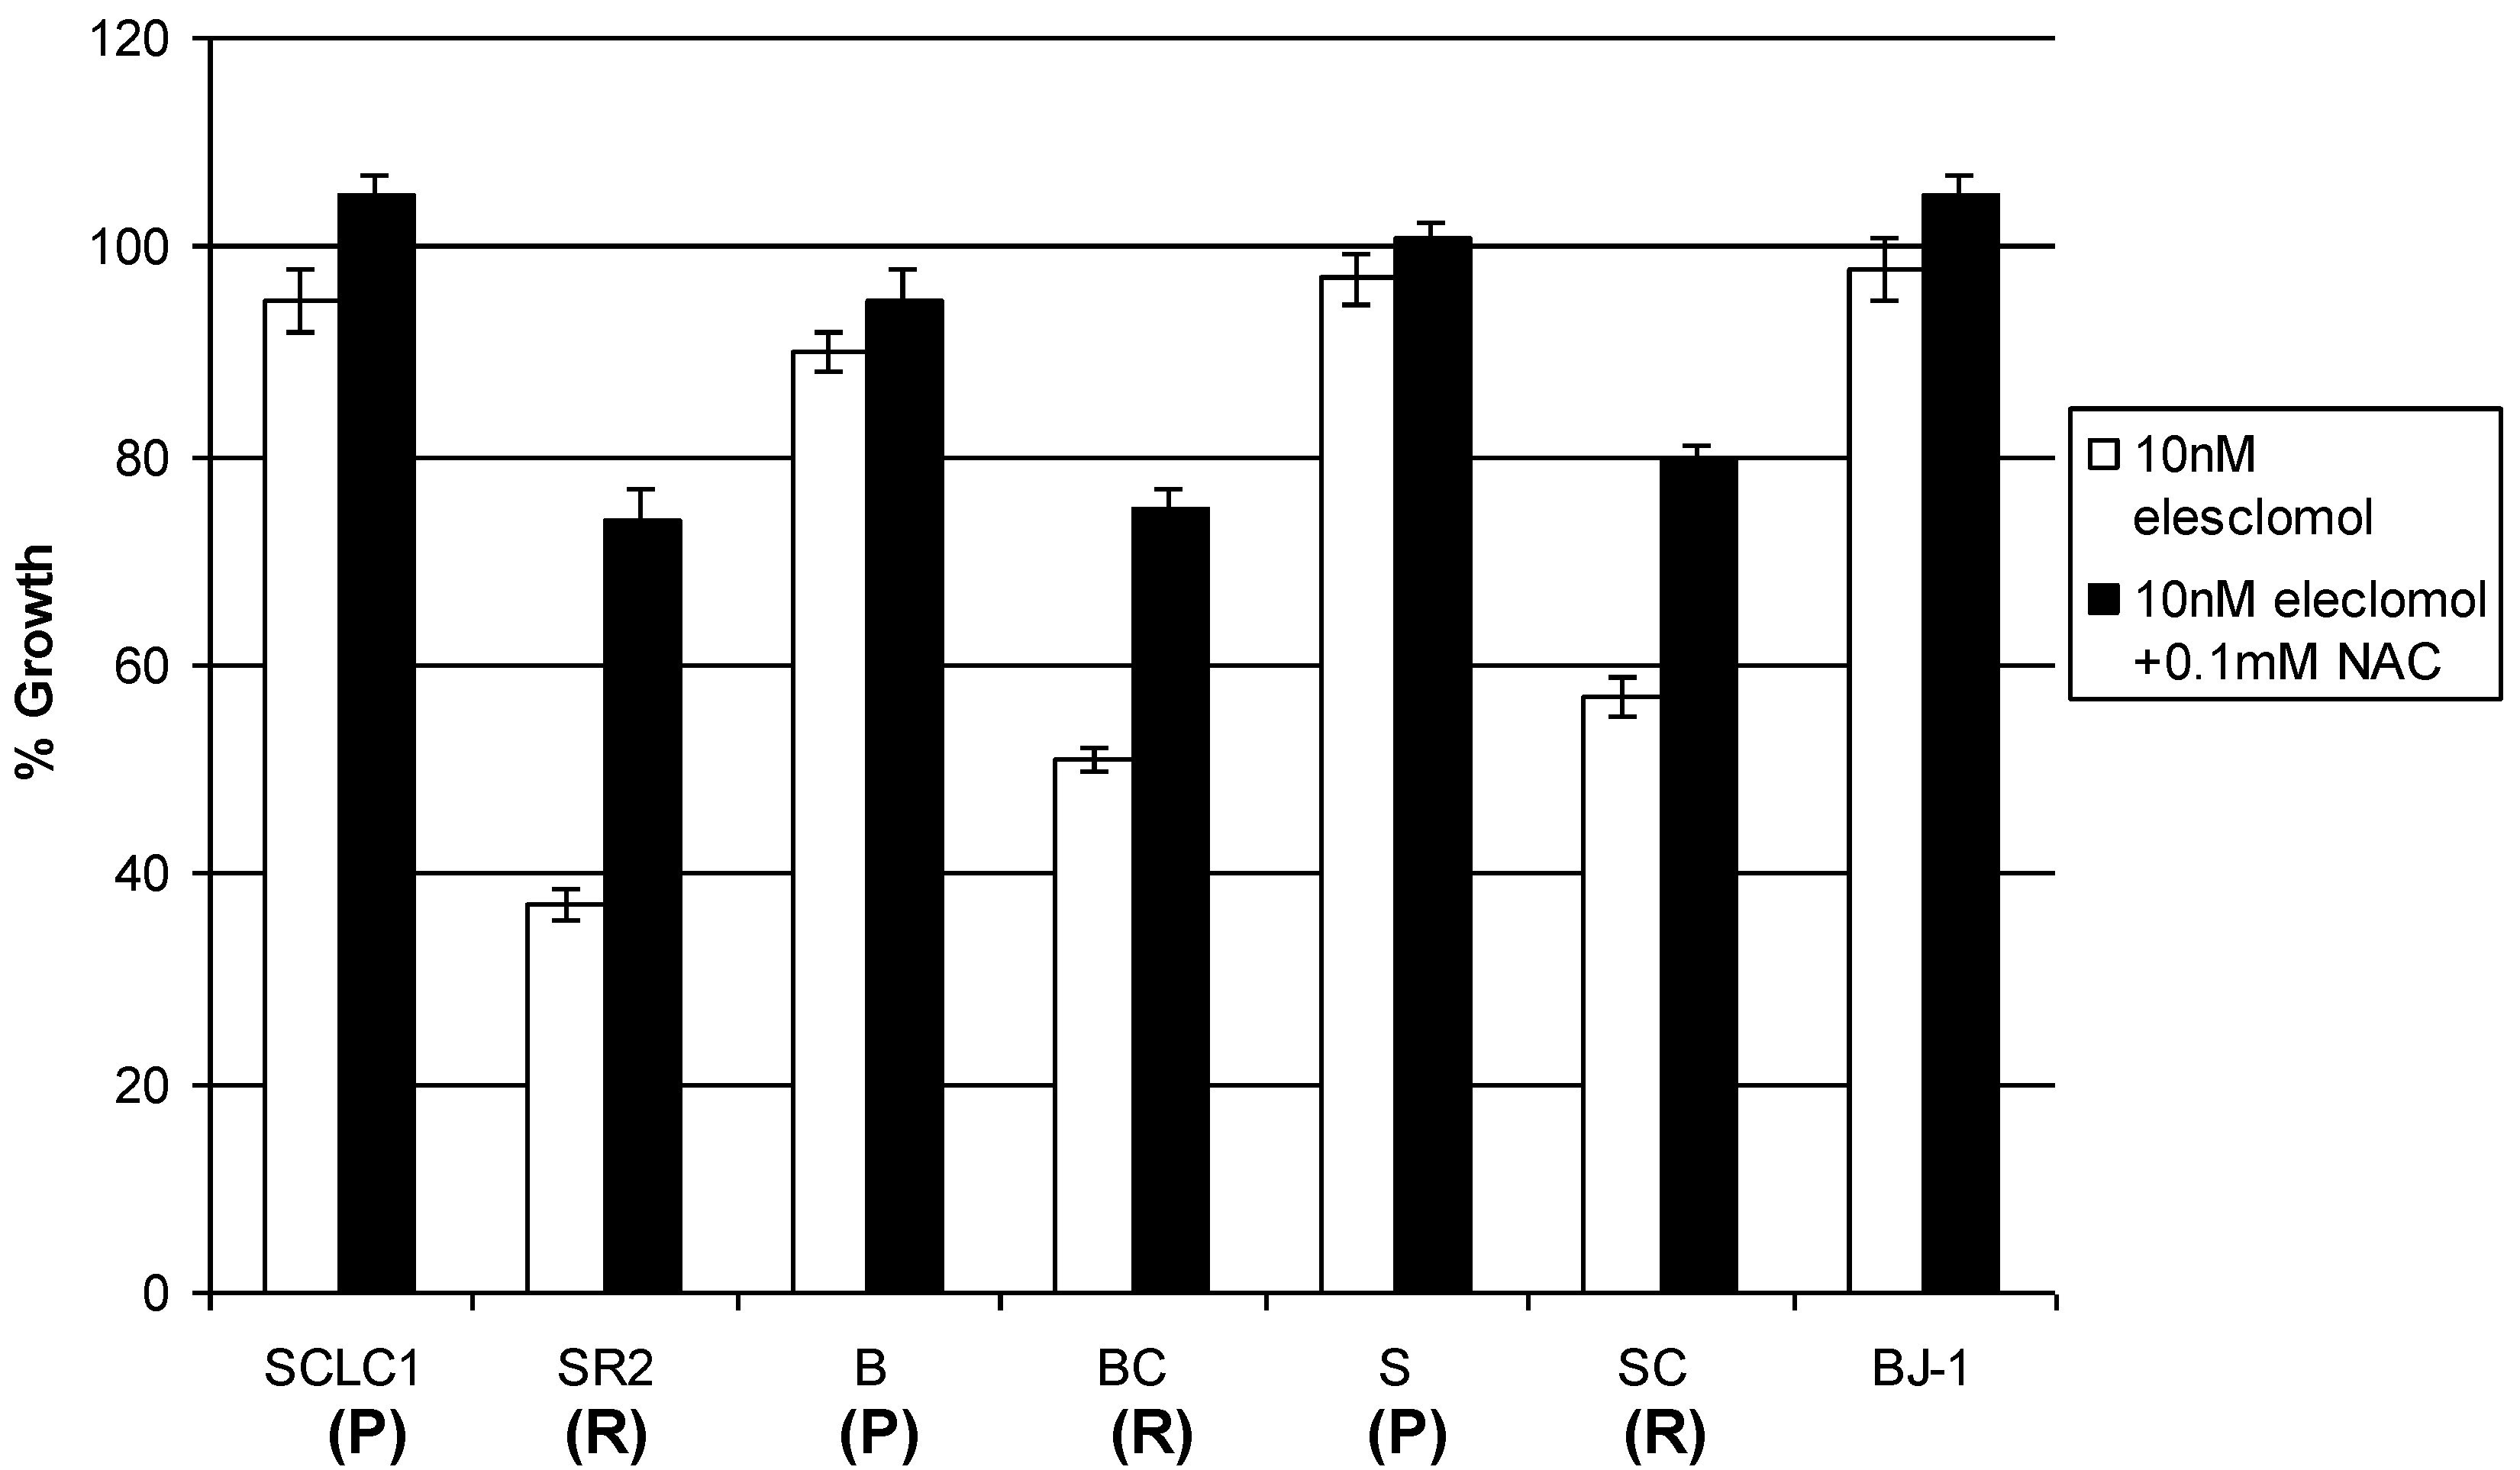
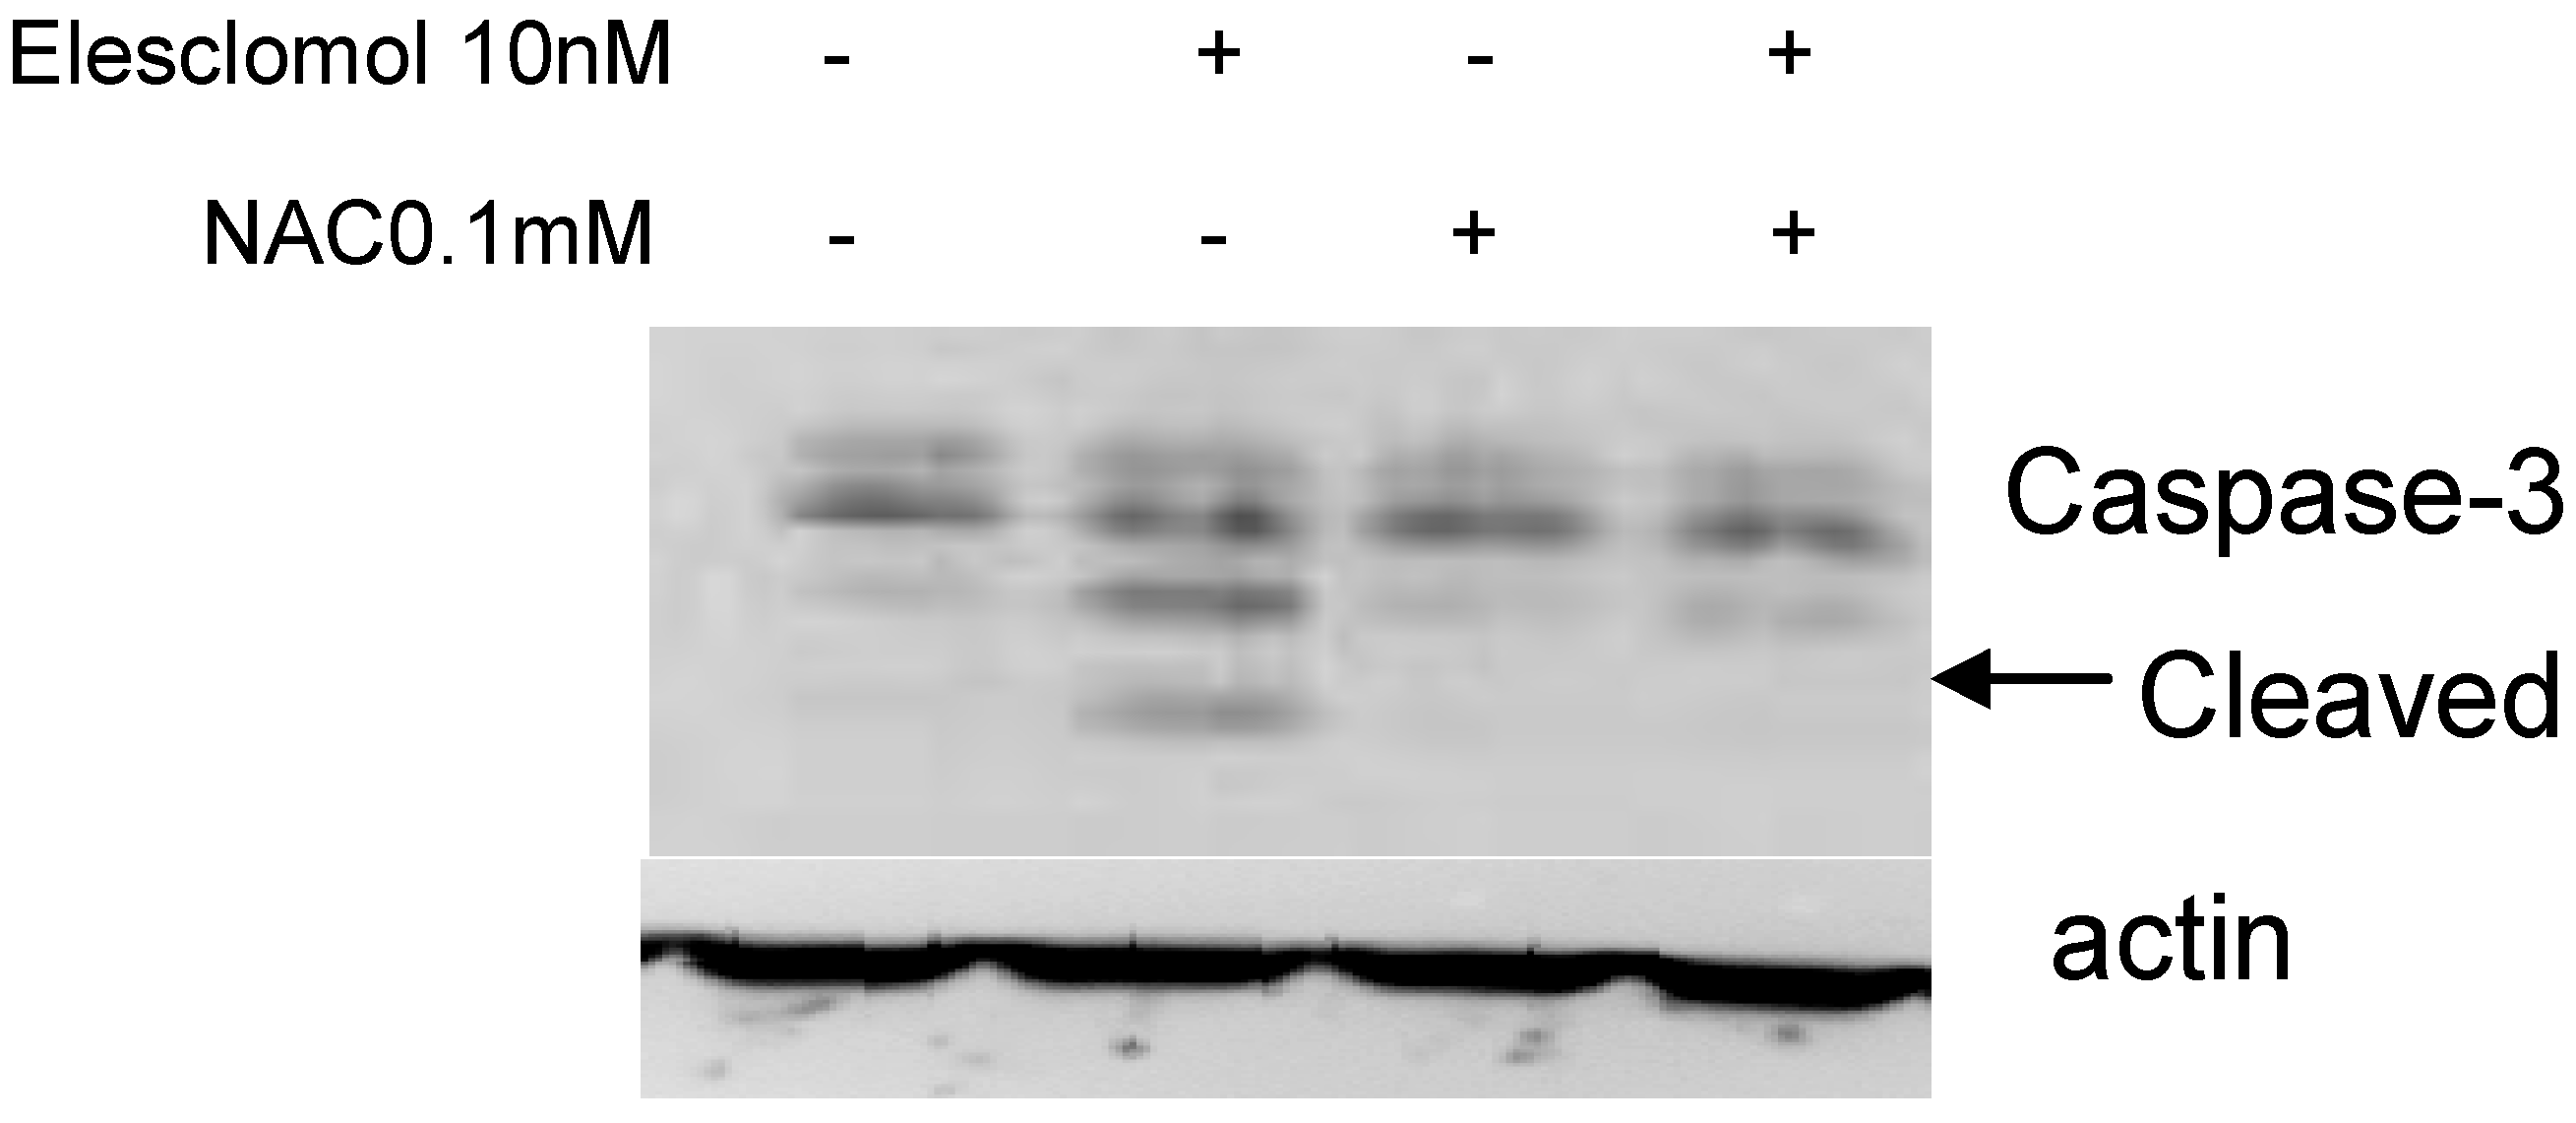
To further determine whether increasing ROS leads to cell death, we have cotreated a known antioxidant agent
N-acetylcysteine (NAC) with elesclomol and found that 0.1 mM of NAC can reverse the growth inhibitory effect of elesclomol as well as caspase-3 cleavage in cisplatin resistant cells (
Figure 7 and
Figure 8). Thus, our data further validate that elesclomol selectively kills cisplatin resistant lung cancer cells through increasing ROS.
2.4. The effect of Elesclomol on Antioxidant System
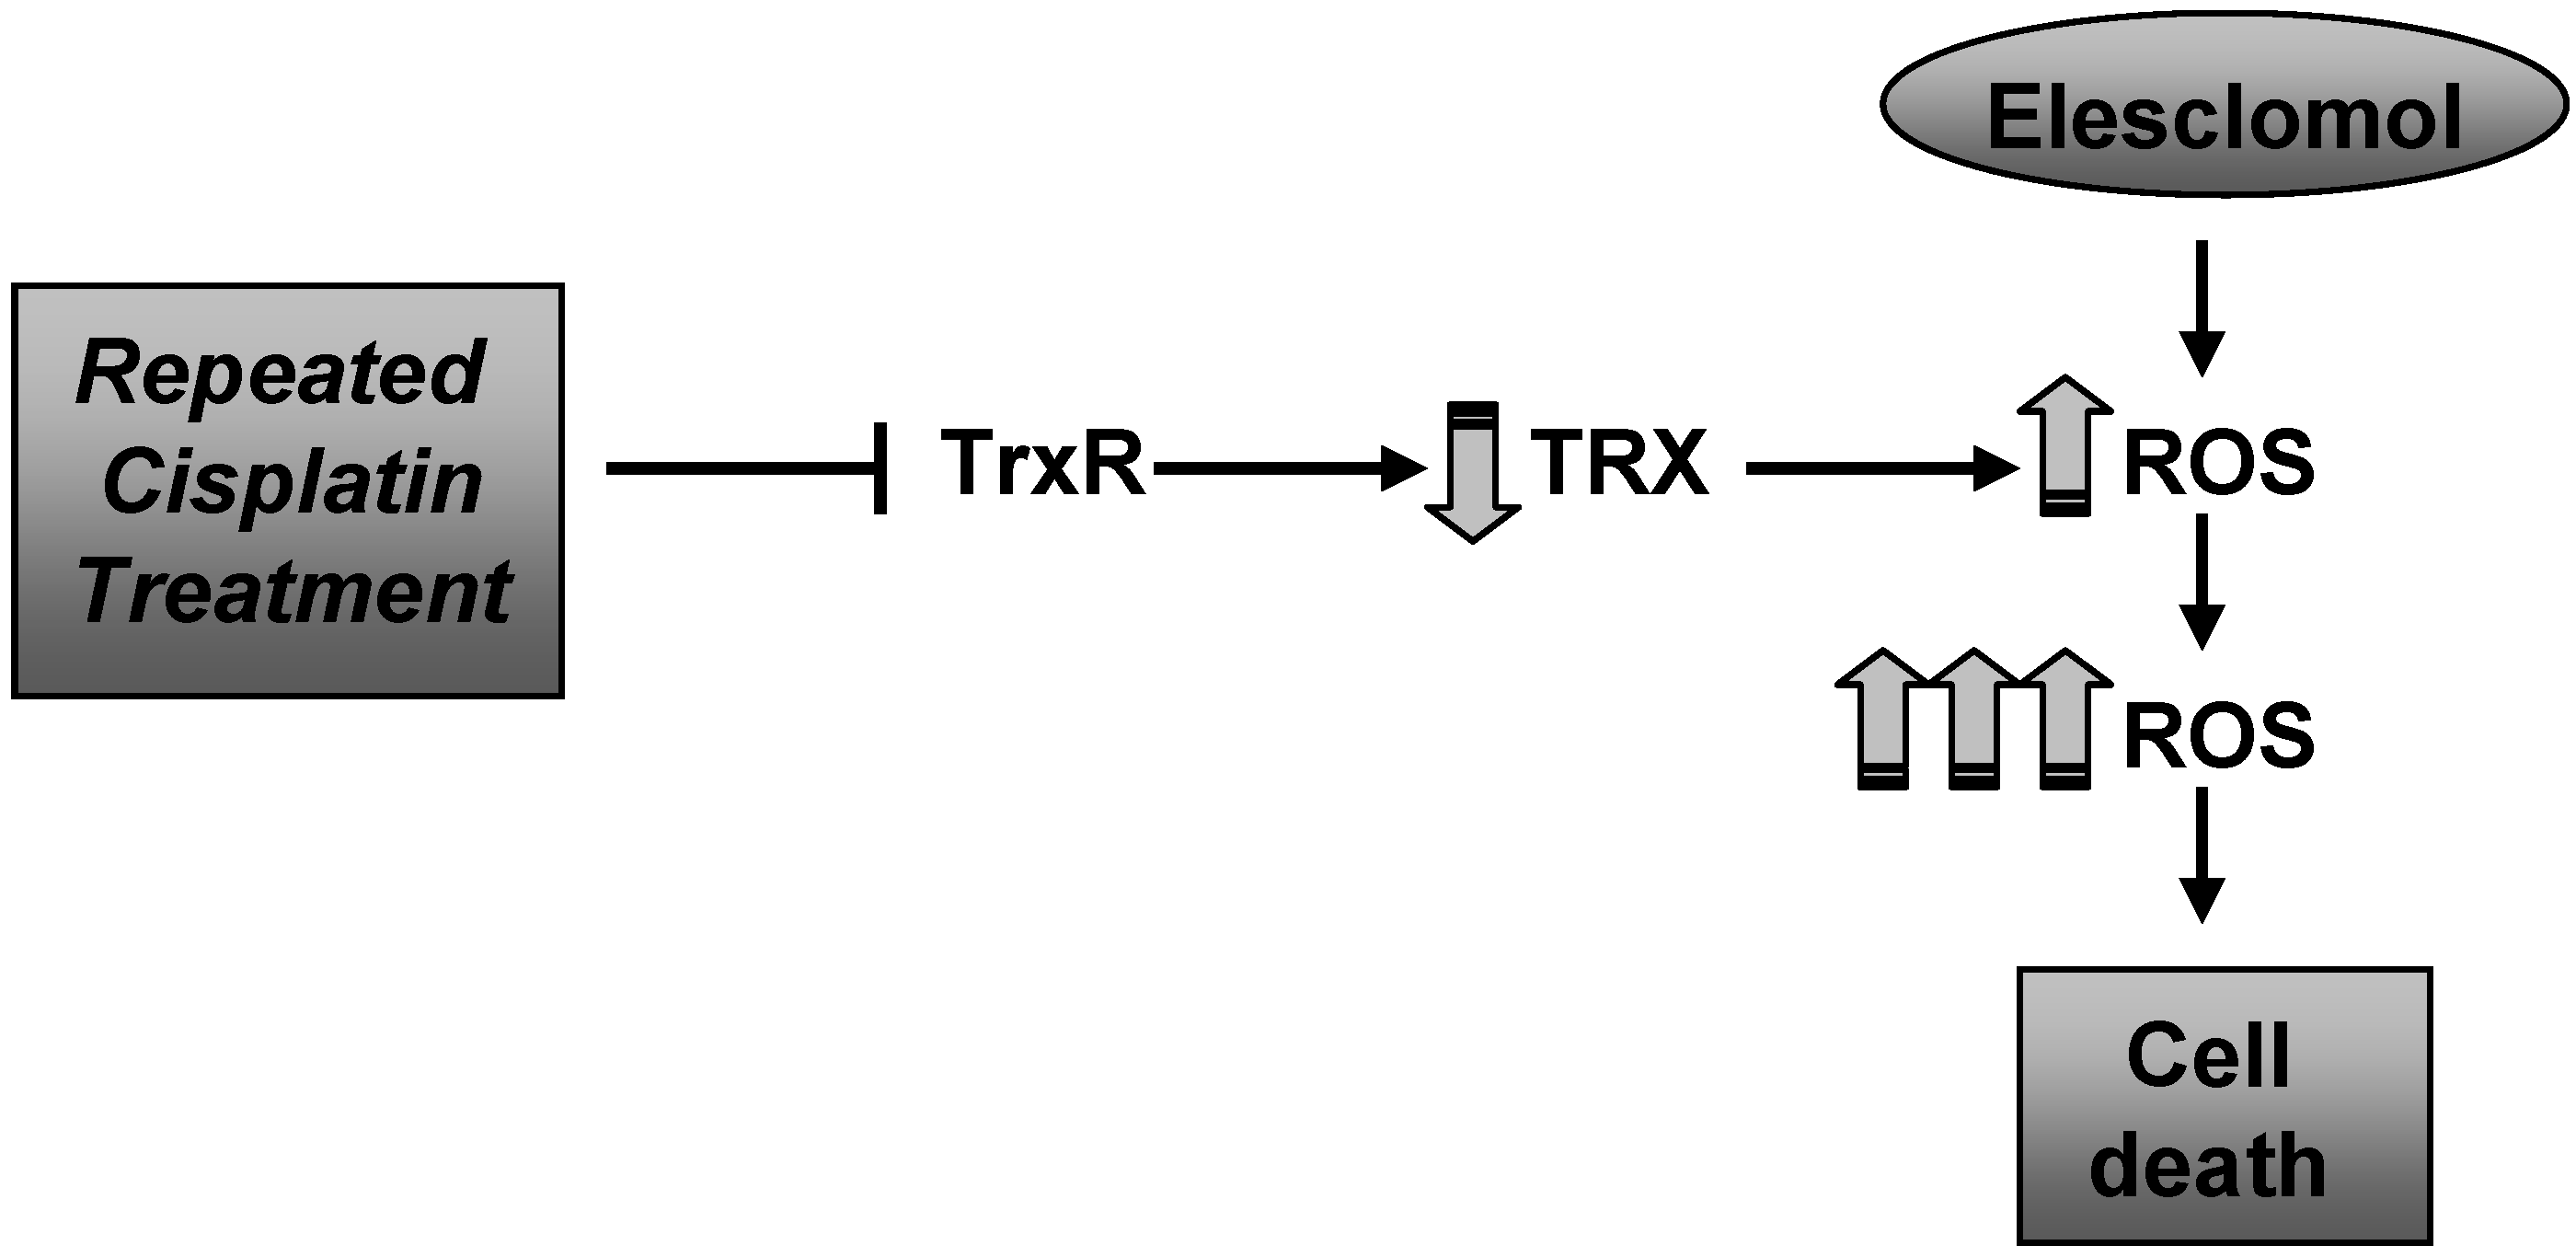
It has been previously reported by several laboratories that cisplatin as well as other alkylating agents inhibit TrxR [
1,
7,
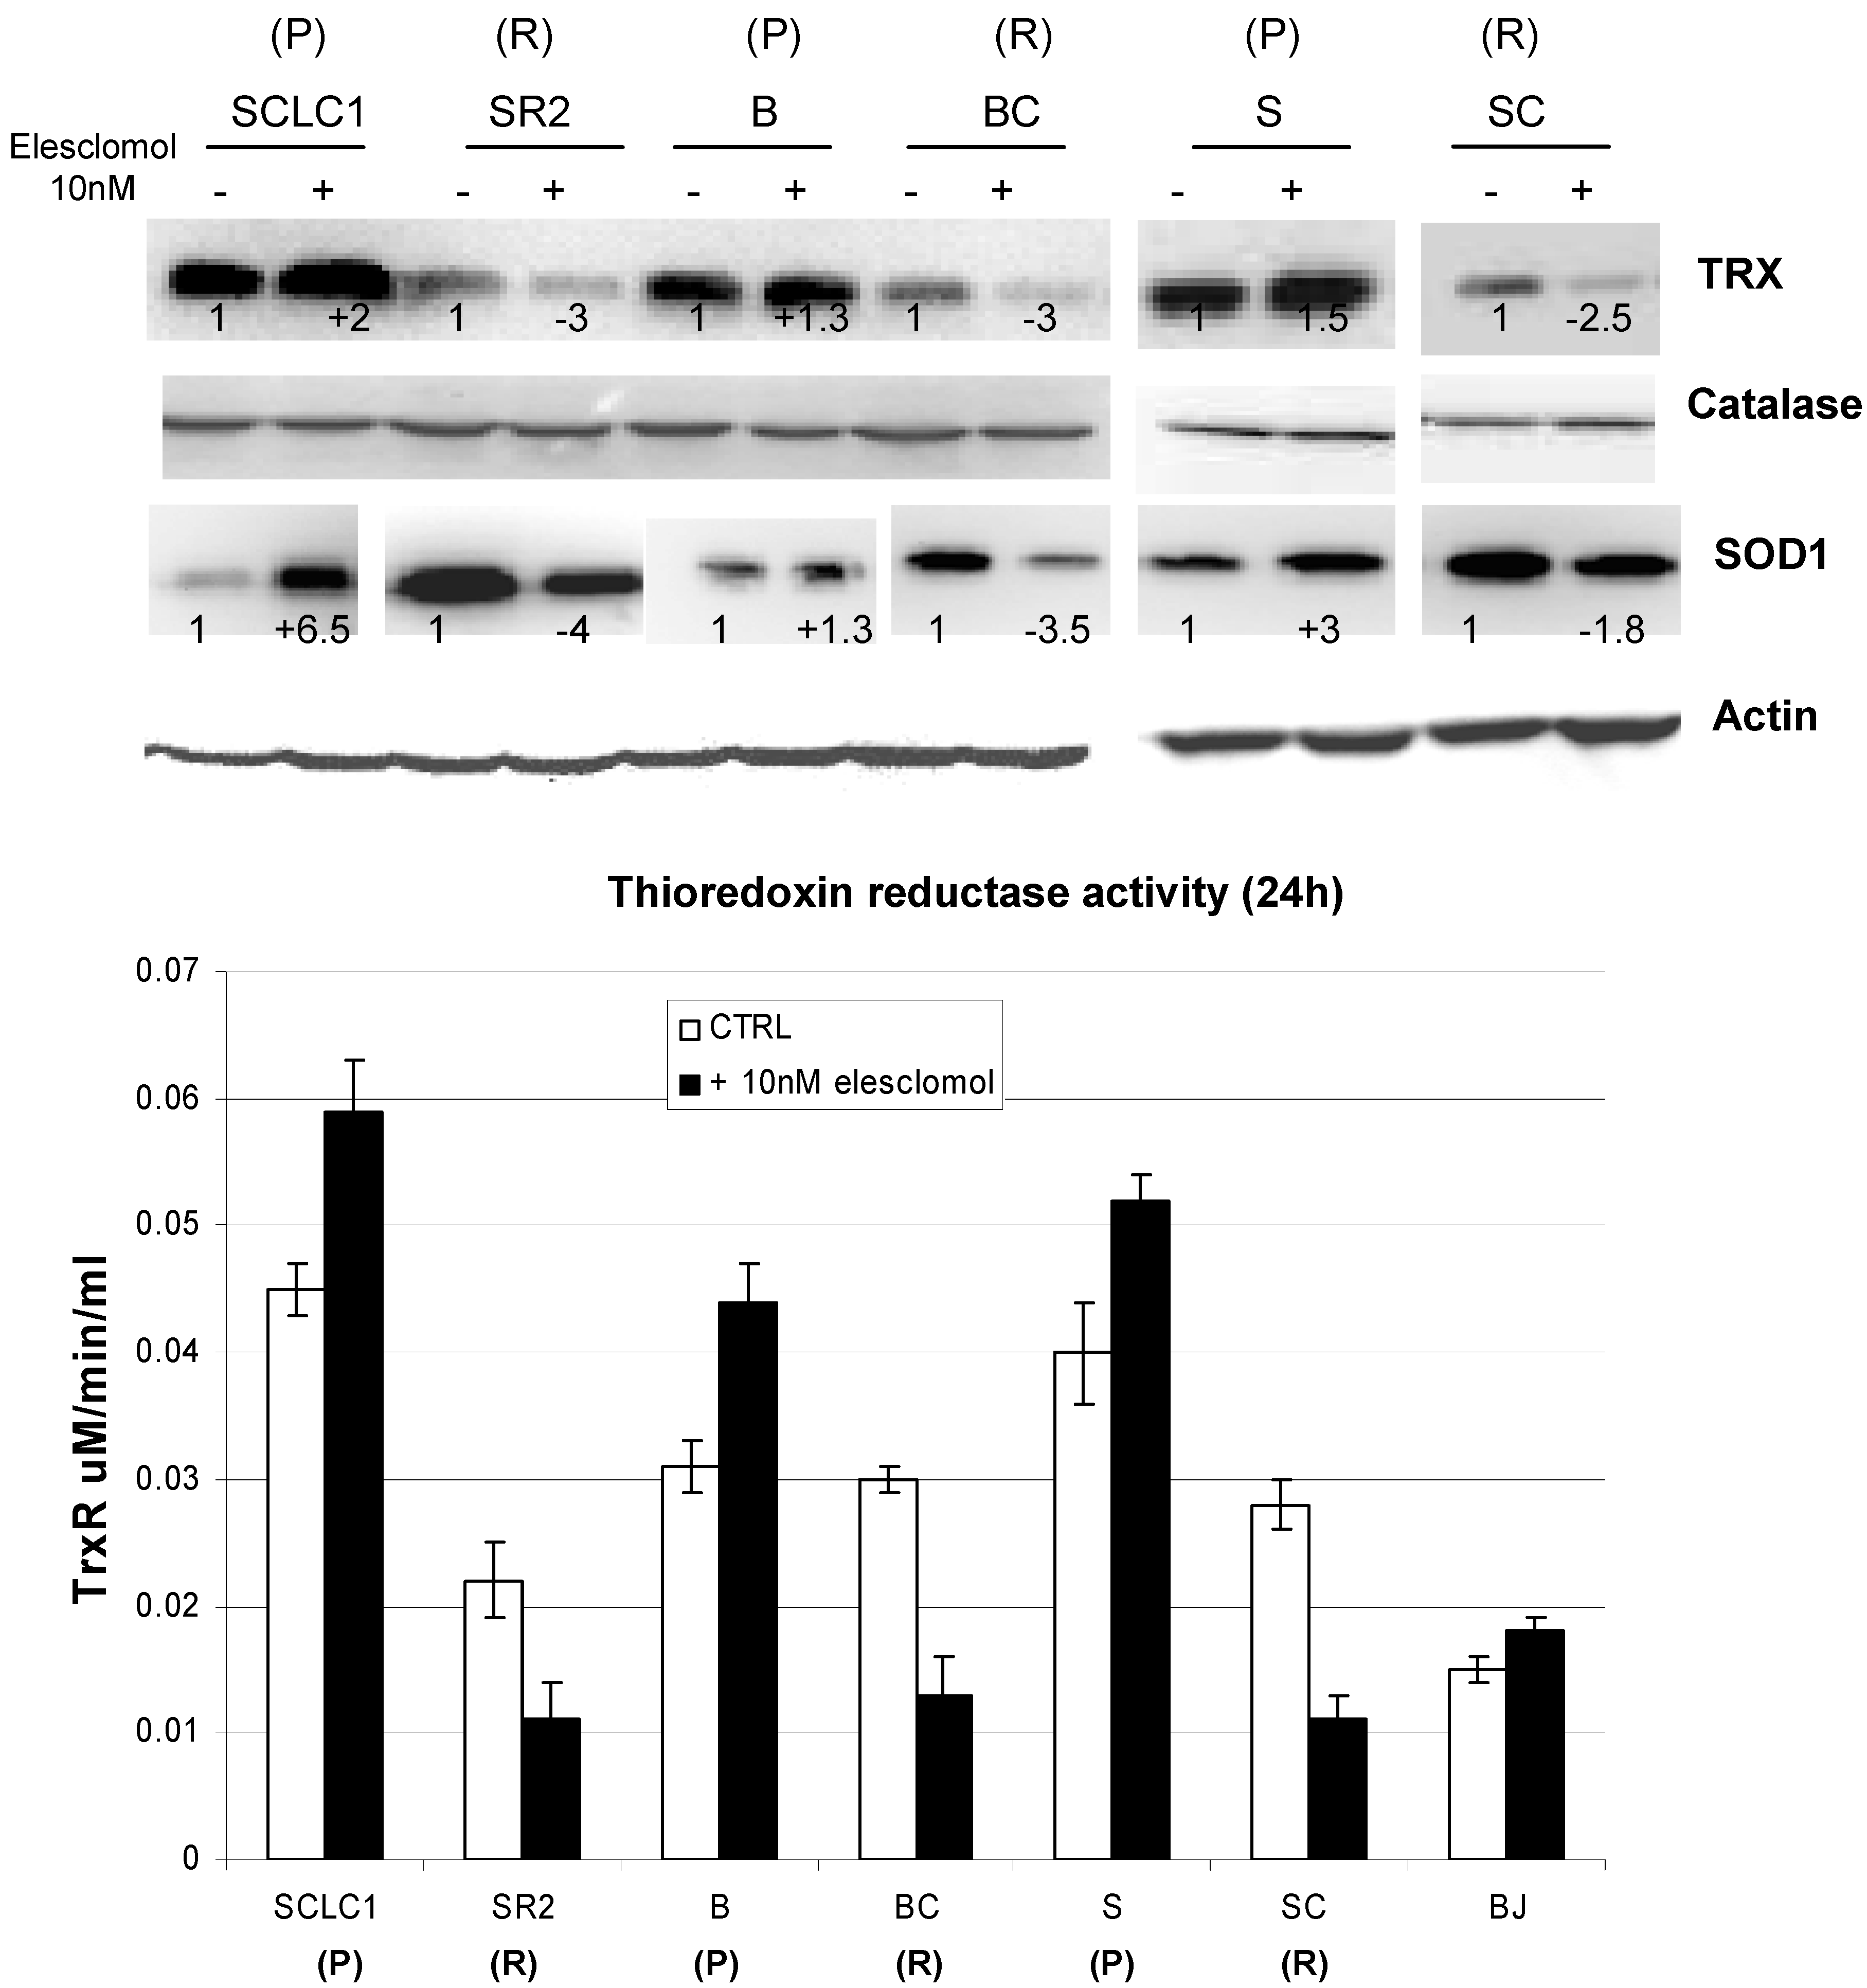
8]. This inhibition results in lowering TRX levels and thereby increased ROS levels leading to further DNA damage and cell death. Therefore, we investigated the levels of TRX/TrxR before and after treatment with elesclomol. Interestingly, the TRX/TrxR is lower in all cisplatin resistant cell lines and further reduced after treatment with elesclomol (
Figure 9). In contrast, the basal TRX/TrxR levels in parental cells are higher and further increased after elesclomol. The question remains why TRX/TrxR is lower in cisplatin resistant cells and further decreased after elesclomol. It is possible that repeated exposure to cisplatin results in lower TRX due to the fact that cisplatin is known to target TrxR. Thus, decreasing the amount of TRX while increasing the amount of other antioxidant system(s) may be a means to evade the cytotoxic effect of cisplatin.
Why elesclomol further decreases TRX activity is not known; however, the answer may lie with the level of SOD1, since SOD1 is also attenuated after elesclomol treatment (to be discussed later).
Figure 7.
0.1 mM of N-acetylcysteine (NAC) is able to reverse the growth inhibitory effect of elesclomol in cisplatin resistant cell lines (R).
Figure 7.
0.1 mM of N-acetylcysteine (NAC) is able to reverse the growth inhibitory effect of elesclomol in cisplatin resistant cell lines (R).
Figure 8.
Immunoblot analysis of cleaved caspase-3 on SCLCSR2. Treatment with 10 nM of elesclomol for 72 h induced caspase 3 cleavages (arrow) which can be reversed with cotreatment of 0.1 mM of NAC (72 h).
Figure 8.
Immunoblot analysis of cleaved caspase-3 on SCLCSR2. Treatment with 10 nM of elesclomol for 72 h induced caspase 3 cleavages (arrow) which can be reversed with cotreatment of 0.1 mM of NAC (72 h).
Figure 9.
Immunoblot of lung cancer cell lines before and after treated with 10 nM of elesclomol for 24 h. TRX and TrxR activity are decreased in resistant lines and further decreased when treated with elesclomol. There is no significant change in catalase level. On the other hand, SOD1 levels are increased in all of the resistant cell lines (R) and is decreased upon treated with elesclomol. The number below each lane depicted the changes from its control which was arbitrarily set at 1. All the band intensity was normalized with actin (average p < 0.01; parental (P) vs. resistant (R)) (mean SD of three experiments).
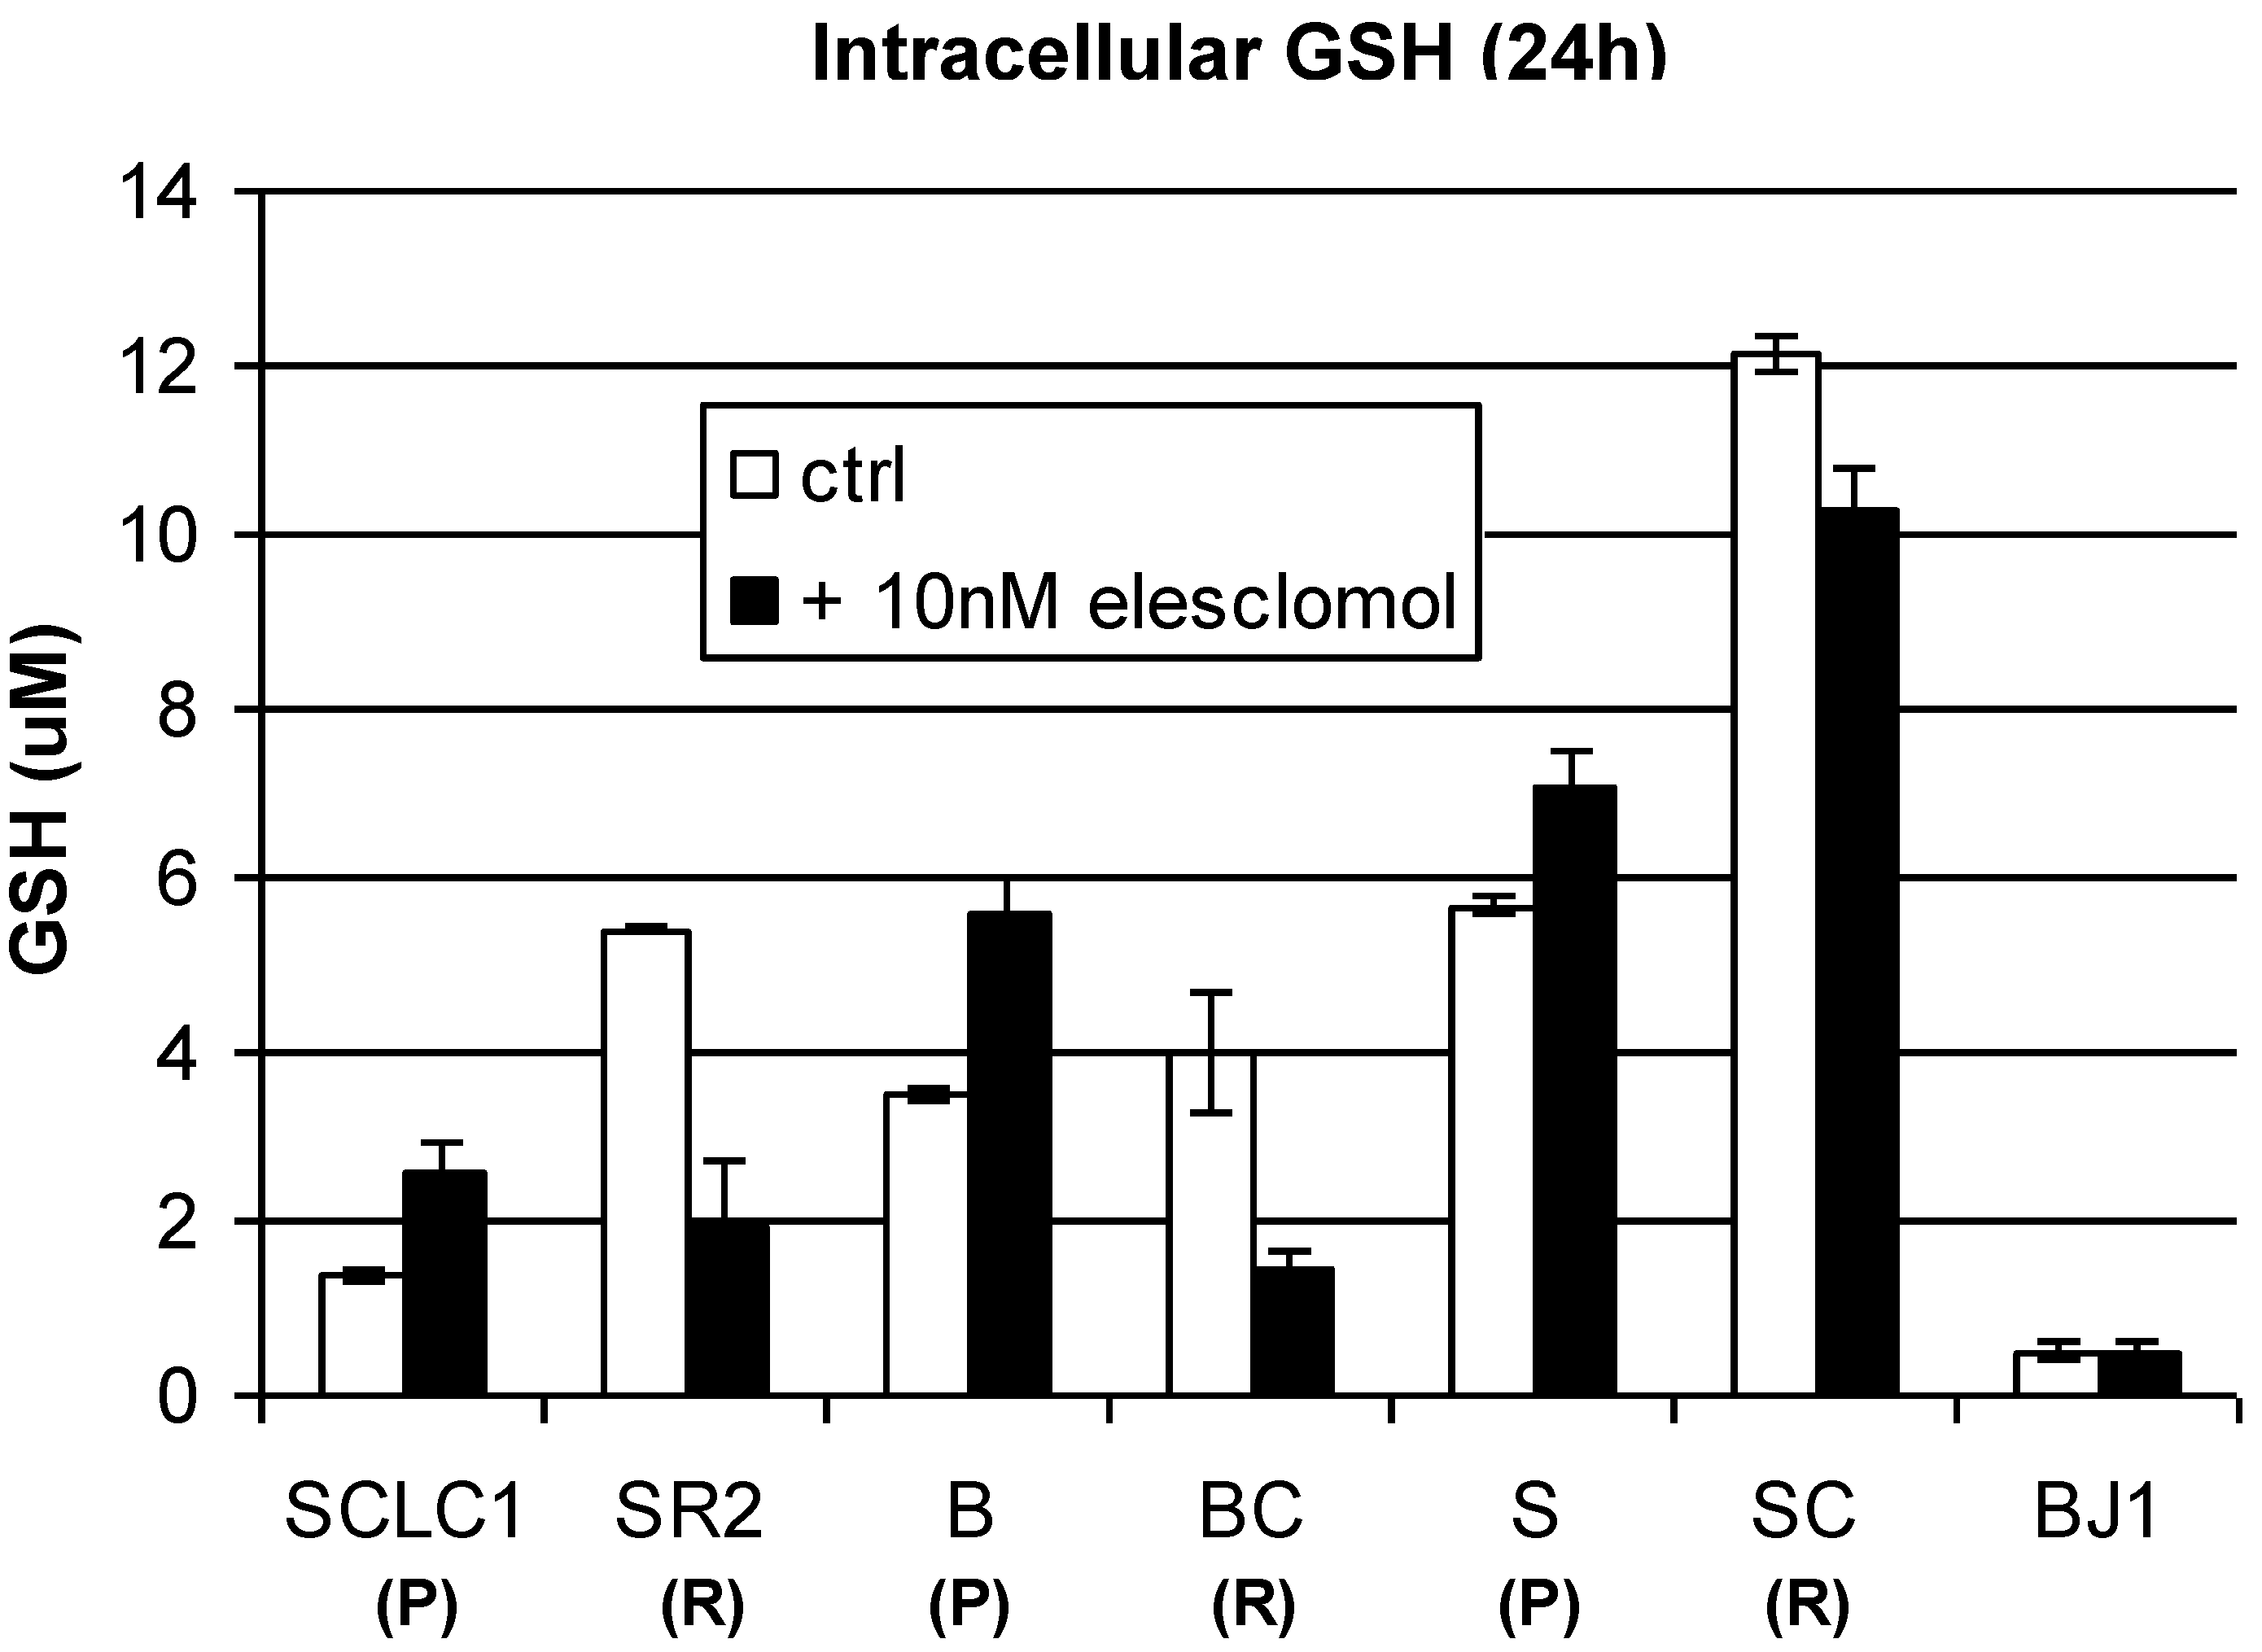
We then investigated the other two important antioxidant systems, catalase and glutathione (GSH) levels, before and after exposure to elesclomol. As shown in
Figure 9 and
Figure 10, the basal levels of catalase are similar in the parental and resistant cells and showed no significant change upon exposure to elesclomol. However, we have found that the basal levels of GSH are higher in cisplatin resistant cells, but upon exposure to elesclomol, the levels decreased. Conversely, although the basal levels of GSH are lower in parental cells, these cells are able to activate GSH system after exposure to elesclomol (
Figure 10). Overall, our data suggest that parental cells are able to activate the antioxidant system readily upon exposure to oxidative stress induced by elesclomol and are thereby able to evade apoptosis at doses that kill resistant cells. It is not clear why cisplatin resistant cells can not increase intracellular GSH under elesclomol treatment. It is possible that cisplatin resistant cells may already express maximal levels of GSH in order to compensate for high basal ROS level and are unable to increase these levels any further.
Figure 10.
Total cellular of GSH in lung cancer cell lines treated with 10 nM of elesclomol for 24 h. Note: After treatment with elesclomol, the levels of GSH are decreased in all of the resistant cell lines (R) (Mean SD of three experiments).
Figure 10.
Total cellular of GSH in lung cancer cell lines treated with 10 nM of elesclomol for 24 h. Note: After treatment with elesclomol, the levels of GSH are decreased in all of the resistant cell lines (R) (Mean SD of three experiments).
Another important factor that may explain high basal levels of ROS in cisplatin resistant cells and its collateral sensitivity to elesclomol is superoxide dismutase (SOD). Consequently, we investigated SOD1 in this panel of cisplatin sensitive and resistant cells, both before and after elesclomol treatment. SOD is a metalloenzyme that is important to capture superoxide (O
2−) and convert O
2− into H
2O
2 and oxygen. H
2O
2 is then detoxified by TRX, catalase and/or GSH. Thus, the amount of SOD1 present is crucial for the cellular antioxidant defense mechanism.
Figure 9 shows that the basal levels of SOD1 are much higher in cisplatin resistant cell lines; however, upon exposure to elesclomol, the levels of SOD1 increased only in parental cells but decreased in cisplatin resistant cells. In contrast, when compared to parental cell lines, TRX/TrxR is lower in resistant cells and the levels further reduced when treated with elesclomol (
Figure 9).
We have already shown that cisplatin resistant cells have high basal levels of ROS/O2−. Thus, they require high levels of SOD1 to capture ROS/O2−. However, upon exposure to elesclomol, SOD1 is reduced, but ROS and H2O2 continue to rise which reflects high levels of oxidative stress. The underlying mechanism(s) for this is not clear. It is possible that cisplatin resistant cells may not be able to effectively remove H2O2 due to inability to increase TRX and GSH expression. In order to avoid the cytotoxic effect of excessive intracellular H2O2, the cisplatin resistant cells will generate less intracellular SOD1 in an attempt to decrease H2O2 formation upon exposure to elesclomol. However, despite decreasing SOD1, the amount of H2O2 generated is still too excessive and ultimately lead to cell death. In contrast, parental cells can turn on SOD1 readily to capture ROS/O2− and the resulting H2O2 is rapidly detoxified by the antioxidant system upon exposure to elesclomol.


