Resonant Directly Coupled Inductors–Capacitors Ladder Network Shows a New, Interesting Property Useful for Application in the Sensor Field, Down to Micrometric Dimensions
Abstract
:1. Introduction
2. Materials and Methods
3. Results
3.1. Fibonacci Relations in the L–C L.N.
3.2. Sensor Localization Based on Frequency Patterns
4. Conclusions
Author Contributions
Funding
Conflicts of Interest
References
- Morgan-Voyce, A. Ladder network analysis using Fibonacci numbers. IRE Trans. Circuit Theory. 1959, 6, 321–322. [Google Scholar] [CrossRef]
- Ferris, G.; Faccio, M.; D’Amico, A. A new numerical triangle showing links with Fibonacci numbers. Fibonacci Q. 1991, 29, 316–321. [Google Scholar]
- Faccio, M.; Ferri, G.; D’Amico, A. Fibonacci numbers and ladder network impedances. Fibonacci Q. 1992, 30, 62–67. [Google Scholar]
- Faccio, M.; Ferri, G.; D’Amico, A. A new fast method for ladder networks characterization. IEEE Trans. Circuit Syst. 1991, 38, 1377–1382. [Google Scholar] [CrossRef]
- D’Amico, A.; Falconi, C.; Bertsch, M.; Ferri, G.; Lojacono, R.; Mazzotta, M.; Santonico, M.; Pennazza, G. The presence of Fibonacci numbers in passive ladder networks: The case of forbidden bands. IEEE Antennas Propag. Mag. 2014, 56, 275–287. [Google Scholar] [CrossRef]
- Faccio, M.; Ferri, G.; D’Amico, A. The DFF and DFFz triangles and their mathematical properties. In Proceedings of the Fifth International Conference on Fibonacci Numbers and Their Applications, St. Andrews, UK, 20–24 July 1992. [Google Scholar]
- Fialkov, A.A. A theorem on general LC-R ladder filters. IEEE Trans. Circuit Syst. 1983, 3, 293–296. [Google Scholar] [CrossRef]
- Johns, D.A.; Snelgrove, W.M.; Sedra, A.S. Ortonormal ladder filters. IEEE Trans. Circuit Syst. 1989, 36, 337–343. [Google Scholar] [CrossRef]
- Marshall, R. Modeling DNA/RNA strings using resistor-capacitor (RC) ladder networks. Comput. J. 2010, 53, 644–660. [Google Scholar] [CrossRef]

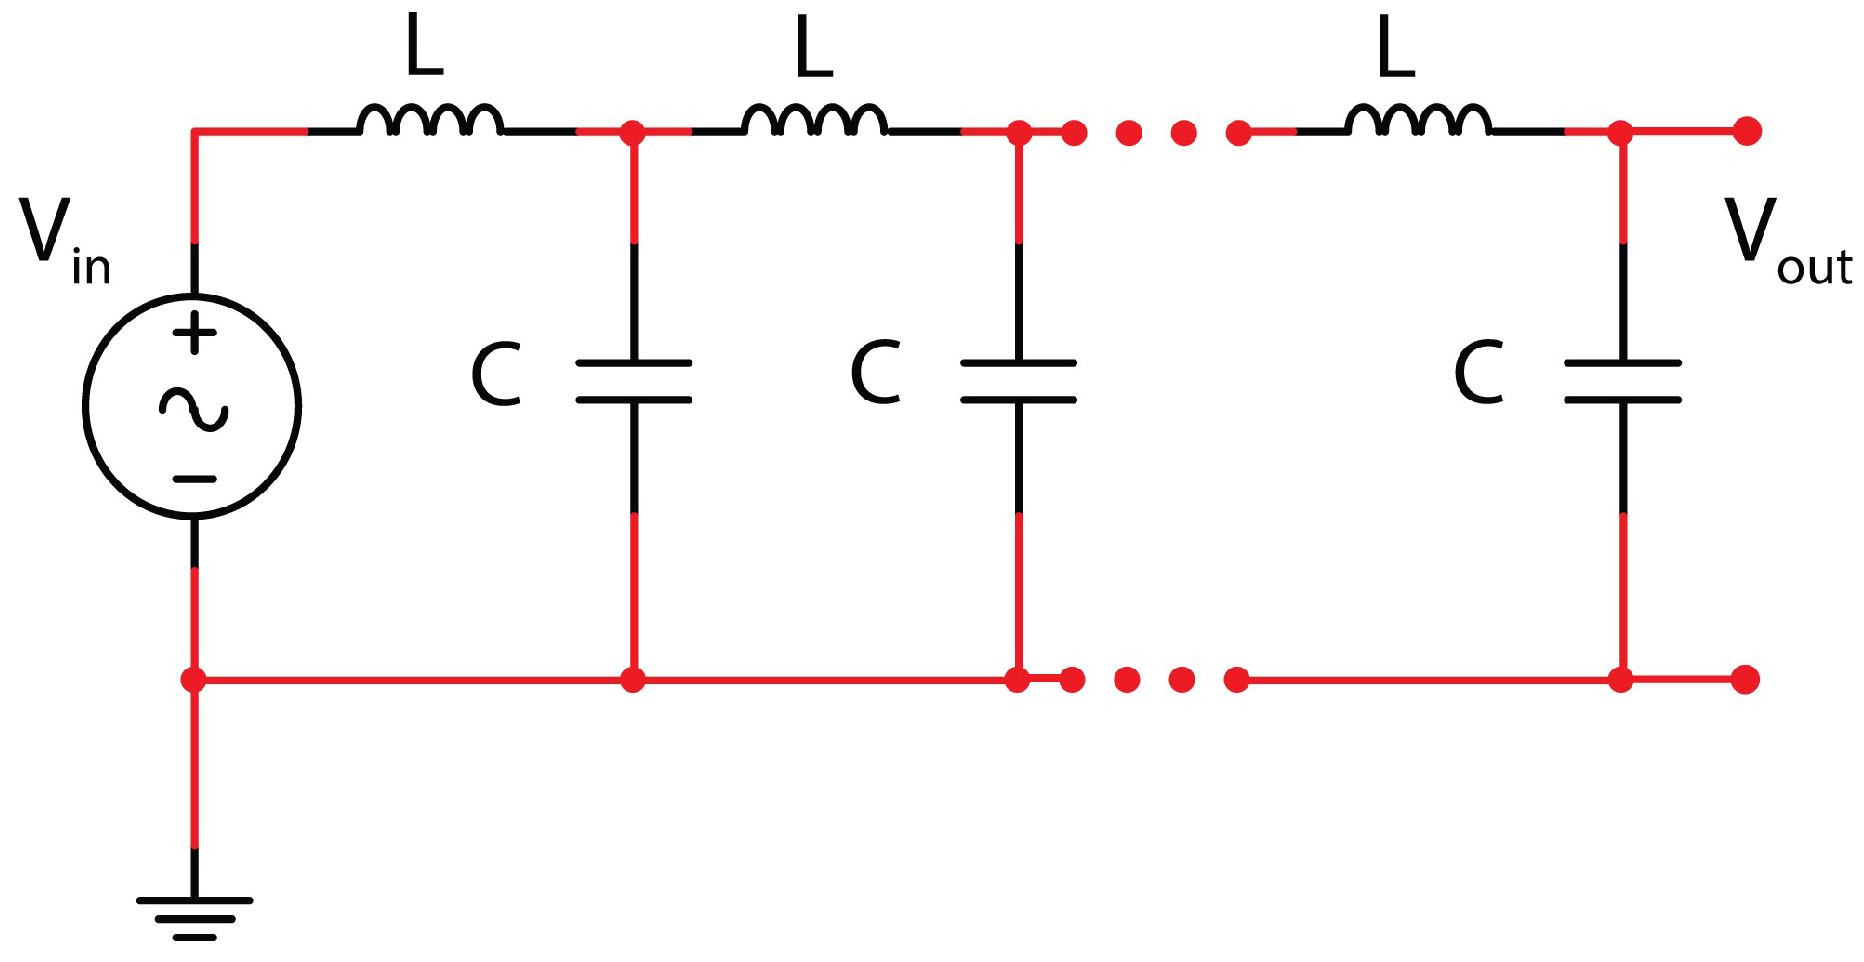

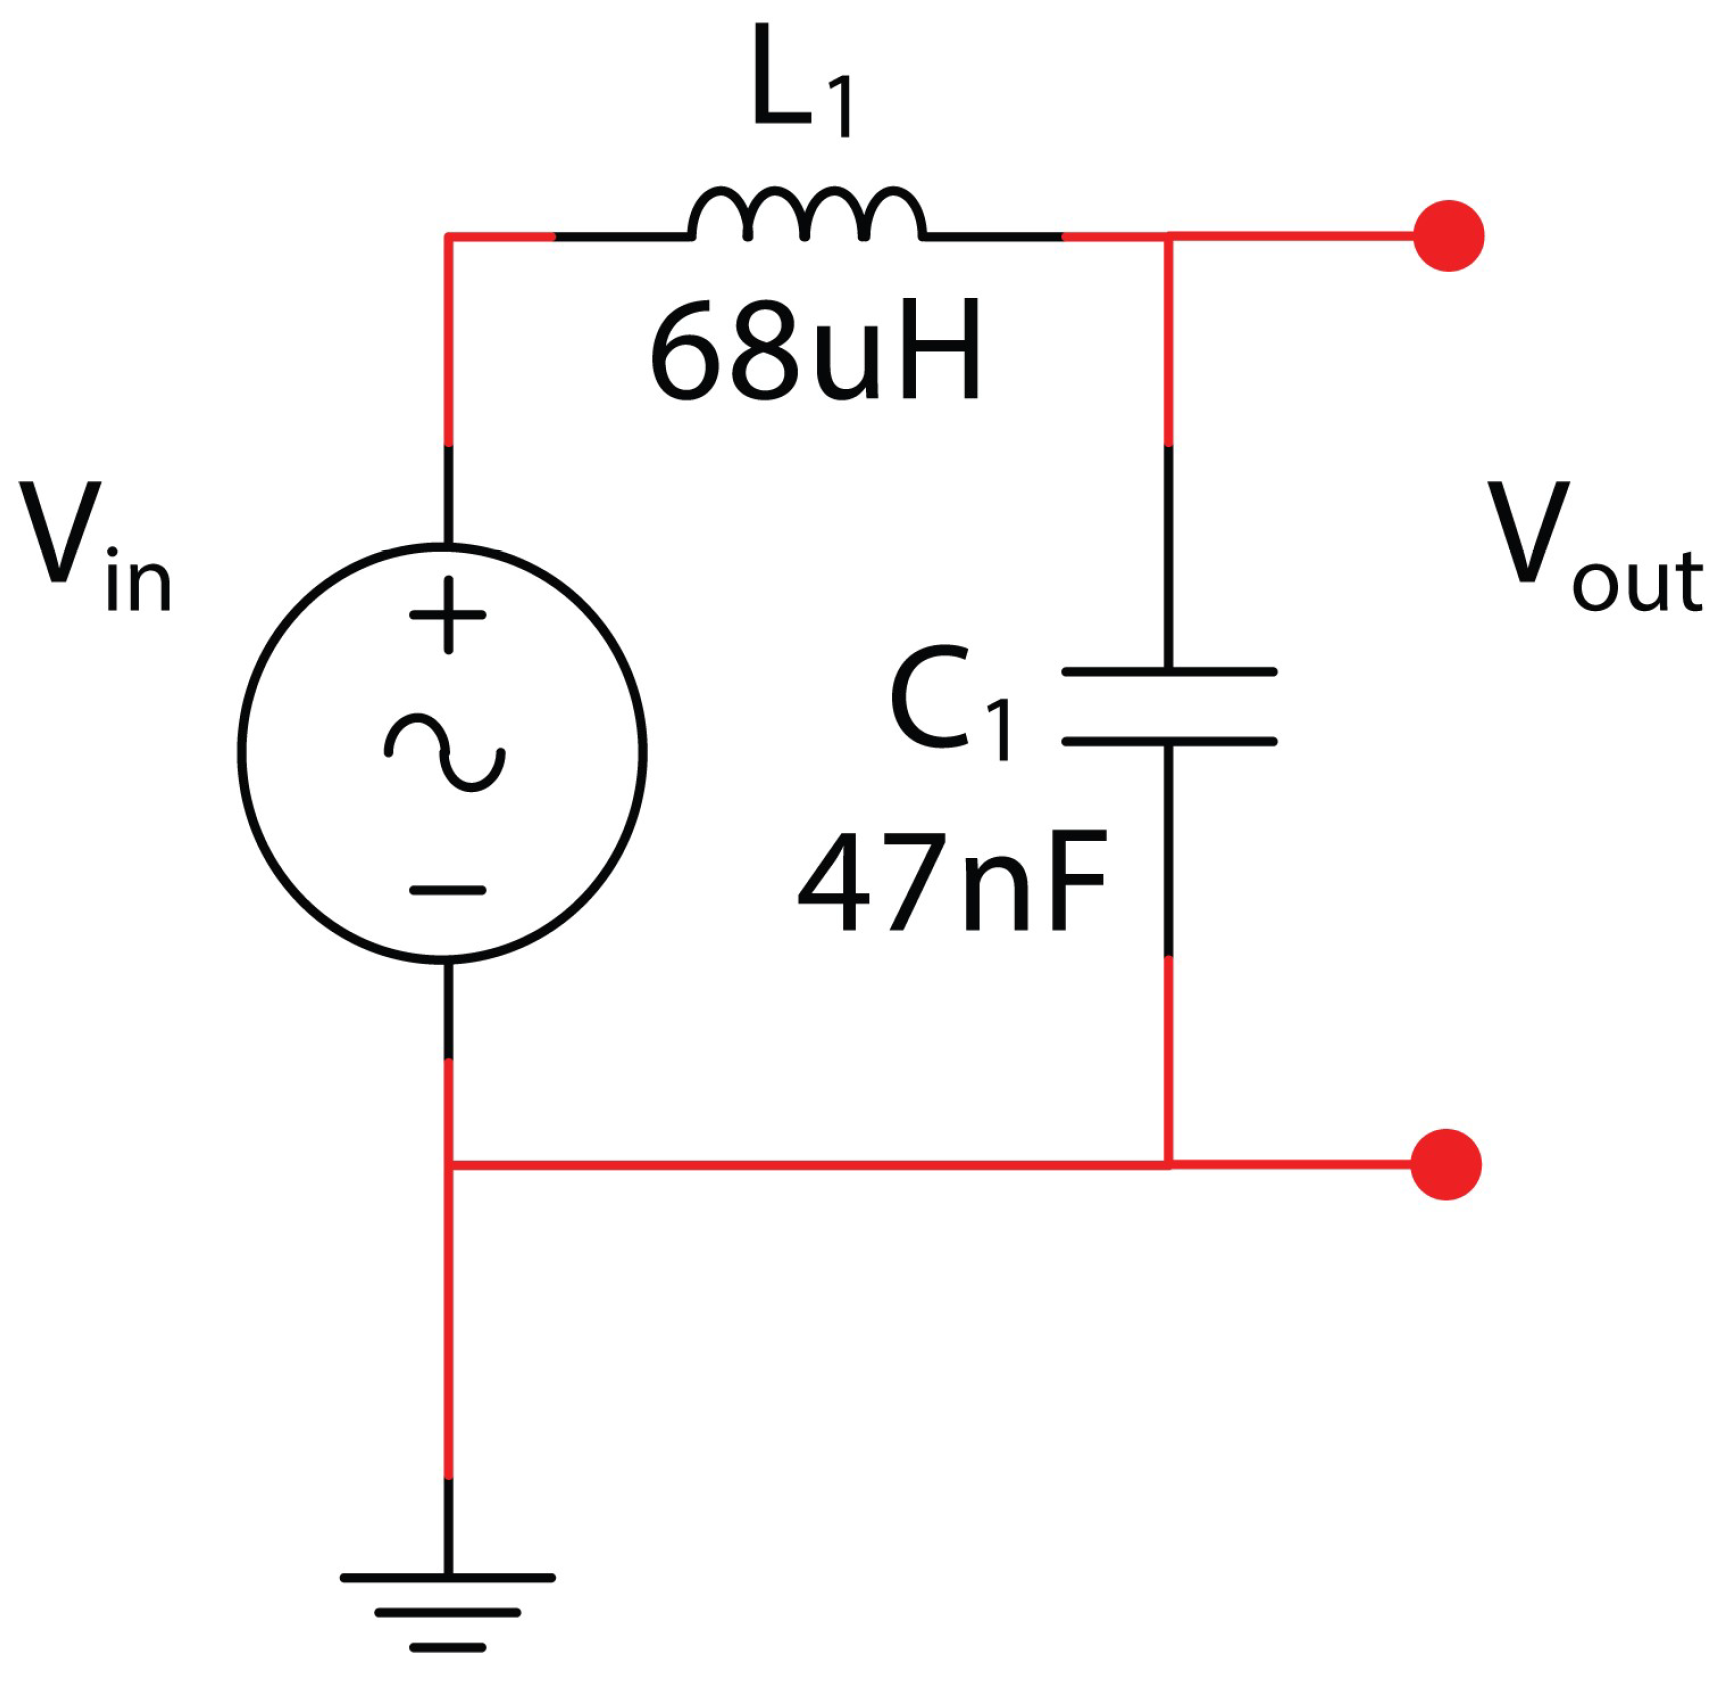


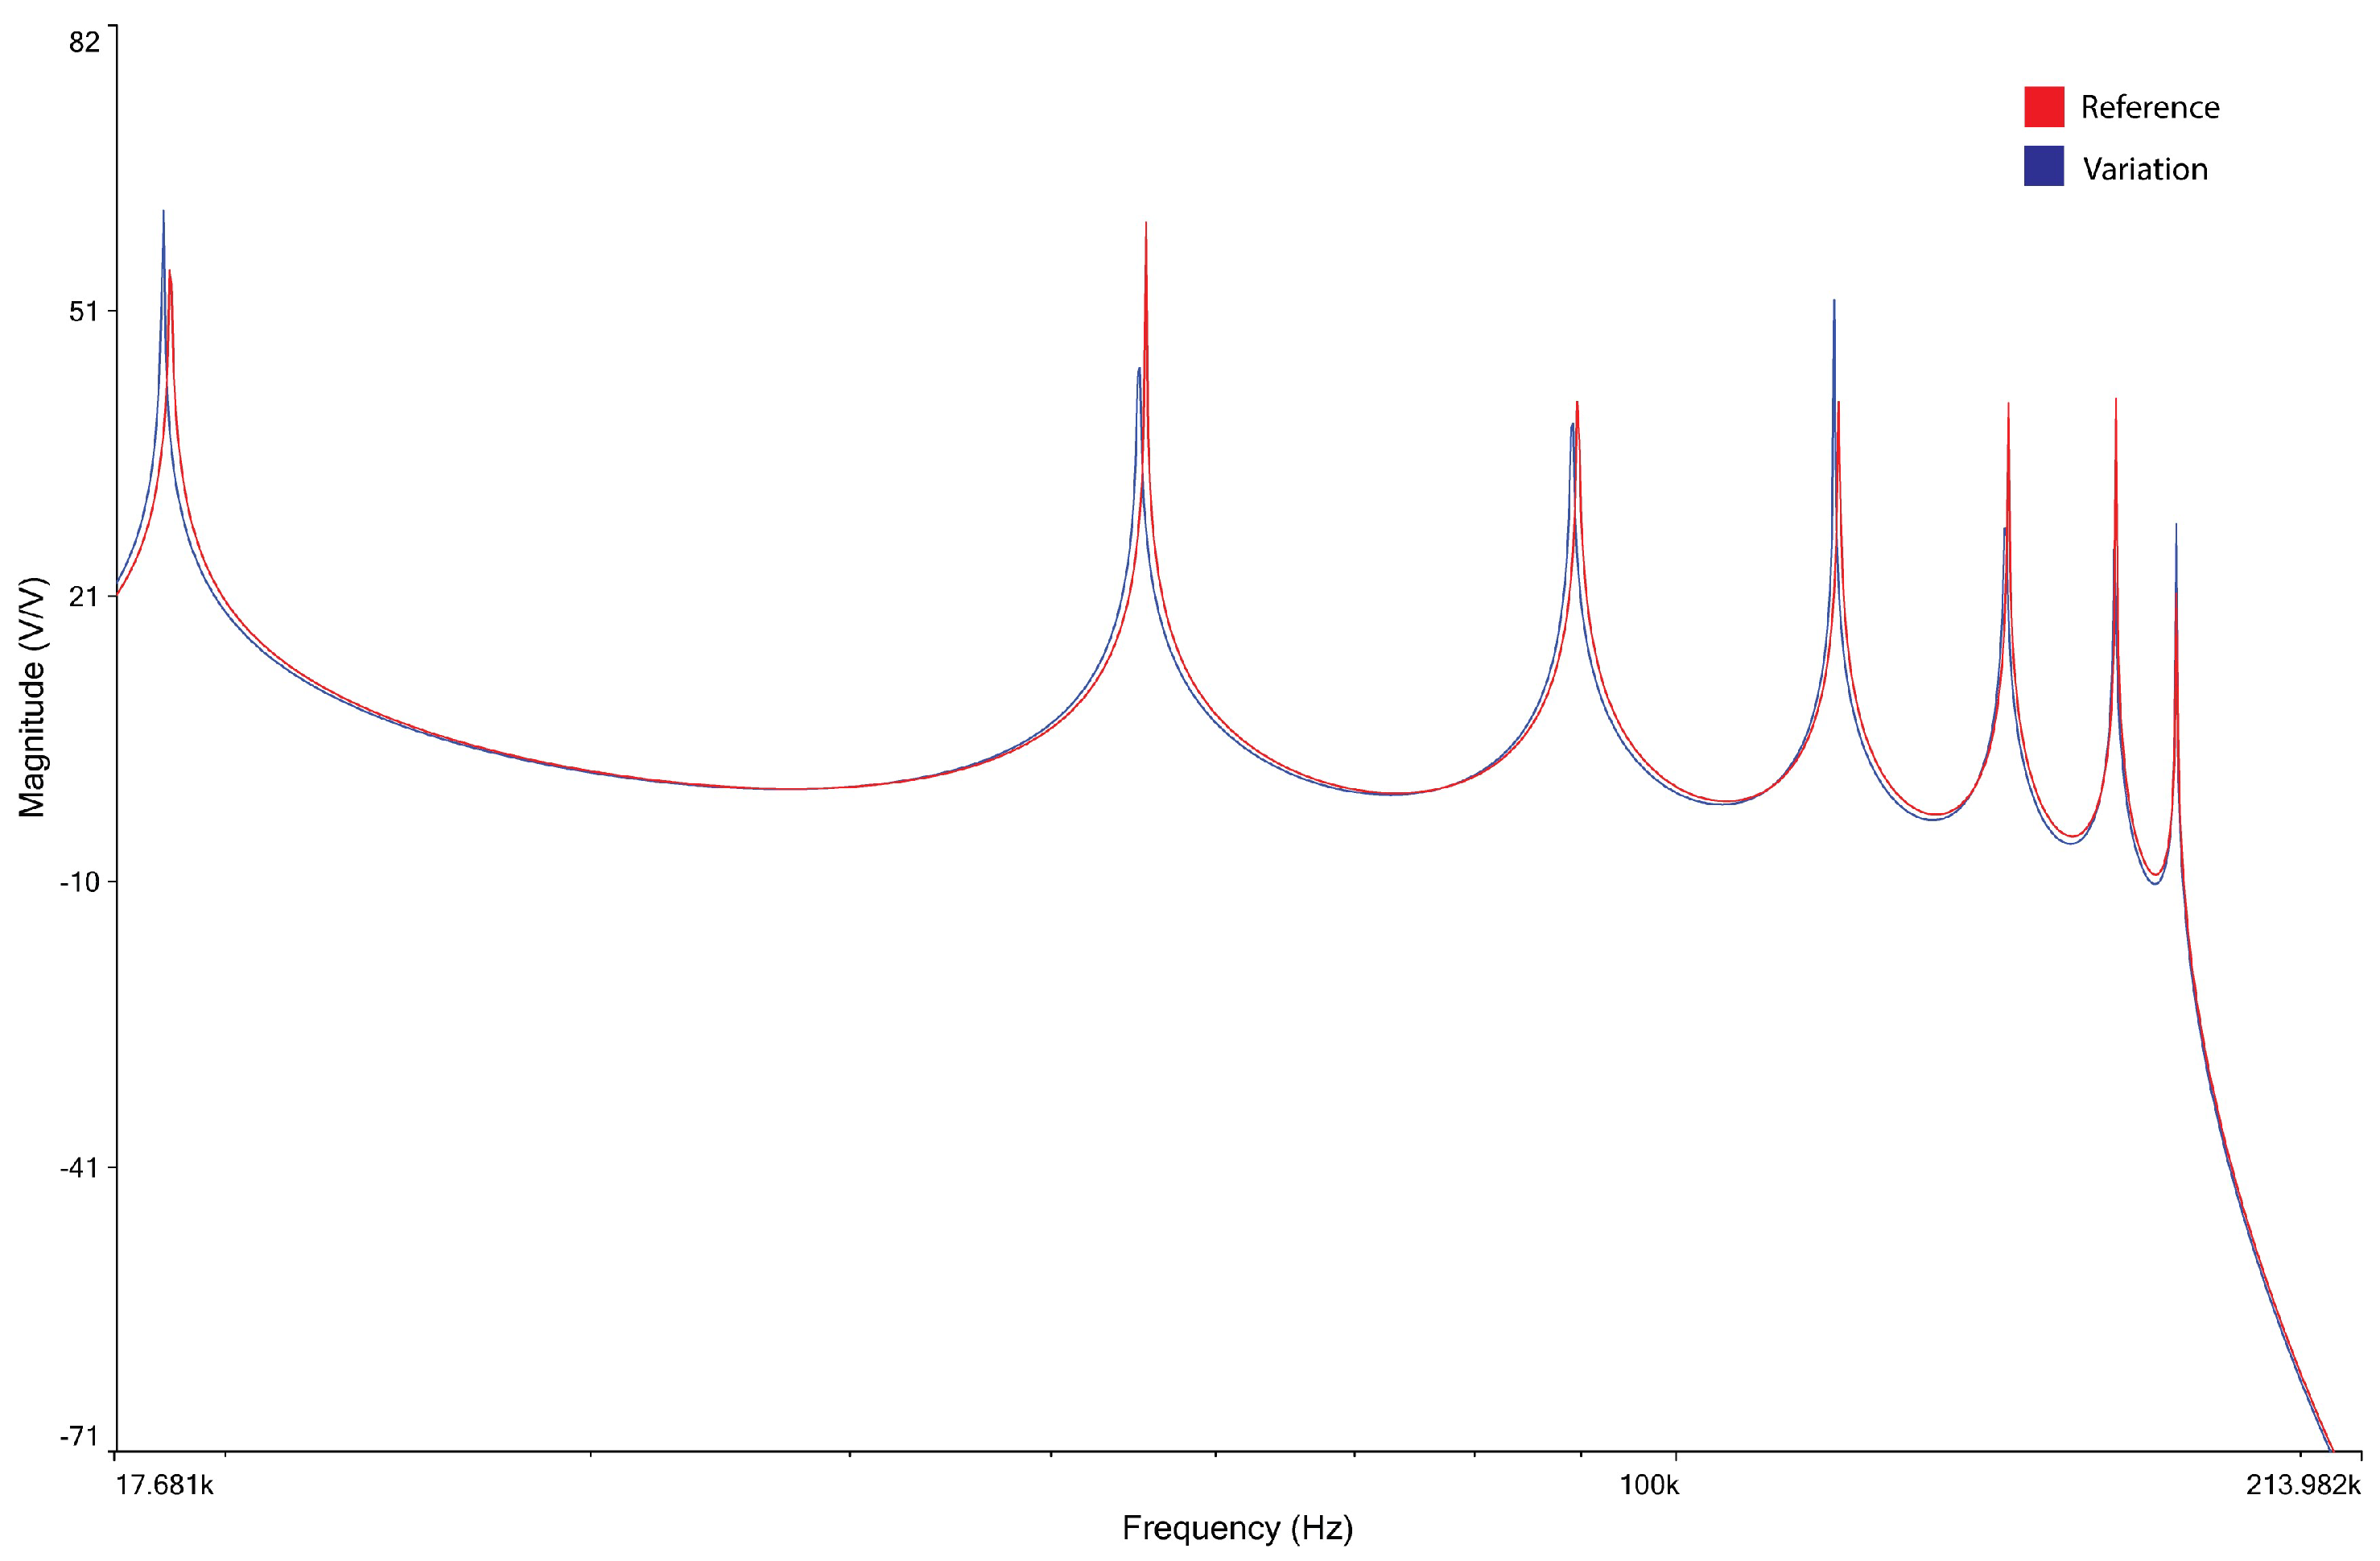
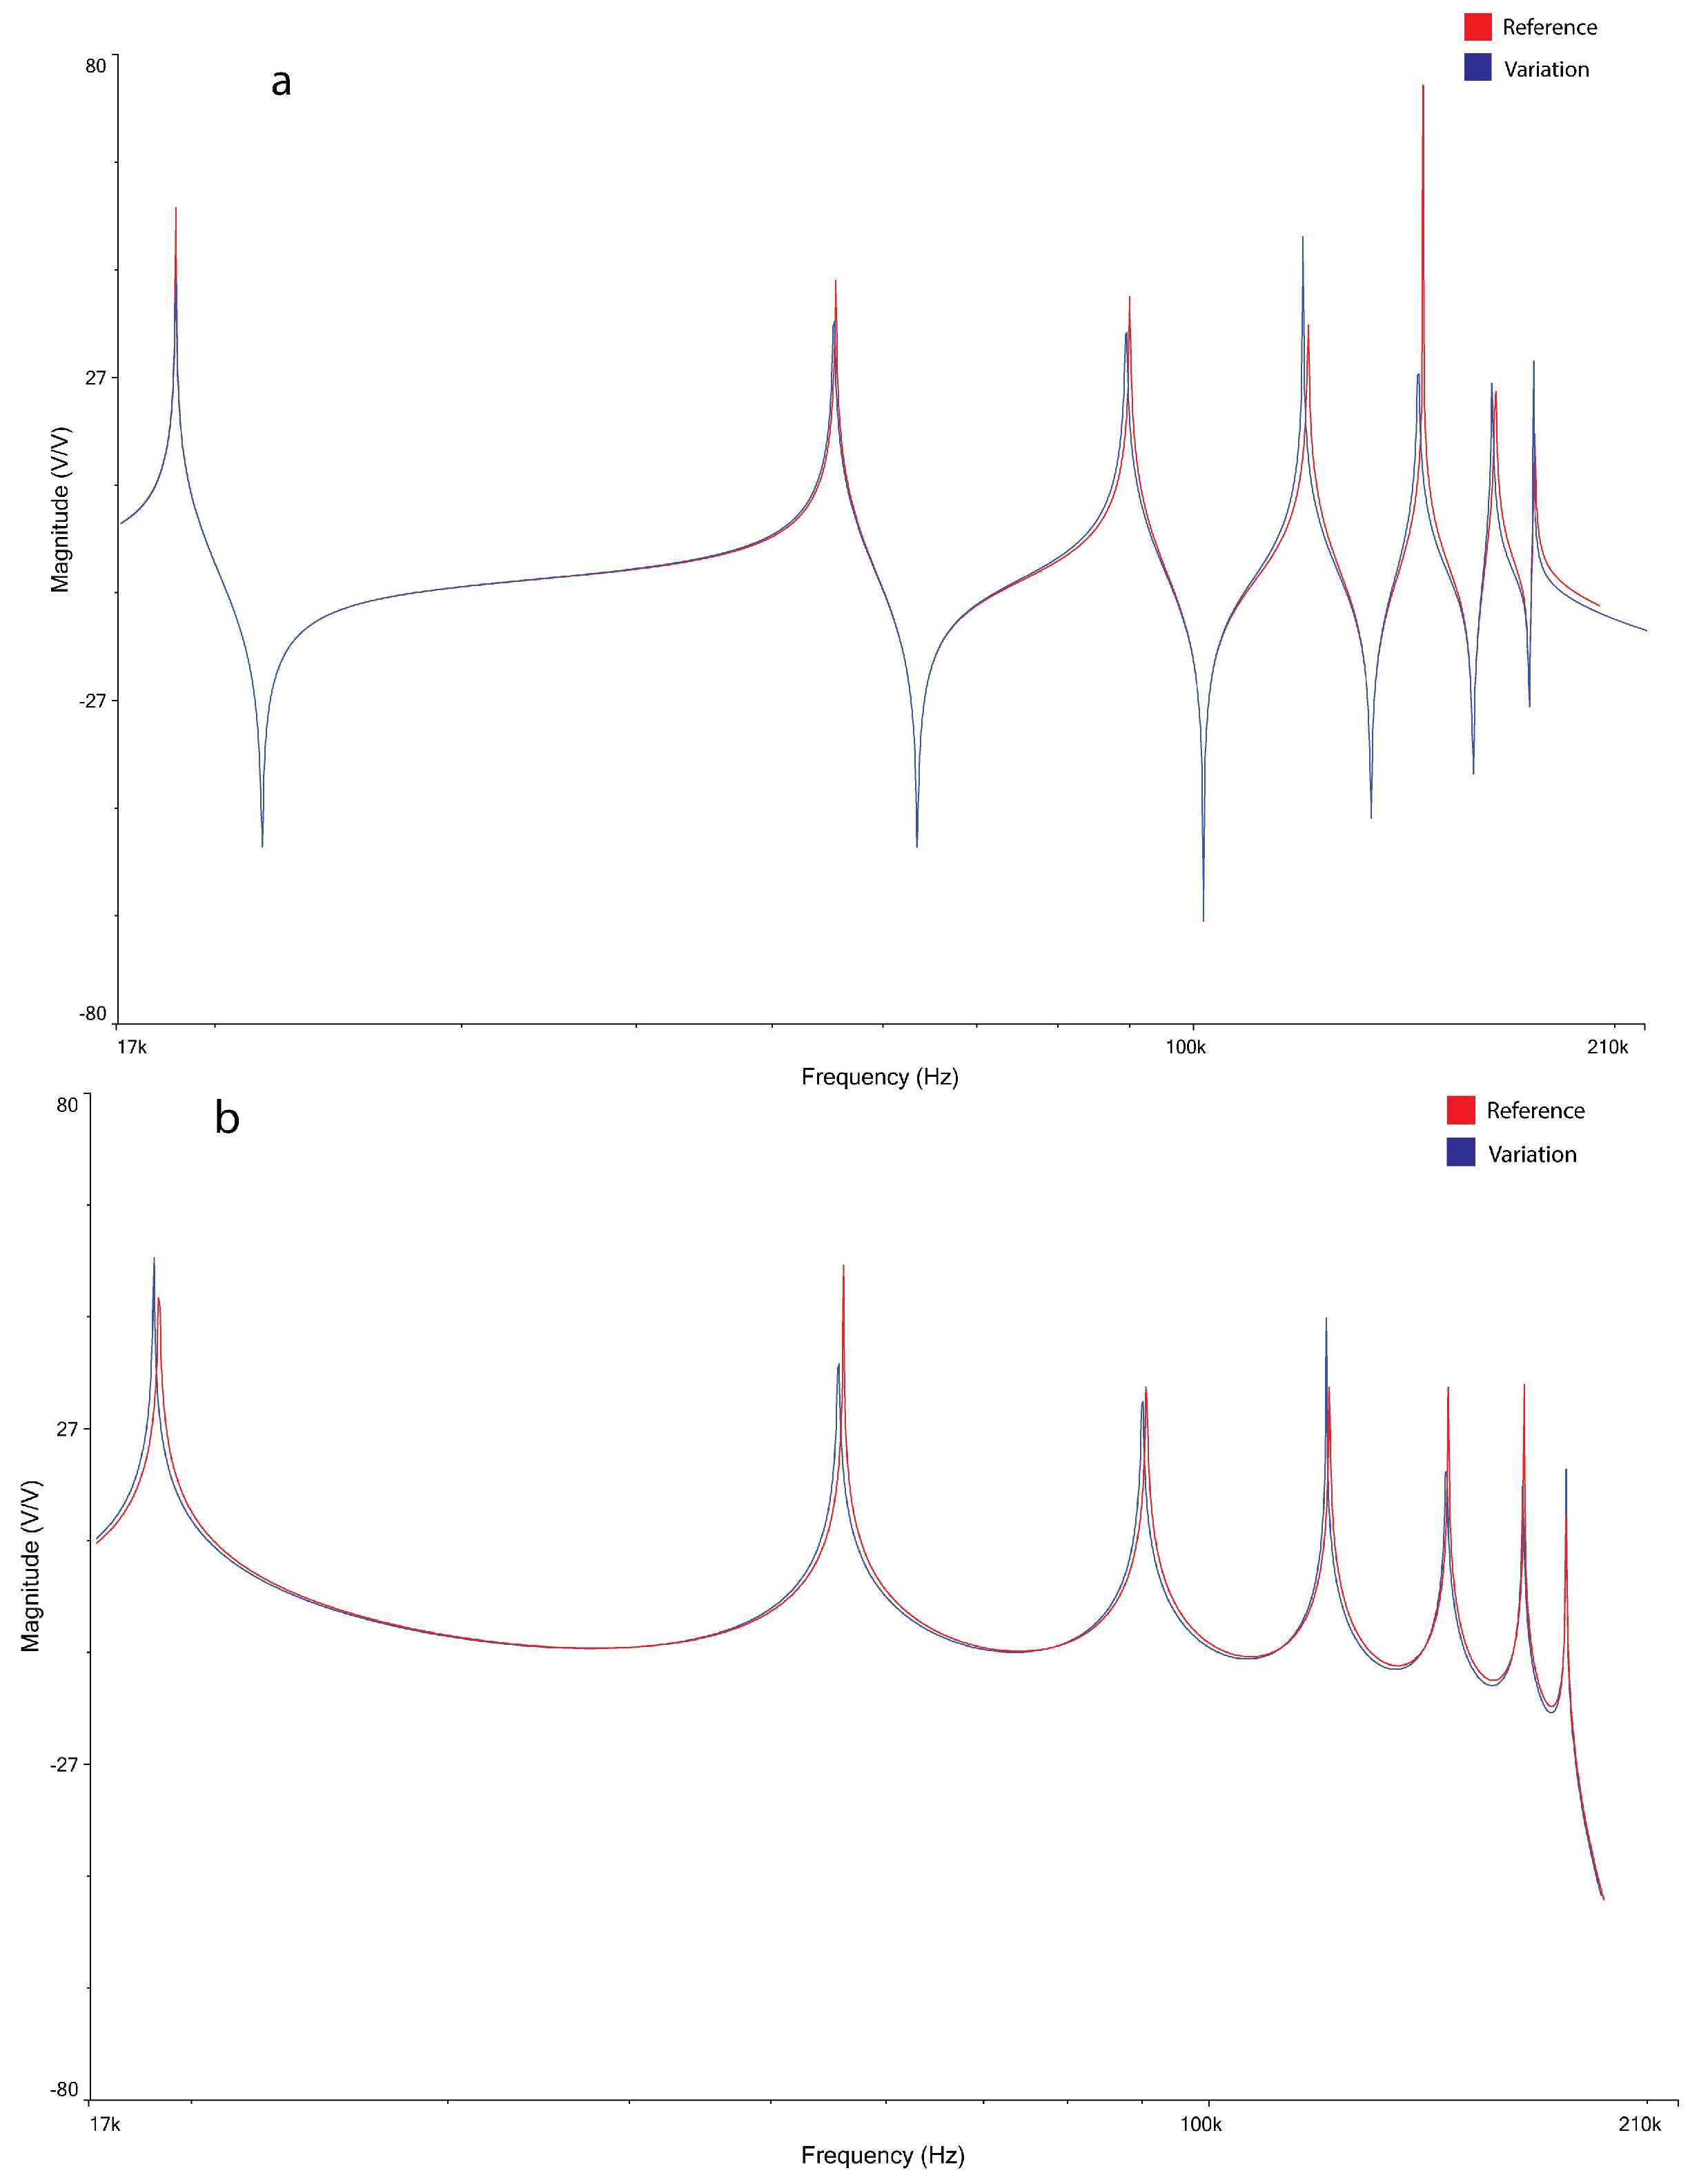
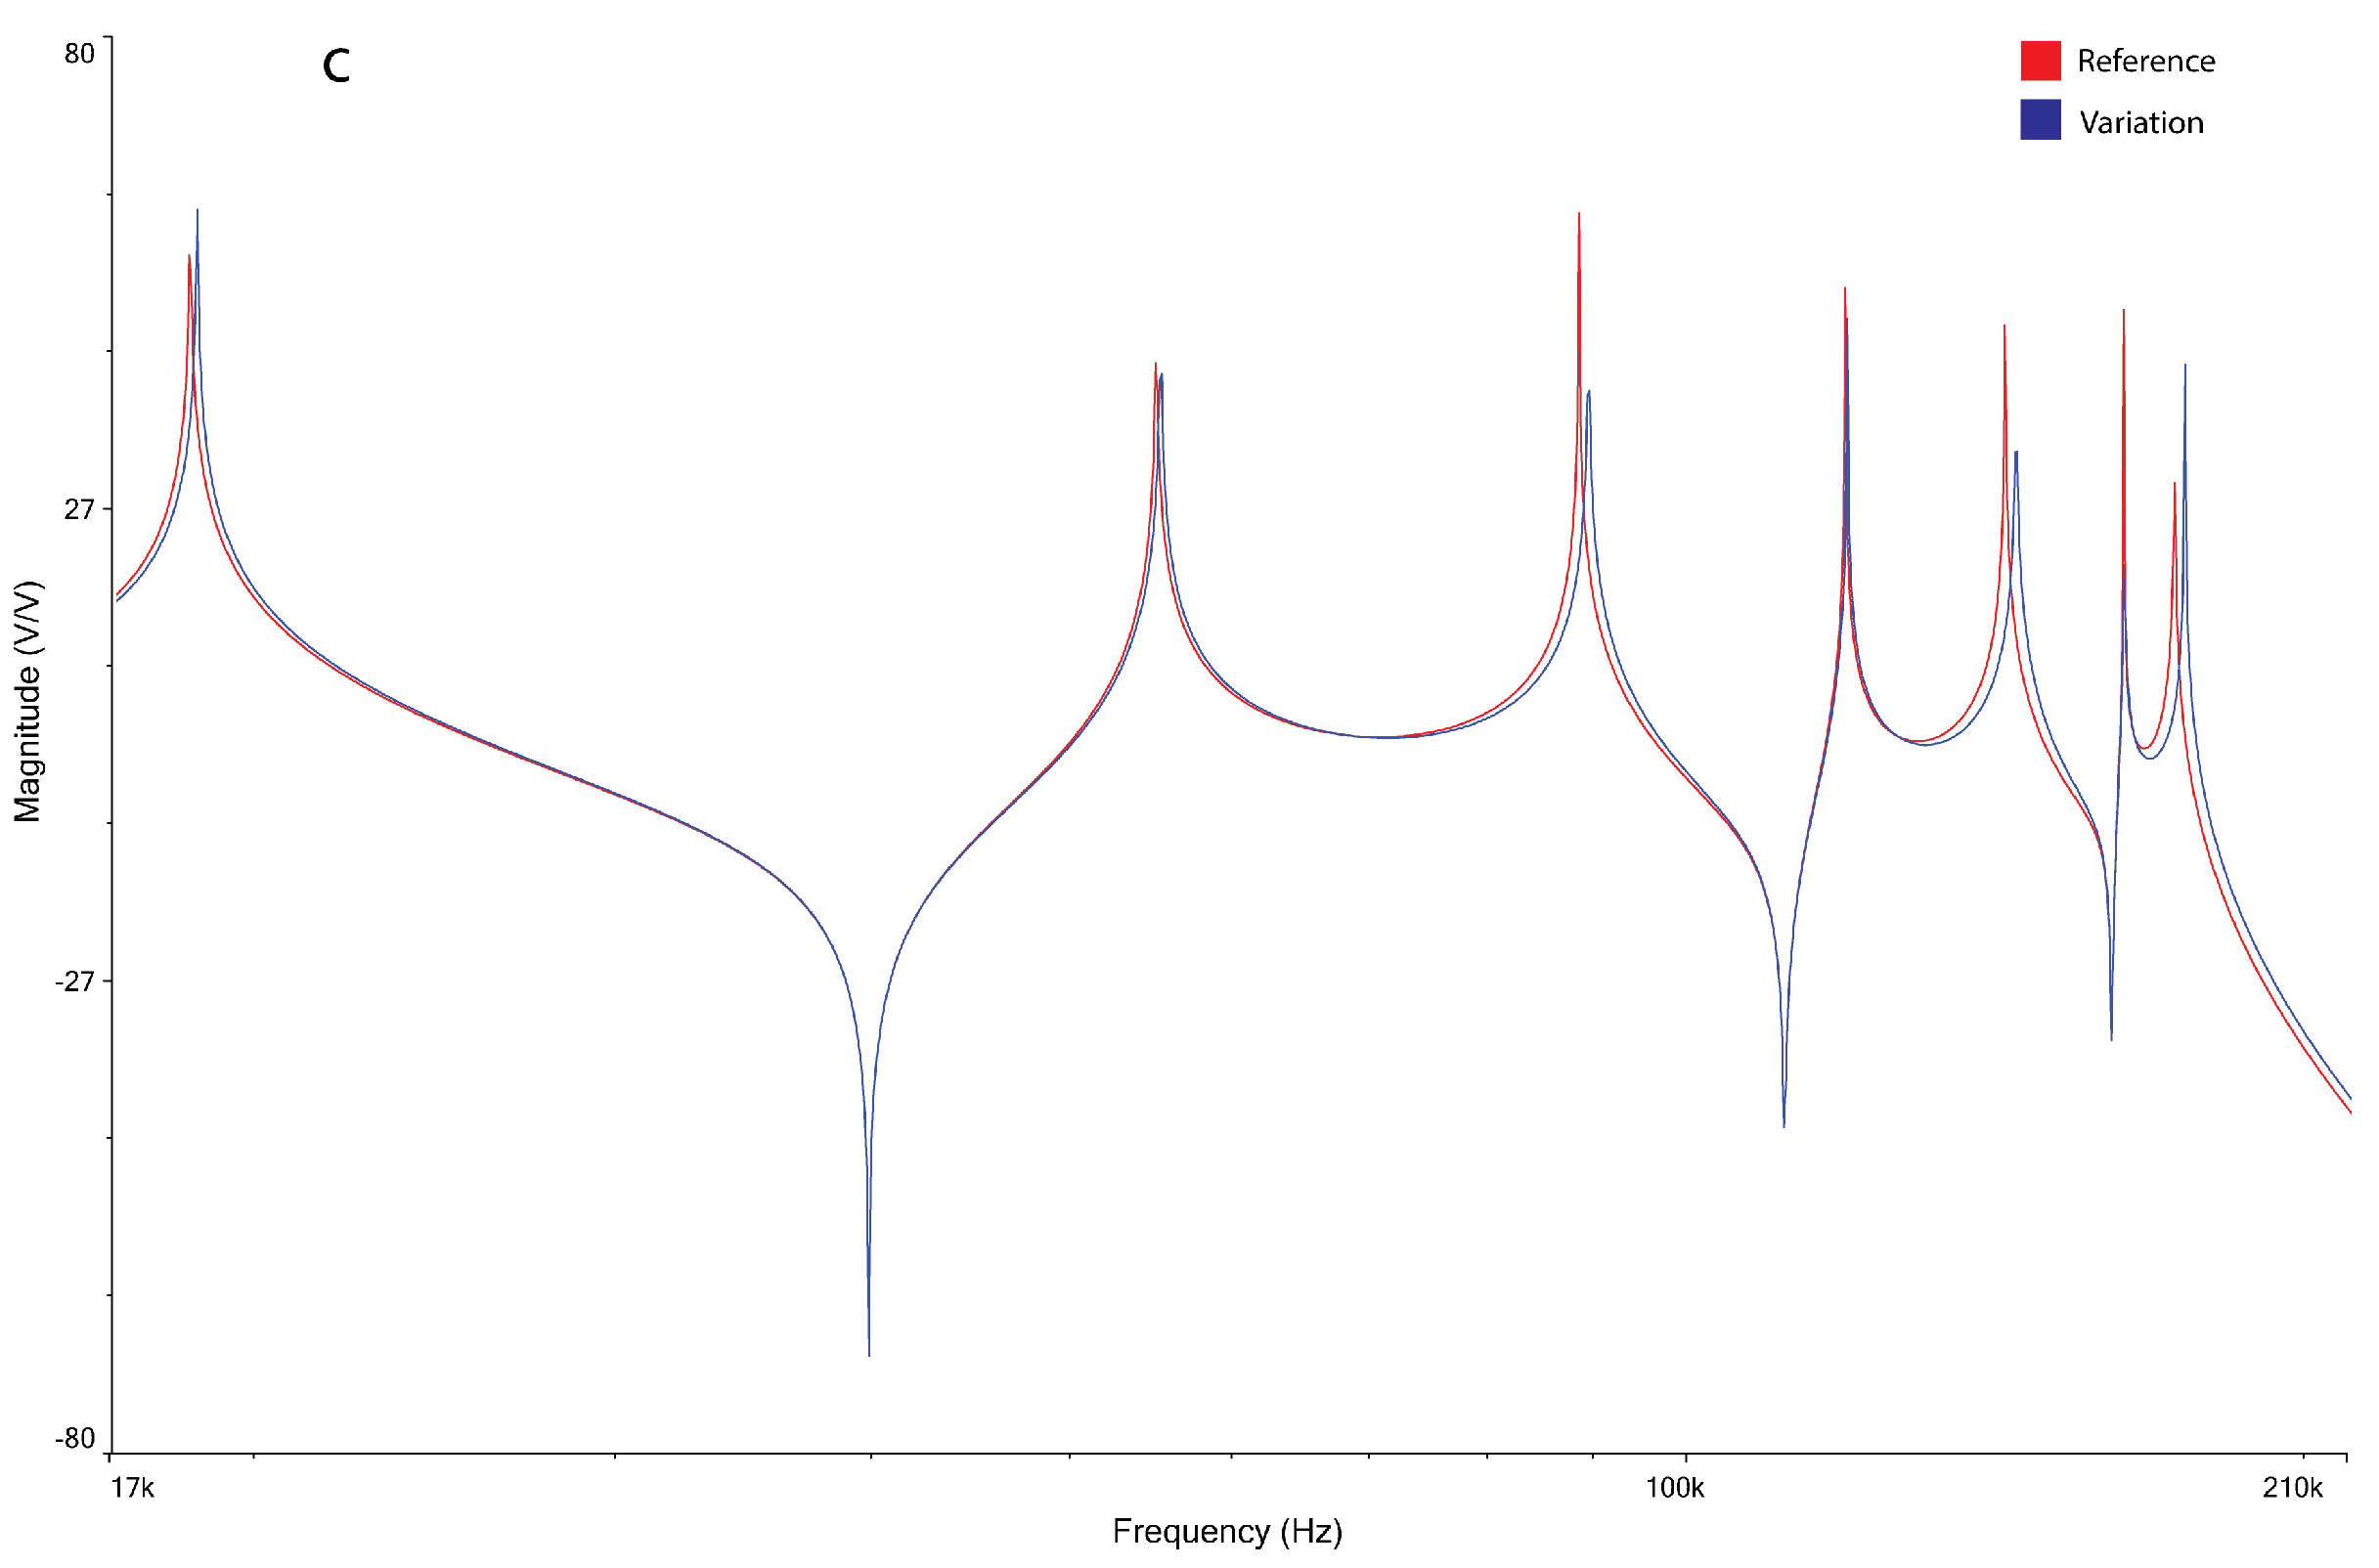
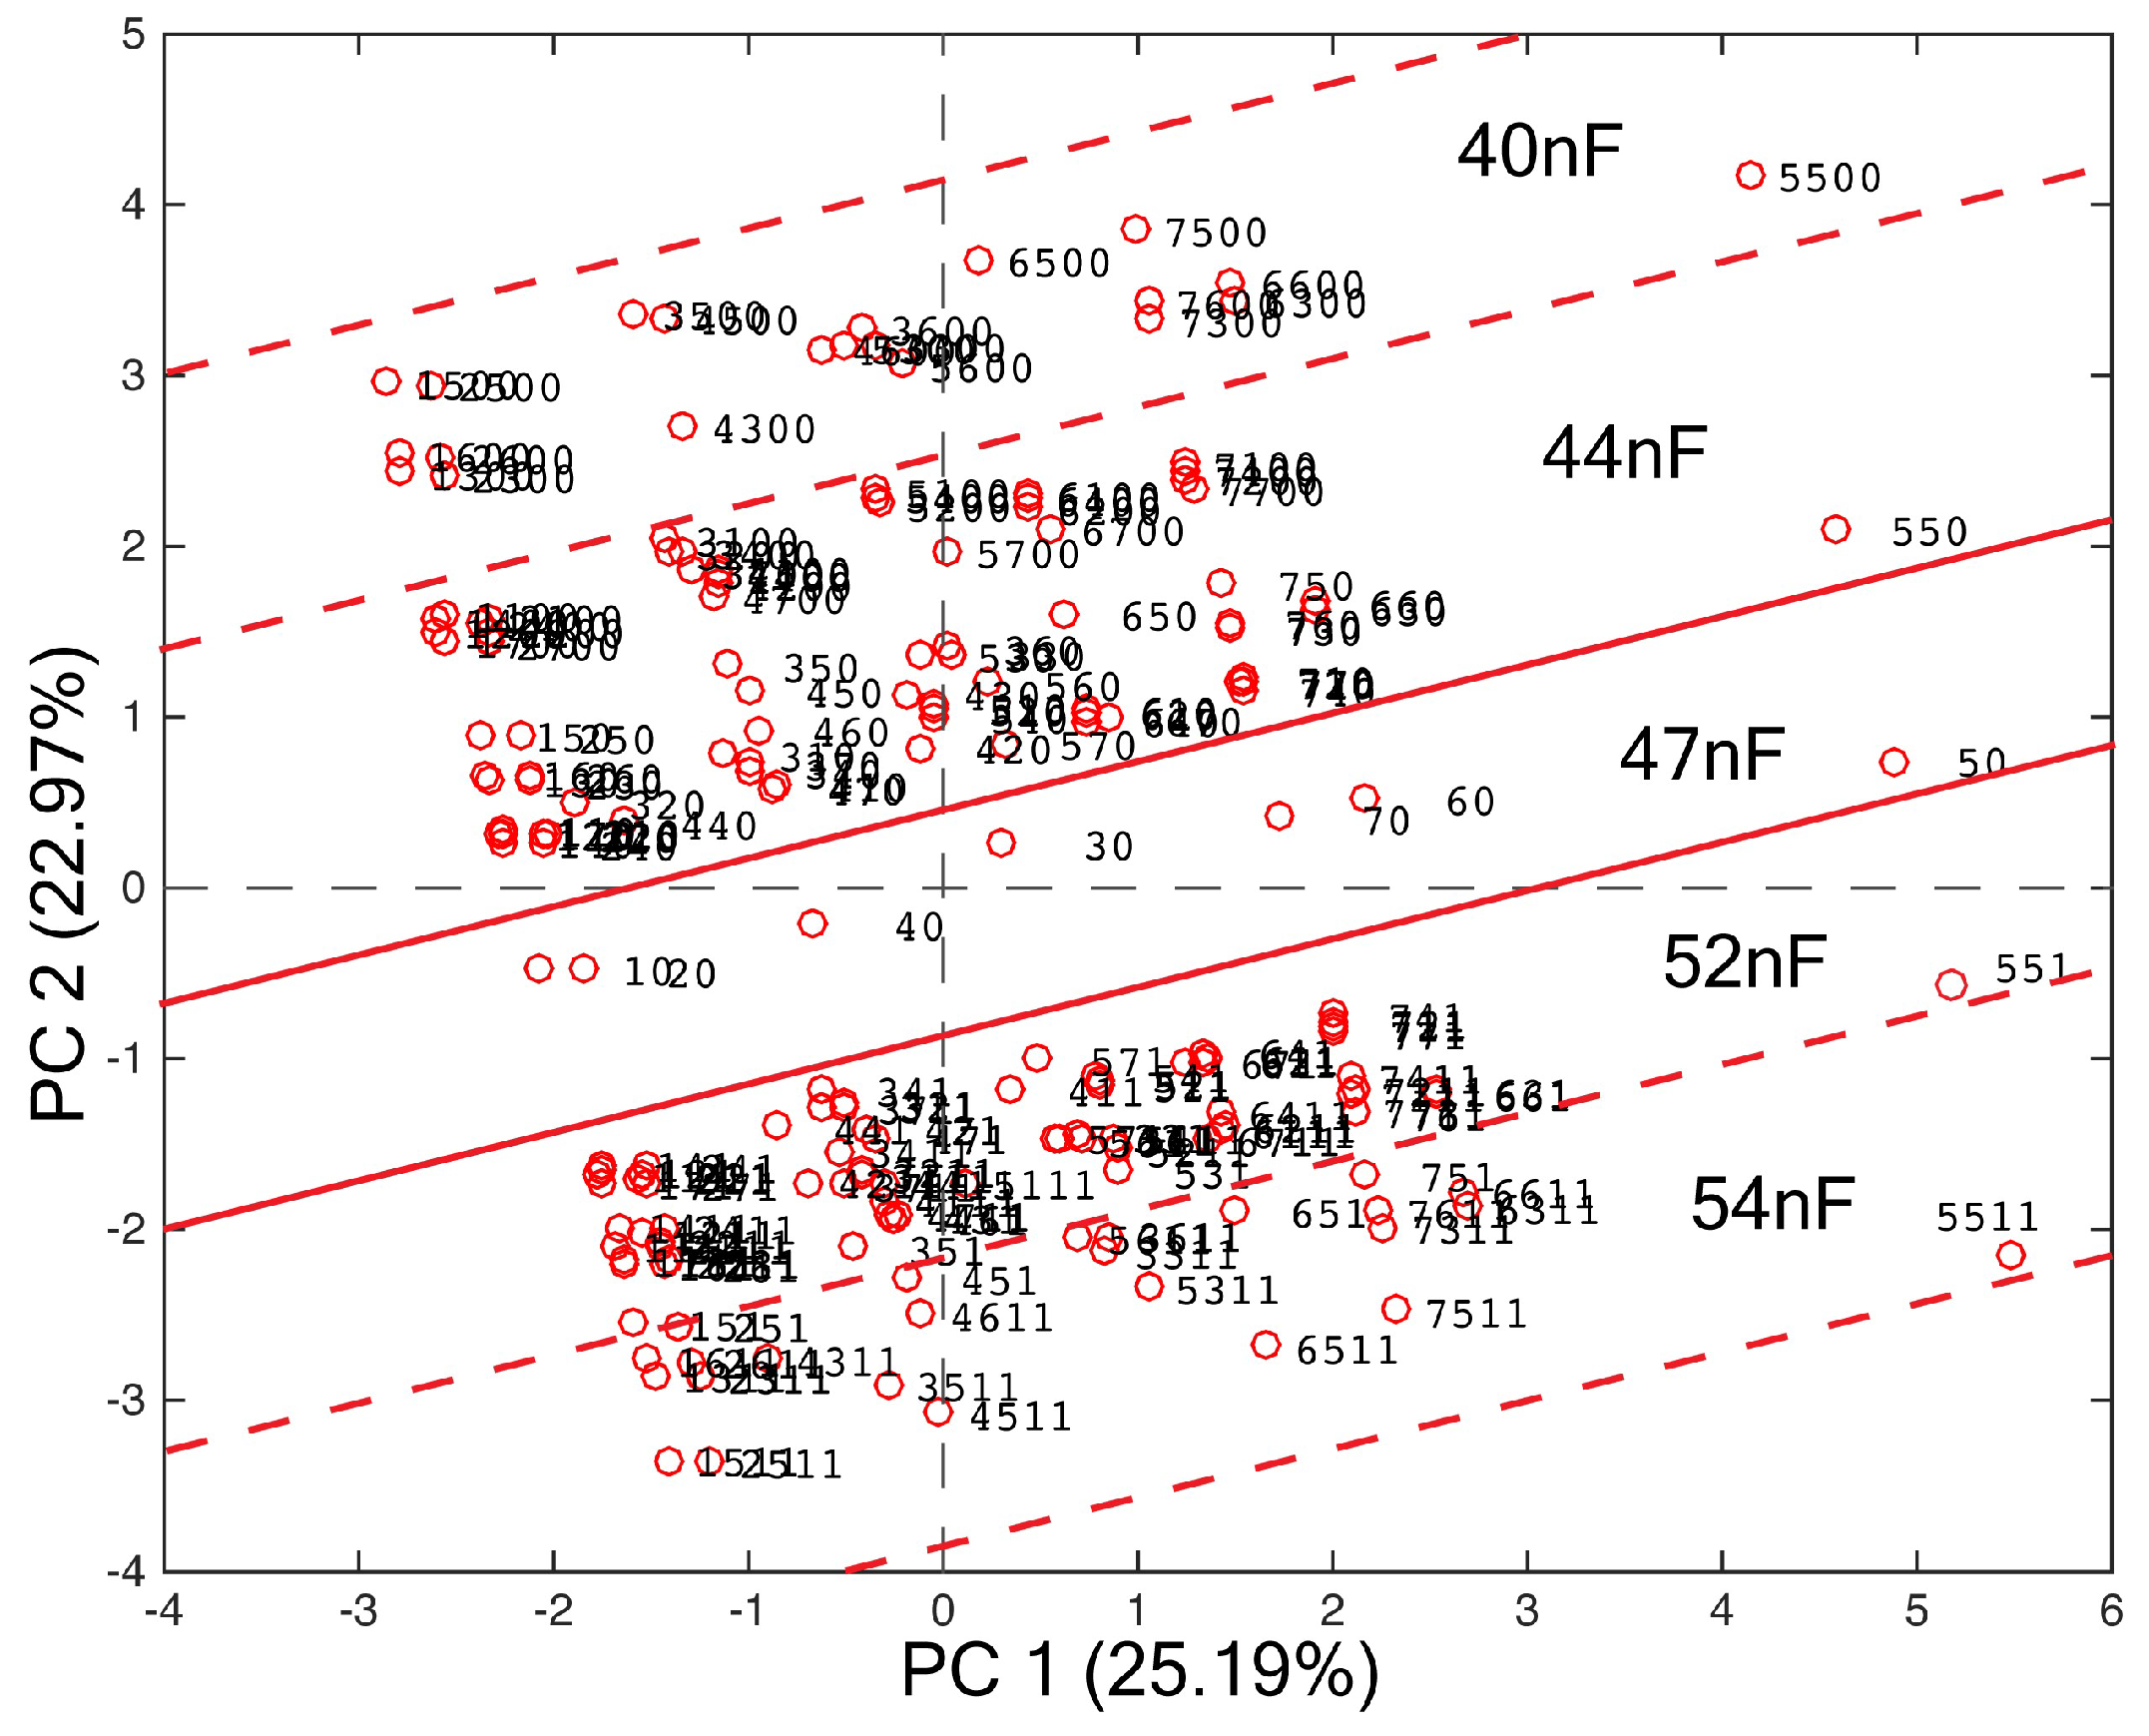
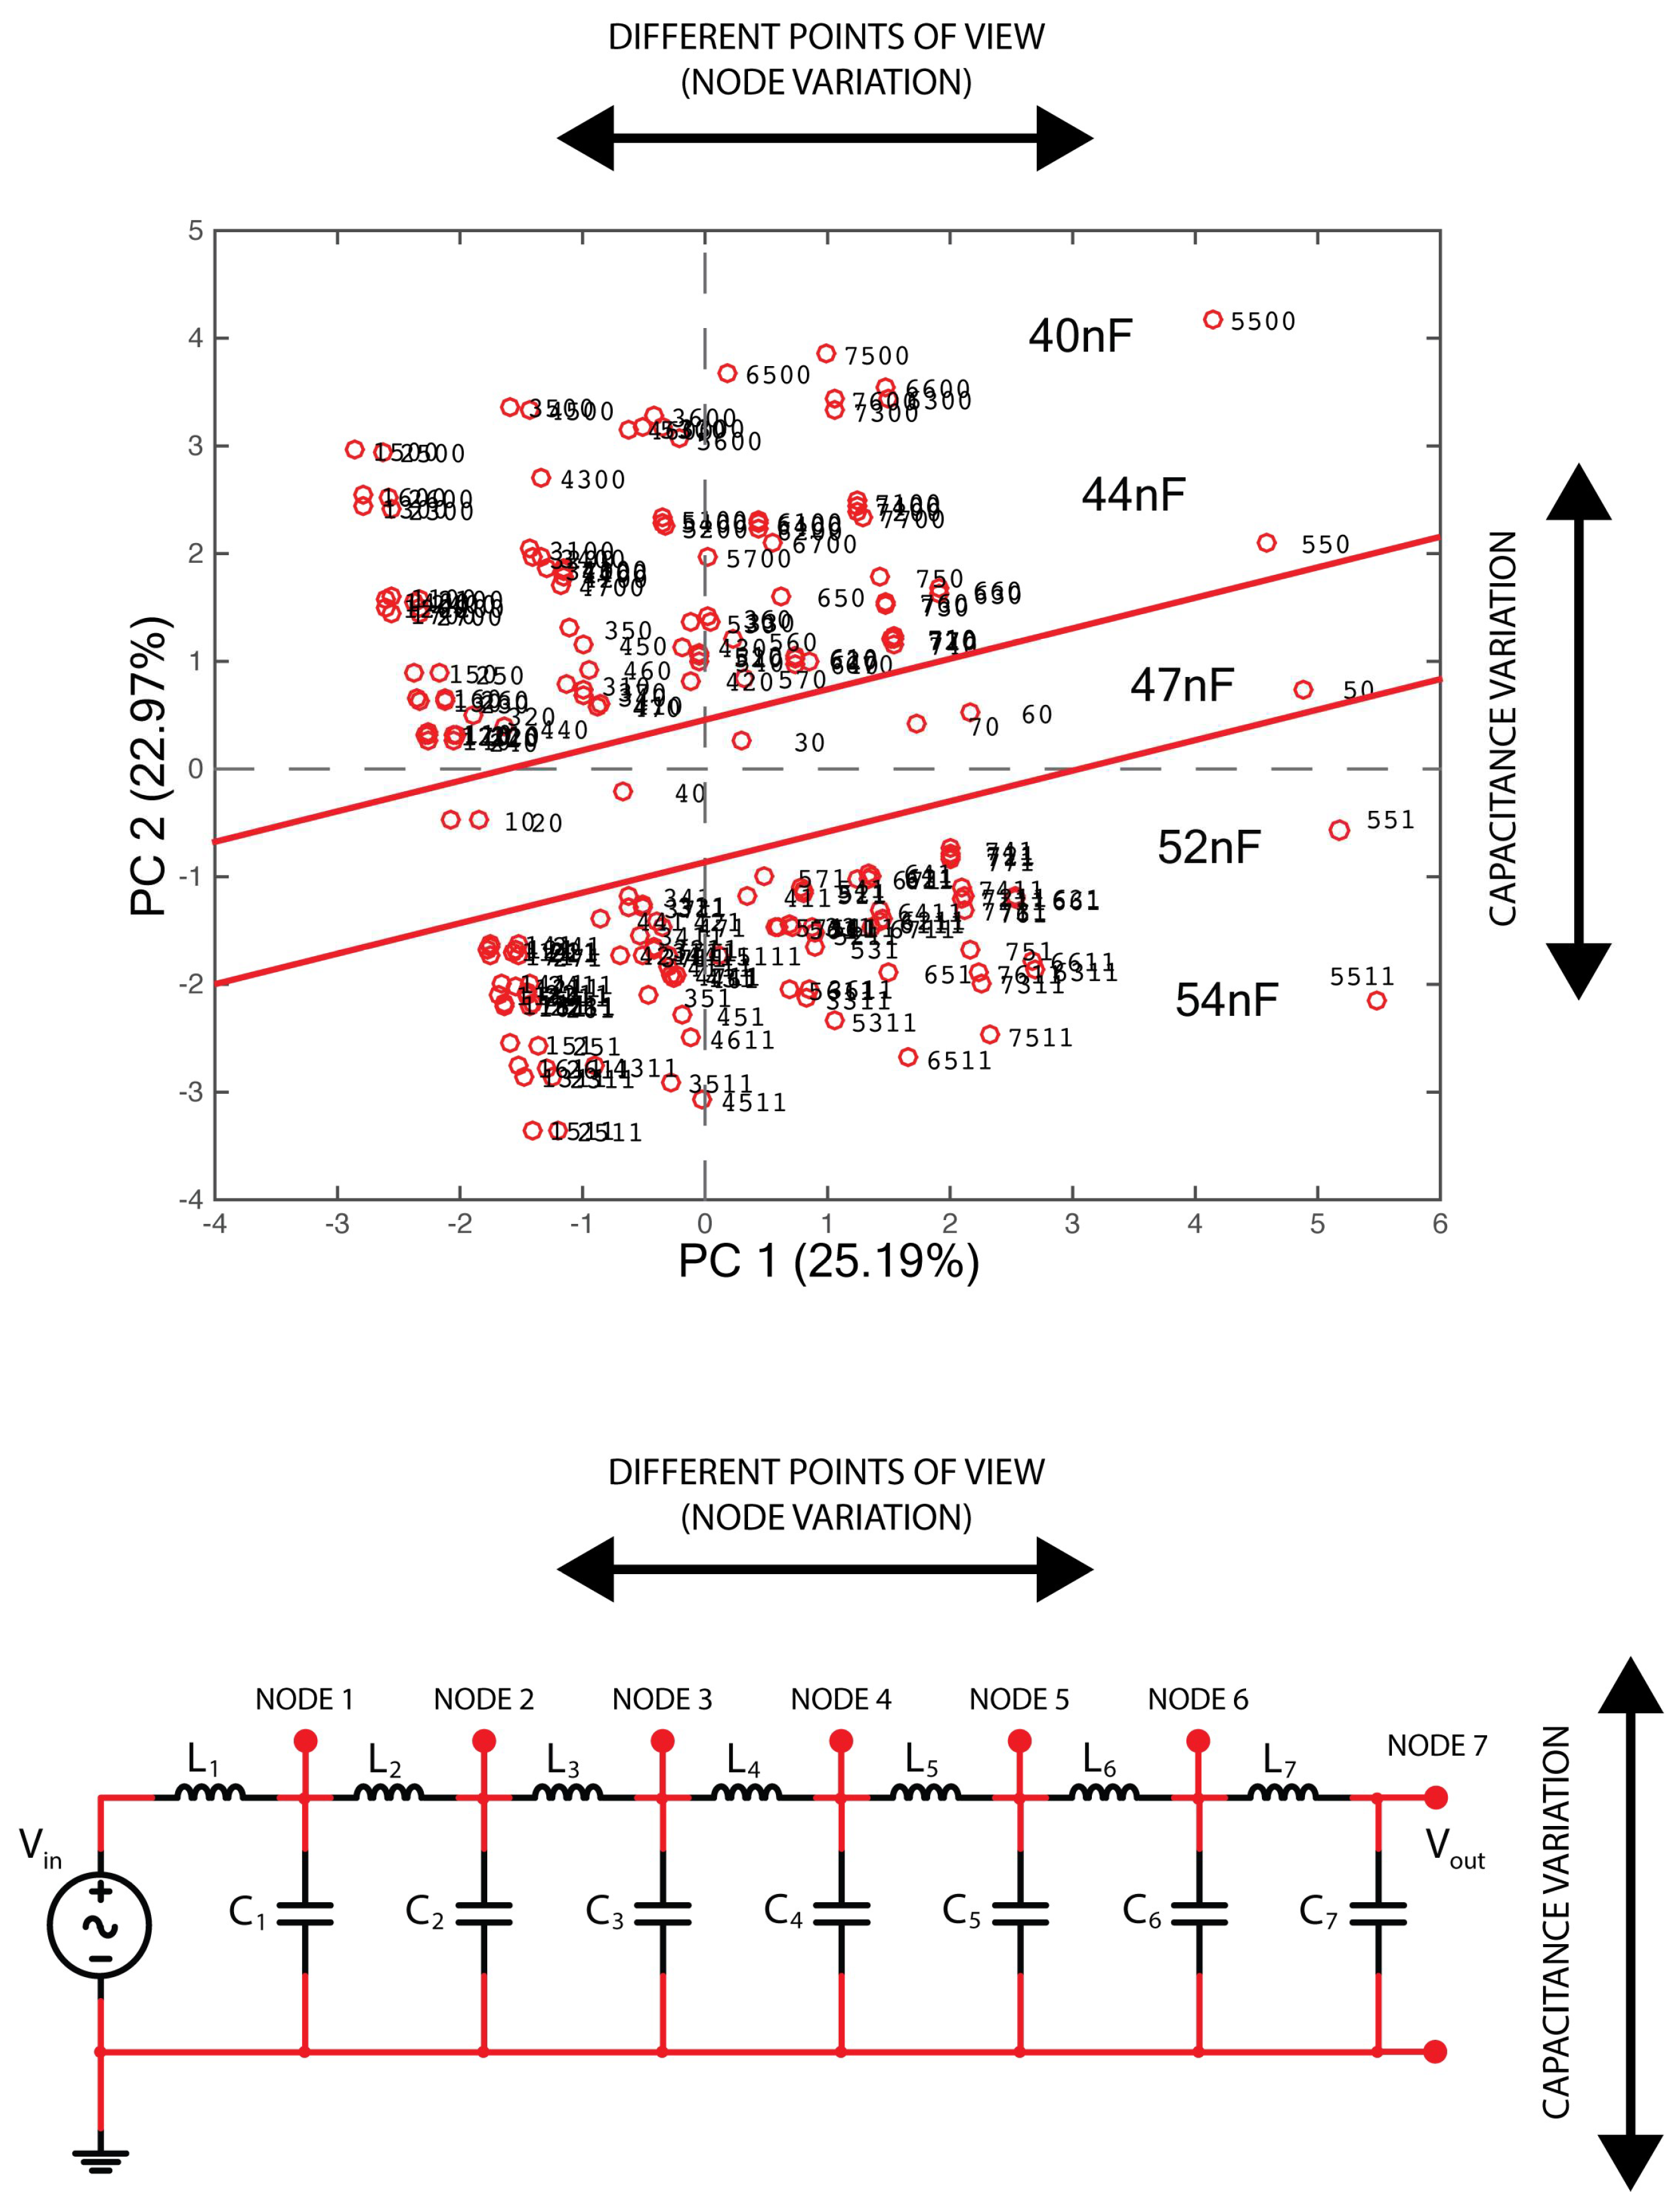
| Power of Monomials at the Denominator | ||||||||
|---|---|---|---|---|---|---|---|---|
| Cell # | X0 | X2 | X4 | X6 | X8 | X10 | X12 | X14 |
| 0 | 1 | - | - | - | - | - | - | - |
| 1 | 1 | −1 | - | - | - | - | - | - |
| 2 | 1 | −3 | 1 | - | - | - | - | - |
| 3 | 1 | −6 | 5 | −1 | - | - | - | - |
| 4 | 1 | −10 | 15 | −7 | 1 | - | - | - |
| 5 | 1 | −15 | 35 | −28 | 9 | −1 | - | - |
| 6 | 1 | −21 | 65 | −84 | 45 | −11 | 1 | - |
| 7 | 1 | −28 | 121 | −205 | 165 | −66 | 13 | −1 |
| Poles | |||||||
|---|---|---|---|---|---|---|---|
| Cell # | P1 | P2 | P3 | P4 | P5 | P6 | P7 |
| 1 | 18.61 | 55.01 | 89.02 | 119.15 | 144.04 | 162.66 | 174.18 |
| 2 | 18.61 | 55.01 | 89.02 | 119.15 | 144.04 | 162.66 | 174.18 |
| 3 | 18.61 | 55.01 | 0 | 119.15 | 144.04 | 162.66 | 174.18 |
| 4 | 18.61 | 55.01 | 89.02 | 119.15 | 144.04 | 162.66 | 174.18 |
| 5 | 18.61 | 0 | 89.02 | 119.15 | 0 | 162.66 | 174.18 |
| 6 | 18.61 | 55.01 | 0 | 119.15 | 144.04 | 162.66 | 174.18 |
| 7 | 18.61 | 55.01 | 89.02 | 119.15 | 144.04 | 162.66 | 174.18 |
| Zeros | ||||||
|---|---|---|---|---|---|---|
| Cell # | Z1 | Z2 | Z3 | Z4 | Z5 | Z6 |
| 1 | 21.46 | 63.13 | 101.13 | 133.26 | 157.65 | 172.86 |
| 2 | 25.33 | 73.96 | 116.6 | 0 | 149.79 | 170.84 |
| 3 | 30.91 | 0 | 0 | 136.39 | 0 | 167.3 |
| 4 | 39.61 | 0 | 111.01 | 0 | 160.43 | 0 |
| 5 | 0 | 0 | 0 | 0 | 0 | 0 |
| 6 | 0 | 0 | 0 | 0 | 0 | 0 |
| 7 | 0 | 0 | 0 | 0 | 0 | 0 |
| Poles | |||||||
|---|---|---|---|---|---|---|---|
| Cell # | P1 | P2 | P3 | P4 | P5 | P6 | P7 |
| 1 | 18.77 | 55.44 | 89.61 | 119.72 | 144.51 | 162.92 | 174.22 |
| 2 | 18.77 | 55.44 | 89.61 | 119.72 | 144.51 | 162.92 | 174.22 |
| 3 | 18.77 | 55.44 | 89.61 | 119.72 | 144.51 | 162.92 | 174.22 |
| 4 | 18.77 | 55.44 | 89.61 | 119.72 | 144.51 | 162.92 | 174.22 |
| 5 | 18.77 | 55.44 | 89.61 | 119.72 | 144.51 | 162.92 | 174.22 |
| 6 | 18.77 | 55.44 | 89.61 | 119.72 | 144.51 | 162.92 | 174.22 |
| 7 | 18.77 | 55.44 | 89.61 | 119.72 | 144.51 | 162.92 | 174.22 |
| Zeros | ||||||
|---|---|---|---|---|---|---|
| Cell # | Z1 | Z2 | Z3 | Z4 | Z5 | Z6 |
| 1 | 21.67 | 63.69 | 101.85 | 133.87 | 158.01 | 172.98 |
| 2 | 25.63 | 74.69 | 117.4 | 0 | 150.34 | 171 |
| 3 | 31.35 | 0 | 90.01 | 137.24 | 0 | 167.61 |
| 4 | 40.31 | 0 | 112.3 | 0 | 161.02 | 0 |
| 5 | 0 | 56.33 | 0 | 0 | 145.41 | 0 |
| 6 | 0 | 0 | 92 | 0 | 0 | 0 |
| 7 | 0 | 0 | 0 | 0 | 0 | 0 |
| Node | RMSECV [nF] |
|---|---|
| 1 | 0.36 |
| 2 | 0.19 |
| 3 | 0.17 |
| 4 | 0.31 |
| 5 | 2.08 × 10⁻⁶ |
| 6 | 0.16 |
| 7 | 0.20 |
© 2018 by the authors. Licensee MDPI, Basel, Switzerland. This article is an open access article distributed under the terms and conditions of the Creative Commons Attribution (CC BY) license (http://creativecommons.org/licenses/by/4.0/).
Share and Cite
D’Amico, A.; Santonico, M.; Pennazza, G.; Zompanti, A.; Scipioni, E.; Ferri, G.; Stornelli, V.; Salmeri, M.; Lojacono, R. Resonant Directly Coupled Inductors–Capacitors Ladder Network Shows a New, Interesting Property Useful for Application in the Sensor Field, Down to Micrometric Dimensions. Micromachines 2018, 9, 343. https://doi.org/10.3390/mi9070343
D’Amico A, Santonico M, Pennazza G, Zompanti A, Scipioni E, Ferri G, Stornelli V, Salmeri M, Lojacono R. Resonant Directly Coupled Inductors–Capacitors Ladder Network Shows a New, Interesting Property Useful for Application in the Sensor Field, Down to Micrometric Dimensions. Micromachines. 2018; 9(7):343. https://doi.org/10.3390/mi9070343
Chicago/Turabian StyleD’Amico, Arnaldo, Marco Santonico, Giorgio Pennazza, Alessandro Zompanti, Emma Scipioni, Giuseppe Ferri, Vincenzo Stornelli, Marcello Salmeri, and Roberto Lojacono. 2018. "Resonant Directly Coupled Inductors–Capacitors Ladder Network Shows a New, Interesting Property Useful for Application in the Sensor Field, Down to Micrometric Dimensions" Micromachines 9, no. 7: 343. https://doi.org/10.3390/mi9070343
APA StyleD’Amico, A., Santonico, M., Pennazza, G., Zompanti, A., Scipioni, E., Ferri, G., Stornelli, V., Salmeri, M., & Lojacono, R. (2018). Resonant Directly Coupled Inductors–Capacitors Ladder Network Shows a New, Interesting Property Useful for Application in the Sensor Field, Down to Micrometric Dimensions. Micromachines, 9(7), 343. https://doi.org/10.3390/mi9070343


