The Design and Positioning Method of a Flexible Zoom Artificial Compound Eye

Abstract
1. Introduction
2. Optimized Design of an Artificial Compound Eye: Aspherical Surface with Zoom
2.1. Structural Design of the Variable Focal Length Artificial Compound Eye
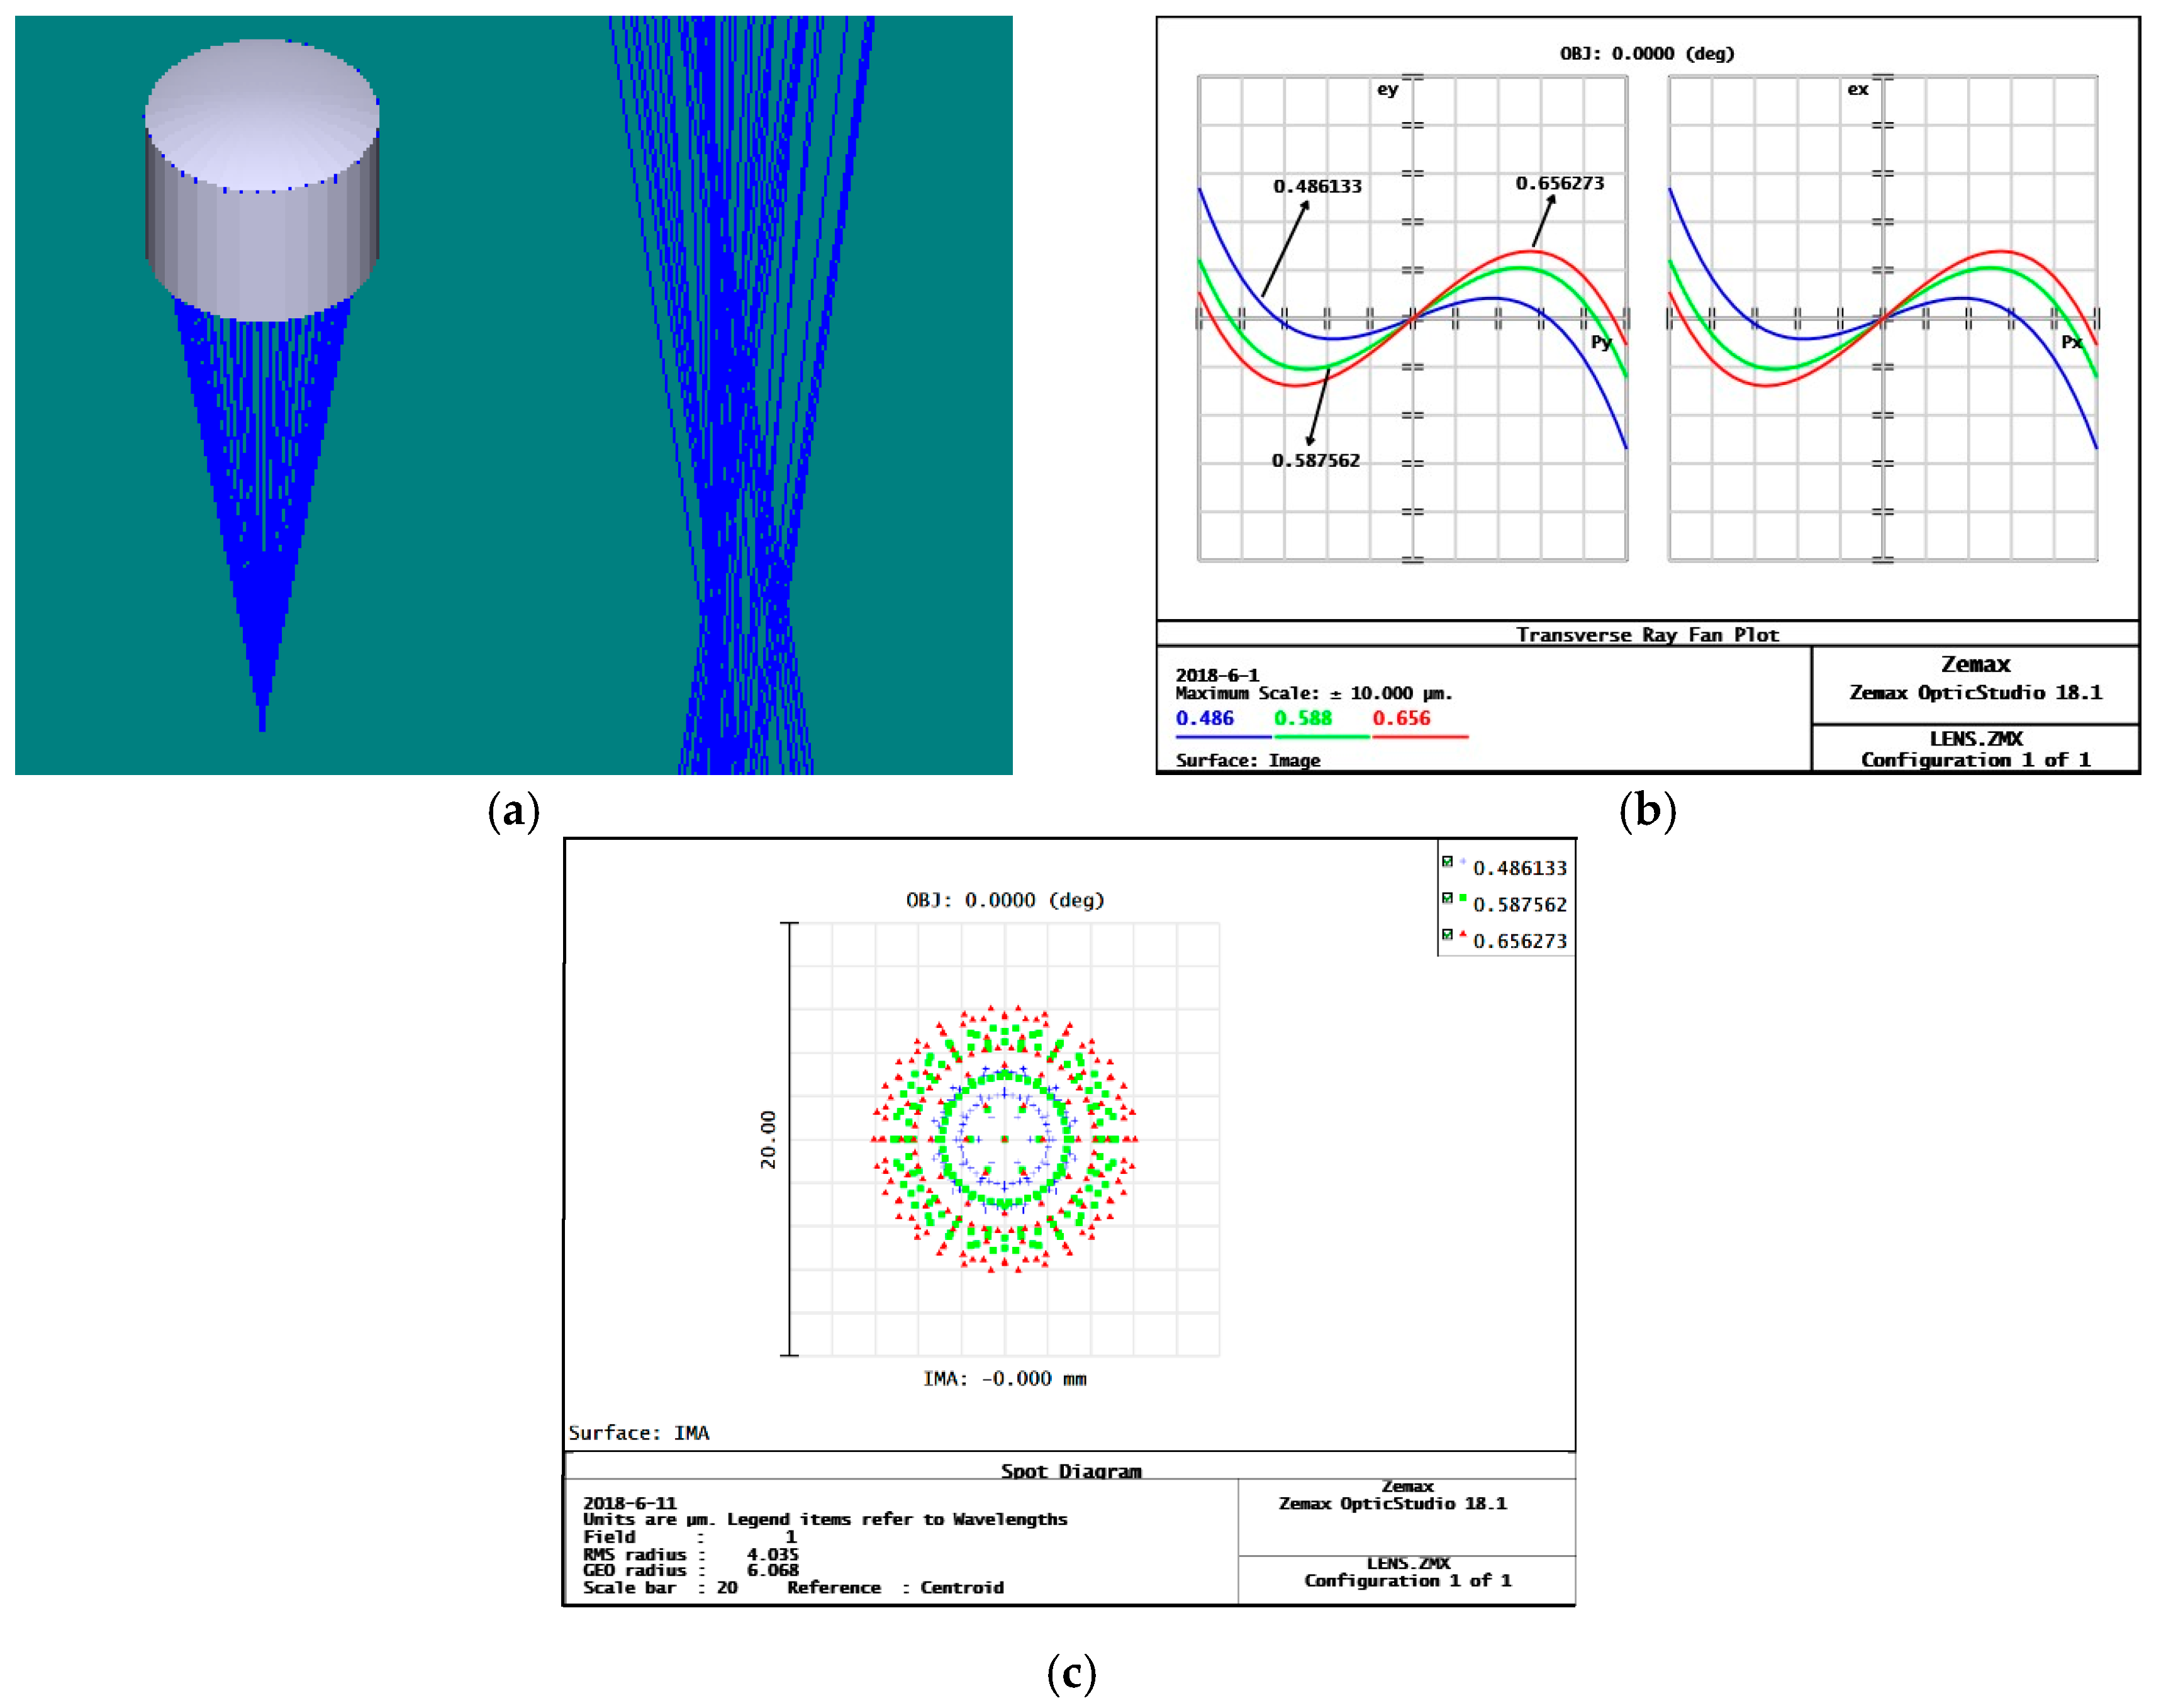
2.2. Analysis of the Imaging Performance of the Zoomed Compound Eye Model after Optimization
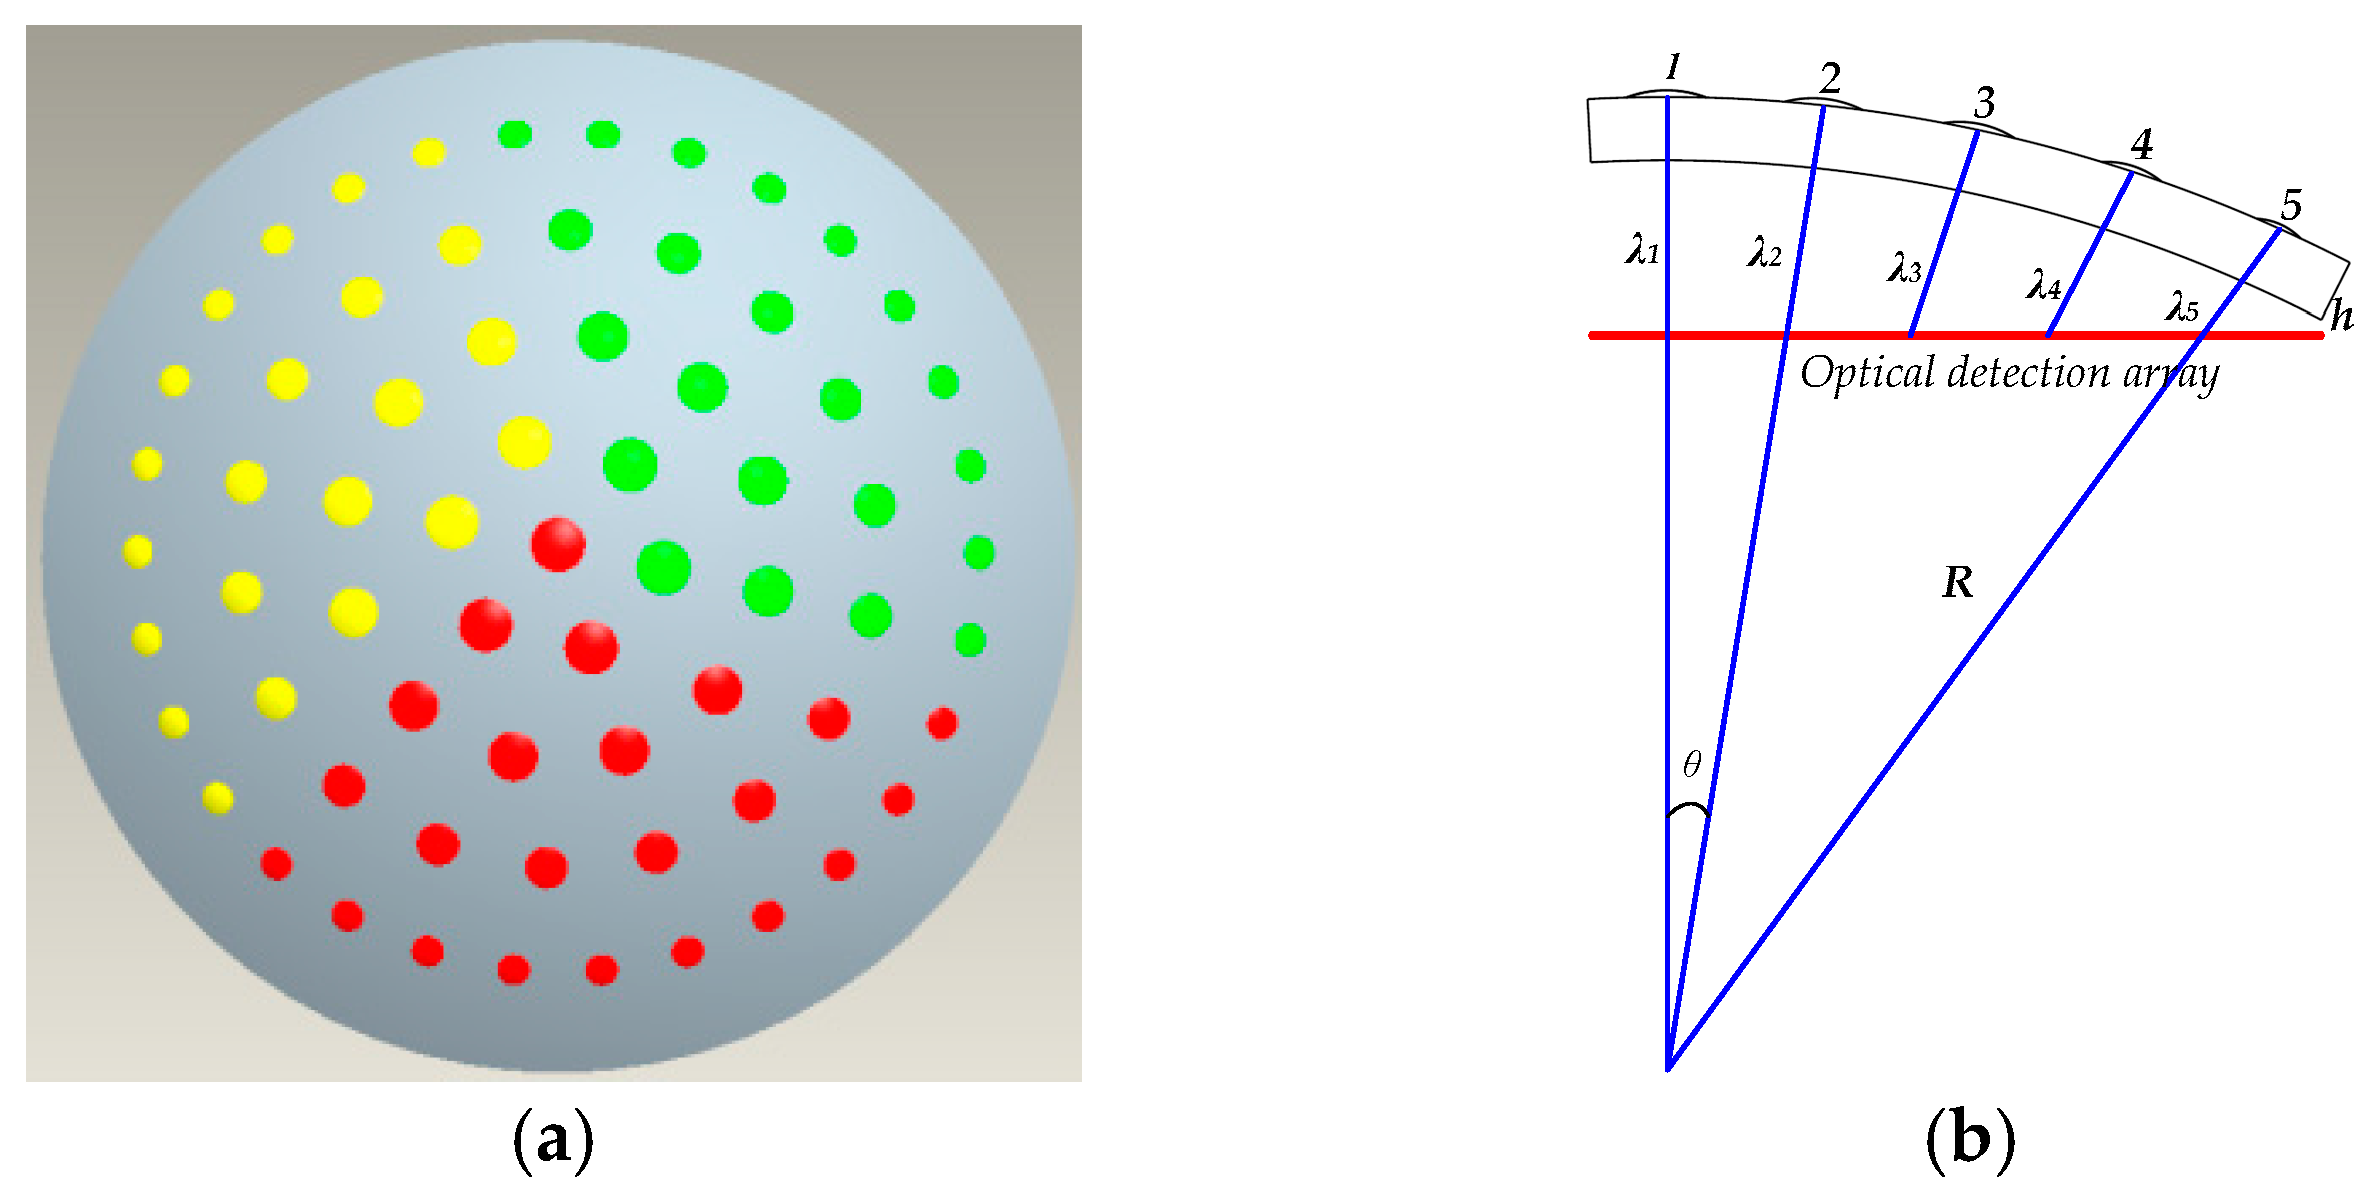
3. Multi-Eye Positioning Mathematical Model
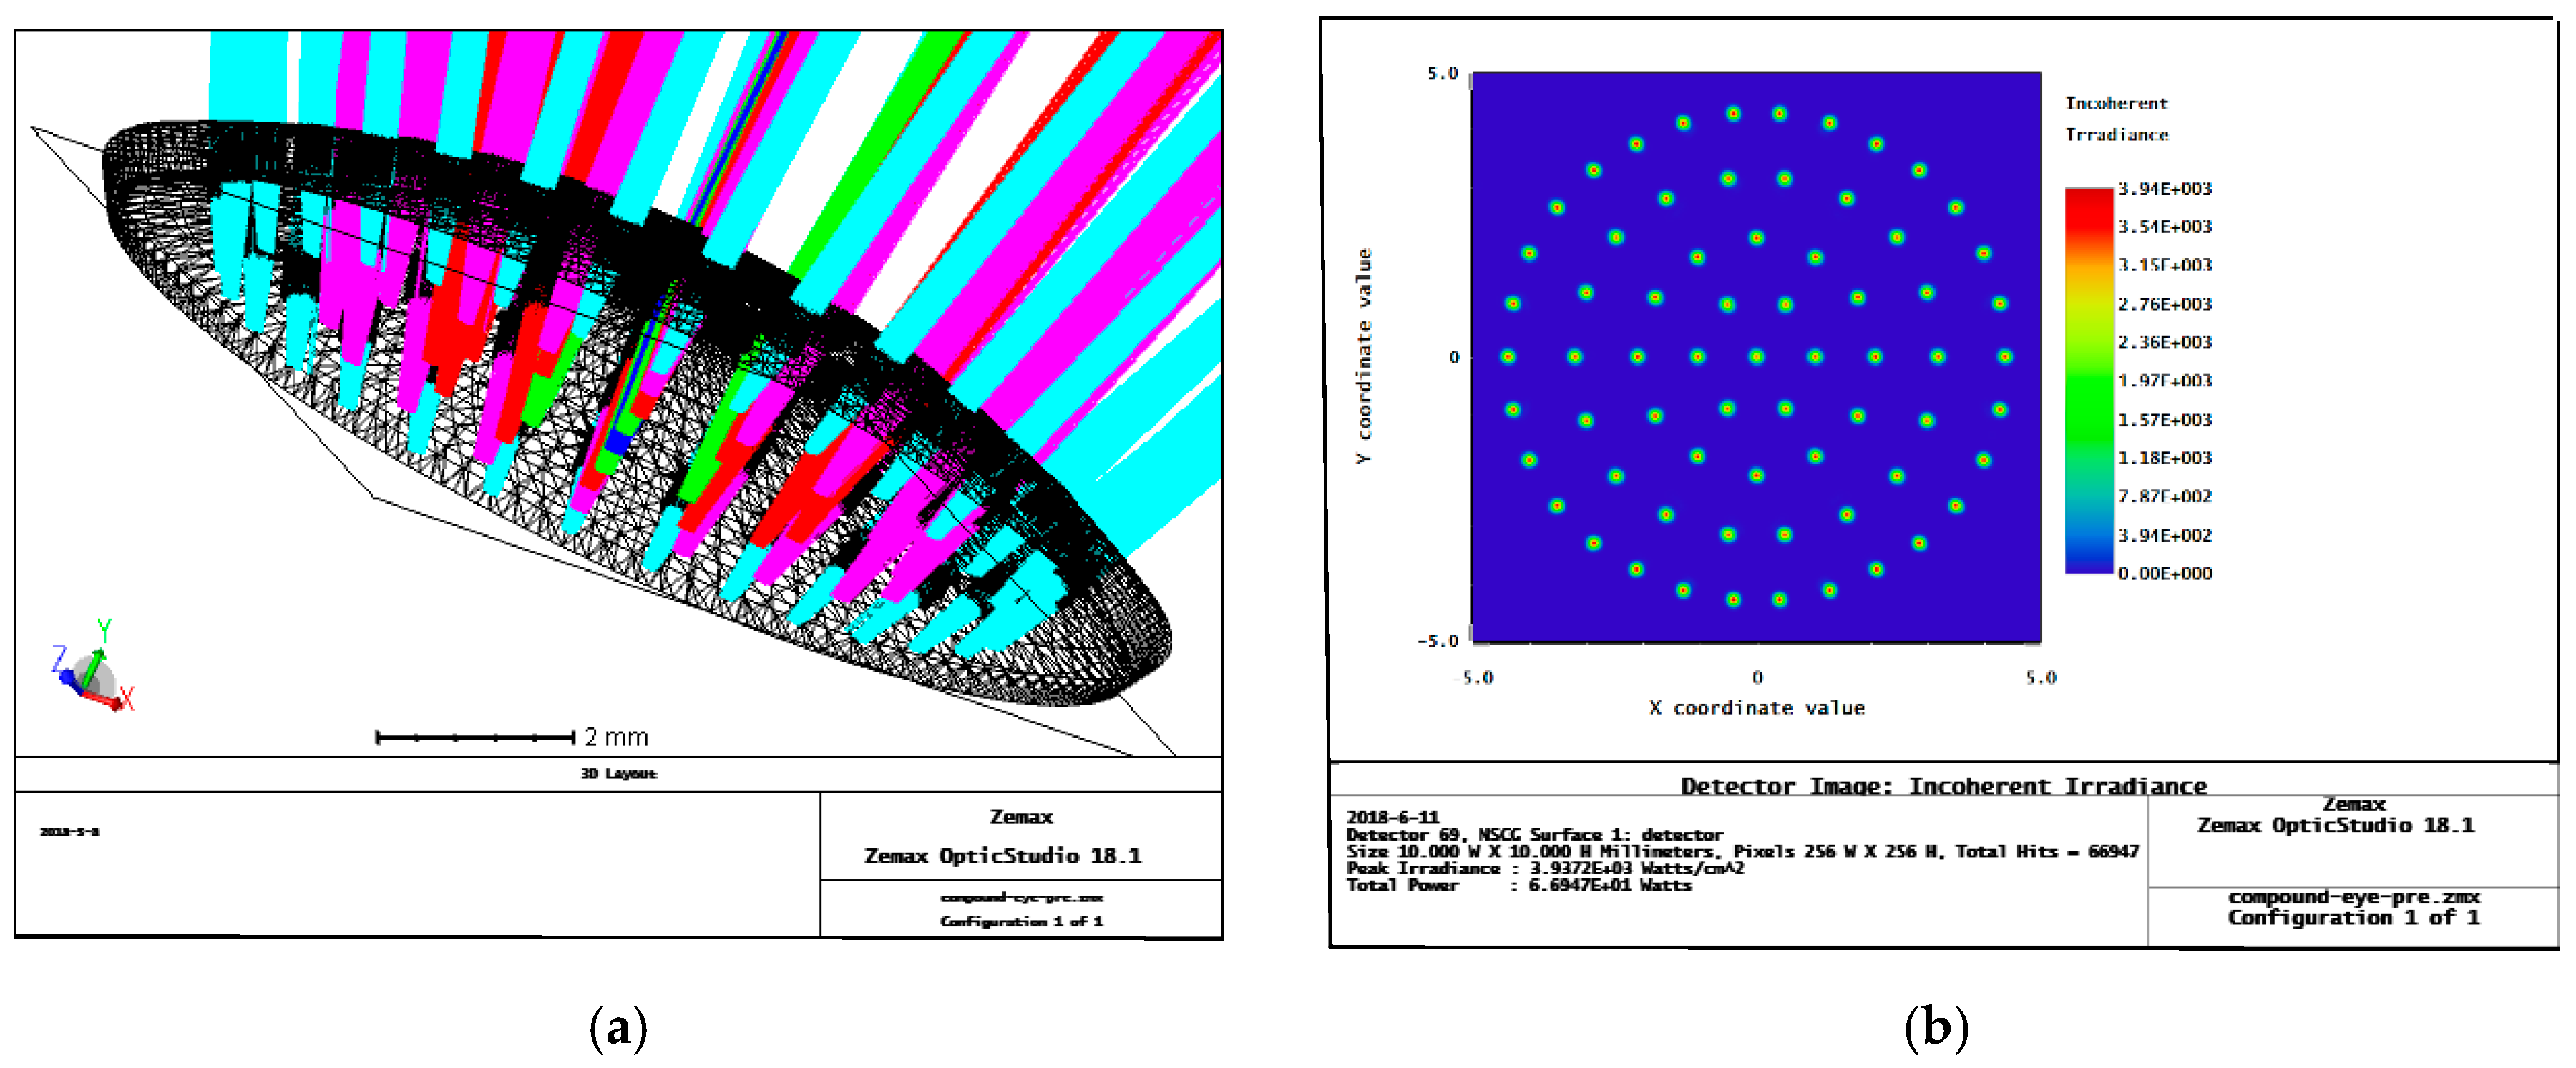
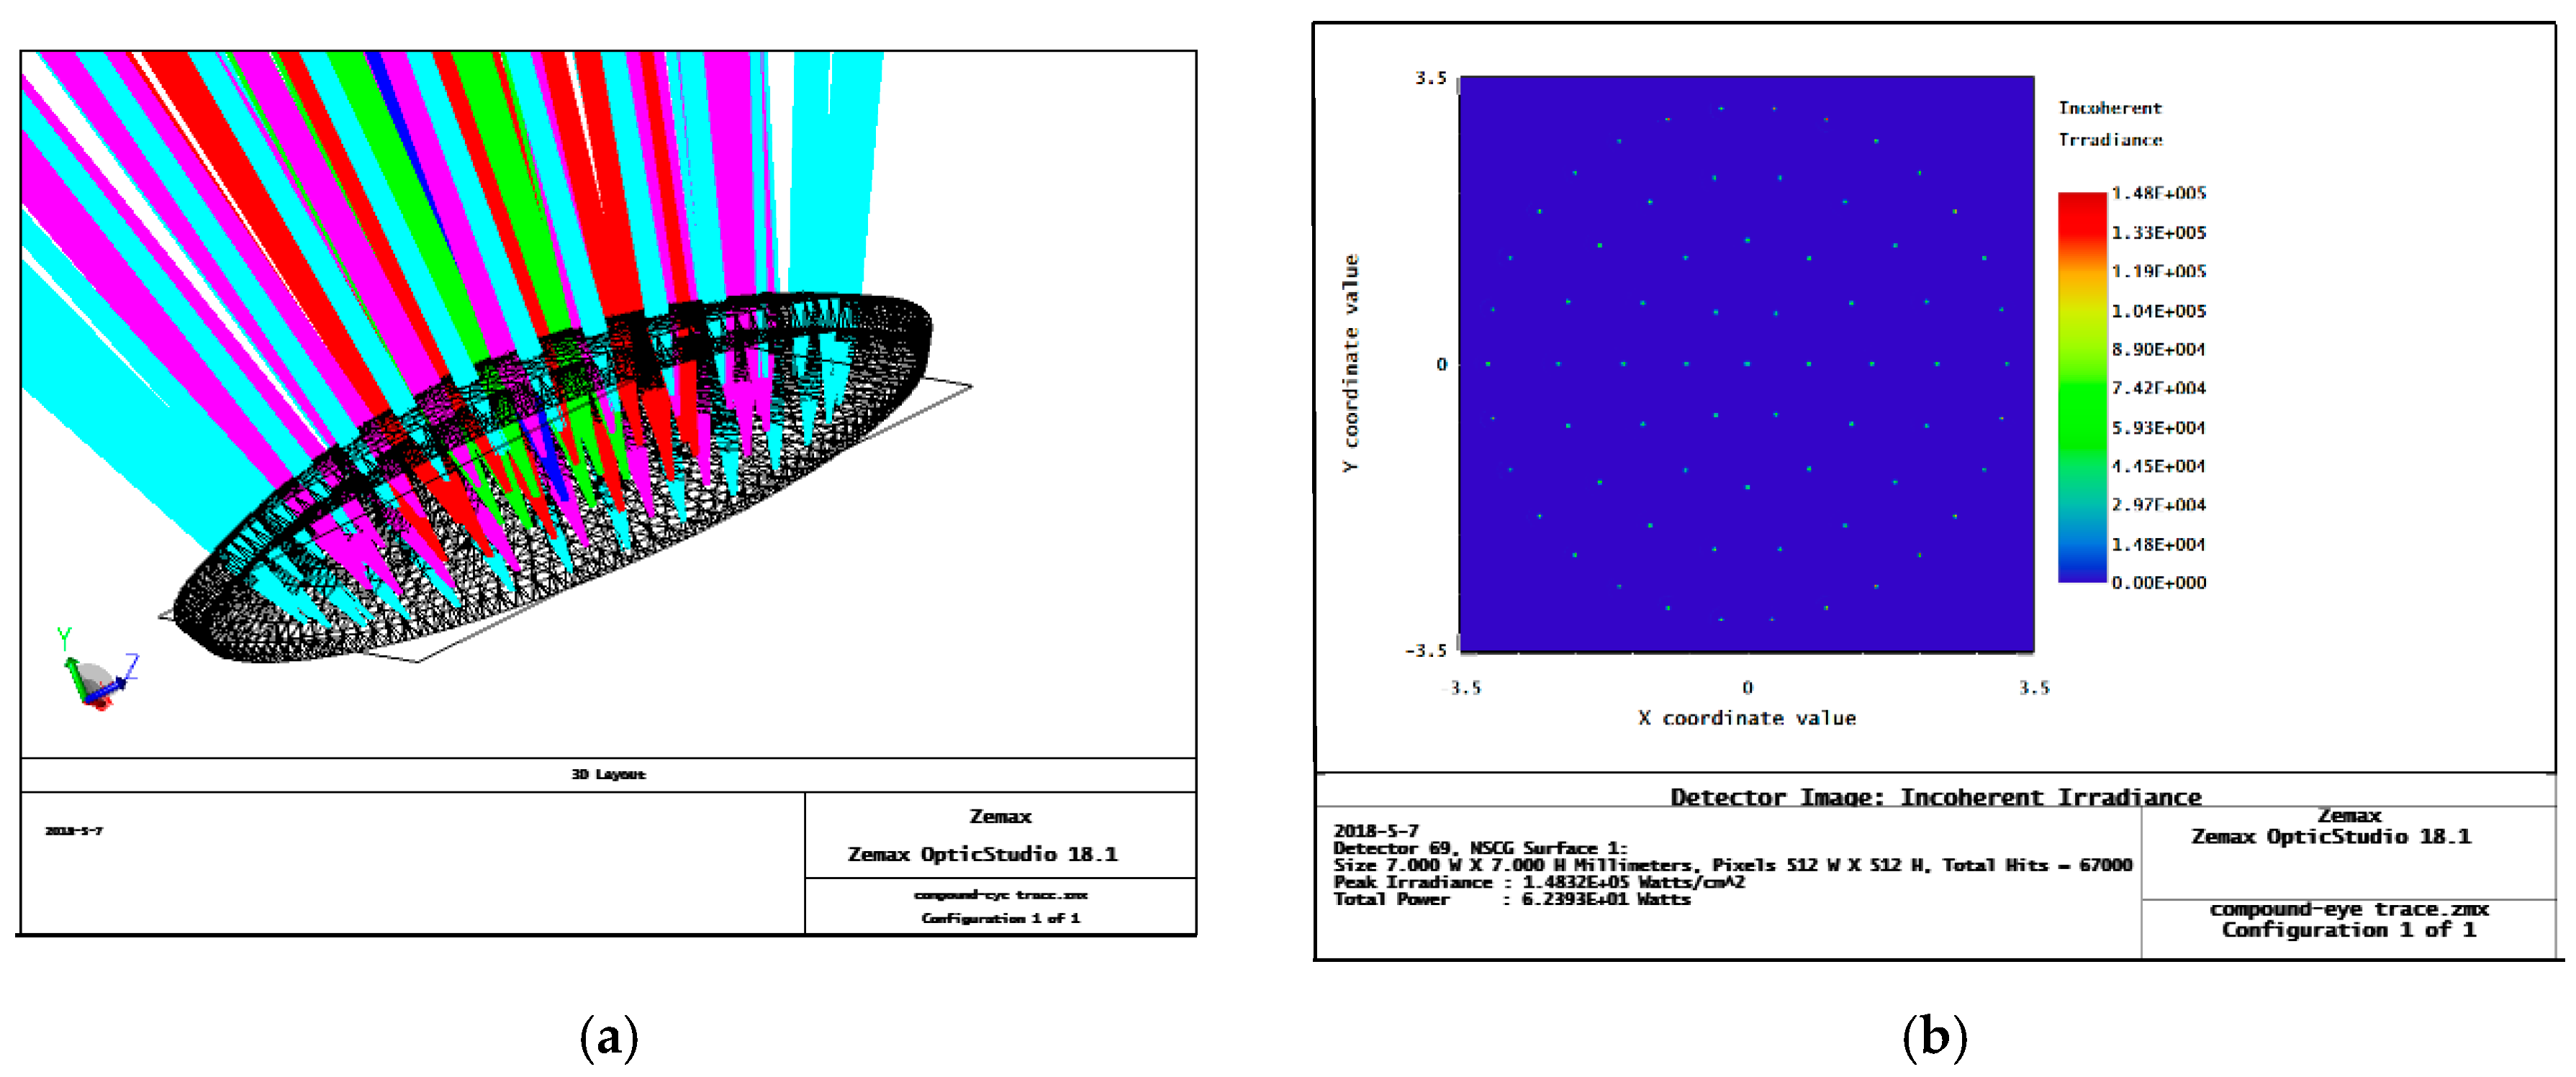
4. Analysis on the Imaging Performance of a Zoom Compound Eye on a Curved Surface
5. Multi-Eye Positioning Experiment on the Artificial Compound Eye
- The horizontal axis movement plane must be perpendicular to the target plane;
- The target plane must be parallel to the artificial eye compound plane;
- The intersection of the optical axis of the main compound lens with the target plane and the distance between the center of the main lens and the intersection point of the main compound lens must be the same.
6. Conclusions
Author Contributions
Funding
Conflicts of Interest
References
- Chen, H.P.; Shen, X.J.; Li, X.F.; Jin, Y.S. Bionic mosaic method of panoramic image based on compound eye of fly. J. Bionic Eng. 2011, 8, 440–448. [Google Scholar] [CrossRef]
- Lichtensteiger, L.; Eggenberger, P. Evolving the morphology of a compound eye on a robot. In Proceedings of the Third European Workshop on Advance Mobile Robots (Eurobot ‘99), Zurich, Switzerland, 6–9 September 1999; Cat. No.99EX355. Institute of Electrical and Electronics Engineers: Zurich, Switzerland, 1999; pp. 127–134. [Google Scholar]
- Lee, L.P.; Szema, R. Inspirations from biological optics for advanced photonic systems. Science 2005, 310, 1148–1150. [Google Scholar] [CrossRef] [PubMed]
- Choi, C.; Choi, M.K.; Liu, S.Y.; Kim, M.S.; Park, O.K.; Im, C.; Kim, J.; Qin, X.L.; Lee, G.J.; Cho, K.W.; et al. Human eye-inspired soft optoelectronic device using high-density MoS2-graphene curved image sensor array. Nat. Commun. 2017, 8, 1664. [Google Scholar] [CrossRef] [PubMed]
- Radtke, D.; Duparré, J.; Zeitner, U.D.; Tünnermann, A. Laser lithographic fabrication and characterization of a spherical artificial compound eye. Opt. Express 2007, 15, 3067–3077. [Google Scholar] [CrossRef] [PubMed]
- Nakamura, T.; Horisaki, R.; Tanida, J. Computational superposition compound eye imaging for extended depth-of-field and field-of-view. Opt. Express 2012, 20, 27482–27495. [Google Scholar] [CrossRef] [PubMed]
- Park, B.G.; Choi, K.; Jo, C.J.; Lee, H.S. Micro lens-on-lens array. Soft Matter 2012, 8, 1751–1755. [Google Scholar] [CrossRef]
- Moghimi, M.J.; Fernandes, J.; Kanhere, A.; Jiang, H. Micro-fresnel-zone-plate array on flexible substrate for large field-of-view and focus scanning. Sci. Rep. 2015, 5, 15861. [Google Scholar] [CrossRef] [PubMed]
- Deng, Z.; Chen, F.; Yang, Q.; Bian, H.; Du, G.; Yong, J.; Shan, C.; Hou, X. Dragonfly-eye-inspire artificial compound eyes with sophisticated imaging. Adv. Funct. Mater. 2016, 26, 1995–2001. [Google Scholar] [CrossRef]
- Pang, K.; Fang, F.; Song, L.; Zhang, Y.; Zhang, H. Bionic compound eye for 3D motion detection using an optical freeform surface. J. Opt. Soc. Am. B 2017, 34, B28–B35. [Google Scholar] [CrossRef]
- Jeong, K.H.; Kim, J.; Lee, L.P. Biologically inspired artificial compound eye. Science 2006, 312, 557–561. [Google Scholar] [CrossRef] [PubMed]
- Li, L.; Yi, A.Y. Microfabrication on a curved surface using 3D microlens array projection. J. Micromech. Microeng. 2009, 19, 105010. [Google Scholar] [CrossRef]
- Li, L.; Yi, A.Y. Development of a 3D artificial compound eye. Opt. Express 2010, 18, 18125–18137. [Google Scholar] [CrossRef] [PubMed]
- Floreano, D.; Pericet-Camara, R.; Viollet, S.; Ruer, F.; Brückner, A.; Leitel, R.; Buss, W.; Menouni, M.; Expert, F.; Juston, R.; et al. Miniature curved artifcial compound eyes. Proc. Natl. Acad. Sci. USA 2013, 110, 9267–9272. [Google Scholar] [CrossRef] [PubMed]
- Expert, F.; Ruffier, F. Flying over uneven moving terrain based on optic-flow cues without any need for reference frames or accelerometers. Bioinspir. Biomim. 2015, 10, 026003. [Google Scholar] [CrossRef] [PubMed]
- Song, Y.M.; Xie, Y.; Malyarchuk, V.; Xiao, J.; Jung, I.; Choi, K.J.; Liu, Z.; Park, H.; Lu, C.; Kim, R.H.; et al. Digital cameras with designs inspired by the arthropod eye. Nature 2013, 497, 95–99. [Google Scholar] [CrossRef] [PubMed]
- Li, Z.W.; Xiao, J.L. Mechanics and optics of stretchable elastomeric microlens array for artificial compound eye camera. J. Appl. Phys. 2015, 117, 014904. [Google Scholar] [CrossRef]
- Wang, S.; Xiao, J.; Song, J.; Ko, H.C.; Hwang, K.C.; Huang, Y.; Rogers, J.A. Mechanics of curvilinear electronics. Soft Matter 2010, 6, 5757–5763. [Google Scholar] [CrossRef]
- Liu, F.; Diao, X.; Li, L.; Hao, Y.; Jiao, Z. Fabrication and characterization of in homogeneous curved artificial compound eye. Micromachines 2018, 9, 238. [Google Scholar] [CrossRef]
- Scheiding, S.; Yi, A.Y.; Gebhardt, A.; Li, L.; Risse, S.; Eberhardt, R.; Tunnermann, A. Freeform manufacturing of a microoptical lens array on a steep curved substrate by use of a voice coil fast tool servo. Opt. Express 2011, 19, 23938. [Google Scholar] [CrossRef] [PubMed]
- Zhang, H. Development of a low cost high precision three layer 3D artificial compound eye. Opt. Express 2013, 21, 22232–22245. [Google Scholar] [CrossRef] [PubMed]
- Zhang, K.; Jung, Y.H.; Mikael, S.; Seo, J.H.; Kim, M.; Mi, H.Y.; Zhou, H.; Xia, Z.Y.; Zhou, W.D.; Gong, S.Q.; et al. Origami silicon optoelectronics for hemispherical electronic eye systems. Nat. Commum. 2017, 8, 1782. [Google Scholar] [CrossRef] [PubMed]
- Lee, G.J.; Choi, C.; Kim, D.H.; Song, Y.M. Bioinspired artificial eyes: Optic components, digital cameras, and visual prostheses. Adv. Funct. Mater. 2018. [Google Scholar] [CrossRef]
- Hao, Y.P.; Zhao, L.F.; Zhang, J.Y. Optimal research of aspherical zoom curved compound eye. Infrared Laser Eng. 2015, 44, 157–161. [Google Scholar]


| Base Radius | Angle between Adjacent Microlenses | Center to Edge Angle | Material | Refractive Index |
|---|---|---|---|---|
| 4.5 | 6° | 24° | PDMS 1 | 1.406 |
| Sub-Eye Level | Level 1 | Level 2 | Level 3 | Level 4 | Level 5 |
|---|---|---|---|---|---|
| rn(mm) | 0.946 | 0.894 | 0.829 | 0.709 | 0.528 |
| fn(mm) | 2.227 | 2.173 | 2.009 | 1.724 | 1.302 |
| Sub-Eye Level | Level 1 | Level 2 | Level 3 | Level 4 | Level 5 |
|---|---|---|---|---|---|
| Pre-optimization (μm) | 2.911 | 3.174 | 2.955 | 2.662 | 2.205 |
| Post-optimization (μm) | 0.023 | 0.020 | 0.019 | 0.067 | 0.037 |
| Sub-Eye Level | Level 1 | Level 2 | Level 3 | Level 4 | Level 5 |
|---|---|---|---|---|---|
| Focal length (mm) | 2.227 | 2.173 | 2.009 | 1.724 | 1.302 |
| Sub-eye surface radius of curvature (mm) | 0.9298 | 0.9102 | 0.895 | 0.694 | 0.5149 |
| Numerical aperture (mm) | 0.638 | 0.624 | 0.59 | 0.501 | 0.382 |
| Height (mm) | 0.0561 | 0.0520 | 0.0489 | 0.0432 | 0.0345 |
| Region | Level 2 | Level 3 | Level 4 | Level 5 |
|---|---|---|---|---|
| A | 6.2235 | 5.821 | 5.251 | 4.885 |
| B | 5.613 | 4.184 | 3.905 | 3.685 |
| C | 5.75 | 4.646 | 4.297 | 4.306 |
| Number of Captured Sub-Eyes | Target Point Coordinates | X Error | Y Error | Z Error |
|---|---|---|---|---|
| 2 | (8.48130, 4.3735, 35.6823) | 54.40% | 65.06% | 58.02% |
| 3 | (8.76780, 5.0243, 38.3295) | 52.86% | 59.86% | 54.90% |
| 4 | (9.39870, 5.5143, 40.0674) | 49.46% | 55.95% | 52.86% |
| 5 | (9.59450, 5.5663, 41.8220) | 48.41% | 55.54% | 50.79% |
| 6 | (10.3022, 5.7101, 42.6291) | 44.61% | 54.39% | 49.84% |
| 7 | (9.4464, 5.4071, 43.2847) | 49.21% | 56.81% | 49.07% |
| 8 | (10.2208, 5.6696, 43.5180) | 45.04% | 54.71% | 48.80% |
| 9 | (11.1493, 6.0254, 46.3066) | 40.05% | 51.87% | 45.52% |
| 10 | (12.8394, 6.2577, 48.8626) | 30.97% | 50.01% | 42.51% |
| 11 | (13.9621, 6.2632, 49.2046) | 24.93% | 49.97% | 42.11% |
| 12 | (13.8682, 6.2564, 49.0375) | 25.43% | 50.02% | 42.30% |
| 13 | (13.9867, 6.3666, 49.3266) | 24.80% | 49.15% | 41.96% |
| 14 | (14.9411, 6.8690, 50.8268) | 19.67% | 45.13% | 40.20% |
| 15 | (14.8166, 7.4969, 57.8406) | 20.34% | 40.12% | 31.95% |
| 16 | (15.2169, 8.8299, 60.5823) | 18.18% | 29.47% | 28.72% |
| 17 | (15.6933, 8.94870, 60.8983) | 15.62% | 28.52% | 28.35% |
| 18 | (16.2307, 9.7869, 65.7329) | 12.73% | 21.82% | 22.66% |
| 19 | (16.4409, 10.3442, 74.2530) | 11.60% | 17.37% | 12.64% |
| 20 | (16.8539, 10.8893, 78.7162) | 9.38% | 13.02% | 7.39% |
© 2018 by the authors. Licensee MDPI, Basel, Switzerland. This article is an open access article distributed under the terms and conditions of the Creative Commons Attribution (CC BY) license (http://creativecommons.org/licenses/by/4.0/).
Share and Cite
Li, L.; Hao, Y.; Xu, J.; Liu, F.; Lu, J. The Design and Positioning Method of a Flexible Zoom Artificial Compound Eye. Micromachines 2018, 9, 319. https://doi.org/10.3390/mi9070319
Li L, Hao Y, Xu J, Liu F, Lu J. The Design and Positioning Method of a Flexible Zoom Artificial Compound Eye. Micromachines. 2018; 9(7):319. https://doi.org/10.3390/mi9070319
Chicago/Turabian StyleLi, Lun, Yongping Hao, Jiulong Xu, Fengli Liu, and Jiang Lu. 2018. "The Design and Positioning Method of a Flexible Zoom Artificial Compound Eye" Micromachines 9, no. 7: 319. https://doi.org/10.3390/mi9070319
APA StyleLi, L., Hao, Y., Xu, J., Liu, F., & Lu, J. (2018). The Design and Positioning Method of a Flexible Zoom Artificial Compound Eye. Micromachines, 9(7), 319. https://doi.org/10.3390/mi9070319