A Study on Measurement Variations in Resonant Characteristics of Electrostatically Actuated MEMS Resonators

Abstract
:1. Introduction
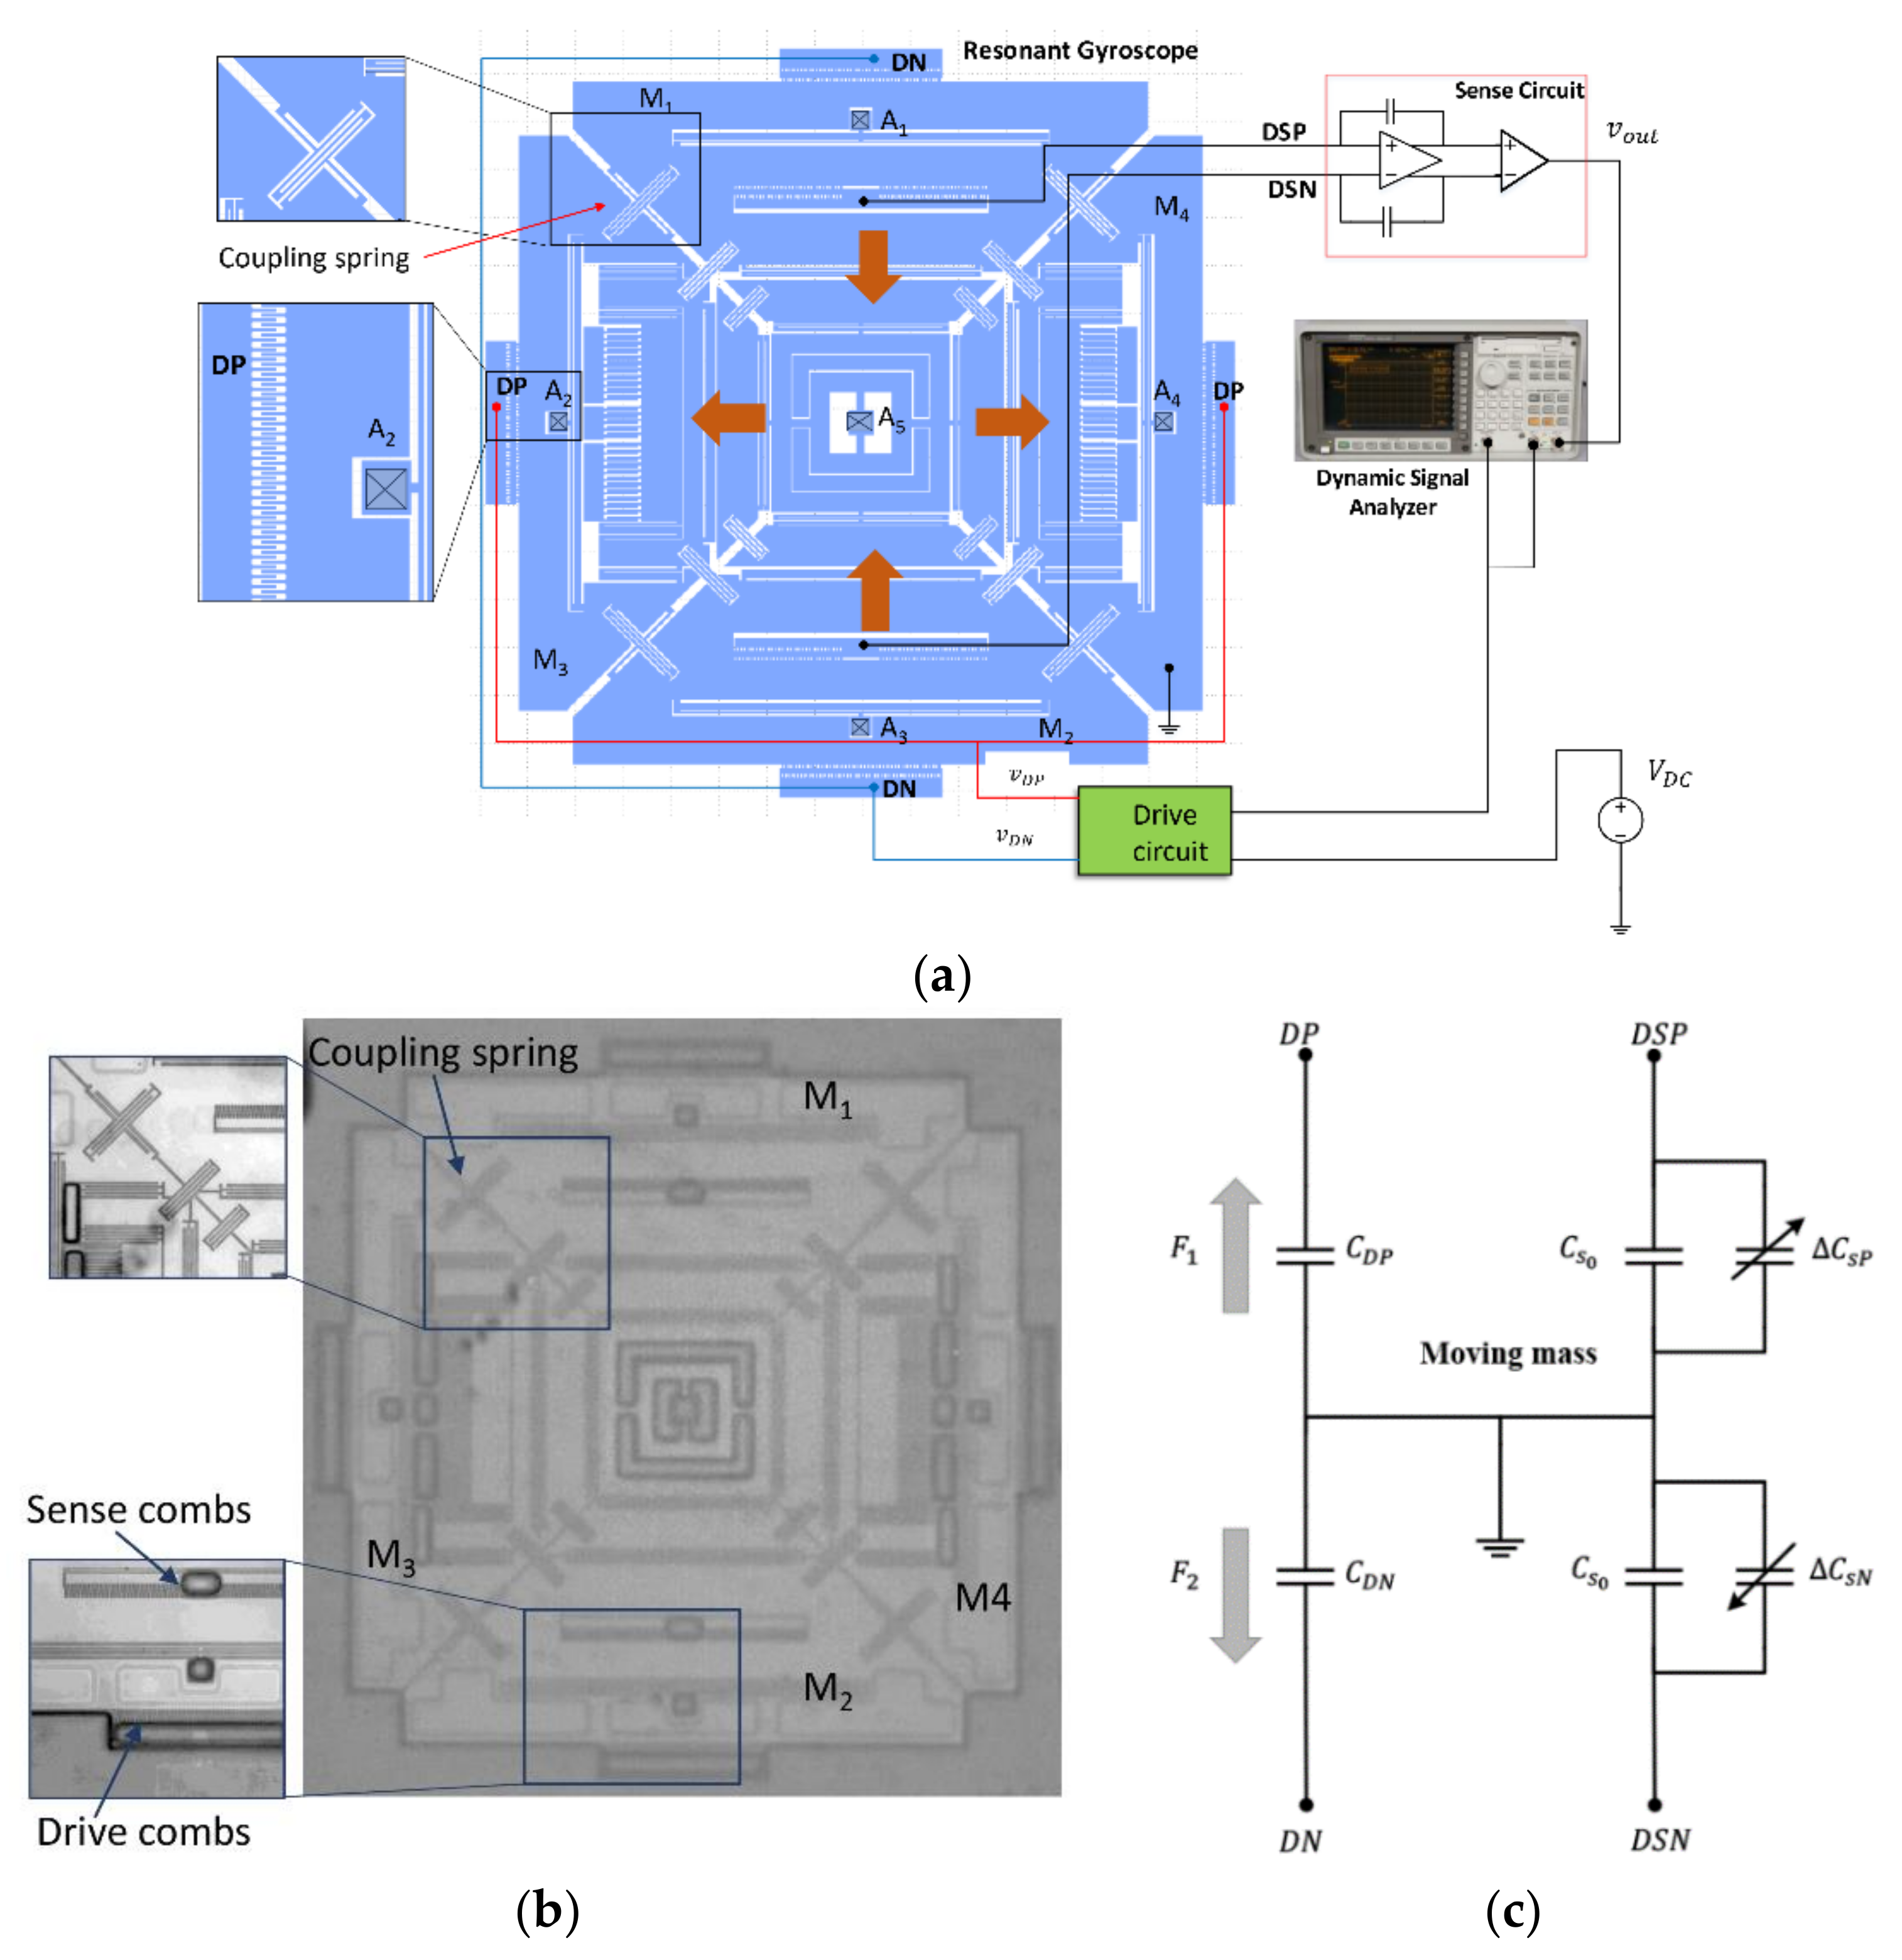
2. Experimental Setup
3. Results and Discussions
3.1. Gage R&R for Conventional Method
3.2. Effect of Driving Voltage on Measurement Variations
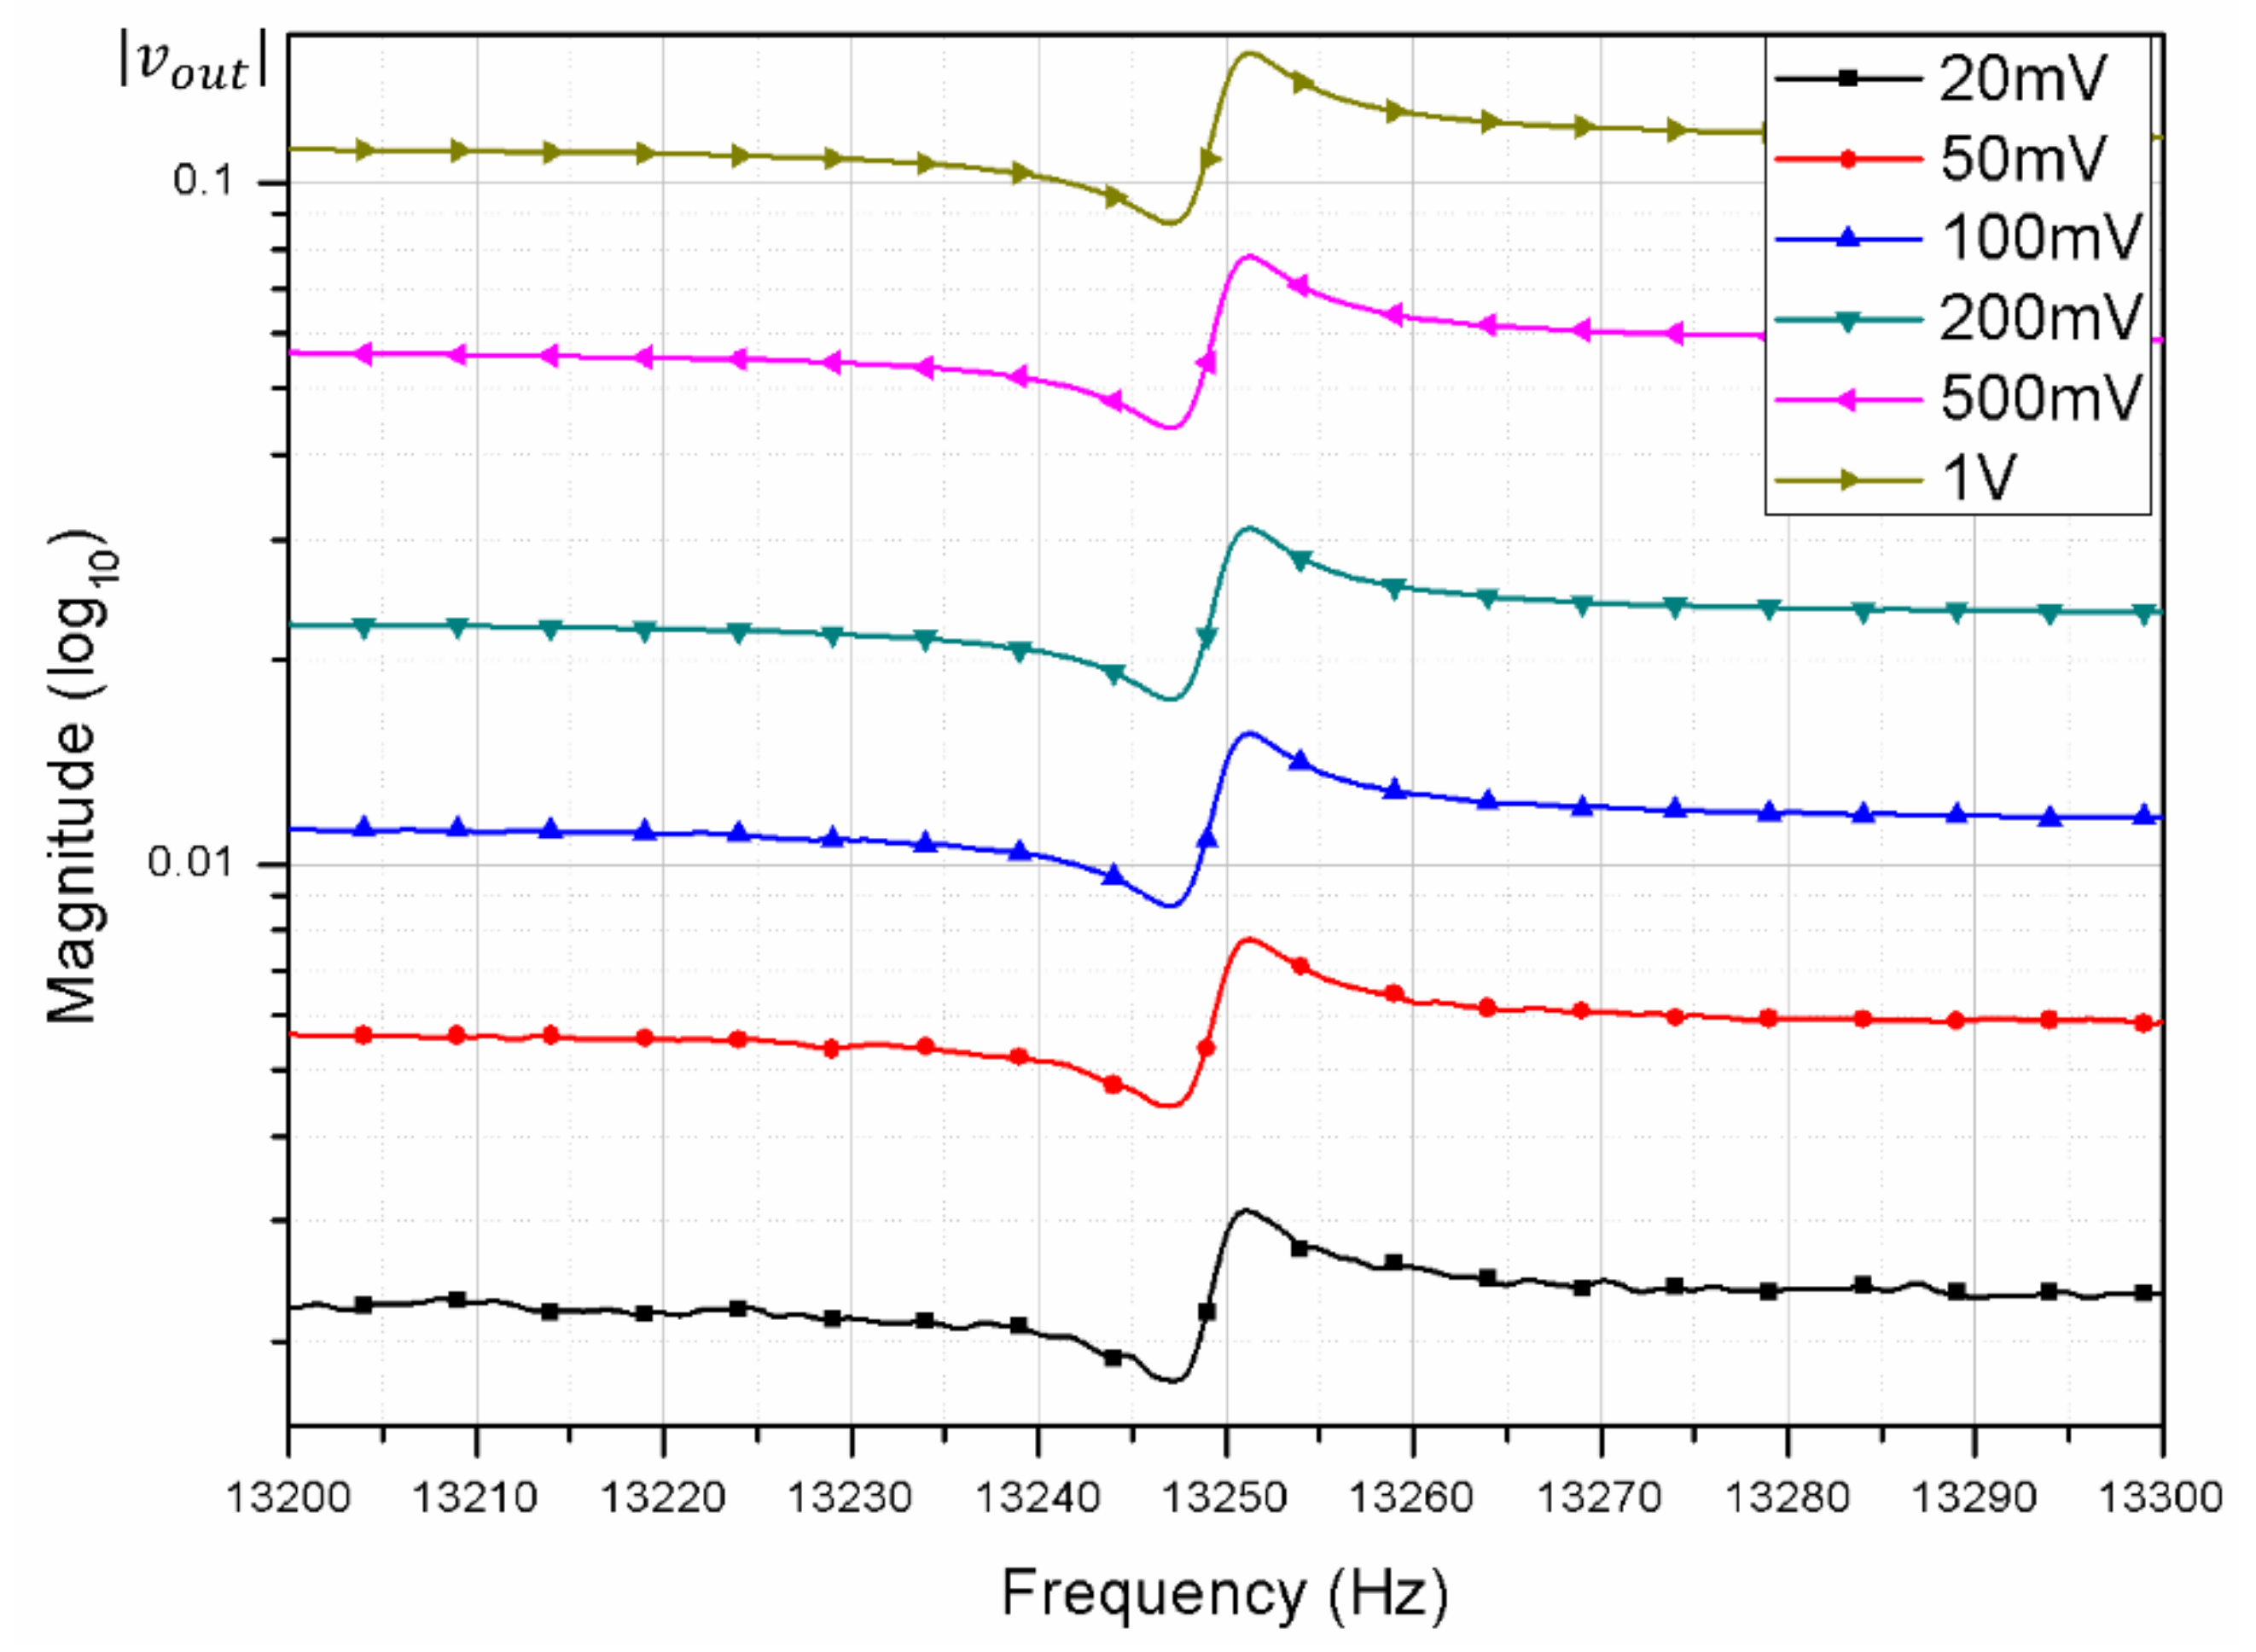
3.2.1. Increasing AC with a Fixed DC
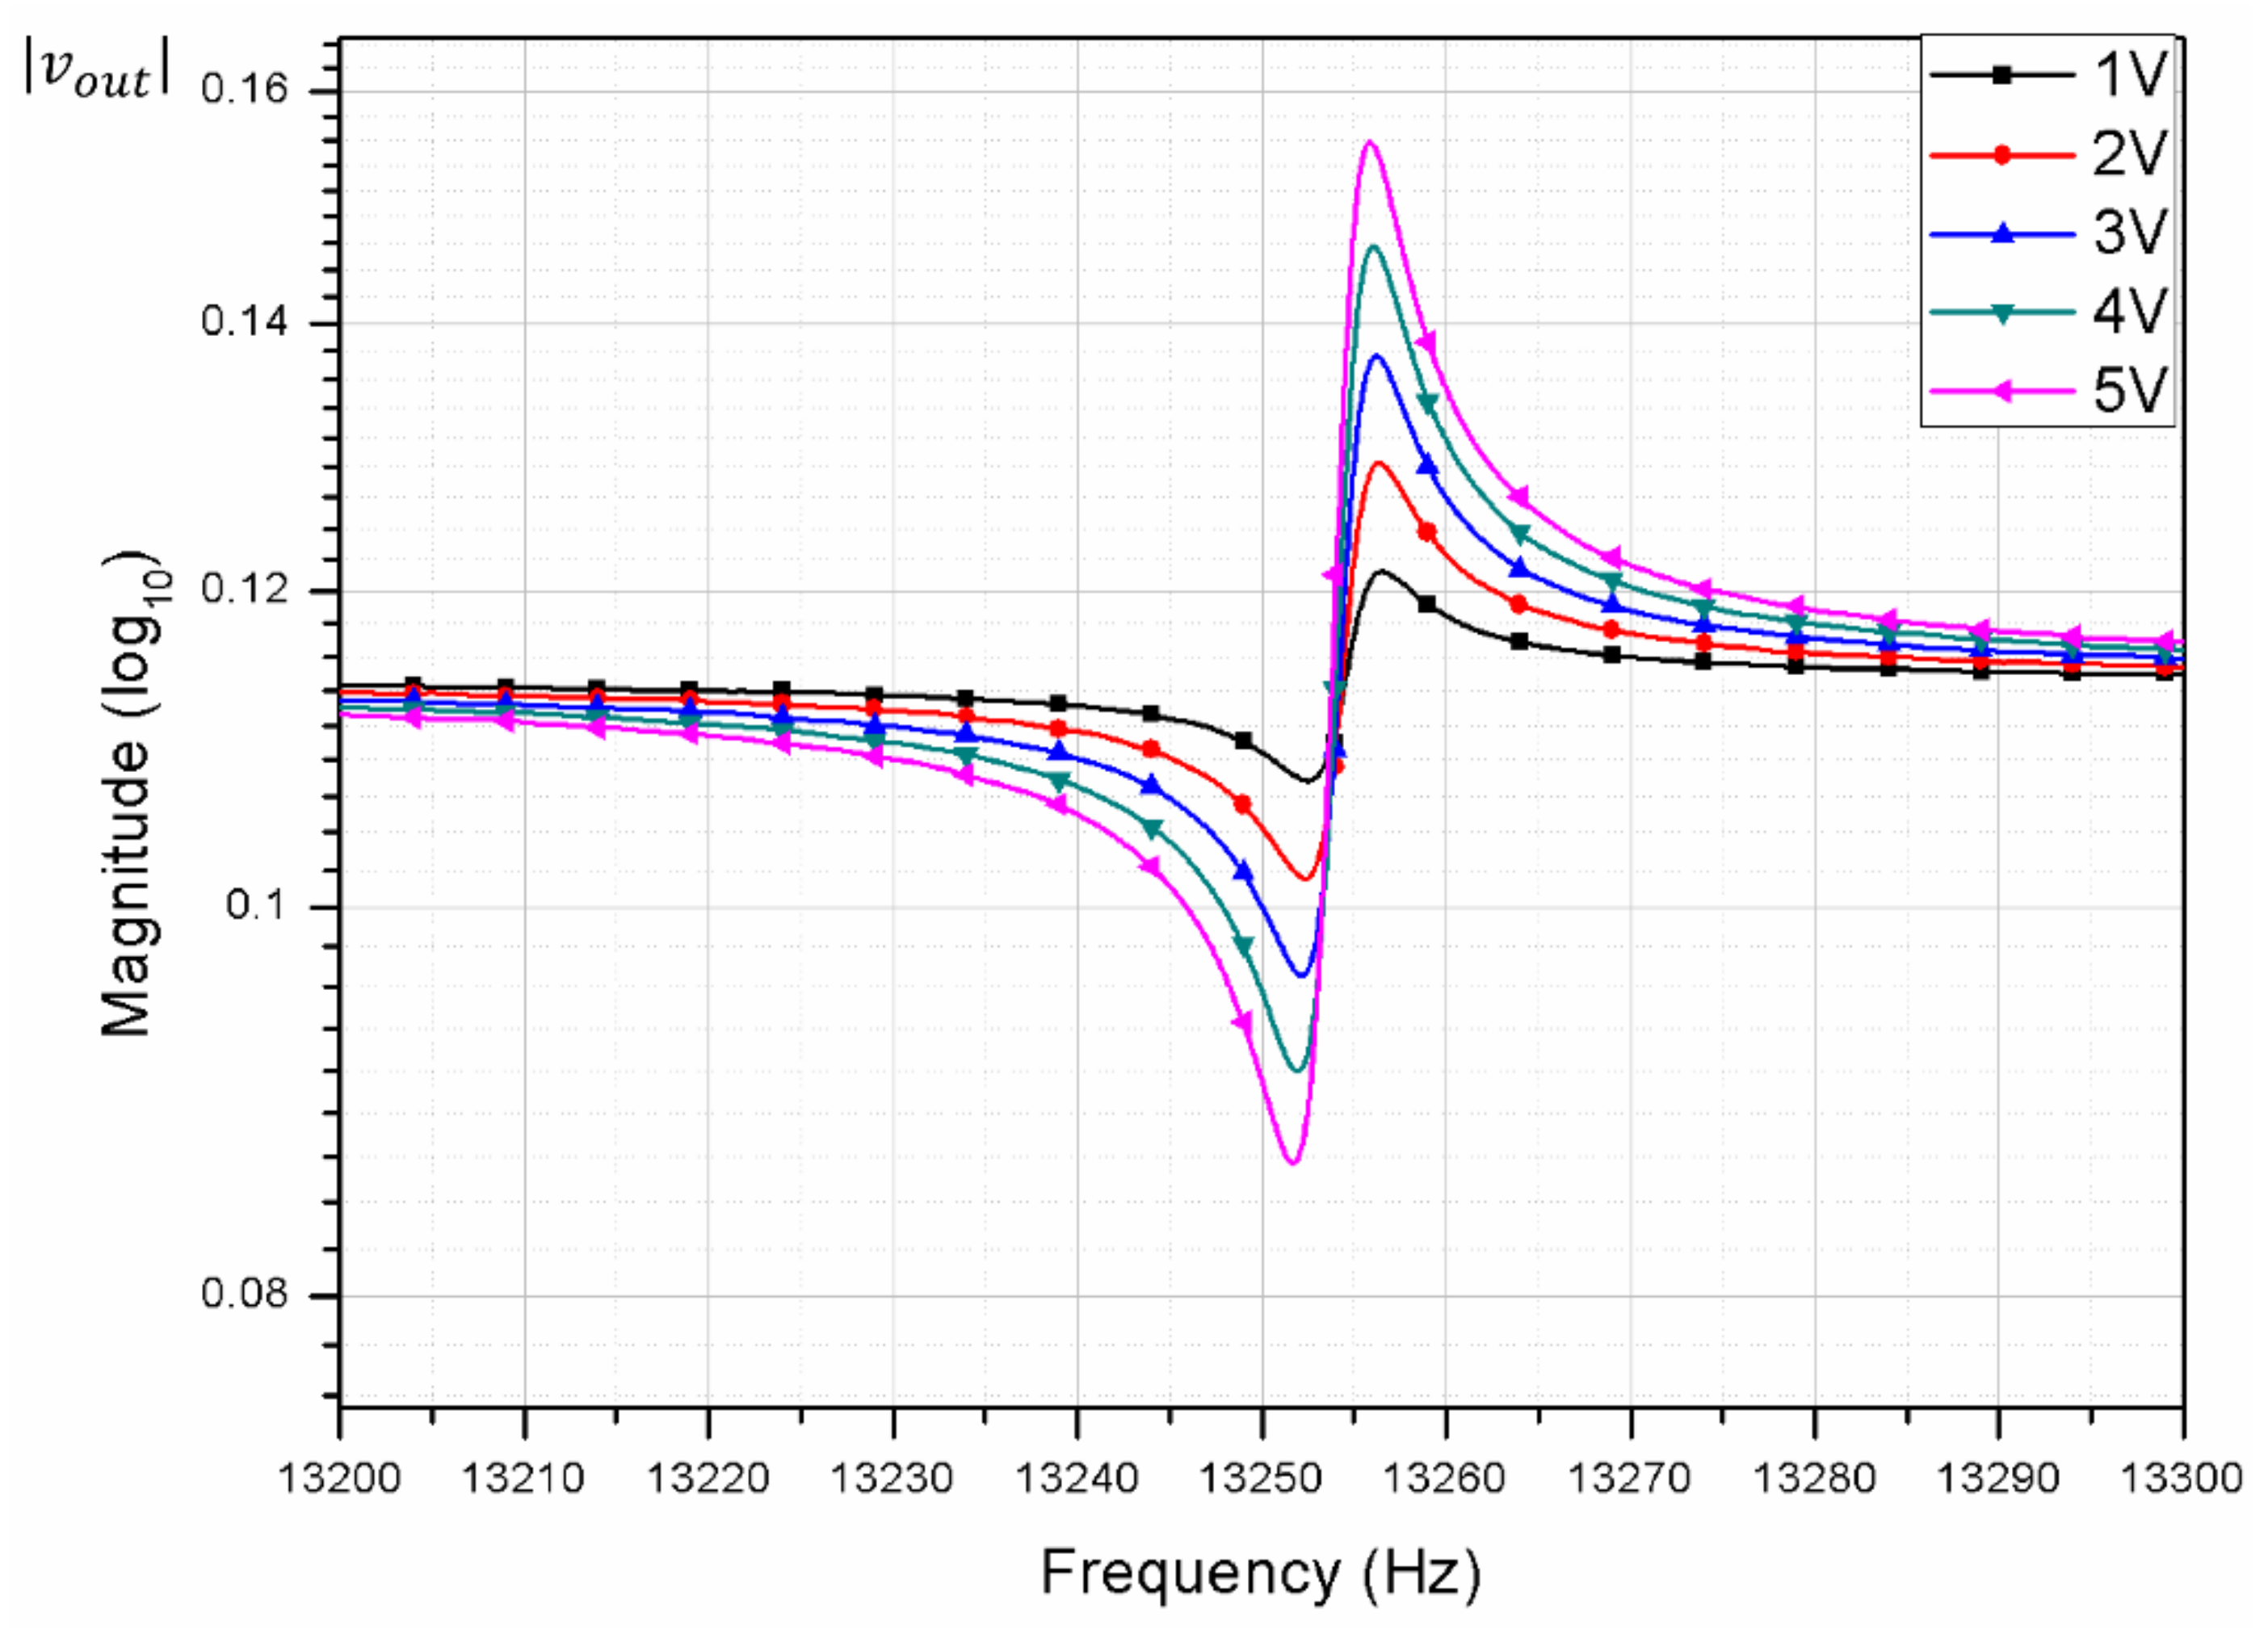
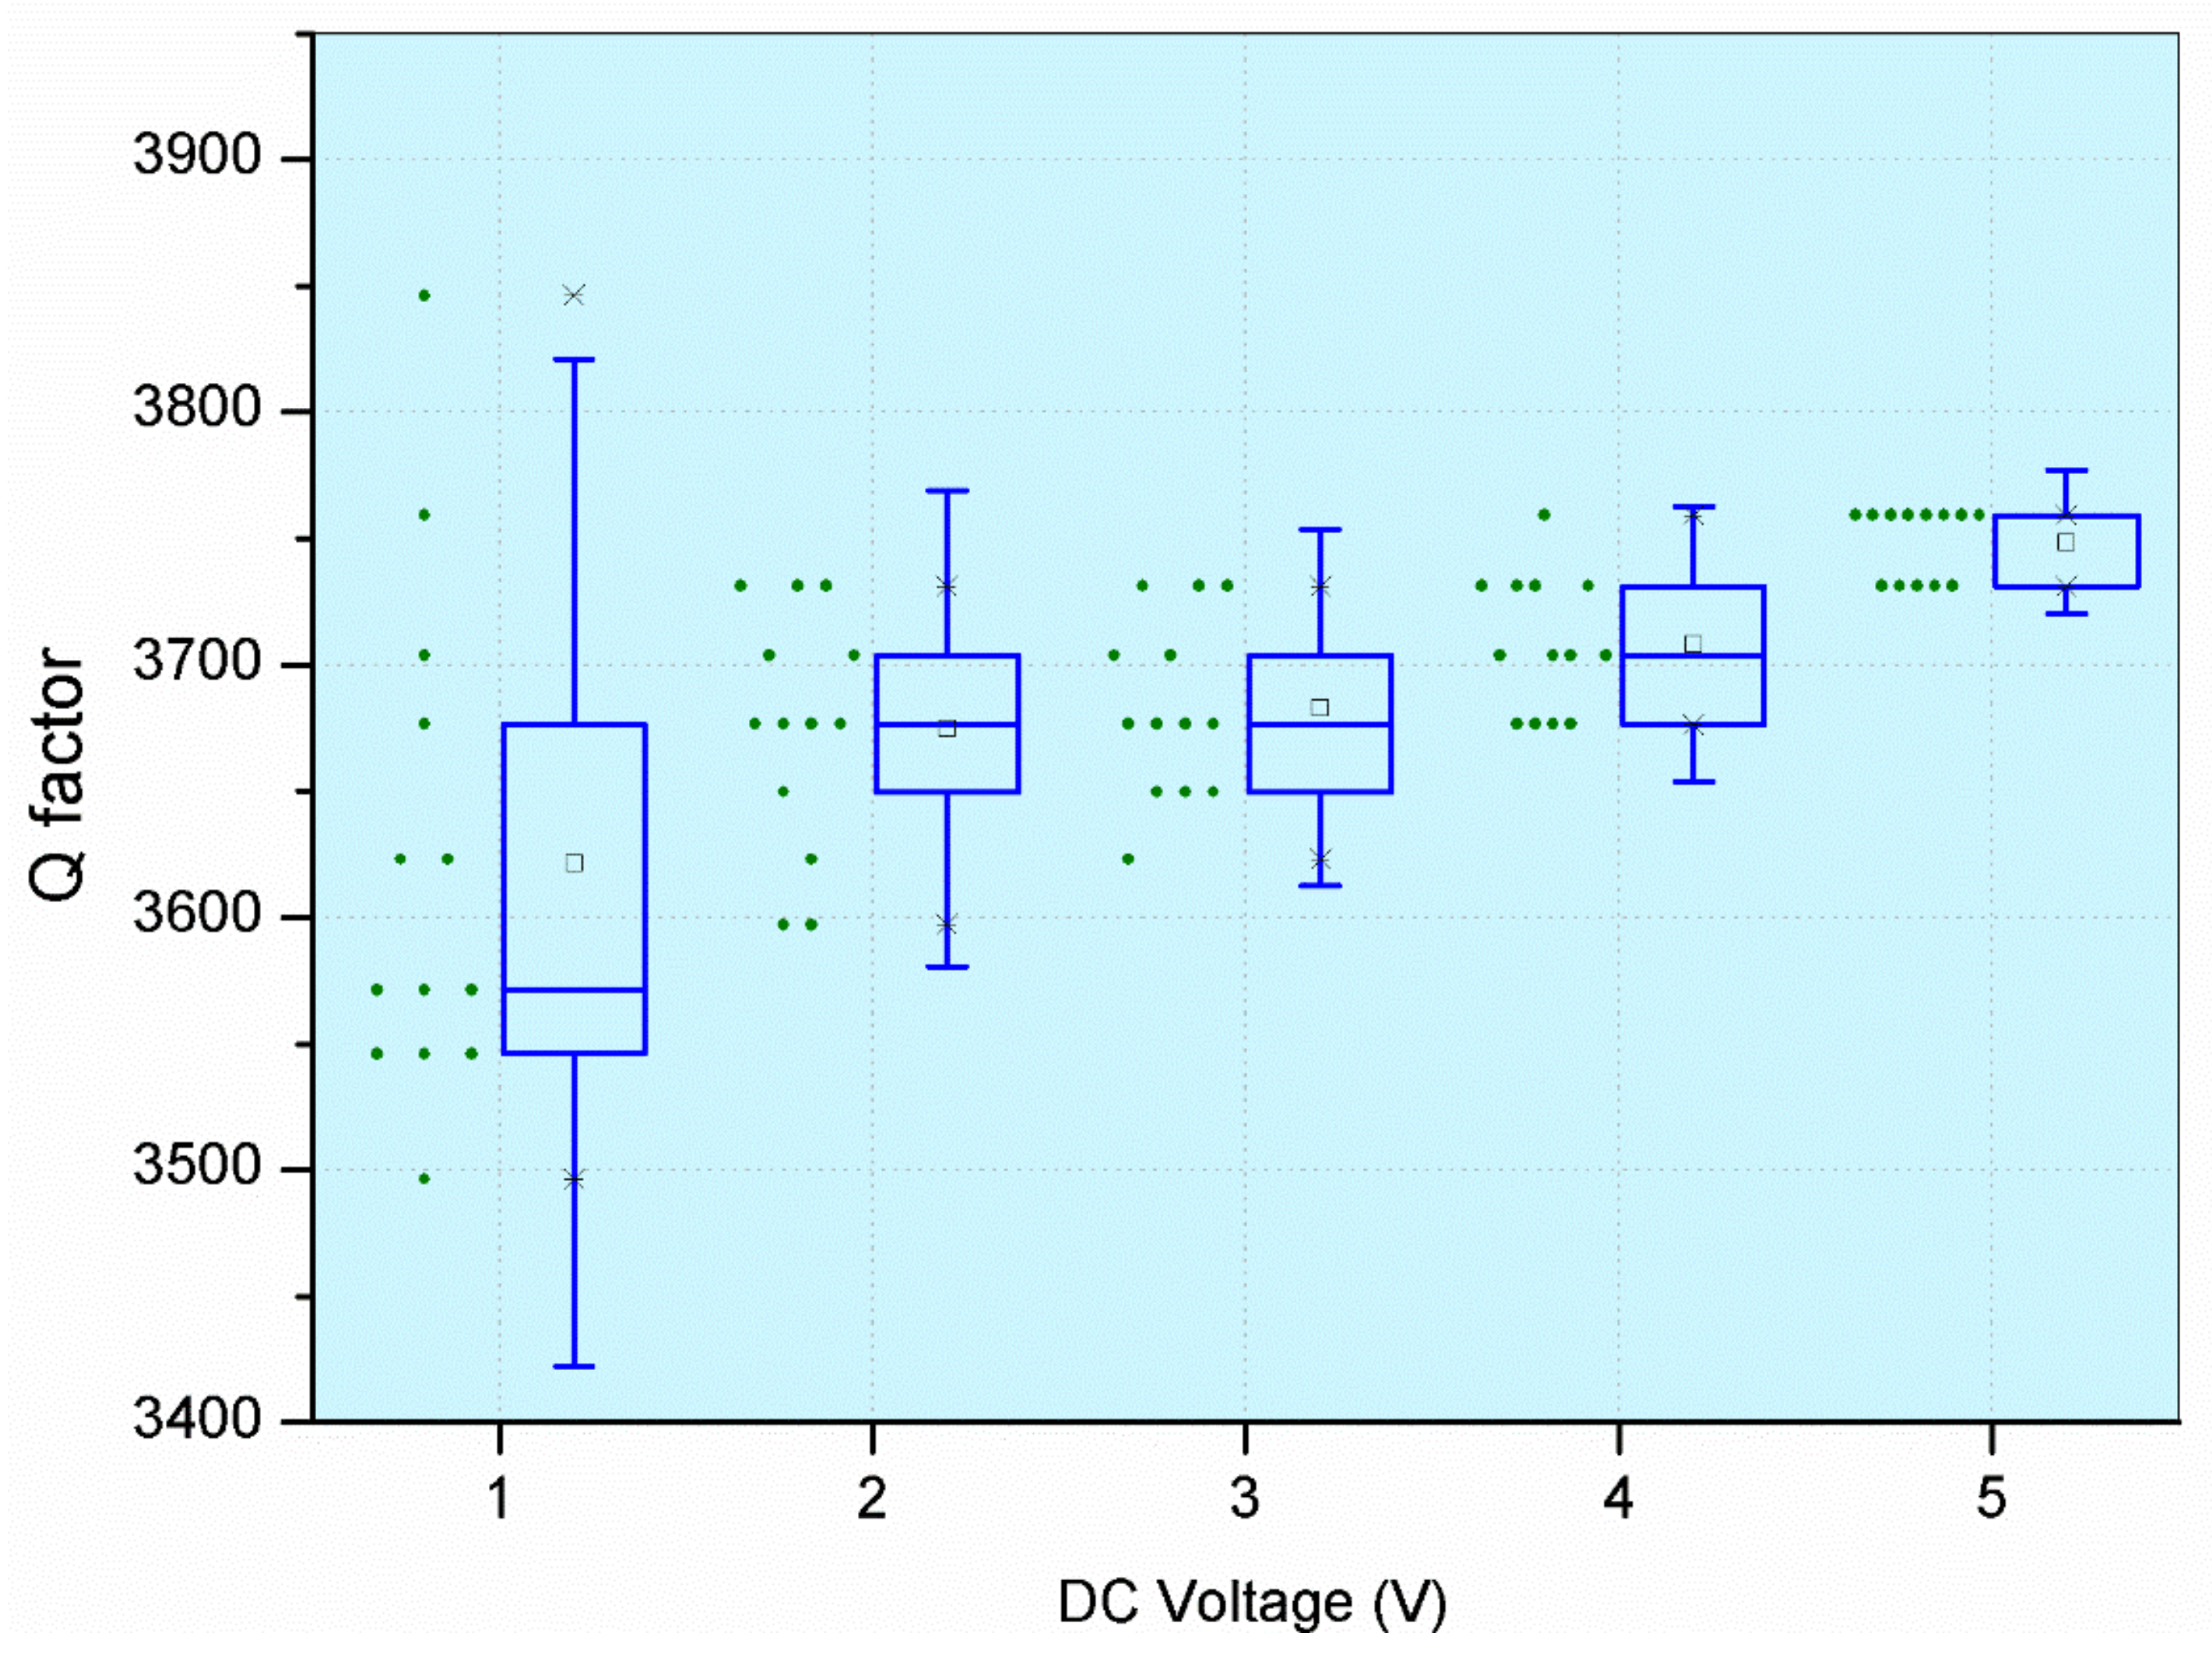
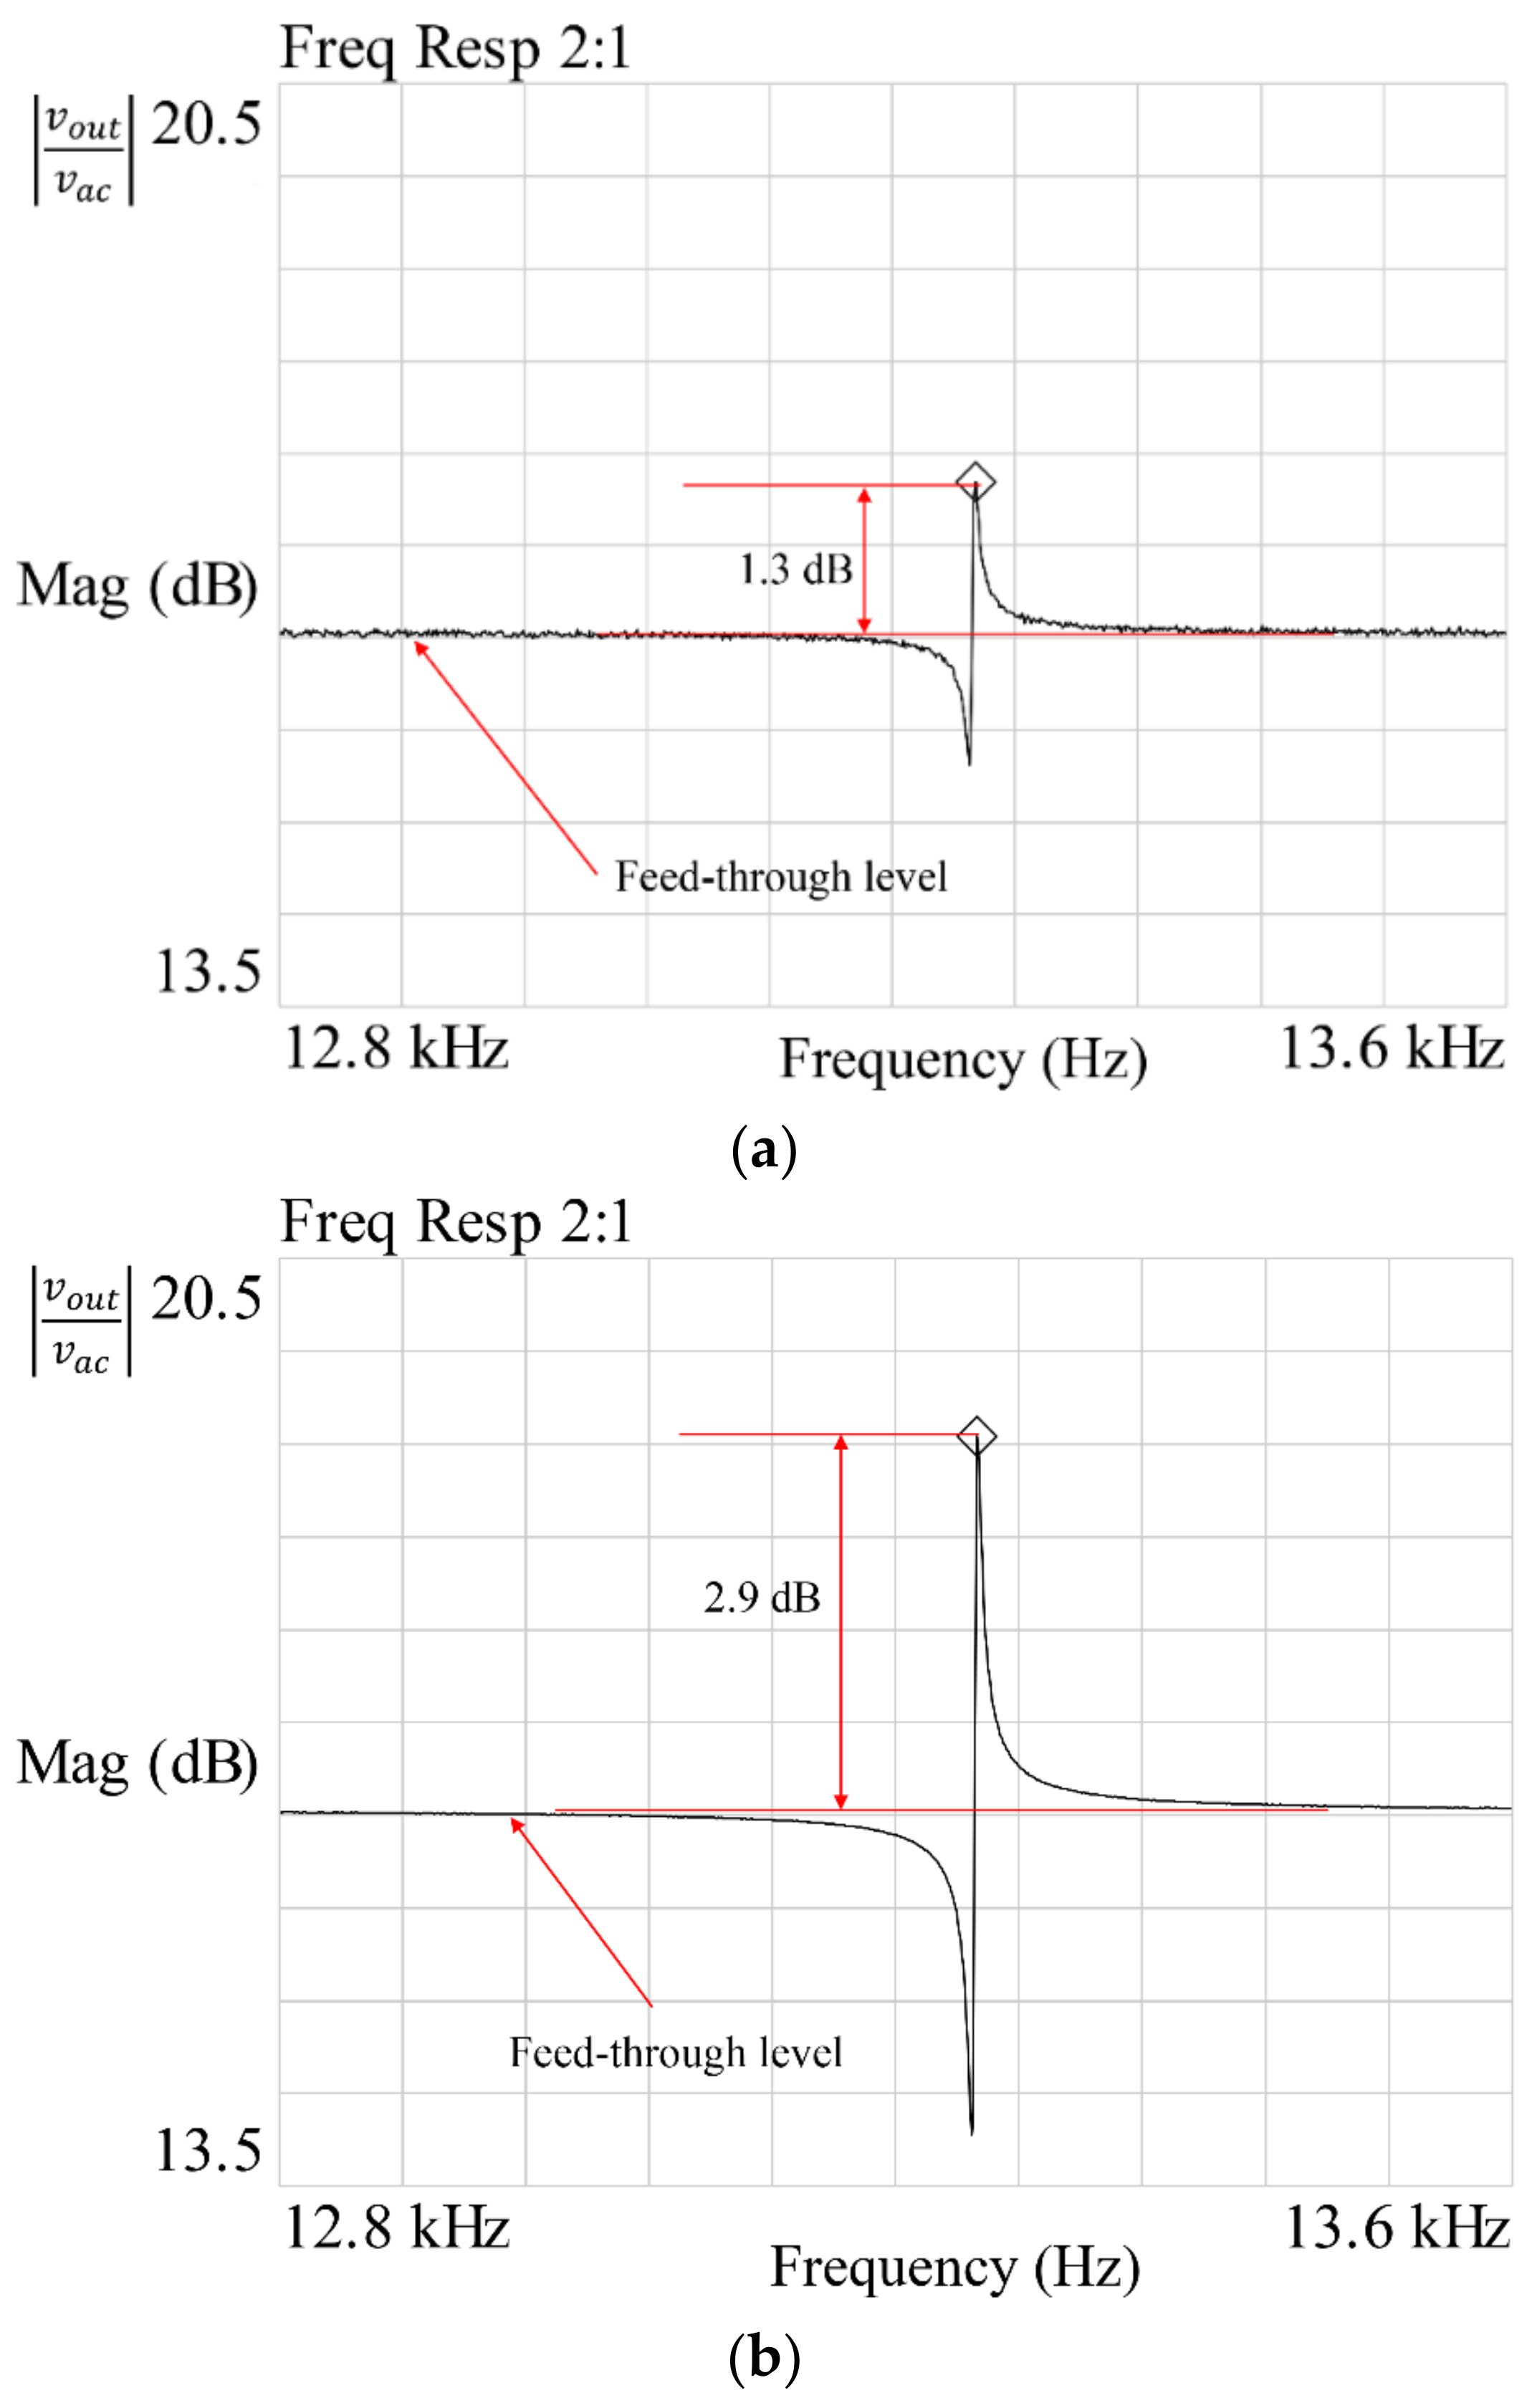
3.2.2. Increasing DC with a Fixed AC
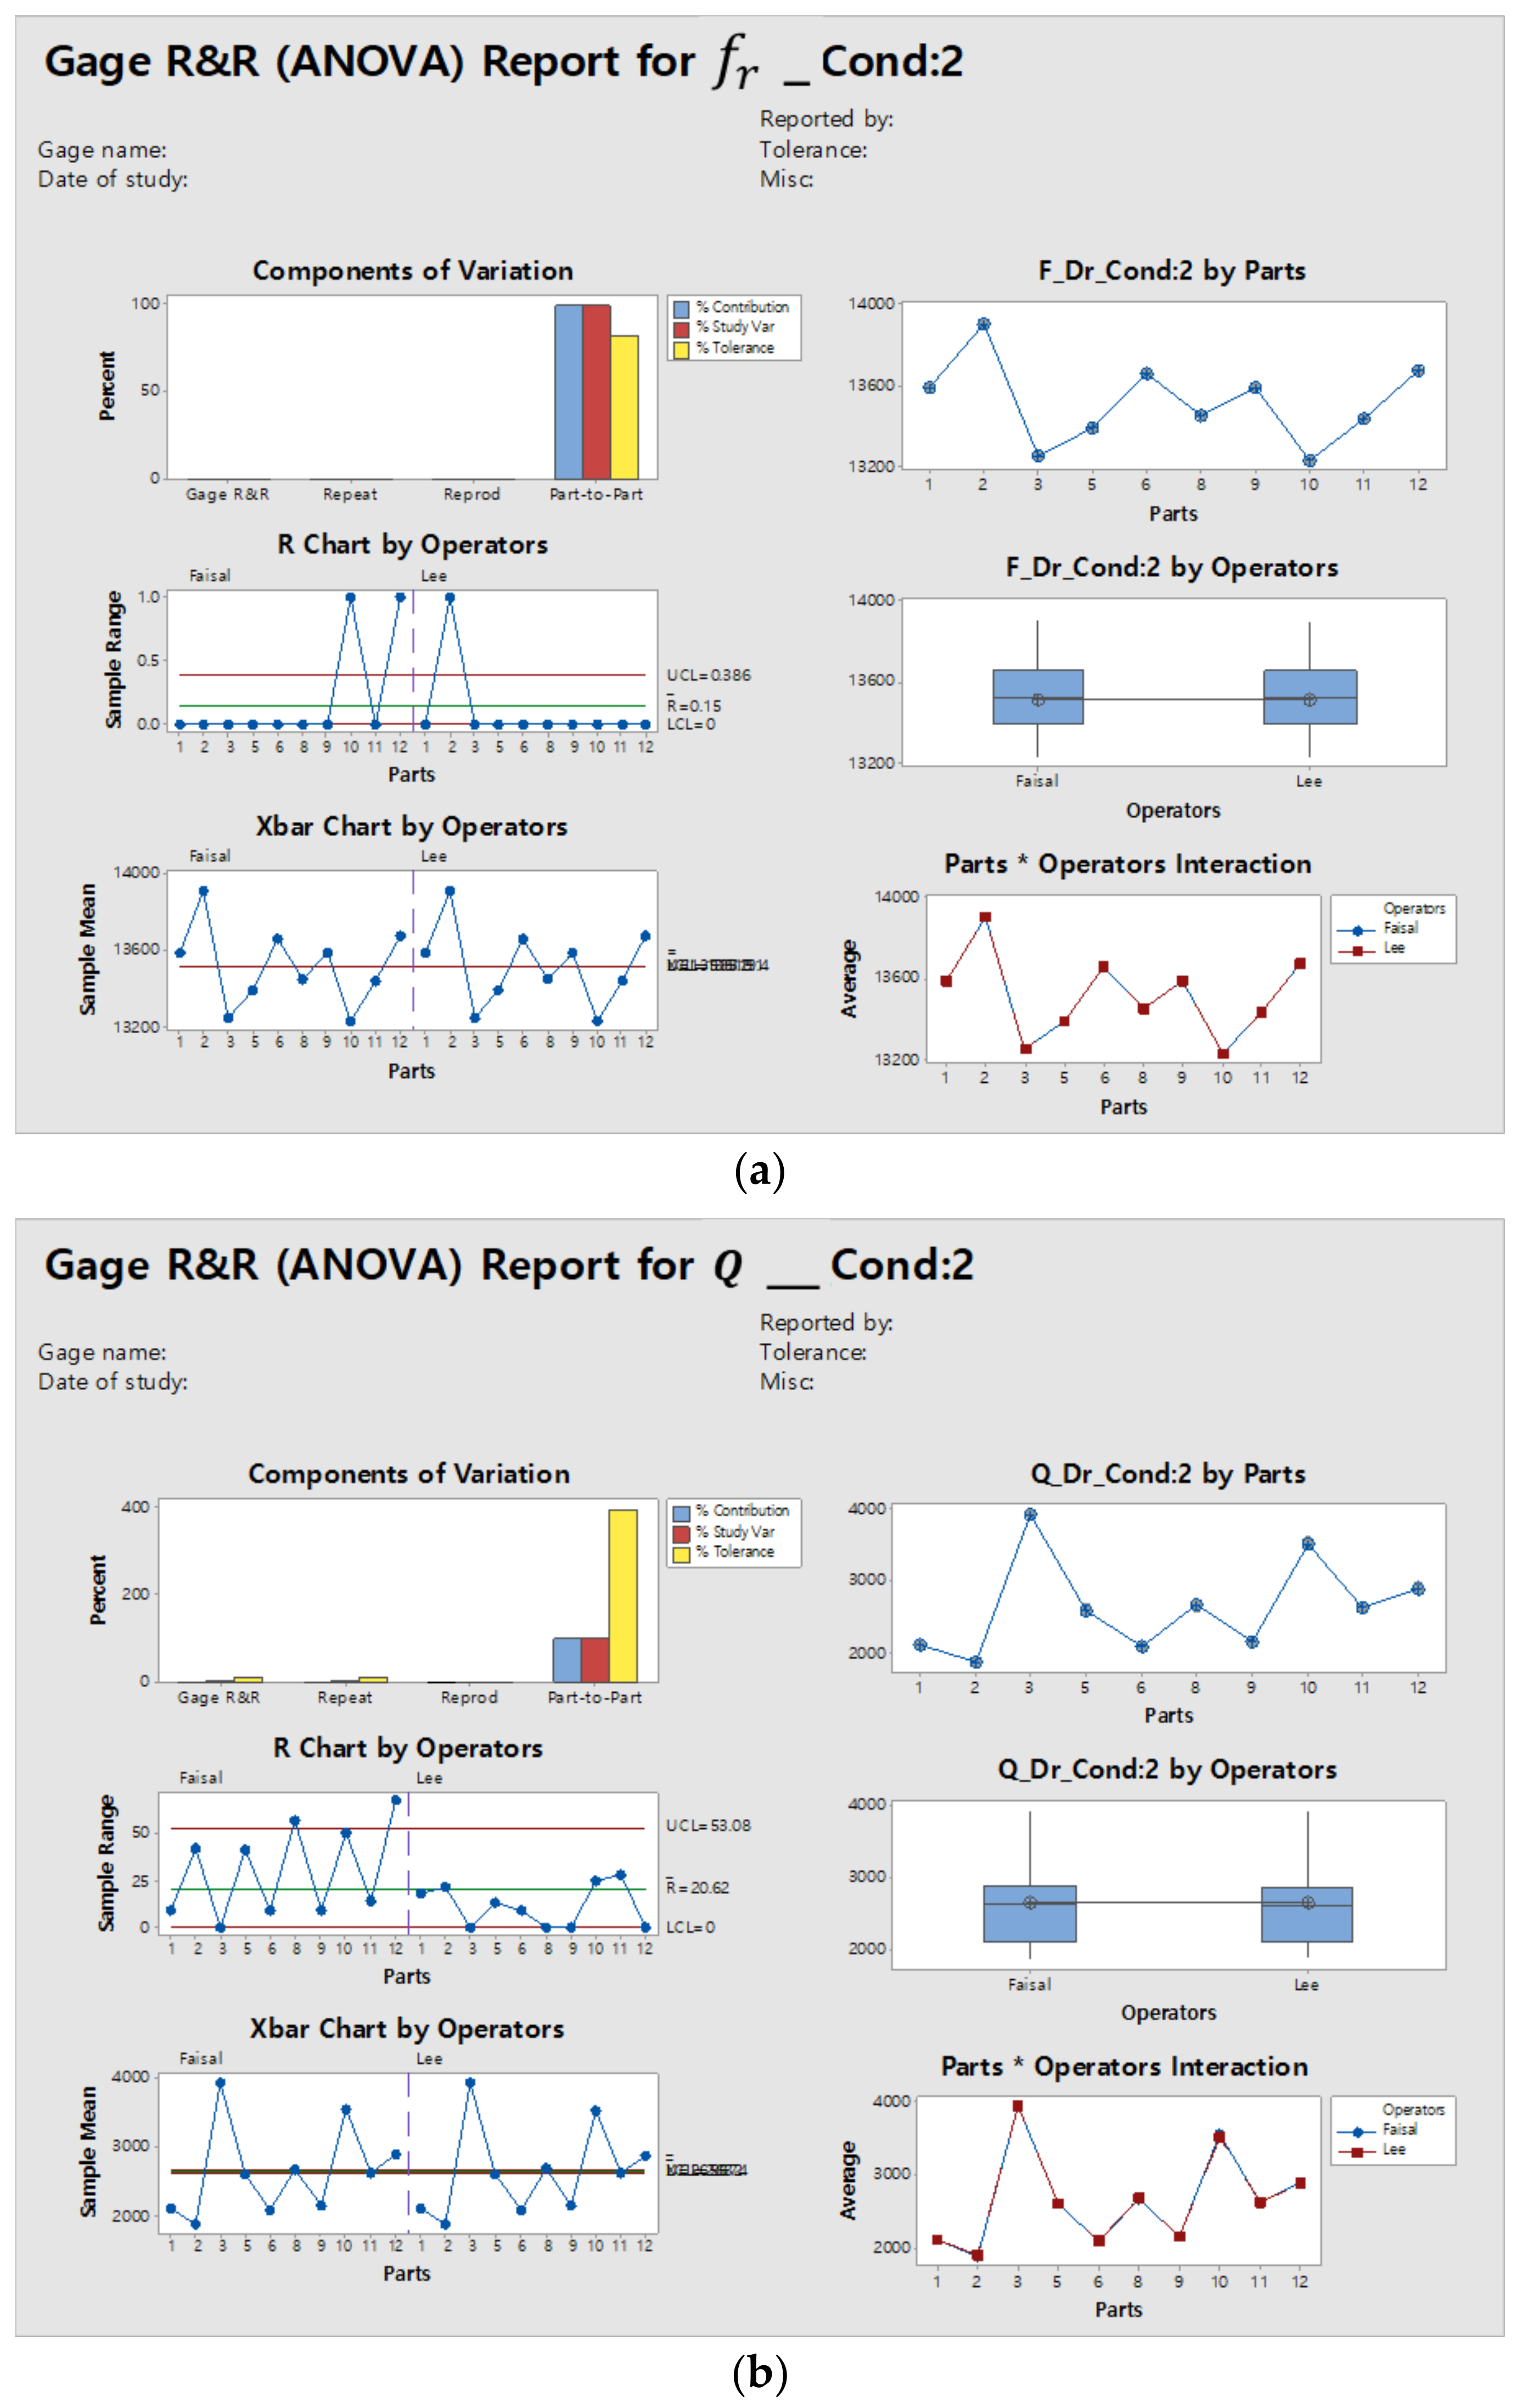
3.3. Gage R&R for Condition 2
4. Conclusions and Future Work
Acknowledgments
Author Contributions
Conflicts of Interest
References
- Gallacher, B.; Burdess, J.; Harish, K. A control scheme for a MEMS electrostatic resonant gyroscope excited using combined parametric excitation and harmonic forcing. J. Micromech. Microeng. 2006, 16, 320. [Google Scholar] [CrossRef]
- Comi, C.; Corigliano, A.; Langfelder, G.; Longoni, A.; Tocchio, A.; Simoni, B. A resonant microaccelerometer with high sensitivity operating in an oscillating circuit. J. Microelectromech. Syst. 2010, 19, 1140–1152. [Google Scholar] [CrossRef]
- Seshia, A.A.; Palaniapan, M.; Roessig, T.A.; Howe, R.T.; Gooch, R.W.; Schimert, T.R.; Montague, S. A vacuum packaged surface micromachined resonant accelerometer. Microelectromech. Syst. 2002, 11, 784–793. [Google Scholar] [CrossRef]
- Shah, M.A.; Iqbal, F.; Lee, B.-L. Design and analysis of a single-structure three-axis MEMS gyroscope with improved coupling spring. In Proceedings of the 2016 IEEE 11th Annual International Conference on Nano/Micro Engineered and Molecular Systems (NEMS 2016), Sendai, Japan, 17–20 April 2016; pp. 188–191. [Google Scholar]
- Langfelder, G.; Caspani, A.; Tocchio, A. Design criteria of low-power oscillators for consumer-grade MEMS resonant sensors. IEEE Trans. Ind. Electron. 2014, 61, 567–574. [Google Scholar] [CrossRef]
- Lee, F.-Y.; Liang, K.-C.; Cheng, E.; Fang, W. Design and implementation of a fully-decoupled tuning fork (FDTF) MEMS vibratory gyroscope for robustness improvement. In Proceedings of the 2015 18th International Conference on Solid-State Sensors, Actuators and Microsystems (Transducers 2015), Anchorage, AK, USA, 21–25 June 2015; pp. 1160–1163. [Google Scholar]
- Xia, D.; Yu, C.; Kong, L. The development of micromachined gyroscope structure and circuitry technology. Sensors 2014, 14, 1394–1473. [Google Scholar] [CrossRef] [PubMed]
- Gennat, M.; Meinig, M.; Shaporin, A.; Kurth, S.; Rembe, C.; Tibken, B. Determination of parameters with uncertainties for quality control in MEMS fabrication. J. Microelectromech. Syst. 2013, 22, 613–624. [Google Scholar] [CrossRef]
- Postnikov, A.; Morozov, O.; Amirov, I. Oxidized bridges technology for suspended MEMS fabrication using standard silicon wafer. Microsyst. Technol. 2015, 21, 669–674. [Google Scholar] [CrossRef]
- Wang, J.; Li, X. Single-side fabrication of multilevel 3-D microstructures for monolithic dual sensors. J. Microelectromech. Syst. 2015, 24, 531–533. [Google Scholar] [CrossRef]
- Shoaib, M.; Hamid, N.H.; Malik, A.F.; Ali, N.B.Z.; Jan, M.T. A Review on Key Issues and Challenges in Devices Level MEMS Testing. J. Sens. 2016, 2016. [Google Scholar] [CrossRef]
- Skvortzov, V.; Cho, Y.C.; Lee, B.-L.; Song, C. Development of a gyro test system at Samsung Advanced Institute of Technology. In Proceedings of the Position Location and Navigation Symposium (PLANS 2004), Monterey, CA, USA, 26–29 April 2004; pp. 133–142. [Google Scholar]
- Wolfer, M.; Hepp, C.; Reimann, M.; Kunz, U.; Rembe, C. Testing a capped MEMS gyroscope by an infrared technique. In Proceedings of the 2015 18th International Conference on Solid-State Sensors, Actuators and Microsystems (Transducers 2015), Anchorage, AK, USA, 21–25 June 2015; pp. 2240–2243. [Google Scholar]
- Acar, C.; Shkel, A. MEMS Vibratory Gyroscopes: Structural Approaches to Improve Robustness; Springer Science & Business Media: Berlin, Germany, 2008. [Google Scholar]
- Kim, B.; Hopcroft, M.A.; Candler, R.N.; Jha, C.M.; Agarwal, M.; Melamud, R.; Chandorkar, S.A.; Yama, G.; Kenny, T.W. Temperature dependence of quality factor in MEMS resonators. J. Microelectromech. Syst. 2008, 17, 755–766. [Google Scholar] [CrossRef]
- Kim, J.-S.; Lee, S.-W.; Jung, K.-D.; Kim, W.-B.; Choa, S.-H.; Ju, B.-K. Quality factor measurement of micro gyroscope structure according to vacuum level and desired Q-factor range package method. Microelectron. Reliab. 2008, 48, 948–952. [Google Scholar] [CrossRef]
- Xu, X.; Raman, A. Comparative dynamics of magnetically, acoustically, and Brownian motion driven microcantilevers in liquids. J. Appl. Phys. 2007, 102, 034303. [Google Scholar] [CrossRef]
- Lee, I.; Lee, J. Measurement uncertainties in resonant characteristics of MEMS resonators. J. Mech. Sci. Technol. 2013, 27, 491–500. [Google Scholar] [CrossRef]
- Farokhi, H.; Ghayesh, M.H. Thermo-mechanical dynamics of perfect and imperfect Timoshenko microbeams. Int. J. Eng. Sci. 2015, 91, 12–33. [Google Scholar] [CrossRef]
- Nayfeh, A.H.; Younis, M.I.; Abdel-Rahman, E.M. Dynamic pull-in phenomenon in MEMS resonators. Nonlinear Dyn. 2007, 48, 153–163. [Google Scholar] [CrossRef]
- Ghayesh, M.H.; Amabili, M.; Farokhi, H. Nonlinear forced vibrations of a microbeam based on the strain gradient elasticity theory. Int. J. Eng. Sci. 2013, 63, 52–60. [Google Scholar] [CrossRef]
- Ghayesh, M.H.; Farokhi, H.; Alici, G. Size-dependent performance of microgyroscopes. Int. J. Eng. Sci. 2016, 100, 99–111. [Google Scholar] [CrossRef]
- Ghayesh, M.H.; Farokhi, H.; Amabili, M. Nonlinear behaviour of electrically actuated MEMS resonators. Int. J. Eng. Sci. 2013, 71, 137–155. [Google Scholar] [CrossRef]
- Ghayesh, M.H.; Farokhi, H.; Gholipour, A. Oscillations of functionally graded microbeams. Int. J. Eng. Sci. 2017, 110, 35–53. [Google Scholar] [CrossRef]
- Lajimi, S.A.M.; Heppler, G.R.; Abdel-Rahman, E.M. A parametric study of the nonlinear dynamics and sensitivity of a beam-rigid body microgyroscope. Commun. Nonlinear Sci. Numer. Simul. 2017, 50, 180–192. [Google Scholar] [CrossRef]
- Tao, K.; Lye, S.W.; Miao, J.; Hu, X. Design and implementation of an out-of-plane electrostatic vibration energy harvester with dual-charged electret plates. Microelectron. Eng. 2015, 135, 32–37. [Google Scholar] [CrossRef]
- Tao, K.; Tang, L.; Wu, J.; Lye, S.W.; Chang, H.; Miao, J. Investigation of multimodal electret-based MEMS energy harvester with impact-induced nonlinearity. J. Microelectromech. Syst. 2018, 27, 276–288. [Google Scholar] [CrossRef]
- Fedder, G.K. Simulation of Microelectromechanical Systems. Ph.D. Thesis, University of California, Berkeley, CA, USA, 1994. [Google Scholar]
- Wang, Y.; Xie, Y.; Zhang, T.; Wu, G.; Wang, G.; Yu, C. Quality factor measurement for MEMS resonator using time-domain amplitude decaying method. Microsyst. Technol. 2015, 21, 825–829. [Google Scholar] [CrossRef]
- Zhang, M.; Llaser, N.; Rodes, F. High-precision time-domain measurement of quality factor. IEEE Trans. Instrum. Meas. 2012, 61, 842–844. [Google Scholar] [CrossRef]
- Kim, B.; Candler, R.N.; Hopcroft, M.A.; Agarwal, M.; Park, W.-T.; Kenny, T.W. Frequency stability of wafer-scale film encapsulated silicon based MEMS resonators. Sens. Actuators A Phys. 2007, 136, 125–131. [Google Scholar] [CrossRef]
- Jeong, C.; Seok, S.; Lee, B.; Kim, H.; Chun, K. A study on resonant frequency and Q factor tunings for MEMS vibratory gyroscopes. J. Micromech. Microeng. 2004, 14, 1530. [Google Scholar] [CrossRef]
- Lee, J.E.-Y.; Seshia, A.A. Direct parameter extraction in feedthrough-embedded capacitive MEMS resonators. Sens. Actuators A Phys. 2011, 167, 237–244. [Google Scholar] [CrossRef]
- Shah, M.A.; Iqbal, F.; Shah, I.A.; Lee, B. Modal Analysis of a Single-Structure Multiaxis MEMS Gyroscope. J. Sens. 2016, 2016. [Google Scholar] [CrossRef]
- Dynamic Signal. Analyzer Concepts Guide. Available online: https://literature.cdn.keysight.com/litweb/pdf/35665-90028.pdf?id=724603 (accessed on 8 April 2018).
- Assessing Measurement System Variation. Available online: https://www.minitab.com/uploadedFiles/Documents/sample-materials/FuelInjectorNozzles-EN.pdf (accessed on 8 April 2018).
- Iqbal, F.; Shah, M.A.; Lee, B. Analysis of parasitic feed-through capacitance in MEMS gyroscope with push pull configuration. In Proceedings of the 2017 IEEE 12th International Conference on Nano/Micro Engineered and Molecular Systems (NEMS), Los Angeles, CA, USA, 9–12 April 2017; pp. 414–417. [Google Scholar]
- Lee, J.-Y.; Seshia, A. Parasitic feedthrough cancellation techniques for enhanced electrical characterization of electrostatic microresonators. Sens. Actuators A Phys. 2009, 156, 36–42. [Google Scholar] [CrossRef]


| Test | Measured Parameter | Window Type | Average | Frequency Span | Frequency Resolution |
|---|---|---|---|---|---|
| Frequency domain analysis | Frequency response, Q factor | Uniform | Type: RMS, number 5 | 800 Hz | 800 lines/Hz |
| Parameters | Condition 1 | Condition 2 |
|---|---|---|
| Number of devices | 10 | 10 |
| Number of trials | 3 | 3 |
| VAC | 200 mVpk | 1 Vpk |
| VDC | 2 V | 5 V |
| Operators | 2 | 2 |
| Source | VarComp | % Contribution (of VarComp) | stDev (SD) | Study Var (6 × SD) | % Study Var (% SV) |
|---|---|---|---|---|---|
| Total Gage R&R | 0.8 | 0.0 | 1.0 | 5.3 | 0.4 |
| Repeatability | 0.8 | 0.0 | 1.0 | 5.3 | 0.4 |
| Reproducibility | 0.0 | 0.0 | 0.0 | 0.0 | 0.0 |
| Operators | 0.0 | 0.0 | 0.0 | 0.0 | 0.0 |
| Part-to-part | 42,362.7 | 100.00 | 205.8 | 1234.9 | 100.0 |
| Total variation | 42,363.4 | 100.00 | 205.8 | 1234.9 | 100.0 |
| Number of distinct categories | 329.0 | ||||
| Source | VarComp | % Contribution (of VarComp) | stDev (SD) | Study Var (6 × SD) | % Study Var (% SV) |
|---|---|---|---|---|---|
| Total Gage R&R | 40,809.0 | 9.6 | 202.0 | 1212.0 | 30.9 |
| Repeatability | 40,809.0 | 9.6 | 202.0 | 1212.0 | 30.9 |
| Reproducibility | 0.0 | 0.0 | 0.0 | 0.0 | 0.0 |
| Operators | 0.0 | 0.0 | 0.0 | 0.0 | 0.0 |
| Part-to-part | 386,300.0 | 90.5 | 621.5 | 3729.1 | 95.1 |
| Total variation | 427,110.0 | 100.0 | 652.5 | 3921.2 | 100.0 |
| Number of distinct categories | 4.0 | ||||
| Source | VarComp | % Contribution (of VarComp) | stDev (SD) | Study Var (6 × SD) | % Study Var (% SV) |
|---|---|---|---|---|---|
| Total Gage R&R | 0.1 | 0.0 | 0.2 | 1.5 | 0.1 |
| Repeatability | 0.1 | 0.0 | 0.2 | 1.5 | 0.1 |
| Reproducibility | 0.0 | 0.0 | 0.0 | 0.1 | 0.0 |
| Operators | 0.0 | 0.0 | 0.0 | 0.1 | 0.0 |
| Part-to-part | 42,392.9 | 100.0 | 205.9 | 1235.4 | 100.0 |
| Total variation | 42,392.9 | 100.0 | 205.9 | 1235.4 | 100.0 |
| Number of distinct categories | 1184.0 | ||||
| Source | VarComp | % Contribution (of VarComp) | stDev (SD) | Study Var (6 × SD) | % Study Var (% SV) |
|---|---|---|---|---|---|
| Total Gage R&R | 279.0 | 0.1 | 16.7 | 100.1 | 2.5 |
| Repeatability | 279.0 | 0.1 | 16.7 | 100.1 | 2.5 |
| Reproducibility | 0.0 | 0.0 | 0.0 | 0.0 | 0.0 |
| Operators | 0.0 | 0.0 | 0.0 | 0.0 | 0.0 |
| Part-to-part | 432,933.0 | 99.9 | 658.0 | 3947.9 | 99.9 |
| Total variation | 433,212.0 | 100.0 | 658.2 | 3949.1 | 100.0 |
| Number of distinct categories | 55.0 | ||||
© 2018 by the authors. Licensee MDPI, Basel, Switzerland. This article is an open access article distributed under the terms and conditions of the Creative Commons Attribution (CC BY) license (http://creativecommons.org/licenses/by/4.0/).
Share and Cite
Iqbal, F.; Lee, B. A Study on Measurement Variations in Resonant Characteristics of Electrostatically Actuated MEMS Resonators. Micromachines 2018, 9, 173. https://doi.org/10.3390/mi9040173
Iqbal F, Lee B. A Study on Measurement Variations in Resonant Characteristics of Electrostatically Actuated MEMS Resonators. Micromachines. 2018; 9(4):173. https://doi.org/10.3390/mi9040173
Chicago/Turabian StyleIqbal, Faisal, and Byeungleul Lee. 2018. "A Study on Measurement Variations in Resonant Characteristics of Electrostatically Actuated MEMS Resonators" Micromachines 9, no. 4: 173. https://doi.org/10.3390/mi9040173
APA StyleIqbal, F., & Lee, B. (2018). A Study on Measurement Variations in Resonant Characteristics of Electrostatically Actuated MEMS Resonators. Micromachines, 9(4), 173. https://doi.org/10.3390/mi9040173