Article

Resonance Spectrum Characteristics of Effective Electromechanical Coupling Coefficient of High-Overtone Bulk Acoustic Resonator

1
Institute of Acoustics, Chinese Academy of Sciences, Beijing 100190, China
2
University of Chinese Academy of Sciences, Beijing 100049, China
*
Authors to whom correspondence should be addressed.
Micromachines 2016, 7(9), 159; https://doi.org/10.3390/mi7090159
Submission received: 10 June 2016 / Revised: 26 August 2016 / Accepted: 29 August 2016 / Published: 6 September 2016

Abstract

:
A high-overtone bulk acoustic resonator (HBAR) consisting of a piezoelectric film with two electrodes on a substrate exhibits a high quality factor (Q) and multi-mode resonance spectrum. By analyzing the influences of each layer’s material and structure (thickness) parameters on the effective electromechanical coupling coefficient (Keff2), the resonance spectrum characteristics of Keff2 have been investigated systematically, and the optimal design of HBAR has been provided. Besides, a device, corresponding to one of the theoretical cases studied, is fabricated and evaluated. The experimental results are basically consistent with the theoretical results. Finally, the effects of Keff2 on the function of the crystal oscillators constructed with HBARs are proposed. The crystal oscillators can operate in more modes and have a larger frequency hopping bandwidth by using the HBARs with a larger Keff2·Q.

Graphical Abstract

1. Introduction

The high-overtone bulk acoustic resonator (HBAR) structure consists of a piezoelectric sandwich micro-transducer and a substrate with low acoustic attenuation, where the transducer is composed of a piezoelectric film, a top electrode and a bottom electrode, as shown in Figure 1a. The acoustic wave excited by the thickness vibration of an electrically loaded piezoelectric plate propagates into the substrate, which will lead to the standing wave resonance. Since the substrate thickness is much larger than the acoustic wavelength, the HBAR will operate at a number of resonance frequencies; namely, HBAR has multi-frequency resonance characteristics, and it can be used as a multiple-frequency microwave source [1] and an agile-frequency synthesizer in electronic warfare. Besides, HBAR has a large quality factor (Q) due to the low acoustic attenuation substrate, and exhibits the largest Q-Frequency product of the crystal oscillators. Thus, it can also be applied in the low-phase noise microwave signal sources [2,3].
Zhang et al. [4,5,6] developed the resonance spectrum method for HBARs to study the resonance spectrum, the variations of the effective electromechanical coupling coefficient (Keff2) and frequency interval with the resonance spectrum, and the effects of the electrode thickness on Keff2. Pao et al. [7] discussed the variations of Keff2 with the substrate thickness for the HBAR with different substrate materials. Zhang et al. [8,9,10,11,12] conducted more in-depth research on the effects of the electrode and substrate materials as well as their thickness on the resonance spectrum distribution and the corresponding Keff2. These above studies have mainly focused on Keff2-frequency distribution of the HBAR, and the effects of each layer’s thickness on Keff2 have been only carried out in a special case, i.e., the so-called normal region. In our recent work [13], the influences of the continuous change of the thickness of several substrates, piezoelectric films and electrodes on Keff2 have been investigated systematically.
This paper presents a study on the resonance spectrum characteristics of Keff2 changing with several common substrates, electrodes and piezoelectric films as well as their thickness. Besides, a device, corresponding to one of the theoretical cases studied, is fabricated and evaluated. Finally, the effects of Keff2 on the function of the crystal oscillators with HBARs are discussed. Based on this study, a set of guidelines for the optimal selection of the HBAR’s parameters are provided.

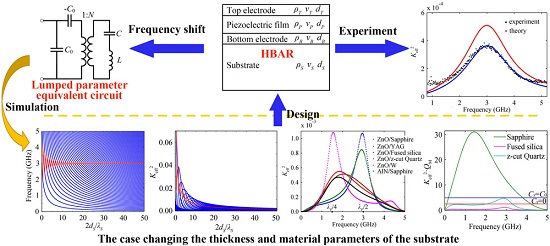
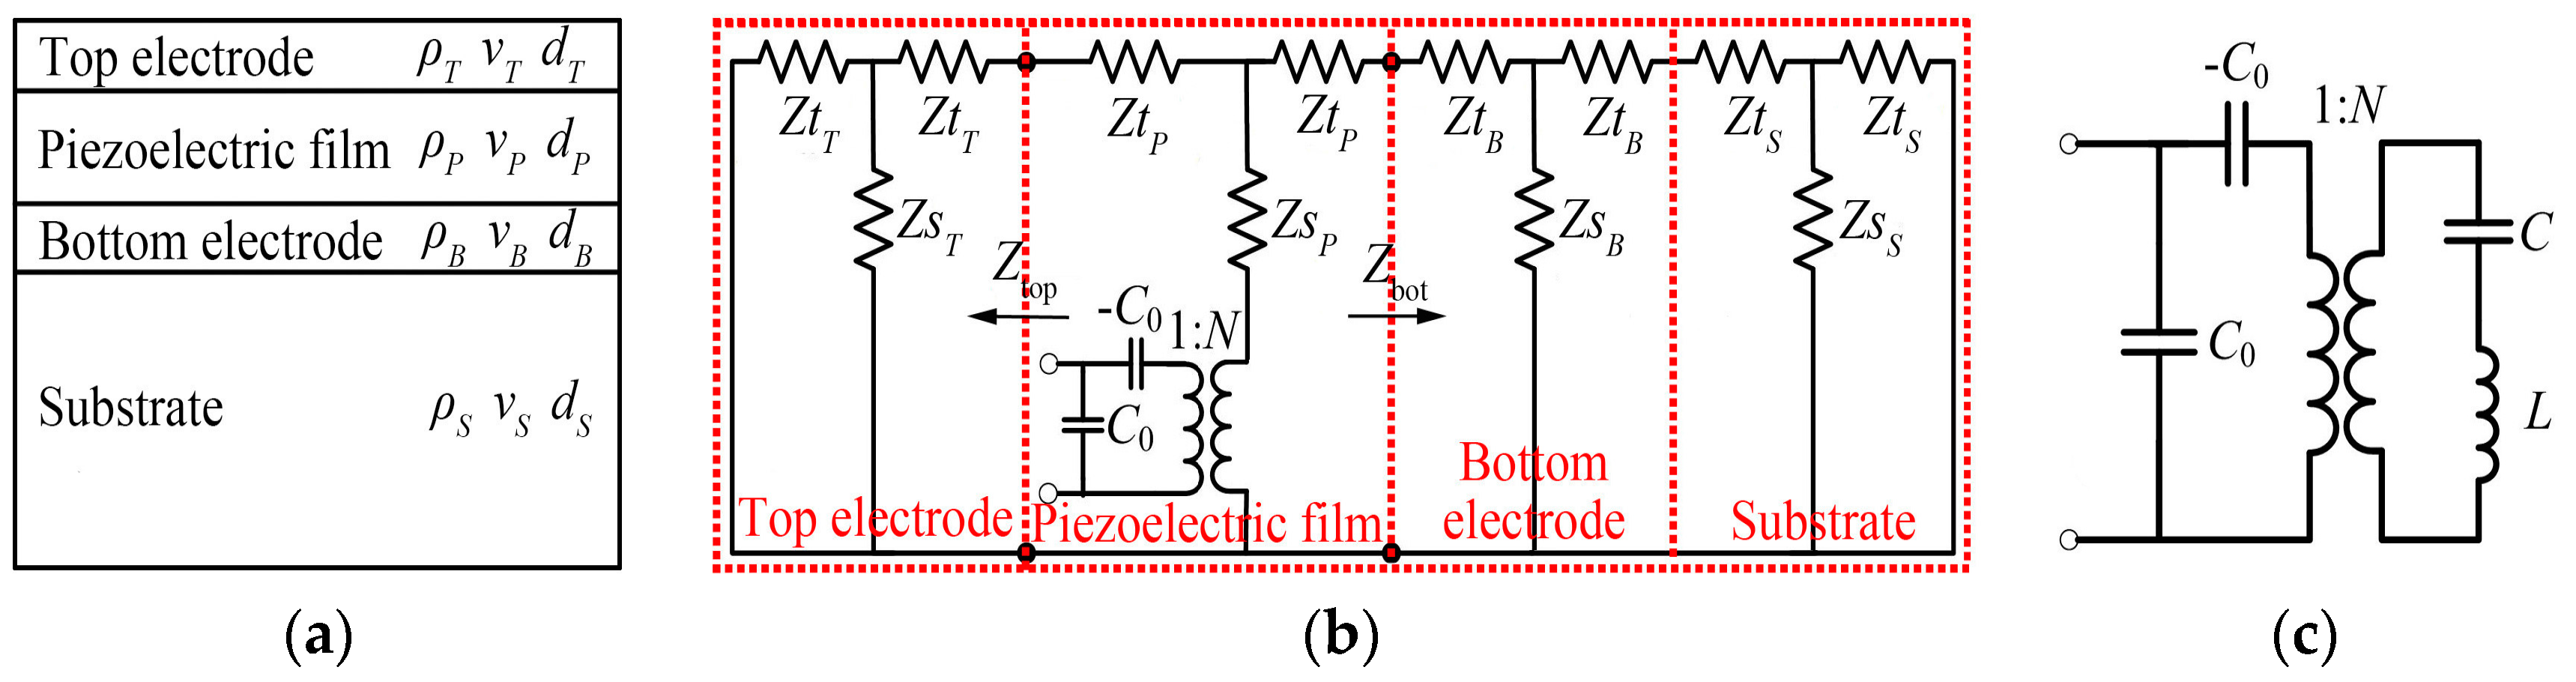
2. The Lumped Parameter Equivalent Circuit of HBAR

The characteristics of HBAR can be analyzed by a one-dimensional Mason equivalent circuit [14], shown in Figure 1b, where ZtT = jZTtan(αT/2), ZtP = jZPtan(αP/2), ZtB = jZBtan(αB/2) and ZtS = jZStan(αS/2); ZsT = ZT/(jsinαT), ZsP = ZP/(jsinαP), ZsB = ZB/(jsinαB) and ZsS = ZS/(jsinαS). ZT = ρTνTDT, ZP = ρPνPDP, ZB = ρBνBDB and ZS = ρSνSDS are the characteristic acoustic impedances. αT = kTdT, αP = kPdP, αB = kBdB and αS = kSdS; kT = ωT/νT, kP = ωP/νP, kB = ωB/νB and kS = ωS/νS are the wave vectors, and the subscripts T, P, B, S represent the top electrode, piezoelectric film, bottom electrode and substrate, respectively. ρ, ν, d are the density, extensional wave velocity and thickness, as shown in Figure 1a. D is the active area of the HBAR; ω is the angular frequency of the resonator; C0 = ε33SD/dP is the static capacitance of the resonator; N2 = C02kt2c33D/ε33S is the electromechanical conversion ratio; and ε33S, c33D and kt2 are the permittivity at constant strain, the stiffness coefficient at constant electric displacement and the thickness extensional electromechanical coupling coefficient of the piezoelectric film, respectively.
The parallel resonance frequency equation is
Z P 2 + Z top Z bot j Z P ( Z top + Z bot ) cot α P = 0
Ztop and Zbot are the input impedances on both sides of the piezoelectric layer, which are given by:
Z top = j Z T tan α T ,   Z bot = j Z B Z B tan α B + Z S tan α S Z B Z S tan α B tan α S
Equation (1) has multiple roots, which constitutes the resonance spectrum of a HBAR; the lower resonance frequency corresponds to a lower number of modes among the modes {m} = 1, 2, 3, ... m, m + 1, ... of a HBAR.
The distributed parameter equivalent circuit (see Figure 1b) can be simplified into the lumped parameter equivalent circuit (see Figure 1c) by the frequency shift method [15] near the concerned resonance frequencies. The mechanical compliance C and mechanical mass L of mode m are given by:
C ( m ) = 2 A 2 ω p Z P A 1 ,   L ( m ) = Z P A 1 2 ω p A 2 ,
where
A 1 = ( Z P j Z top cot α P ) [ Z S tan α B + Z B tan α S Z B Z S tan α B tan α S α S j Z bot ( α B Z B + α P Z P ) ] ( cot α P + j Z top Z P ) ( Z B α B + Z P α P + Z S Z B tan α B tan α S Z B Z S tan α B tan α S Z B α S ) α T [ j Z bot Z T Z P j Z top Z P Z T + ( Z top Z bot Z T Z T ) cot α P ]
A 2 = 2 Z P tan ( α P / 2 ) j ( Z top + Z bot )
The parallel and series resonance frequency of mode m are
f p ( m ) = 1 2 π L ( m ) C ( m ) ,   f s ( m ) = f p ( m ) 1 N 2 C ( m ) C 0
The Keff2 of mode m can be calculated as follows:
K eff ( m ) 2 = π 2 8 f p ( m ) 2 f s ( m ) 2 f p ( m ) 2 = π 2 8 N 2 C ( m ) C 0 = π 2 k t 2 4 α P A 2 A 1
The superscript m of the parameters above is ignored in the following discussions for simplicity. The case ignoring the influence of the thin electrodes, i.e., dT = dB→0, will be discussed in Section 3 and Section 4, firstly, and the case considering the influence of the electrodes will be studied in Section 5. The material parameters used in the paper are listed in Table 1 [16,17].

3. Relationship between the Effective Electromechanical Coupling Coefficient and the Substrate

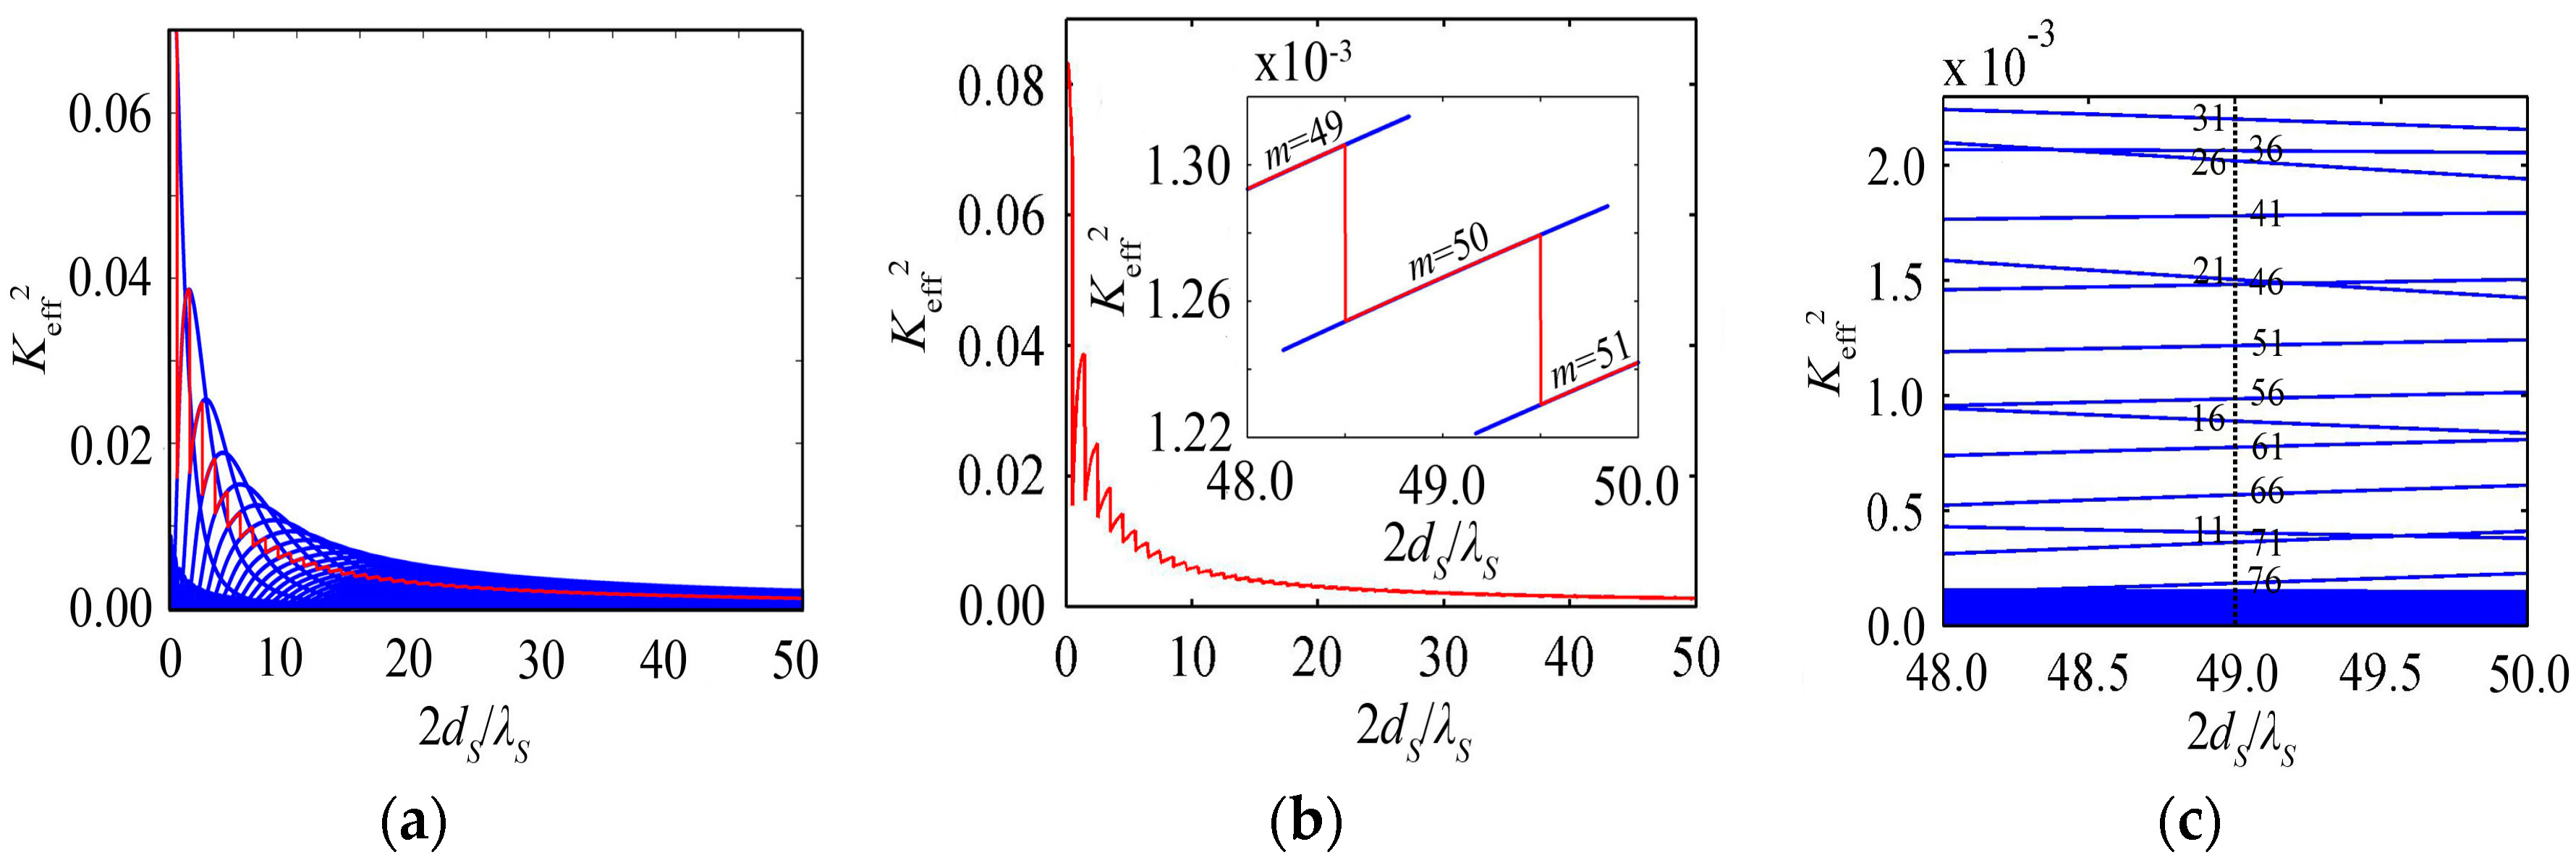
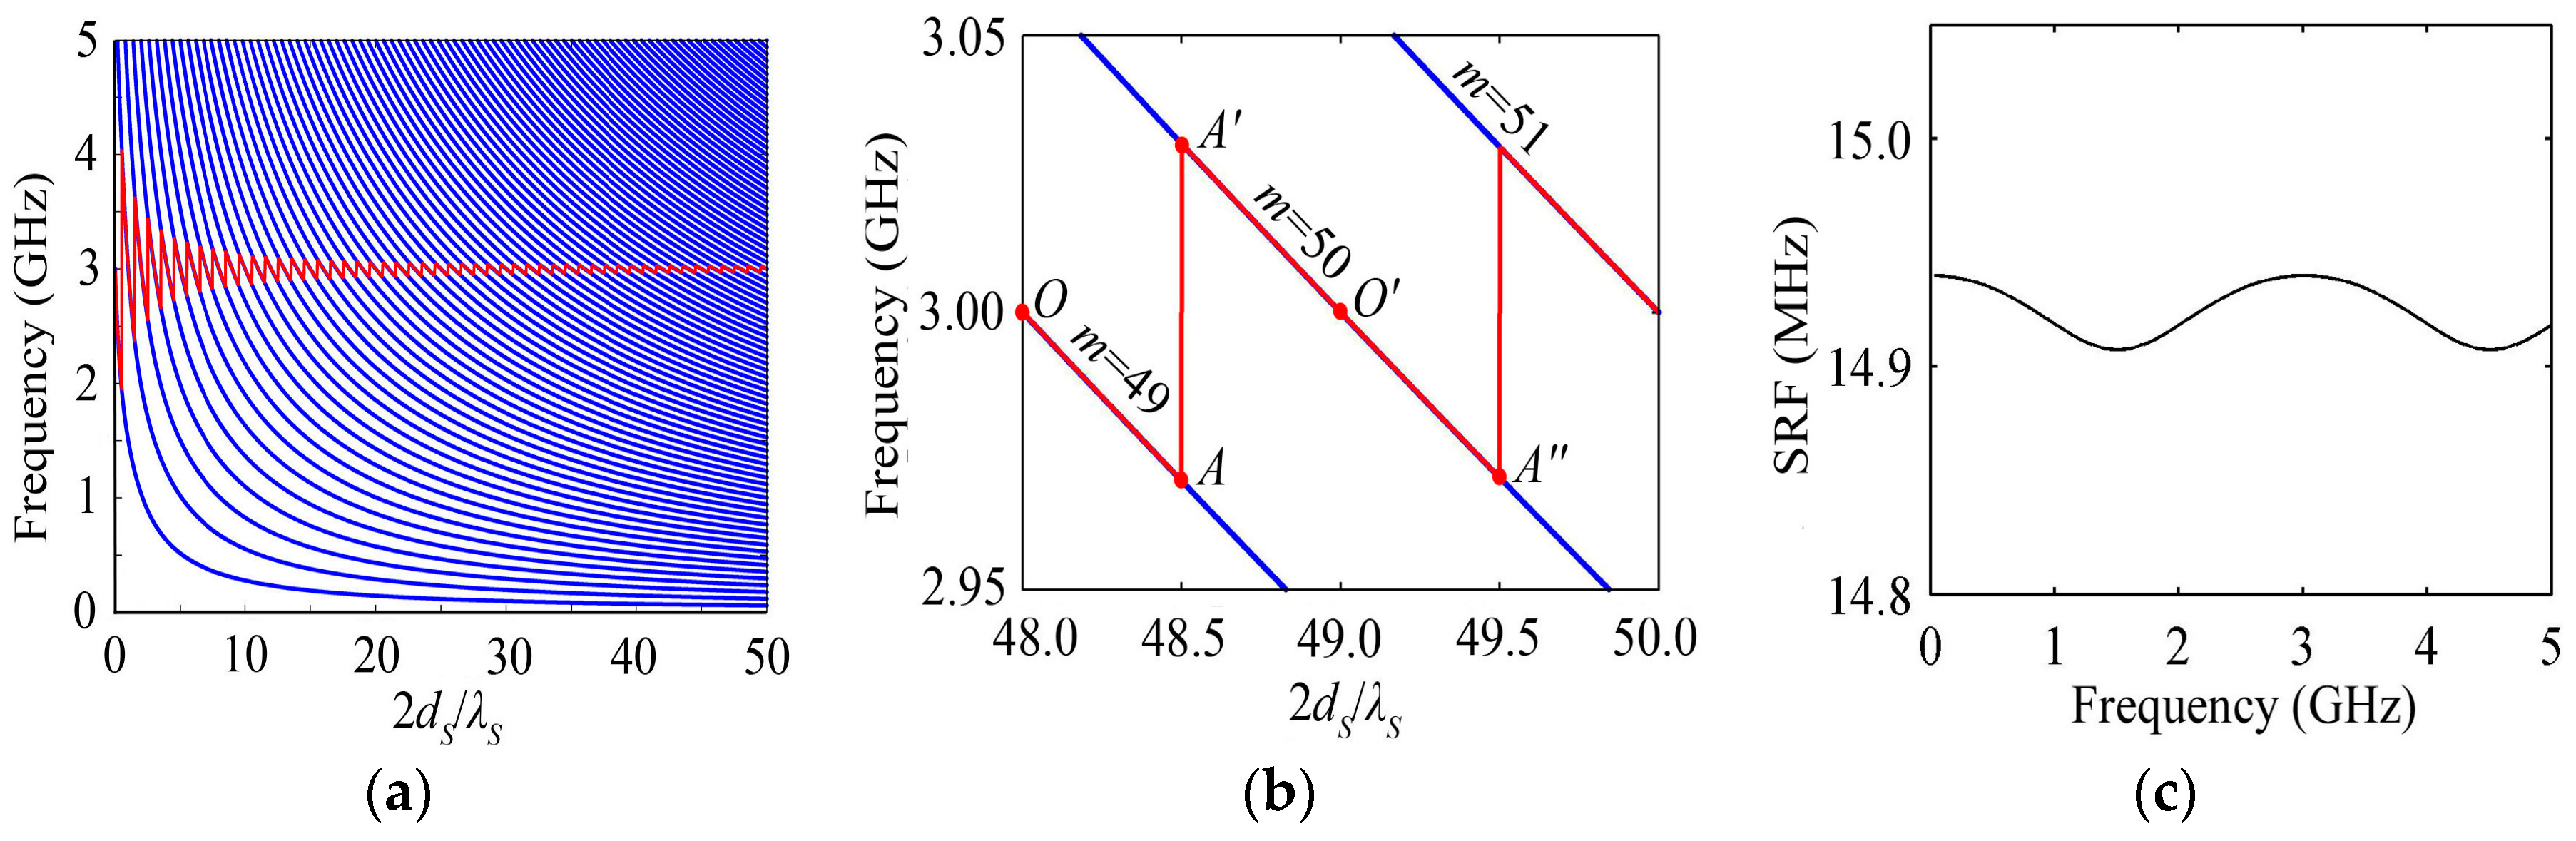
3.1. Keff2 Varies with the Substrate Thickness

The blue lines of Figure 2a show the behavior of the resonance frequency, i.e., the resonance spectrum, with the normalized substrate thickness 2dS/λS for the HBAR consisting of ZnO1.05μm/Sapphire, where dP = 1.05 μm = λP/2, λP and λS are the wavelengths of piezoelectric film and substrate at 3 GHz, respectively, similarly hereinafter. The resonance spectrum is composed of a set of separated curves, and the different curves are corresponding to the different number of modes. The resonance frequencies are a series of discrete values for the HBAR with a certain substrate thickness, which forms the resonance spectrum with multi-resonance frequencies. The substrate thickness brings about a great difference of the resonance spectrum distribution; the frequency of the same number of modes and spacing of the resonance frequencies (SRF) are smaller for thicker substrates. Besides, with the increase of the resonance frequency, the SRF is fluctuating slightly rather than being a constant value, as shown in Figure 2c.
The case discussed in the normal region [4,5,6,7,8,9,10,11,12] is that the thickness of the piezoelectric film and substrate are a half-wavelength and an integer multiple of the half-wavelength at the resonance frequency f0, respectively, e.g., the case of the intersections of f0 and the resonance spectrum shown in blue lines of Figure 2a when f0 = 3 GHz. The case where the substrate thickness does not equal an integer multiple of the half-wavelength, i.e., the substrate thickness is between any two adjacent discrete values, has not been studied yet; the HBAR will not resonate at f0 (3 GHz) in such a situation. The behavior of the resonance frequency closest to f0 with the substrate thickness is shown in the red line of Figure 2a; for its partial enlarged drawing Figure 2b, the resonance frequency closest to f0 declines along the OA line with the increase of the substrate thickness, and then it jumps to the A′ point with the corresponding number of modes changing from 49 to 50 when 2dS/λS ≈ 48.5. Similarly, the number of modes jumps to 51 at the A″ point in which 2dS/λS ≈ 49.5. The red line in Figure 2a shows that the resonance frequency closest to f0 oscillates around f0, and the oscillation amplitude is smaller for thicker substrates. Actually, the HBAR operating at f0 needs to be designed for practical application; however, the substrate thickness may not equal an integer multiple of the half-wavelength due to the manufacturing and velocity (ν) tolerances of the substrate, etc., which will lead to the fabricated HBAR not resonating at f0. If the HBAR operating at f0 is needed, based on above study, the resonance frequency of a fabricated HBAR can be corrected to the designed frequency by modifying the substrate thickness.
The behavior of Keff2 with the substrate thickness is composed of a series of intersecting blue lines shown in Figure 3a for the HBAR consisting of ZnO1.05μm/Sapphire. Each curve corresponding to a certain mode has a main peak and a series of lower peaks. With the increase of the number of modes, the main peak appears at the thicker substrate, and the corresponding peak value decreases gradually. As shown in the red line of Figure 3a or b, Keff2 at the resonance frequency closest to f0 declines rapidly and oscillates with the increase of the substrate thickness, and the oscillation amplitude gets smaller and smaller. Reference [18] demonstrates that the corresponding Q increases by adding to the substrate thickness; namely, it is at the expense of the lower Keff2 to increase the Q value, so the substrate thickness should be selected appropriately. Keff2 does not change monotonically with the increase of the number of modes for the HBAR with a certain substrate thickness, e.g., Keff2 has a maximum value at mode m = 31 when 2dS/λS = 49, as shown in Figure 3c. Besides, the maximum value of Keff2 (Keff2max) declines rapidly with the substrate thickness increasing, as shown in the envelope of the intersecting curve family in Figure 3a.

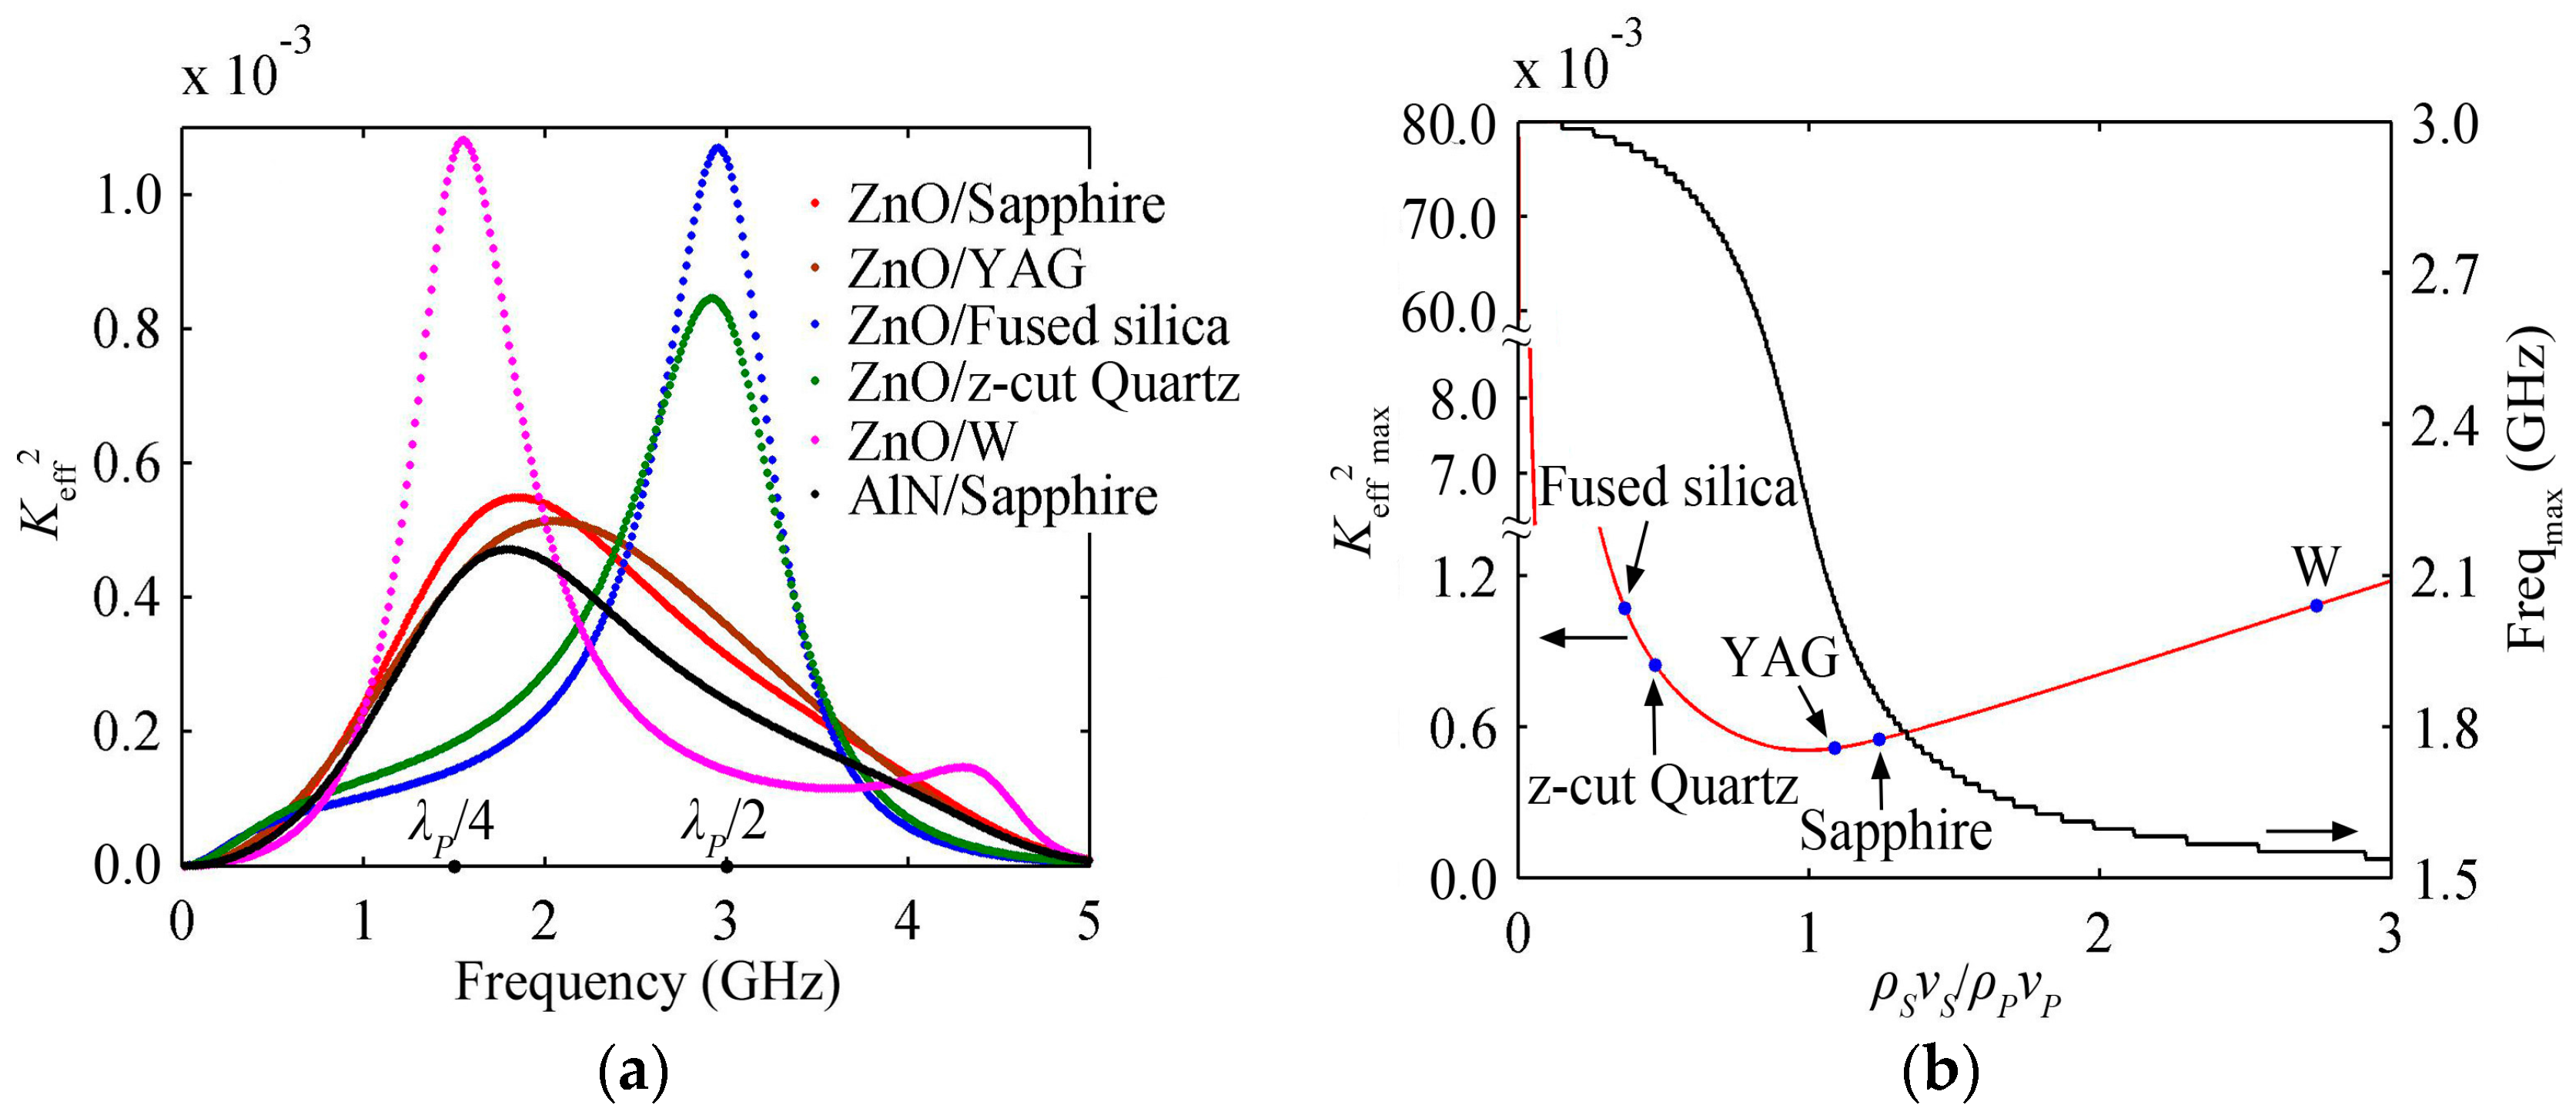
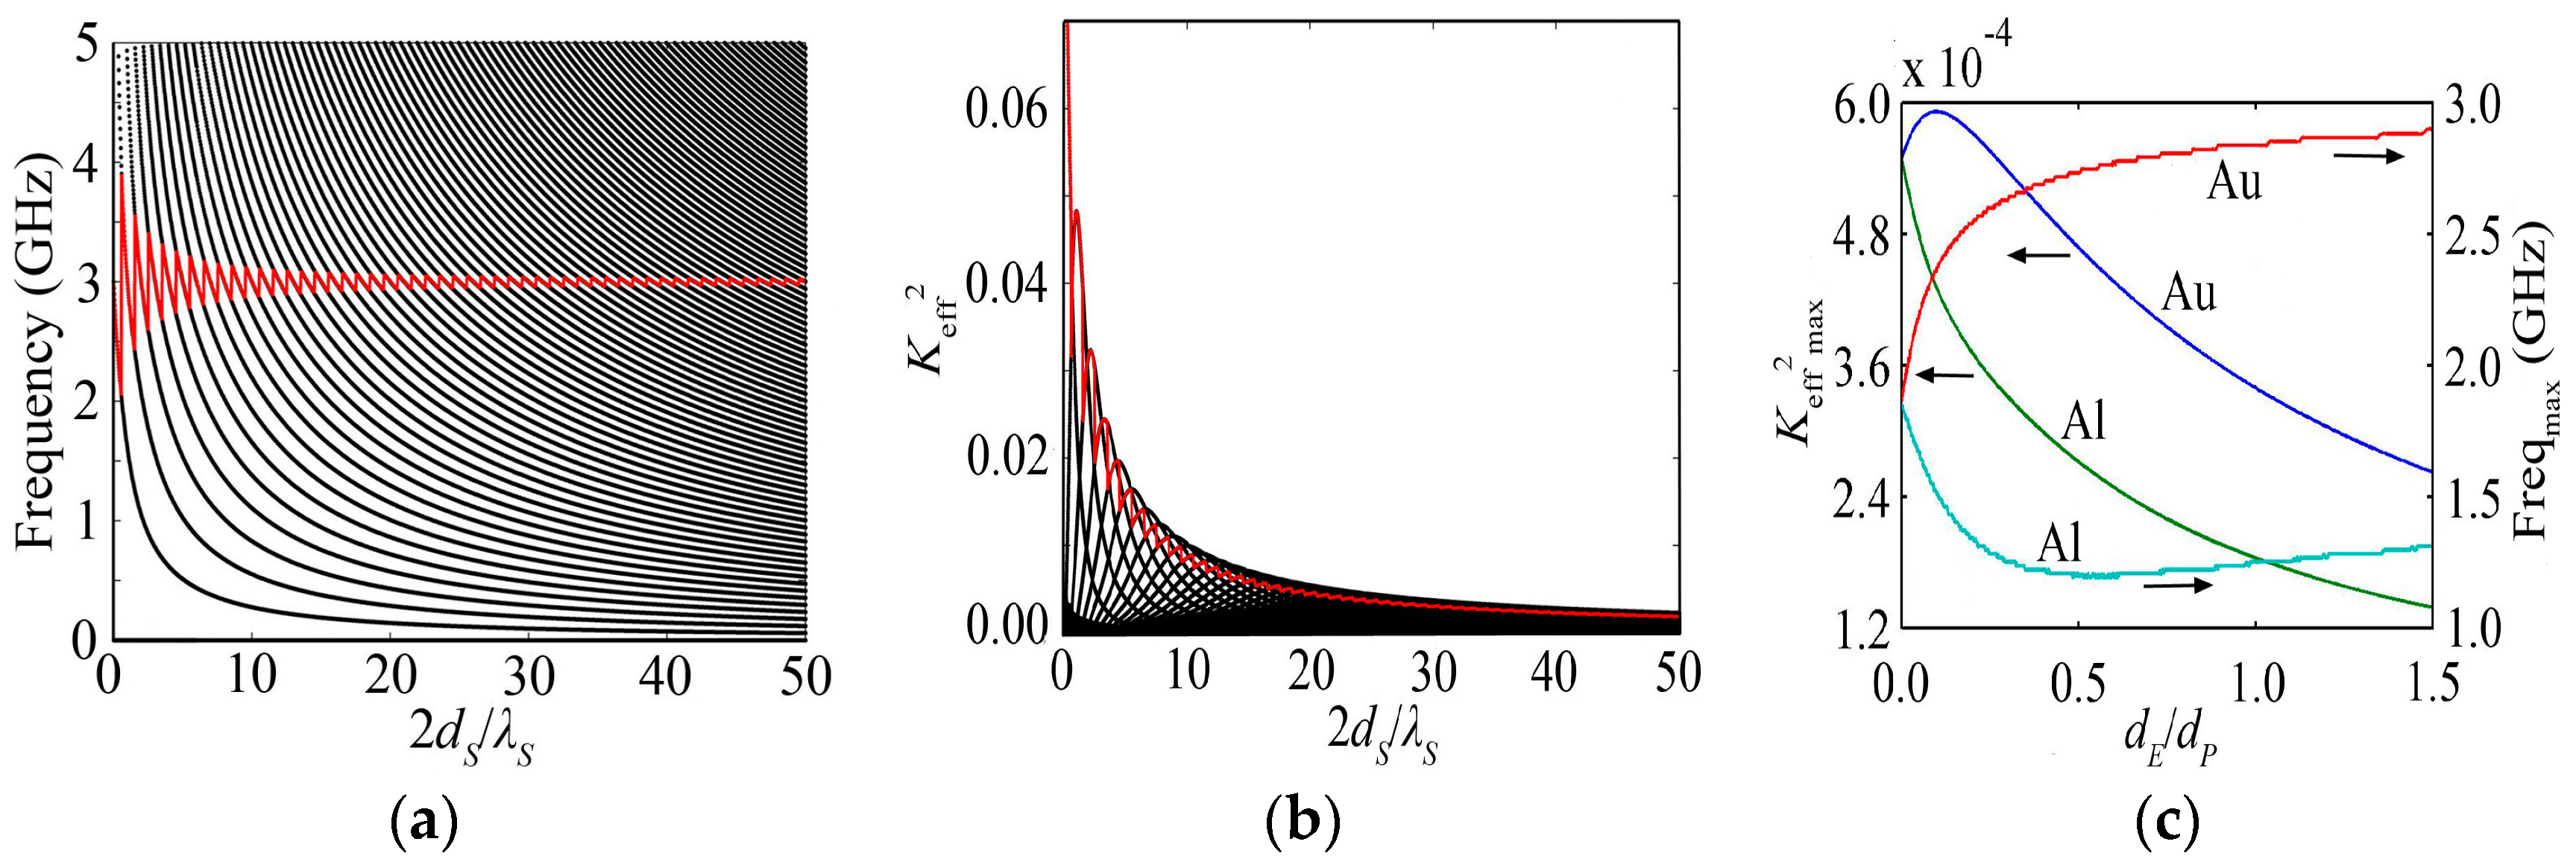
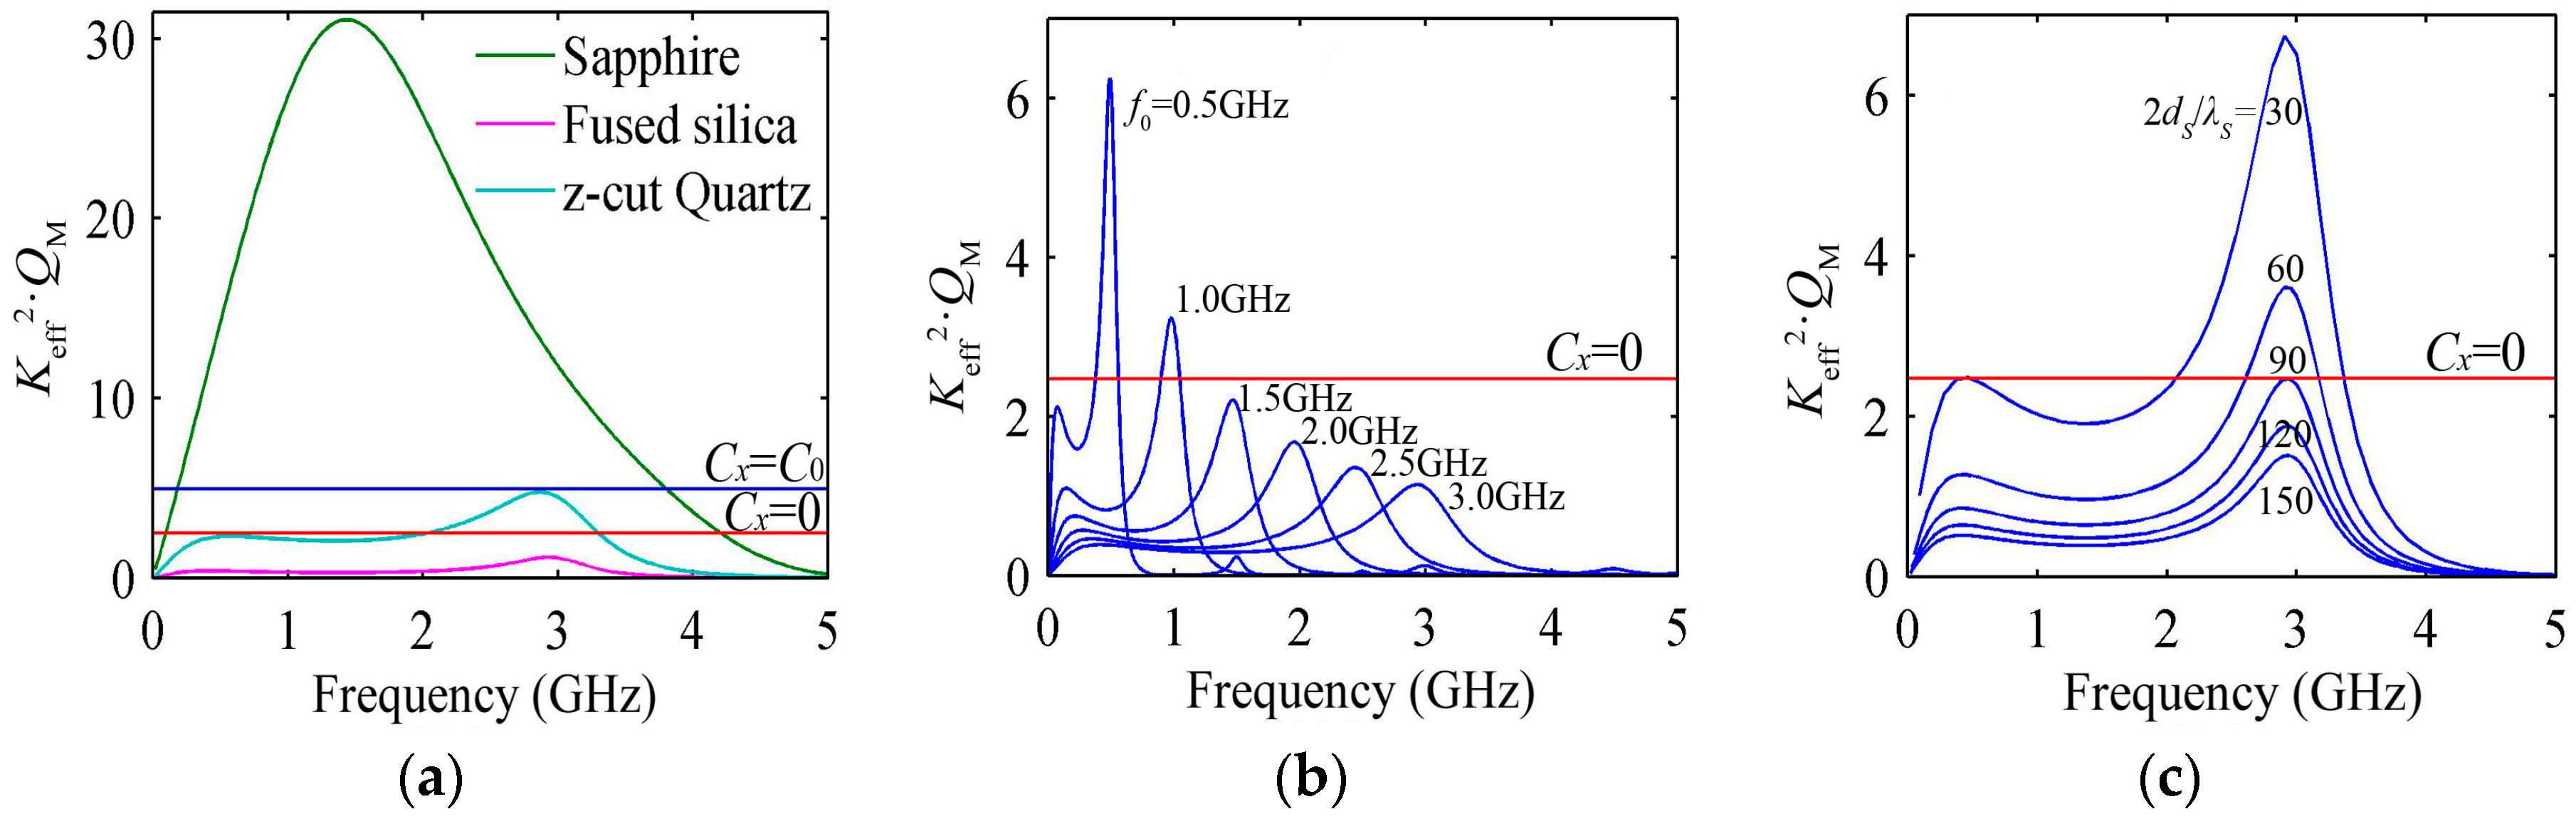
3.2. Keff2 Varies with the Substrate Materials

The behaviors of Keff2 with the resonance spectrum for the HBARs with several substrates, i.e., the HBARs with different characteristic impedance ratios of the substrate to piezoelectric film (ρSνS/ρPνP), are shown in Figure 4a, where the thickness of the ZnO and the substrate are a half-wavelength (1.05 μm) and 100 wavelengths at 3 GHz, respectively. It indicates that Keff2max and the corresponding resonance frequency (Freqmax) have a large difference for the HBARs with different ρSνS/ρPνP. Freqmax is close to the frequency where the piezoelectric film thickness is one-fourth of the wavelength for the hard substrate with a larger ρSνS/ρPνP, e.g., W, and it is close to the frequency where the piezoelectric film thickness is a half-wavelength for the soft substrate with a smaller ρSνS/ρPνP, e.g., fused silica. For a sapphire substrate with ρSνS/ρPνP = 1.24, the Freqmax equals 1.85 GHz and the corresponding piezoelectric film thickness is 0.31 wavelengths. Figure 4b shows that with the increase of ρSνS/ρPνP, Keff2max decreases rapidly to a minimum value where ρSνS/ρPνP equals one firstly, then increases slowly. Fused silica or z-cut quartz as the substrate has a larger Keff2max compared with sapphire or YAG, but a lower Q [18]. It is appropriate to choose sapphire or YAG as a substrate considering the effects of Keff2 on the function of the HBAR oscillators to be discussed later.

4. Relationship between the Effective Electromechanical Coupling Coefficient and the Piezoelectric Film

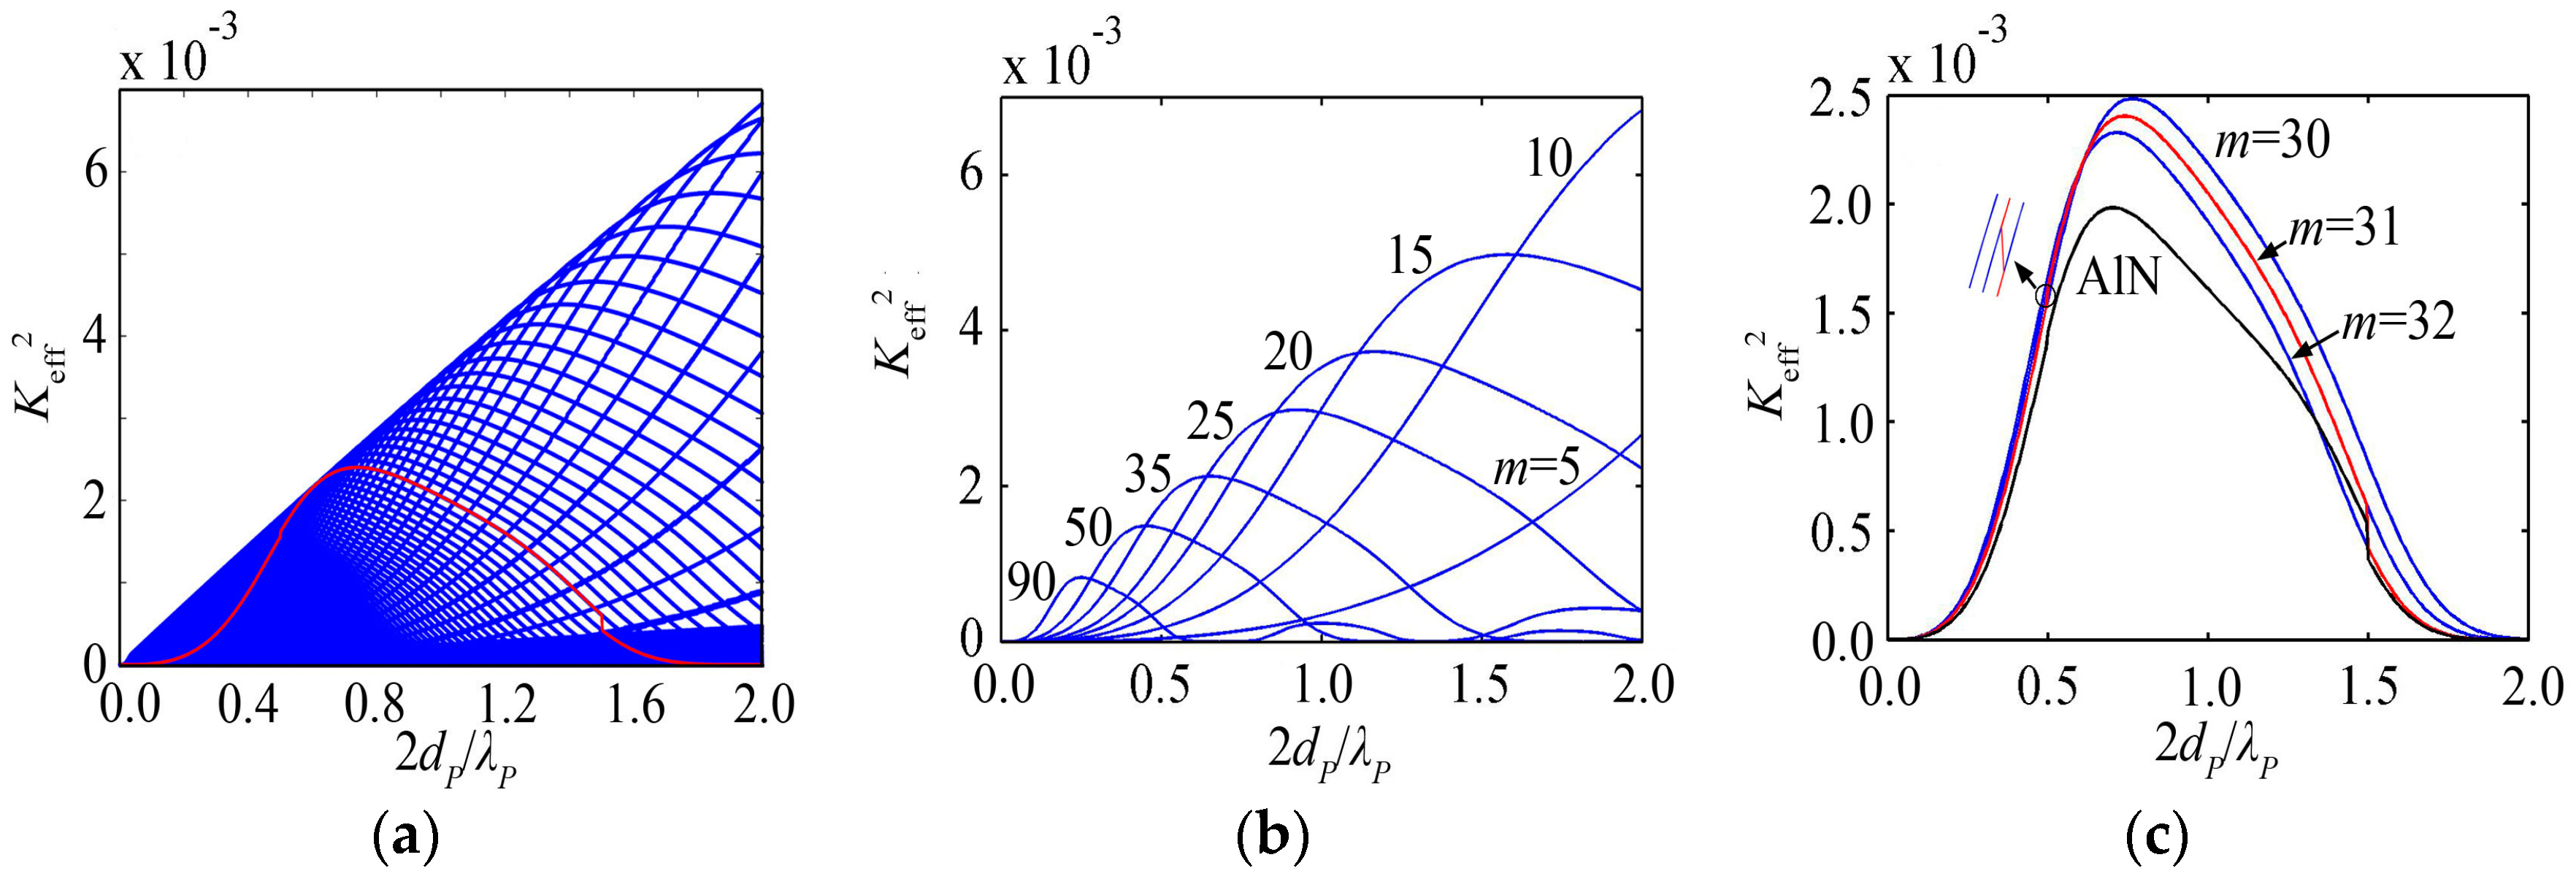
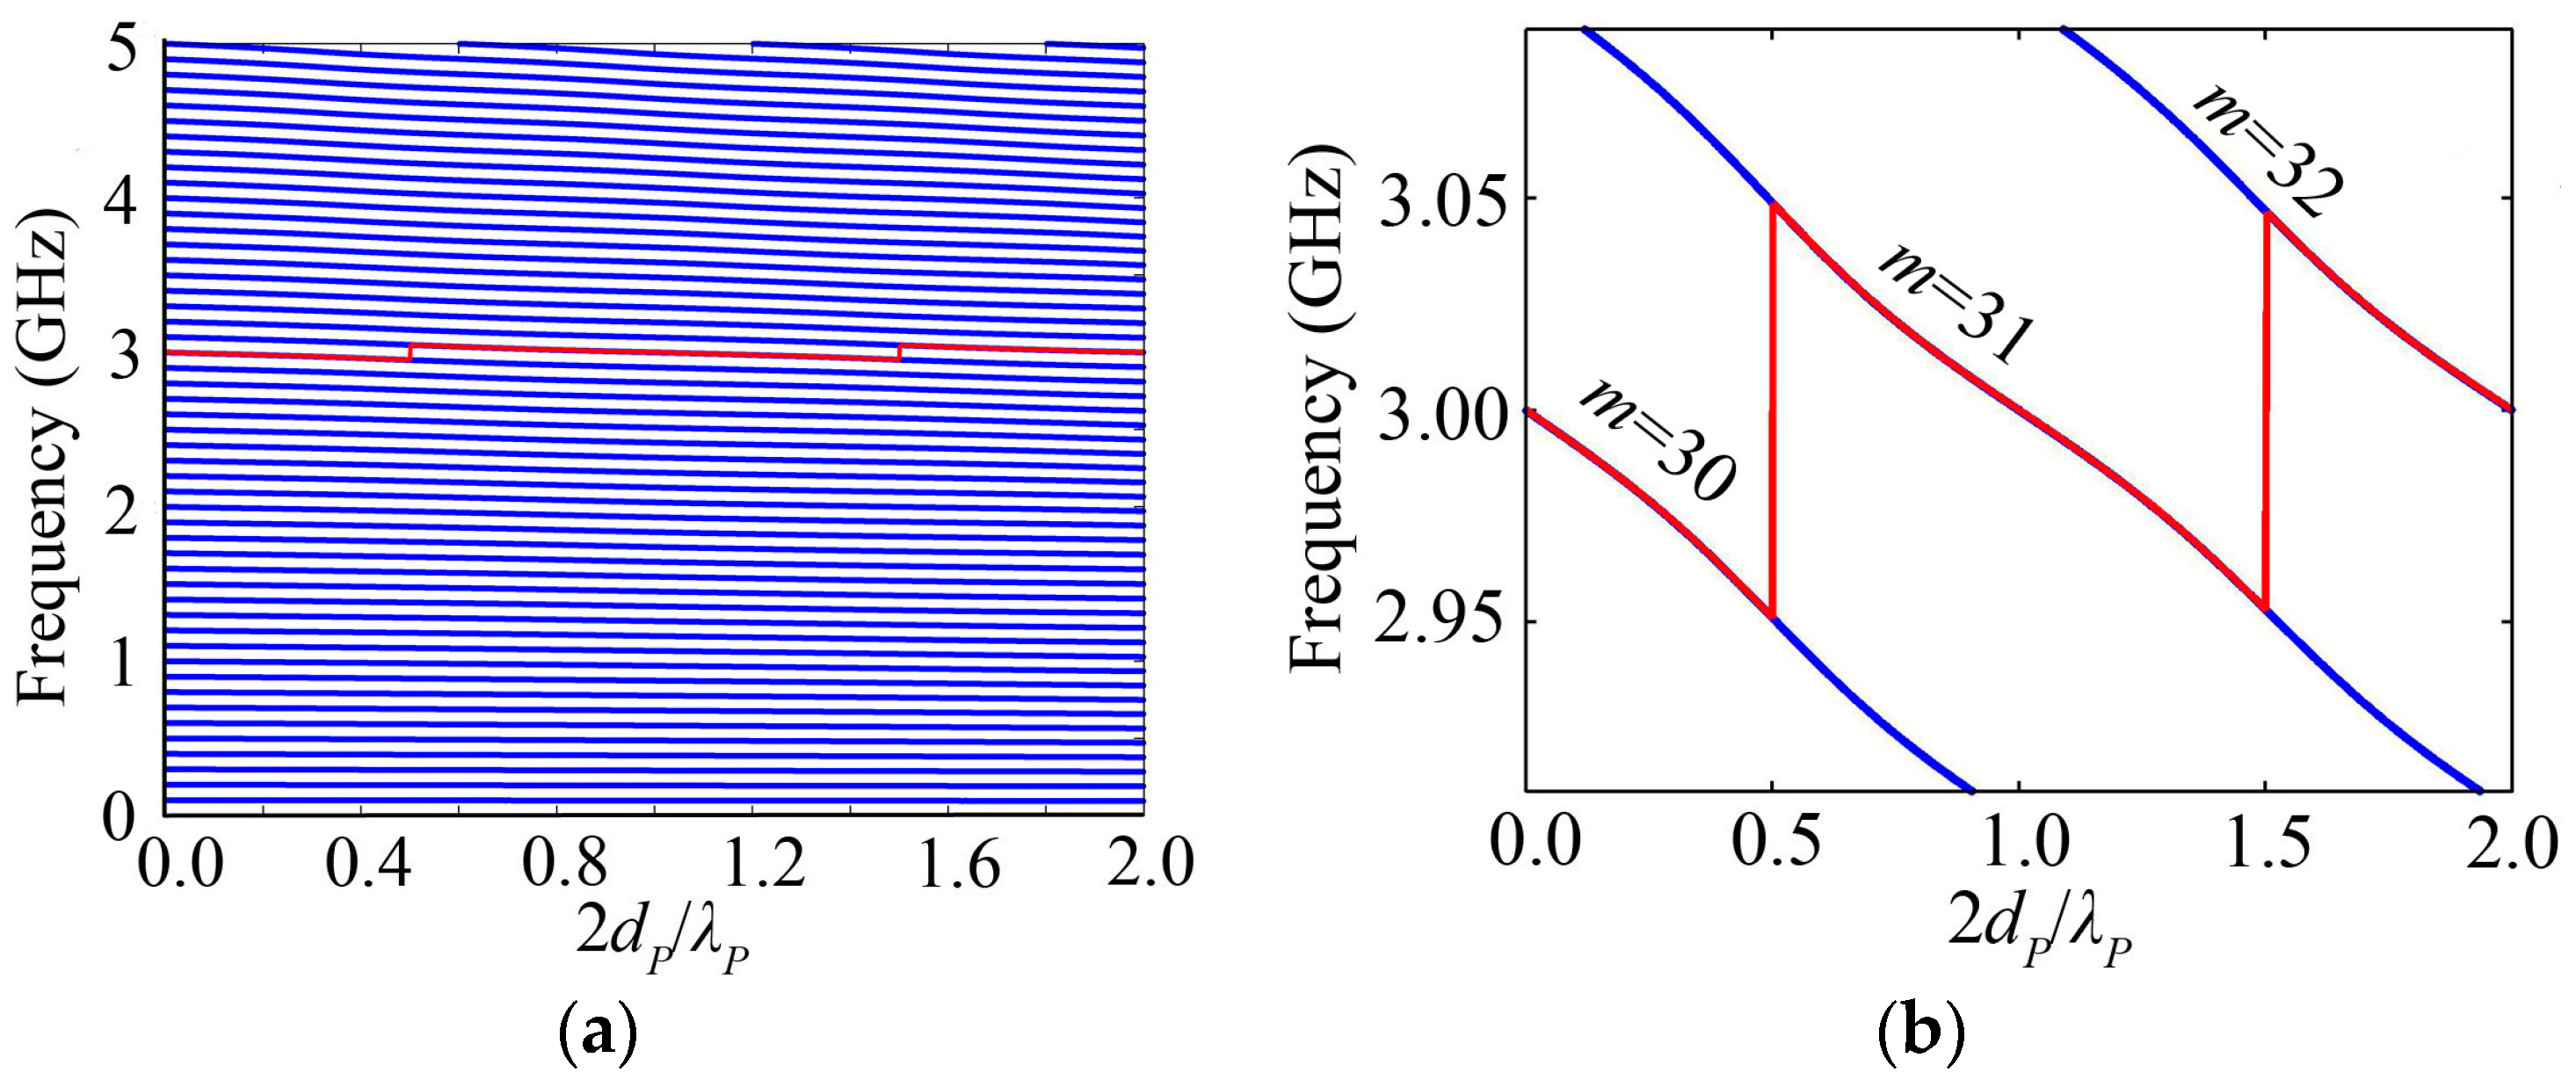
4.1. Keff2 Varies with the Piezoelectric Film Thickness

The blue lines of Figure 5a show the resonance spectrum changing with the piezoelectric film thickness for the HBAR consisting of ZnO/Sapphire55.78μm, where the substrate thickness corresponds to 15 wavelengths at 3 GHz. It can be seen that the HBAR has multi-frequency resonance characteristics similar to Figure 2a, but the change of the resonance spectrum is much smoother than that in the case of the substrate. Besides, the frequency of the same number of modes and SRF are smaller for thicker piezoelectric film. If the piezoelectric film thickness equals an integer multiple of the half-wavelength, the HBAR will resonate at f0 of 3 GHz; otherwise, the HBAR will not resonate at f0. The behavior of the resonance frequency closest to f0 with the piezoelectric film thickness is shown in the red line of Figure 5a or b, which is similar to the discussion in the case of the substrate, and its variations only contain three modes, namely m = 30, 31 and 32. With the increase of the piezoelectric film thickness, the resonance frequency closest to f0 jumps from m = 30 to m = 31 at 2dP/λP of 0.5 and from m = 31 to m = 32 at 2dP/λP of 1.5, respectively. The resonance frequency closest to f0 oscillates around f0, but its change amplitude is much smaller than that in the case of the substrate.
The variation of Keff2 with the piezoelectric film thickness is composed of a series of intersecting blue lines shown in Figure 6a for the HBAR consisting of ZnO/Sapphire55.78μm. Each curve corresponding to a certain mode has a main peak, which is similar to the case of the substrate. As shown in Figure 6b, with the increase of the number of modes, the main peak appears at the thinner piezoelectric film, and the corresponding peak value decreases gradually. Besides, Keff2 reaches its maximum at a lower number of modes for the HBAR with a thicker piezoelectric film. As shown in the red line of Figure 6a or c, Keff2 at the resonance frequency closest to f0 has a maximum value when the piezoelectric film thickness 2dP/λP ≈ 0.74, which is different from the case of the substrate.

4.2. Keff2 Varies with the Piezoelectric Film Materials

ZnO and AlN are commonly used piezoelectric film materials. Since ZnO has a larger kt2 than AlN according to Table 1, the HBAR with ZnO piezoelectric film has a larger Keff2 at the same number of modes, normalized thickness or frequency, as shown in Figure 6c and Figure 4a. Besides, due to the large extensional wave velocity ν of AlN (see Table 1), AlN piezoelectric film is much thicker than ZnO piezoelectric film when operating at the same frequency; however, the much thinner piezoelectric film may lead to short-circuit caused by pinholes in the process of sputtering, which will result in a lower yield. Therefore, it is more appropriate to use AlN as the piezoelectric film when the HBAR operates at a higher frequency.

5. Influence of the Electrode on the Effective Electromechanical Coupling Coefficient

Since the electrode thickness is comparable with the piezoelectric film thickness, the influence of the electrode should be taken into account for the HBARs operating at gigahertz frequencies, and Au and Al are two commonly used electrode materials. The HBARs discussed in the following have the same thickness of the top and bottom electrodes, and the sandwich transducer composed of electrode/ZnO/electrode operates at 3 GHz.

5.1. Keff2 Varies with the Substrate Thickness Considering the Effect of the Electrode

For the HBAR consisting of Au/ZnO/Au/Sapphire with the thickness ratio of the electrode to the piezoelectric film (dE/dP) of 0.1884, the variations of the resonance spectrum and Keff2 with the substrate thickness are shown in the black lines of Figure 7a,b, respectively, which are similar with the case ignoring the effect of the thin electrode shown in the blue lines of Figure 2a and Figure 3a. The oscillation behaviors of the resonance frequency closest to 3 GHz and the corresponding Keff2 with the substrate thickness, as shown in red line of Figure 7a,b, are also similar with the case shown in red line of Figure 2a and Figure 3a, respectively.

5.2. The Relationship between Keff2 and the Electrode Thickness and Materials
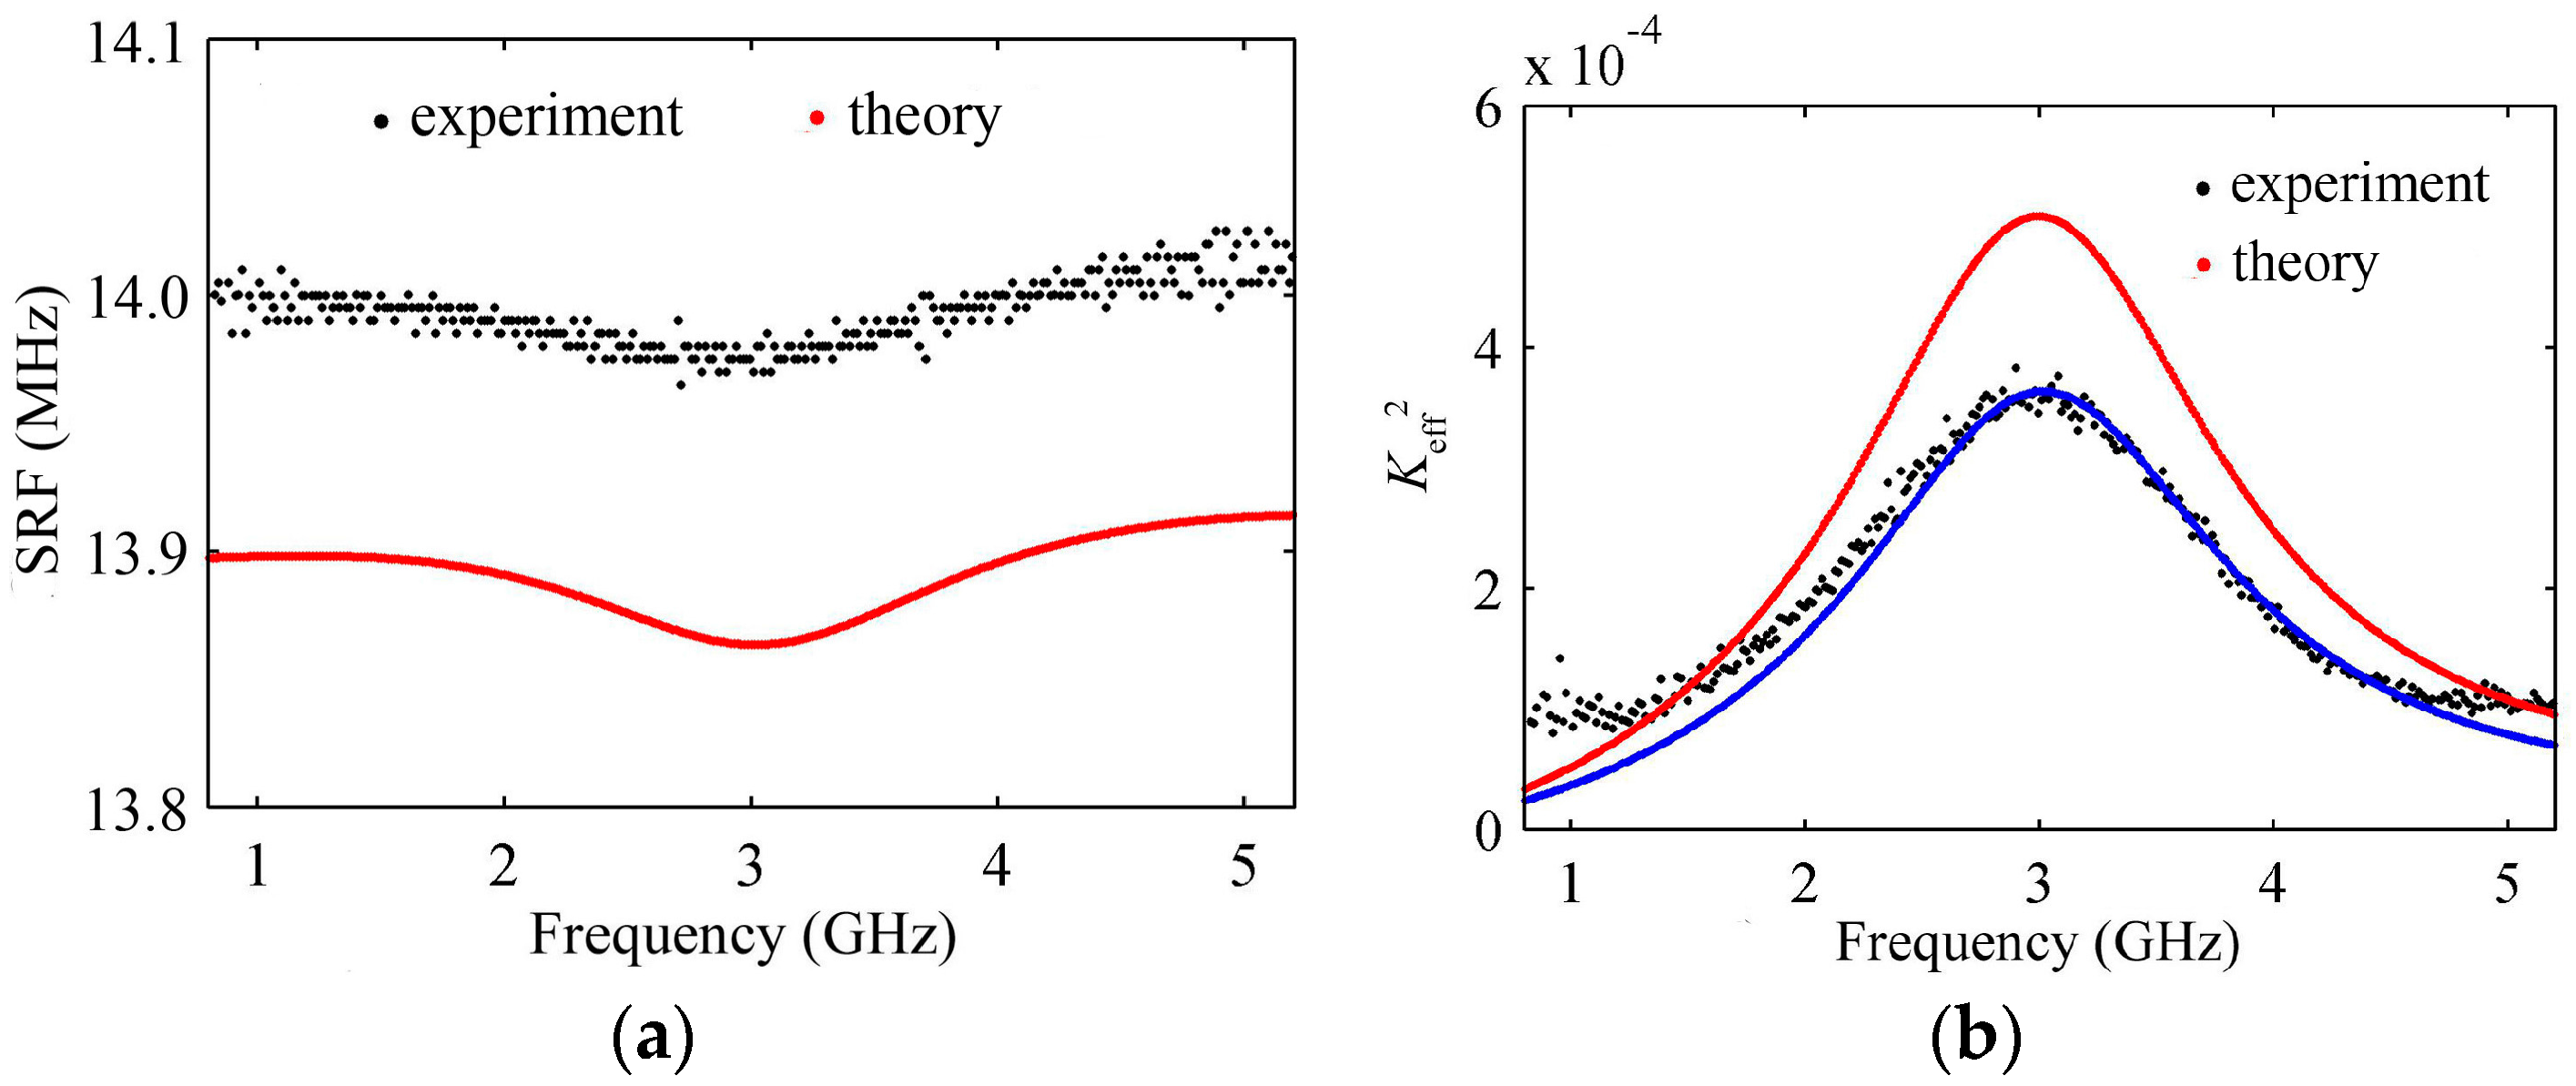
For the HBAR consisting of Au/ZnO/Au/Sapphire with 2dS/λS of 200, the Keff2max and Freqmax changing with dE/dP are shown in Figure 7c. It can be seen that Keff2max has a maximum value at dE/dP of 0.0958, which is 7.92% larger than that in the case ignoring the effect of the thin electrode; meanwhile, Freqmax has an increase of 27.46%. For the Al electrode, Keff2max declines rapidly with the increase of dE/dP, and it has less value than that in the case of Au. Freqmax decreases rapidly and then increases slowly with the increase of dE/dP. The proper dE/dP is required for the HBAR because the thicker electrode will reduce the Keff2max, and the thinner electrode will affect the Q value due to the ohmic resistance increasing. Therefore, it is better to use Au as the electrode than Al, and dE/dP = 0.10–0.26 is appropriate.

6. Experiment

In this paper, a HBAR based on a sapphire substrate was fabricated. The 400-μm-thick c-axis sapphire polished on both sides was used as the substrate. Au thin film was deposited upon the substrate and then patterned to form the bottom electrode of the piezoelectric transducer. ZnO piezoelectric film was deposited on the bottom electrode by magnetron sputtering and patterned to reveal the contact pads on the bottom electrode. The top electrode of Al was then deposited and patterned. The structure of the HBAR is Al100nm/ZnO0.6μm/Au100nm/Sapphire400μm and it has a square active area of 100 μm × 100 μm.
The HBAR was measured by the Agilent E5071C network analyzer (Agilent Technologies Inc., Palo Alto, CA, USA). The behaviors of the SRF with the frequency are shown in Figure 8a; the experimental and theoretical results have the same variation trends, and the experimental results are 0.7% larger than the theoretical results, which may be caused by the difference in characteristic parameters (ρ, ν) between the sputtered thin film and single-crystal materials listed in Table 1, the measuring errors of each layer’s thickness, etc. The experimental values of Keff2 are different from the theoretical results (see Figure 8b), and the main reason may be that the electromechanical coupling coefficient kt2 of sputtered piezoelectric film is less than that of the single-crystal material listed in Table 1 [19]. The experimental curve fits quite well with the theoretical result if kt2 is decreased by 27%, ignoring the other factors, as shown in the blue dots of Figure 8b.

7. Effects of Keff2 on the Function of the Crystal Oscillators Constructed with HBARs

Keff2 is directly related to the bandwidth and insertion loss in the filters [20], and for a larger Keff2, the bandwidth is larger at the same insertion loss or the insertion loss is smaller at the same bandwidth. For a HBAR, Keff2 seems to not be an influencing factor of the oscillators’ function since it operates at a single frequency, but this was not the case in reality. In order to generate oscillation, two conditions must be satisfied for the crystal oscillators constructed with HBARs [21]: the amplifier must be capable of providing a loop gain of one and the oscillators satisfies the following equation,
C 0 + C x Q M N 2 C 2
where Cx is the load capacitance in parallel with the HBAR in the oscillators and QM is the mechanical quality factor (when the mechanical loss of the HBAR is taken into account, the mechanical branch of Figure 1c adds a mechanical resistance R, and QM = ωL/R = 1/ωCR [18]) of the HBAR.
Substitute N 2 C = 8 π 2 K eff 2 C 0 obtained from Equations (7) into (8), and the crystal oscillators generating oscillation must satisfy,
K eff 2 · Q M π 2 4 ( C x C 0 + 1 )
The behavior of Keff2·QM with the frequency is shown in Figure 9a for the HBARs consisting of ZnO/substrate (sapphire, fused silica and z-cut quartz), where the thickness of the piezoelectric film and substrate are a half-wavelength and 100 wavelengths at 3 GHz, respectively. The lowest requirement for the HBARs’ oscillation is that there are some Keff2·QM values above the red line, namely the case that the load capacitance Cx equals zero in Equation (9). The HBAR with the fused silica substrate is not suitable as the crystal oscillators since its Keff2·QM curve is below the red line. For the HBAR with the z-cut quartz substrate, there are 87 modes satisfying their Keff2·QM values above the red line within a relatively narrow frequency range. However, the HBAR with the sapphire substrate can be applied as the crystal oscillators within a very wide frequency range (including 276 modes). When the load capacitance Cx equals C0, only the HBAR with the sapphire substrate can be used as the crystal oscillators (including 242 modes). If the lower operating frequency f0 (QM is inversely proportional to the frequency) or the thinner substrate (Keff2 is larger for the thinner substrate) is selected, the HBARs with the fused silica substrate can also be used as the crystal oscillators, as shown in Figure 9b,c. Therefore, the HBARs with a larger Keff2 or, strictly speaking, a larger Keff2·QM are required for the crystal oscillators.

8. Conclusions

The influences of the material and thickness properties of the different layers composing a HBAR on the resonance spectrum characteristics of Keff2 have been studied, and the effects of the common substrate, electrode and piezoelectric materials as well as their thicknesses have been evaluated. Based on this study, the structure of Au/ZnO/Au/Sapphire (or YAG) with the appropriate thickness of the substrate, piezoelectric film and electrode should be selected, as this can make the crystal oscillators obtain a larger frequency stability and frequency hopping bandwidth due to its larger Keff2·QM value. When the HBARs with the fused silica substrate operate at a low frequency or have a thin substrate, they can also be used as the crystal oscillators. Besides, the AlN piezoelectric film with a high velocity can be used for higher frequency, even though it has a smaller Keff2 than ZnO.

Acknowledgments

This work is supported by the National Natural Science Foundation of China (No. 11374327, and No. 11474304).

Author Contributions

Chenghao Wang proposed the method to study the resonance spectrum characteristics of Keff2 of HBARs. Jian Li analyzed several influencing factors of the resonance spectrum characteristics of Keff2 and processed the experimental data. Jian Li and Mengwei Liu performed the experiments.

Conflicts of Interest

The authors declare no conflict of interest.

References

  1. Moore, R.A.; Haynes, J.T.; McAvoy, B.R. High Overtone Bulk Resonator Stabilized Microwave Sources. In Proceedings of the IEEE Ultrasonics Symposium (IUS), Chicago, IL, USA, 14–16 October 1981; pp. 414–424.
  2. Yu, H.; Lee, C.Y.; Pang, W.; Zhang, H. Low Phase Noise, Low Power Consuming 3.7 GHz Oscillator Based on High-Overtone Bulk Acoustic Resonator. In Proceedings of the IEEE Ultrasonics Symposium (IUS), New York, NY, USA, 28–31 October 2007; pp. 1160–1163.
  3. Driscoll, M.M.; Jelen, R.A.; Matthews, N. Extremely low phase noise UHF oscillators utilizing high-overtone, bulk-acoustic resonators. IEEE Trans. Ultrason. Ferroelectr. Freq. Control 1992, 39, 774–779. [Google Scholar] [CrossRef] [PubMed]
  4. Zhang, Y.; Wang, Z.; Cheeke, J.D.N.; Hickernell, F.S. Direct characterization of ZnO films in composite resonators by the resonance spectrum method. In Proceedings of the IEEE Ultrasonics Symposium (IUS), Caesars Tahoe, NV, USA, 17–20 October 1999; pp. 991–994.
  5. Wang, Z.; Zhang, Y.; Cheeke, J.N. Characterization of electromechanical coupling coefficients of piezoelectric films using composite resonators. IEEE Trans. Ultrason. Ferroelectr. Freq. Control 1999, 46, 1327–1330. [Google Scholar] [CrossRef] [PubMed]
  6. Zhang, Y.; Wang, Z.; Cheeke, J.D. Resonant spectrum method to characterize piezoelectric films in composite resonators. IEEE Trans. Ultrason. Ferroelectr. Freq. Control 2003, 50, 321–333. [Google Scholar] [CrossRef] [PubMed]
  7. Pao, S.Y.; Chao, M.C.; Wang, Z.; Chiu, C.H. Analysis and experiment of HBAR frequency spectra and applications to characterize the piezoelectric thin film and to HBAR design. In Proceedings of the IEEE International Frequency Control Symposium and PDA Exhibition, New Orleans, LA, USA, 29–31 May 2002; pp. 27–35.
  8. Zhou, Q.B.; Lu, Y.K.; Zhang, S.Y. Extraction of electromechanical coupling coefficient of piezoelectric thin films deposited on substrates. Ultrasonics 2001, 39, 377–382. [Google Scholar] [CrossRef]
  9. Zhang, H.; Zhang, S.Y.; Zheng, K. Parameter characterization of high-overtone bulk acoustic resonators by resonant spectrum method. Ultrasonics 2005, 43, 635–642. [Google Scholar] [CrossRef] [PubMed]
  10. Zhang, H.; Wang, Z.; Zhang, S.Y. Electrode effects on frequency spectra and electromechanical coupling factors of HBAR. IEEE Trans. Ultrason. Ferroelectr. Freq. Control 2005, 52, 1020–1025. [Google Scholar] [CrossRef] [PubMed]
  11. Zhang, H.; Wang, Z.; Zhang, S.Y. Study on resonance frequency distribution of high-overtone bulk acoustic resonators. Chin. J. Acoust. 2005, 24, 146–154. [Google Scholar]
  12. Zhang, H.; Zhang, S.Y.; Zheng, K. Electrode effects on general modes in high-overtone bulk acoustic resonators. Ultrasonics 2007, 44, e737–e740. [Google Scholar] [CrossRef] [PubMed]
  13. Li, J.; Wang, C.H.; Liu, M.W. Effective electromechanical coupling coefficient of high-overtone bulk acoustic resonator. Chin. J. Acoust. 2016, in press. [Google Scholar]
  14. Sittig, E.K. Design and technology of piezoelectric transducers for frequencies above 100 MHz. In Physical Acoustics; Mason, W.P., Thurston, R.N., Eds.; Academic Press: New York, NY, USA, 1972; Volume IX, pp. 221–275. [Google Scholar]
  15. Berlincourt, D.A.; Curran, D.R.; Jaffe, H. Piezoelectric and piezomagnetic materials and their function in transducers. In Physical Acoustics; Mason, W.P., Ed.; Academic Press: New York, NY, USA, 1964; Part A; Volume 1, pp. 239–242. [Google Scholar]
  16. Auld, B.A. Appendix 2: Properties of materials. In Acoustic Fields and Waves in Solids; Wiley: New York, NY, USA, 1973; Volume 1, pp. 95–96. [Google Scholar]
  17. Zhang, Y.F.; Chen, D. Multilayer Integrated Film Bulk Acoustic Resonators; Springer: Berlin, Germany, 2013; p. 46. [Google Scholar]
  18. Li, J.; Liu, M.W.; Li, J.H.; Ma, J.; Wang, C.H. Mechanical quality factor of high-overtone bulk acoustic resonator. Chin. J. Acoust. 2016, 35, 193–211. [Google Scholar]
  19. Molarius, J.; Kaitila, J.; Pensala, T.; Ylilammi, M. Piezoelectric ZnO films by R.F. sputtering. J. Mater. Sci. Mater. Electron. 2003, 14, 431–435. [Google Scholar] [CrossRef]
  20. Hashimoto, K.Y. Surface Acoustic Wave Devices in Telecommunications: Modelling and Simulation; Springer: Berlin, Germany, 2000. [Google Scholar]
  21. Virgil, E.B. Introduction to Quartz Crystal Unit Design; Van Nostrand Reinhold Company: New York, NY, USA, 1982; pp. 101–133. [Google Scholar]
Figure 1. (a) The cross-section schematic of HBAR; (b) The one-dimensional Mason equivalent circuit model; (c) The lumped parameter equivalent circuit near the resonance frequency.
Micromachines 07 00159 g001
Figure 2. The HBAR consisting of ZnO1.05μm/Sapphire; (a) The variation curve of the resonance frequency with the substrate thickness; (b) The partial enlarged drawing of Figure 2a; (c) The change of SRF with the frequency when the substrate thickness 2dS/λS = 200.
Micromachines 07 00159 g002
Figure 3. The HBAR consisting of ZnO1.05μm/Sapphire; (a) The variation curve of Keff2 with the substrate thickness; (b) The variation curve of Keff2 at the frequency closest to f0 with the substrate thickness; (c) The partial enlarged drawing of Figure 3a.
Micromachines 07 00159 g003
Figure 4. (a) The variation curve of Keff2 with resonance spectrum; (b) The variation curve of Keff2max and Freqmax with ρ s ν s / ρ P ν P .
Micromachines 07 00159 g004
Figure 5. The HBAR consisting of ZnO/Sapphire55.78μm; (a) The variation curve of the resonance frequency with the piezoelectric film thickness; (b) The partial enlarged drawing of Figure 5a.
Micromachines 07 00159 g005
Figure 6. The HBAR consisting of ZnO/Sapphire55.78μm; (a) The variation curve of Keff2 with the piezoelectric film thickness; (b) The partial modes of HBAR shown in Figure 6a; (c) The partial enlarged drawing of Figure 6a close to mode m = 30.
Micromachines 07 00159 g006
Figure 7. (a) The variation curve of the resonance frequency with the substrate thickness for the HBAR consisting of Au/ZnO/Au/Sapphire; (b) The variation curve of Keff2 with the substrate thickness for the HBAR consisting of Au/ZnO/Au/Sapphire; (c) The variation curve of Keff2max with dE/dP for the HBAR consisting of Au(Al)/ZnO/Au(Al)/Sapphire with the substrate thickness 2dS/λS of 200, where the blue and red lines represent Keff2max and Freqmax of Au, respectively, and the green and light blue lines represent Keff2max and Freqmax of Al, respectively.
Micromachines 07 00159 g007
Figure 8. (a) The variation curve of SRF with the resonance frequency; (b) The variation curve of Keff2 with the resonance frequency.
Micromachines 07 00159 g008
Figure 9. The variation curve of Keff2·QM with the resonance frequency; (a) The HBARs consisting of ZnO/substrate; (b) The different operating frequency using fused silica as substrate; (c) The different thickness of fused silica substrate.
Micromachines 07 00159 g009
Table 1. Material parameters of composite resonators used.
StructureMaterialν (m/s)ρ (kg/m3)kt2ρν (×107 kg·m−2·s−1)
Piezoelectric filmZnO630156800.07843.5790
AlN10,40032600.0653.3904
SubstrateFused silica59732200-1.3141
z-cut Quartz63592651-1.6858
Yttrium aluminum garnet (YAG)85584550-3.8939
Sapphire11,1553986-4.4464
Tungsten (W) 1511319,200-9.8170
ElectrodeAl63302695-1.7059
Au310419,300-5.9907
1 W is not the commonly used material and is used in the analysis due to its high characteristic impedance.

