Article

A Concentration-Controllable Microfluidic Droplet Mixer for Mercury Ion Detection

Key Laboratory of Artificial Micro- and Nano-Structures of Ministry of Education, School of Physics and Technology, Wuhan University, Wuhan 430000, China
*
Author to whom correspondence should be addressed.
Both authors contributed equally to this work.
Micromachines 2015, 6(7), 915-925; https://doi.org/10.3390/mi6070915
Submission received: 12 June 2015 / Revised: 6 July 2015 / Accepted: 6 July 2015 / Published: 13 July 2015
(This article belongs to the Special Issue Droplet Microfluidics: Techniques and Technologies)

Abstract

:
A microfluidic droplet mixer is developed for rapid detection of Hg(II) ions. Reagent concentration and droplets can be precisely controlled by adjusting the flow rates of different fluid phases. By selecting suitable flow rates of the oil phase, probe phase and sample phase, probe droplets and sample droplets can be matched and merged in pairs and subsequently well-mixed in the poly (dimethylsiloxane) (PDMS) channels. The fluorescence enhancement probe (Rhodamine B mixed with gold nanoparticles) encapsulated in droplets can react with Hg(II) ions. The Hg(II) ion concentration in the sample droplets is adjusted from about 0 to 1000 nM through fluid regulation to simulate possible various contaminative water samples. The intensity of the emission fluorescence is sensitive to Hg(II) ions (increases as the Hg(II) ion concentration increases). Through the analysis of the acquired fluorescence images, the concentration of Hg(II) ions can be precisely detected. With the advantages of less time, cost consumption and easier manipulations, this device would have a great potential in micro-scale sample assays and real-time chemical reaction studies.

1. Introduction

The rapid development of industrialization, urbanization and human population results in a series of pollution problems. Representatively, industrial heavy metal pollutants, even in a very low concentration, bring adverse effects on the environment and also on human health [1]. Mercury (Hg) is one of the greatest dangers because it can easily pass though skin, respiratory, and gastrointestinal systems [2]. Concerns over the toxic side effects of mercury have persistently motivated the exploration for simple and fast detection of aqueous Hg(II) ions. Up to date, several classical techniques have been widely used to monitor concentration levels of mercury in water samples, such as atomic absorption spectroscopy (AAS) [3], inductively coupled plasma-mass spectrometry (ICP-MS) [4], atomic fluorescence spectrometry (AFS) [5], and high performance liquid chromatography (HPLC) [6]. However, their excellent performance is achieved at the expenses of expensive instruments, complicated manipulations and time-consuming sample preparation processes. Over the past decades, with the advancement of various nanotechnologies, versatile biochemical sensors based on nanomaterials have been developed for Hg(II) ion detection [7,8,9,10,11]. Among them, gold nanoparticle (AuNP) is one of the most adopted probes to provide an alternative to conventional detection methods [12,13]. Nevertheless, AuNP probe still faces limitations of large testing regent consumption, rough concentration control and unachievable in situ monitoring [14].
Microfluidics, with advantages of miniaturization, high throughput and fast detection, meets the above challenges well [15]. Related works have demonstrated that various analytical procedures, such as the sample collection, sample pretreatment, analytical separations, reactions and detection, totally could be incorporated into microfluidic systems [16]. Hence, several groups have presented the detection of Hg(II) ions into microfluidic devices [17,18]. As an important branch of microfluidics, droplet-based microfluidics own innate advantages in biochemical assays. The droplet is a separate, micro-sized reaction chamber, which makes it possible to minimize the energy consumption and the required reagents, and to better control the mixture/reaction parameters [19,20,21,22]. While, to our best knowledge, there is little work on utilizing droplet-based microfluidic systems for Hg(II) ion detection.
Herein, we develop a simple, economic and miniaturized droplet-based microfluidic mixer for rapid detection of Hg(II) ions. In our device, droplet volume and reagent concentration can be precisely and continuously controlled by adjusting the flow rates. By selecting suitable flow rates, droplets could be merged and well-mixed in the Y-shape and S-shape channels. After optimizing the relative experimental conditions, fluorescence enhancement Rhodamine B-AuNP probe droplets are used to detect Hg(II) ions. On-chip manipulations allow the easy and automatic regulation of the size and concentration of droplets as well as the continuous in situ monitoring. This microfluidic droplet mixer device could also be used for rapid chemical synthesis and micro-scale sample assays.

2. Material and Methods

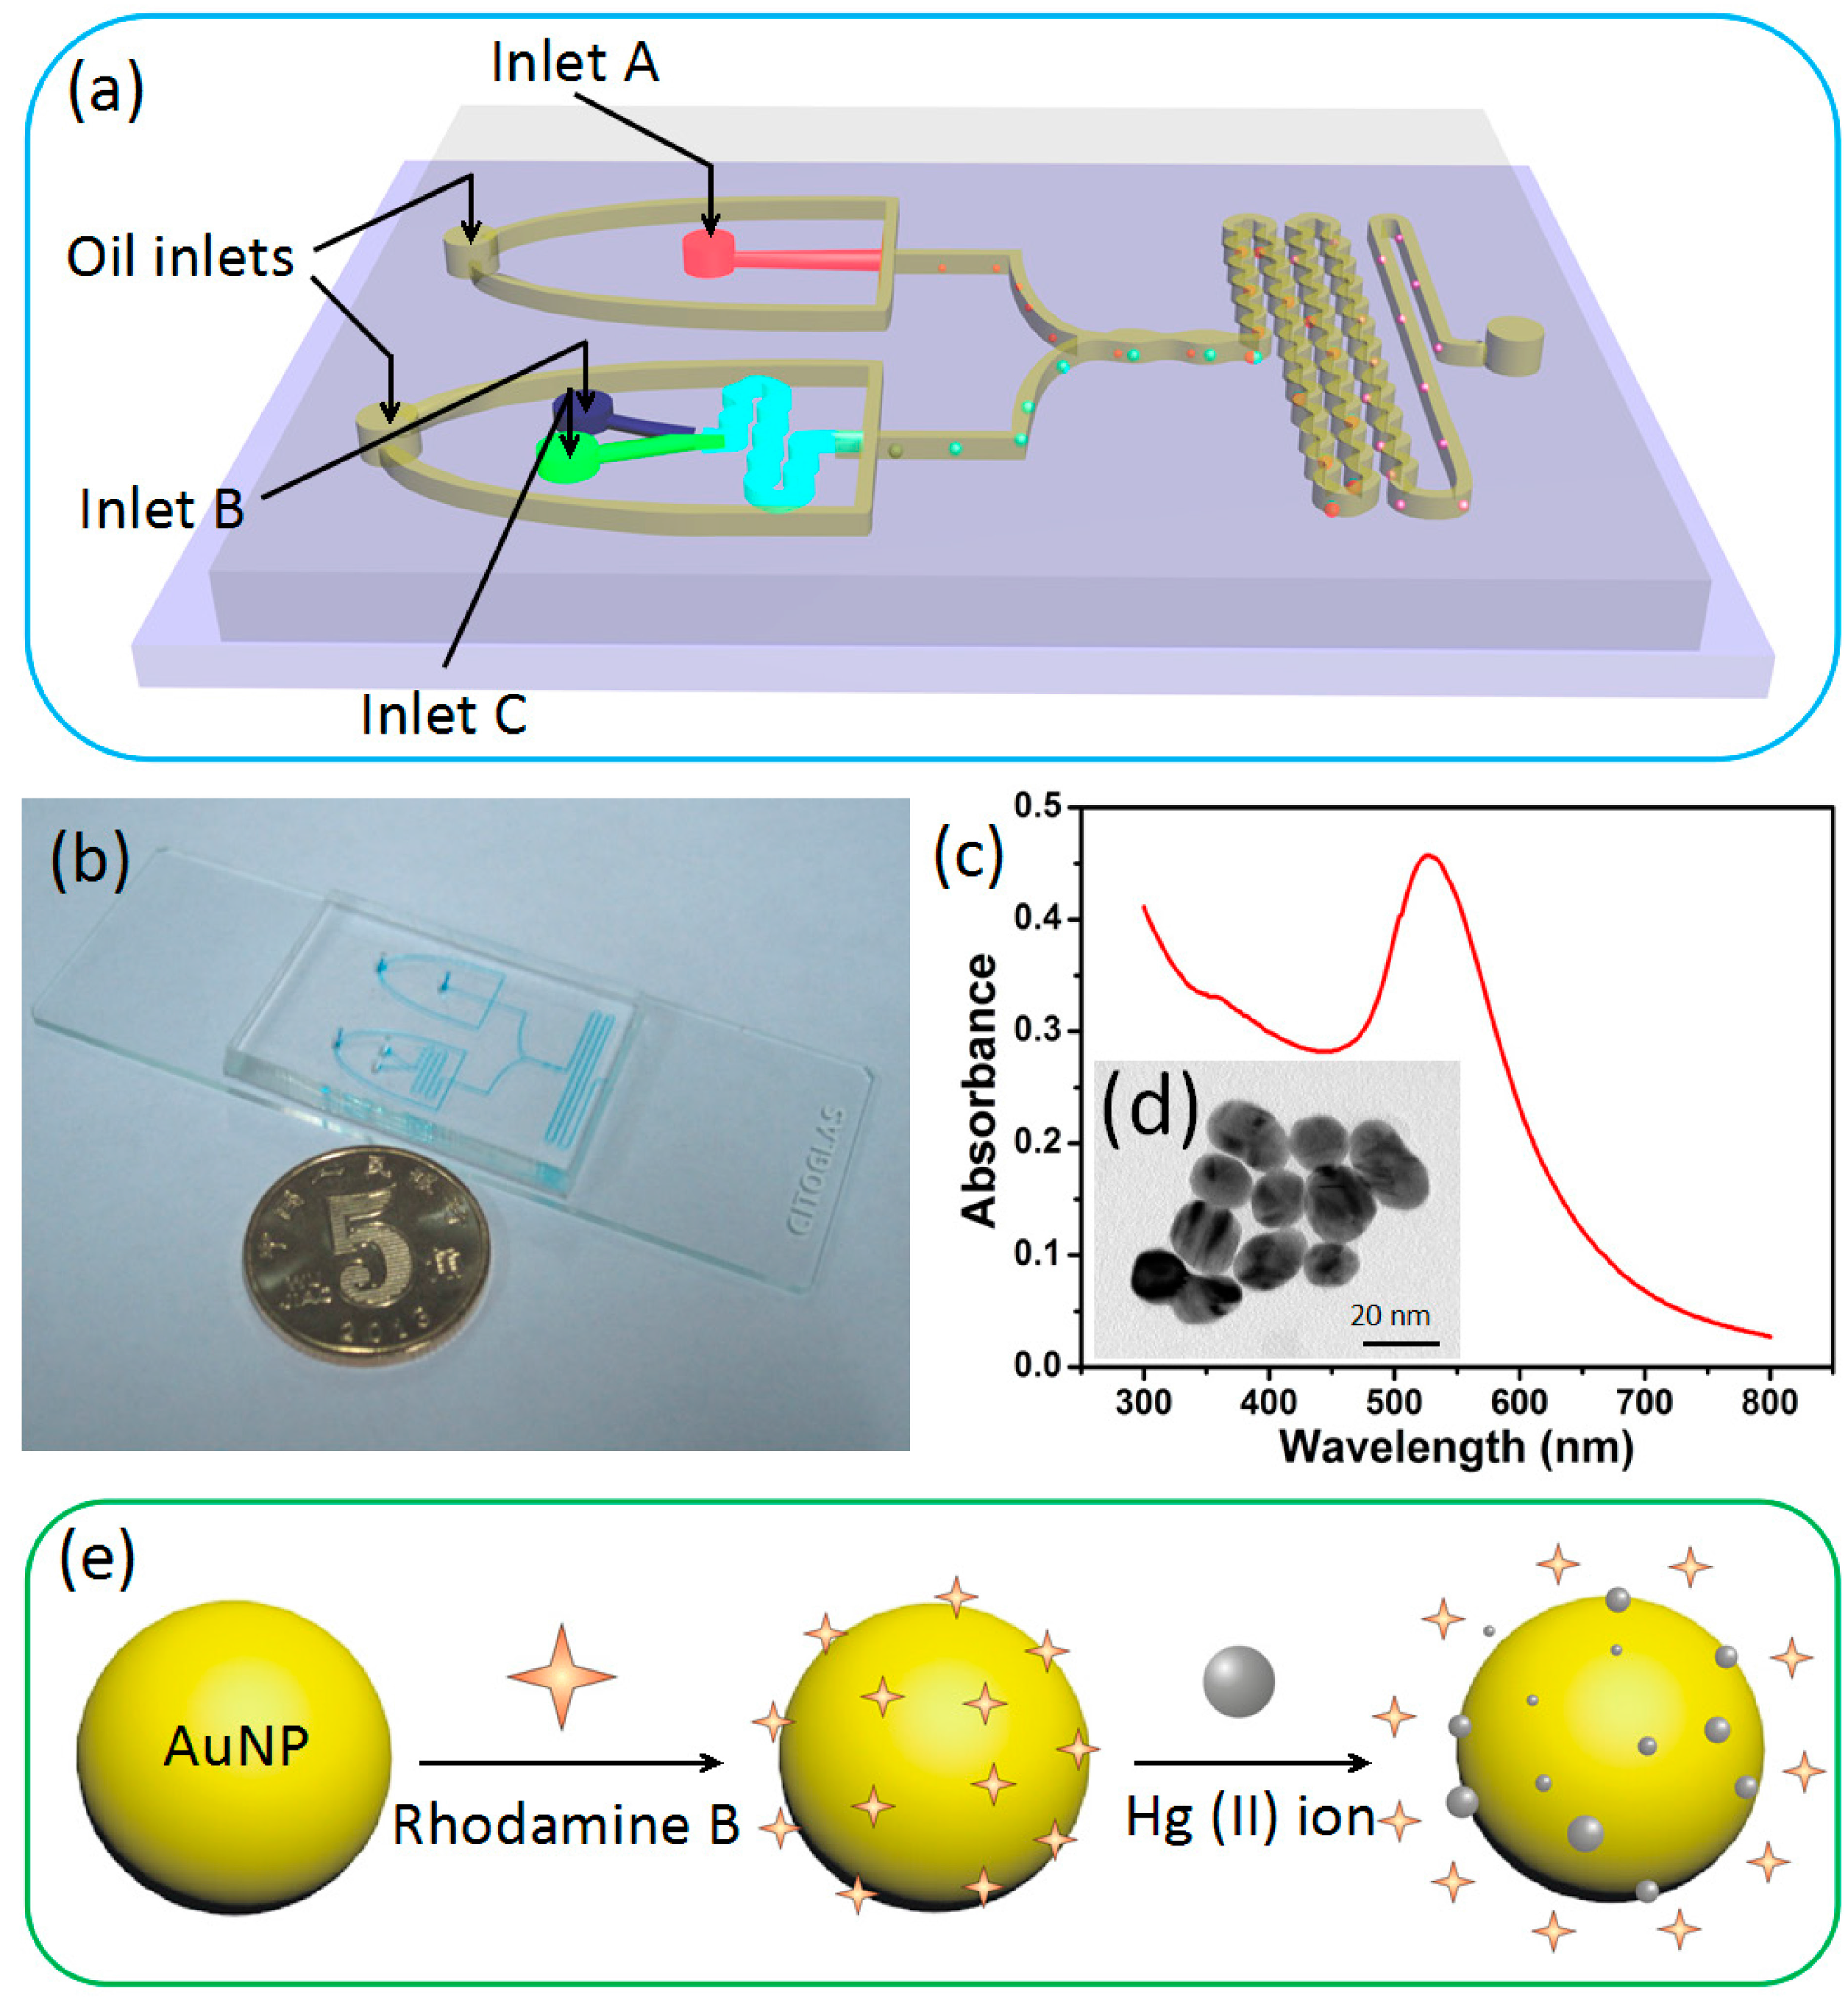
2.1. Microfluidic Device Design and Fabrication

As shown in Figure 1a, this microfluidic droplet mixer is mainly made of three parts: two flow-focusing droplet generators and a droplet mixer. One of the droplet generation parts contains an oil inlet, two reagent inlets, an S-shape reagent mixing channel and a flow-focusing orifice. For the other droplet generator, there is a reagent inlet, an oil inlet and a flow-focusing orifice. The width of oil and reagent inlet channels is at first 200 μm and 150 μm, respectively, and then all taper to 150 μm at the flow-focusing orifice. The downstream droplet mixer is mainly made of a 200-μm-wide channel with two 480-μm-wide elliptical fusing chambers, following the S-shape droplet mixing channel.
The microfluidic device (Figure 1b) was fabricated according to the standard soft lithography [23,24]. First, the mold was fabricated on a silicon wafer with SU-82050 photoresist (Microchem, San Jose, CA, USA). Then, a poly (dimethylsiloxane) (PDMS, Component A-B ratio of 10:1, GE Toshiba Silicone, Charleston, SC, USA) layer could be casted from the mold and pinhole-punched and irreversibly bonded to a glass slide through oxygen plasma (Harrick Scientific, New York, NY, USA) treatment. Finally, the microfluidic chip was baked at 120 °C for 72 h to improve the hydrophobicity.

2.2. On-Chip Operation

To verify the controllability of aqueous solution concentration, blue food dye (Sinopharm Chemical, Shanghai, China) was used as a simulation model. The whole on-chip operation processes were observed and recorded by a digital charge coupled device (CCD, Olympus DP 72, Tokyo, Japan) mounted on an inverted fluorescence microscope (IX71, Olympus, Tokyo, Japan). The images were used for measuring the passing optical density or intensity by using Image-Pro Plus 6.0 software.
Blue food dye and deionized water (DI water, Direct-Q3, Millipore, Darmstadt, Germany) were injected into inlets B and C individually by two syringe pumps (TS2-60, Longer, Baoding, China) through polyethylene tubes. The two streams from B and C at first formed laminar flow in the Y-shape channel and then mixed in the following S-shape reagent mixing channel. The control of final concentration of the blue dye was carried out by changing the flow rates of blue dye and DI water. The oil phase was introduced into the chip through the two oil inlets, while DI water was injected into inlet A. Then the diluted blue dye was cut into droplets by shear forces from oil phase at the two flow-focusing junctions [25,26]. By precisely controlling the flow rates of continuous phase and dispersed phase, blue dye droplets were arrayed between the DI water droplets in downstream fusing channel. Due to the velocity gradient in the expanded fusing chambers, blue dye droplets and DI water droplets were merged and then well-mixed in the PDMS channels.

2.3. Hg(II) Ion Detection

2.3.1. Preparation of Gold Nanoparticles

Gold nanoparticles (AuNPs) were synthesized by using the traditional Frens method [27]. Ten milliliters of trisodium citrate (38.8 mM) was added rapidly to 100 mL boiling HAuCl4 solution (1 mM), stirred and heated for 15 min until the color of mixture turned from light yellow to dark red. After cooling down at room temperature with stirring continuously, the solution was diluted with 5 mM sodium tetraborate (pH = 9.0) to form a solution of 6 nM AuNPs. Then, 2 μL Rhodamine B (RB) solution (2 mM) was added to 10 mL AuNPs solution (6 nM) and stirred for 2 h. After mixing with 0.5 mL 2,6-pyridinedicarboxylic acid (PDCA, 20 mM) to improve the selectivity for Hg(II) ions, the resulted solution could be used as a detection probe of Hg(II) ions. All the above chemical reagents were purchased from Sinopharm Chemical Reagent (Shanghai, China). Before the on-chip operations, the obtained AuNPs were characterized by transmission electron microscopy (TEM, JEM-2010 ES500W, JEOL, Tokyo, Japan) and UV-Vis spectrophotometer (Cary 5000, Varian, Palo Alto, CA, USA). AuNPs were about 20 nm in diameter (Figure 1c) and their spectrum absorption peak was near 540 nm (Figure 1d).

2.3.2. Principle of Hg(II) Ion Detection

Figure 1e illustrated the principle of detection probe RB-AuNPs to detect Hg(II) ions. When RB molecules are added into AuNPs, they would be adsorbed onto the surface of AuNPs via electrostatic interaction. The large quantum efficiency of RB is drastically diminished via resonant energy transfer (RET), thus causing fluorescence of RB strongly quenched by AuNPs. After Hg(II) ions are added into RB-AuNPs, RB molecules and Hg(II) ions are adsorbed onto the surface of AuNPs competitively, so that RB molecules are displaced by Hg(II) ions and generate a fluorescence enhancement [27].
Figure 1. (a) Three-dimensional model of the microfluidic droplet mixer; (b) Photograph of the microfluidic device; (c) UV-Vis absorption spectrum and (d) TEM image of the produced gold nanoparticles (AuNPs); (e) The mechanism of RB-AuNPs-based Hg(II) ion detection.
Micromachines 06 00915 g001

3. Results and Discussion

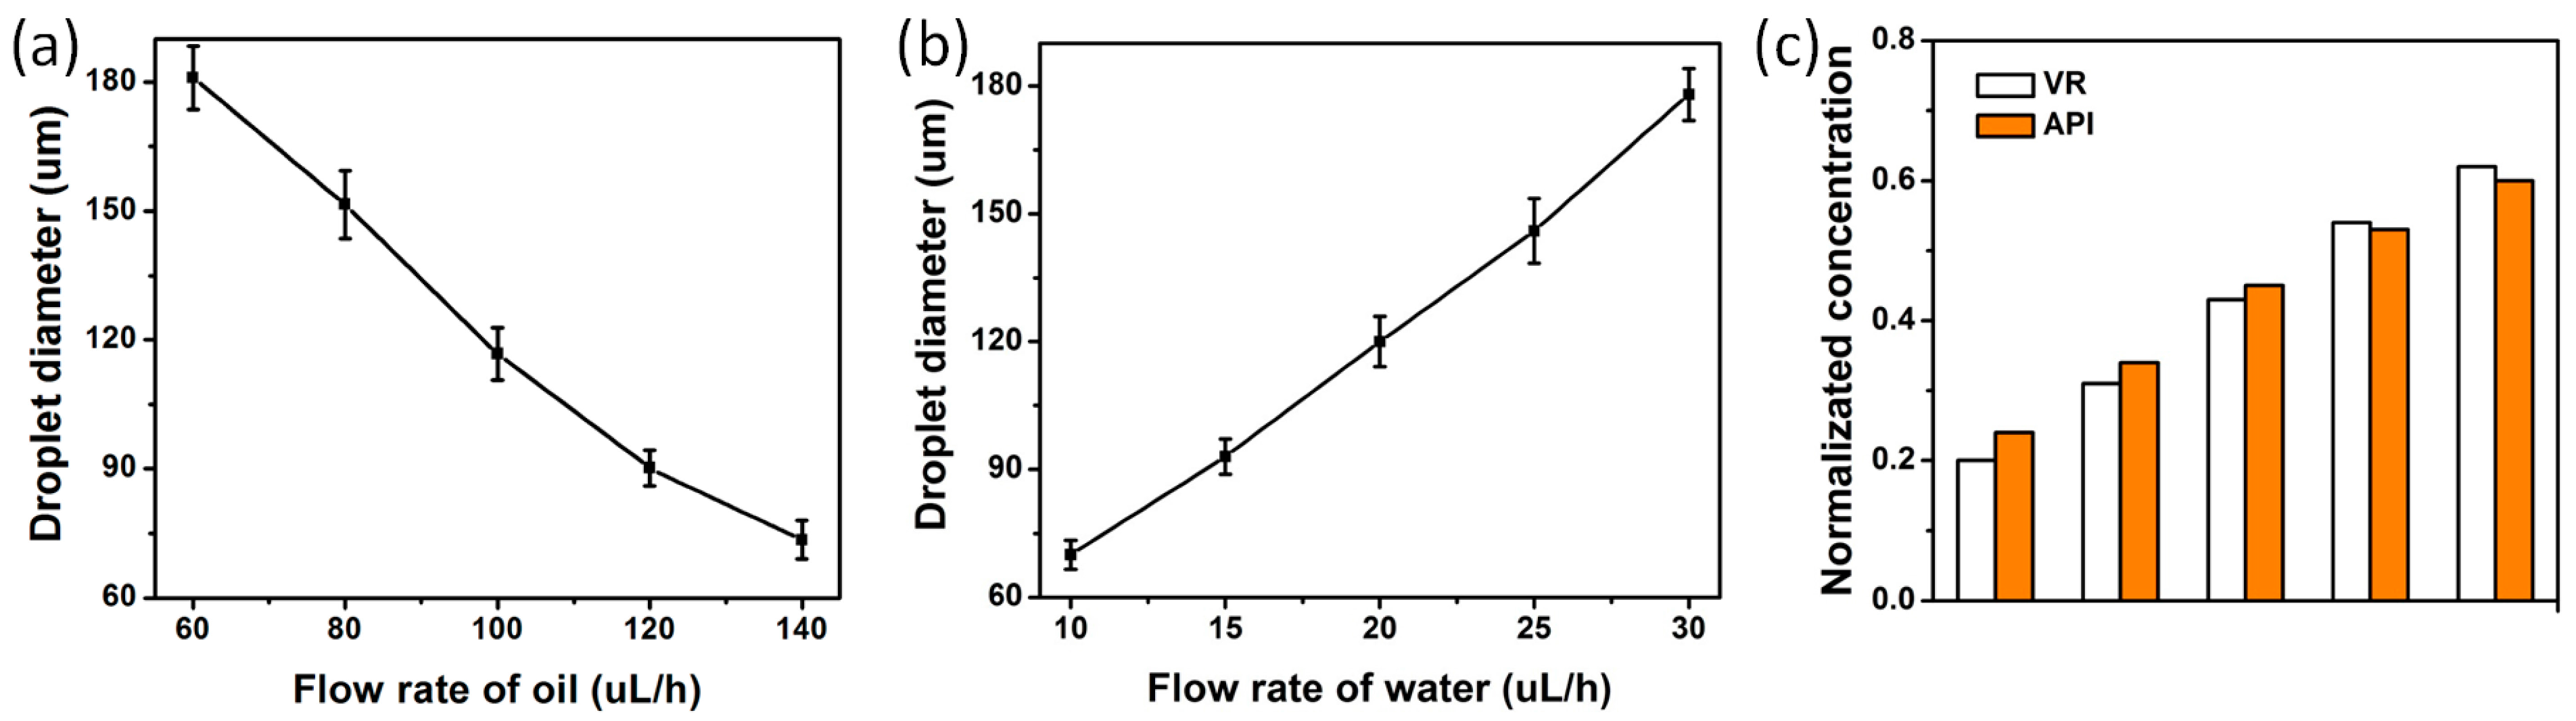
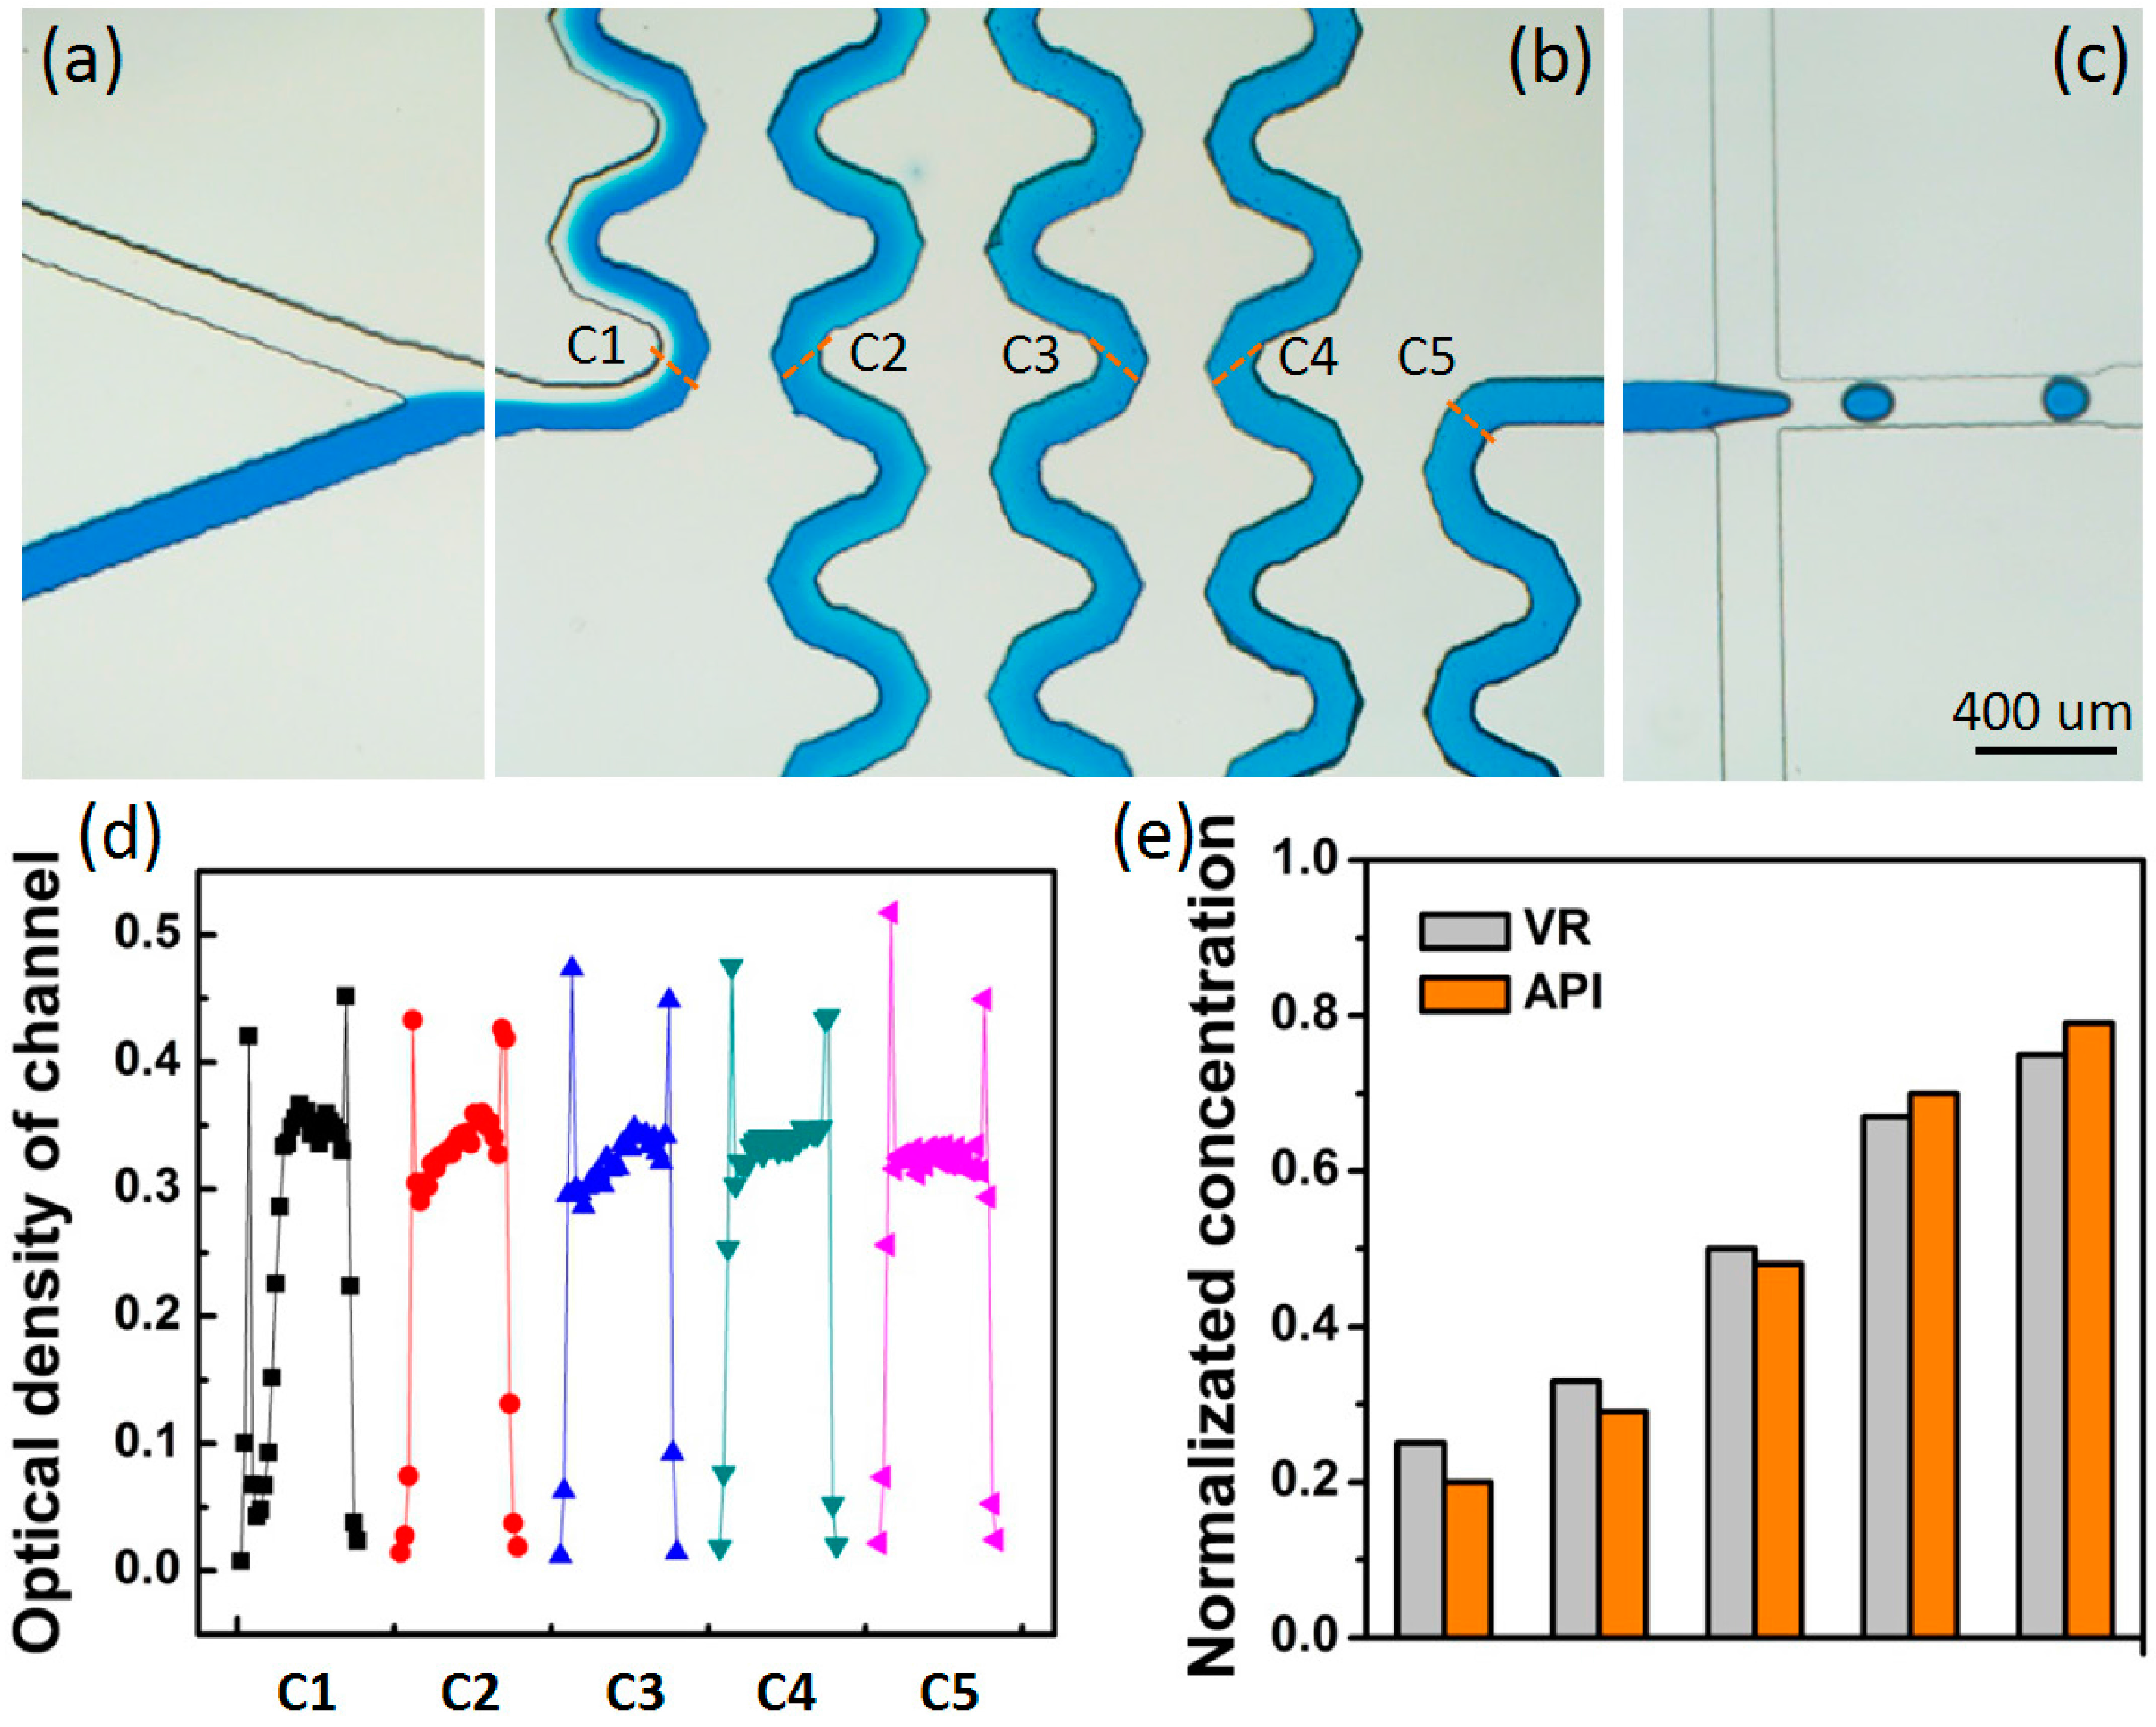
3.1. Concentration Control of Aqueous Solution

As shown in Figure 2a,b, continuous food dye flow and water flow were merged in the Y-shape channel and mixed in the S-shape channel. Subsequently, the oil phase sheared the concentration-adjusted food dye phase to droplets (Figure 2c). To test the mixing efficiency of two phases in the reagent mixing channel, five detection points (C1–C5) in the S-shape mixing channel were chosen for detecting whether two reagents were completely mixed (Figure 2b). The corresponding optical density was measured by subtracting the background optical density from the reagent optical density. It can be seen in Figure 2d, at point C1, the distribution of optical density was very uneven. From C1 to C5, it got more and more smooth and steady. Finally, the results of optical density along the line perpendicular to channel were almost the same as C5, which meant the two reagents were completely mixed through the mixing channel.
The theoretical calculations were carried out as follows. The final concentration of well-mixed dye flow could be expressed as:
η = V o f V o f + V b f
where Vo-f and Vb-f is the volume of original dye and water phase. Thus:
η = V o f / t V o f / t + V b f / t = U o f U o f + U b f
where Uo-f and Ub-f denotes flow rate of original dye and water phase, respectively. According to Equation (2), we could precisely adjust the final concentration of dye before droplet generation by changing the flow rates of original blue dye and DI water.
Figure 2. Food dye solution and DI water were (a) merged in the Y-shape channel; (b) well-mixed in the following S-shape channel; (c) Droplets were generated in the flow-focusing manner; (d) The optical density analysis of the merging solution from C1 to C5 in the mixing channel with the same mixing ratio and (e) The solutions with a combination of the concentration gradient of food dye were provided by the desired volumetric ratio (VR) weighed and tested by the absorption percentage of the light (API) method.
Micromachines 06 00915 g002
In our experiments, we achieved the concentration of the mixed flow through an optic analysis of the acquired images. At first, the background signals were kept the same, and then the final concentration of dye flow could be detected by absorption percentage of light (API) at the end of reagent mixing channel, which could be given as:
η= ln ( I b f ) ln ( I m f ) ln ( I b f ) ln ( I o f )
where Ib-f, Io-f and Im-f is the optical intensity of background signal, original dye flow and detection region at the end of reagent mixing channel, respectively.
To confirm the final concentration of dye flow before droplet generation, different desired velocity ratios (VR) of original dye flow and water flow were provided and tested by the API. In theory, the API would be consistent with the VR. While two major reasons lead to the deviation between the fact API and VR (Figure 2e), one is that Equation (3) ignored the curving of light through the channel wall, the other is software measurement error of the optical intensity [28].

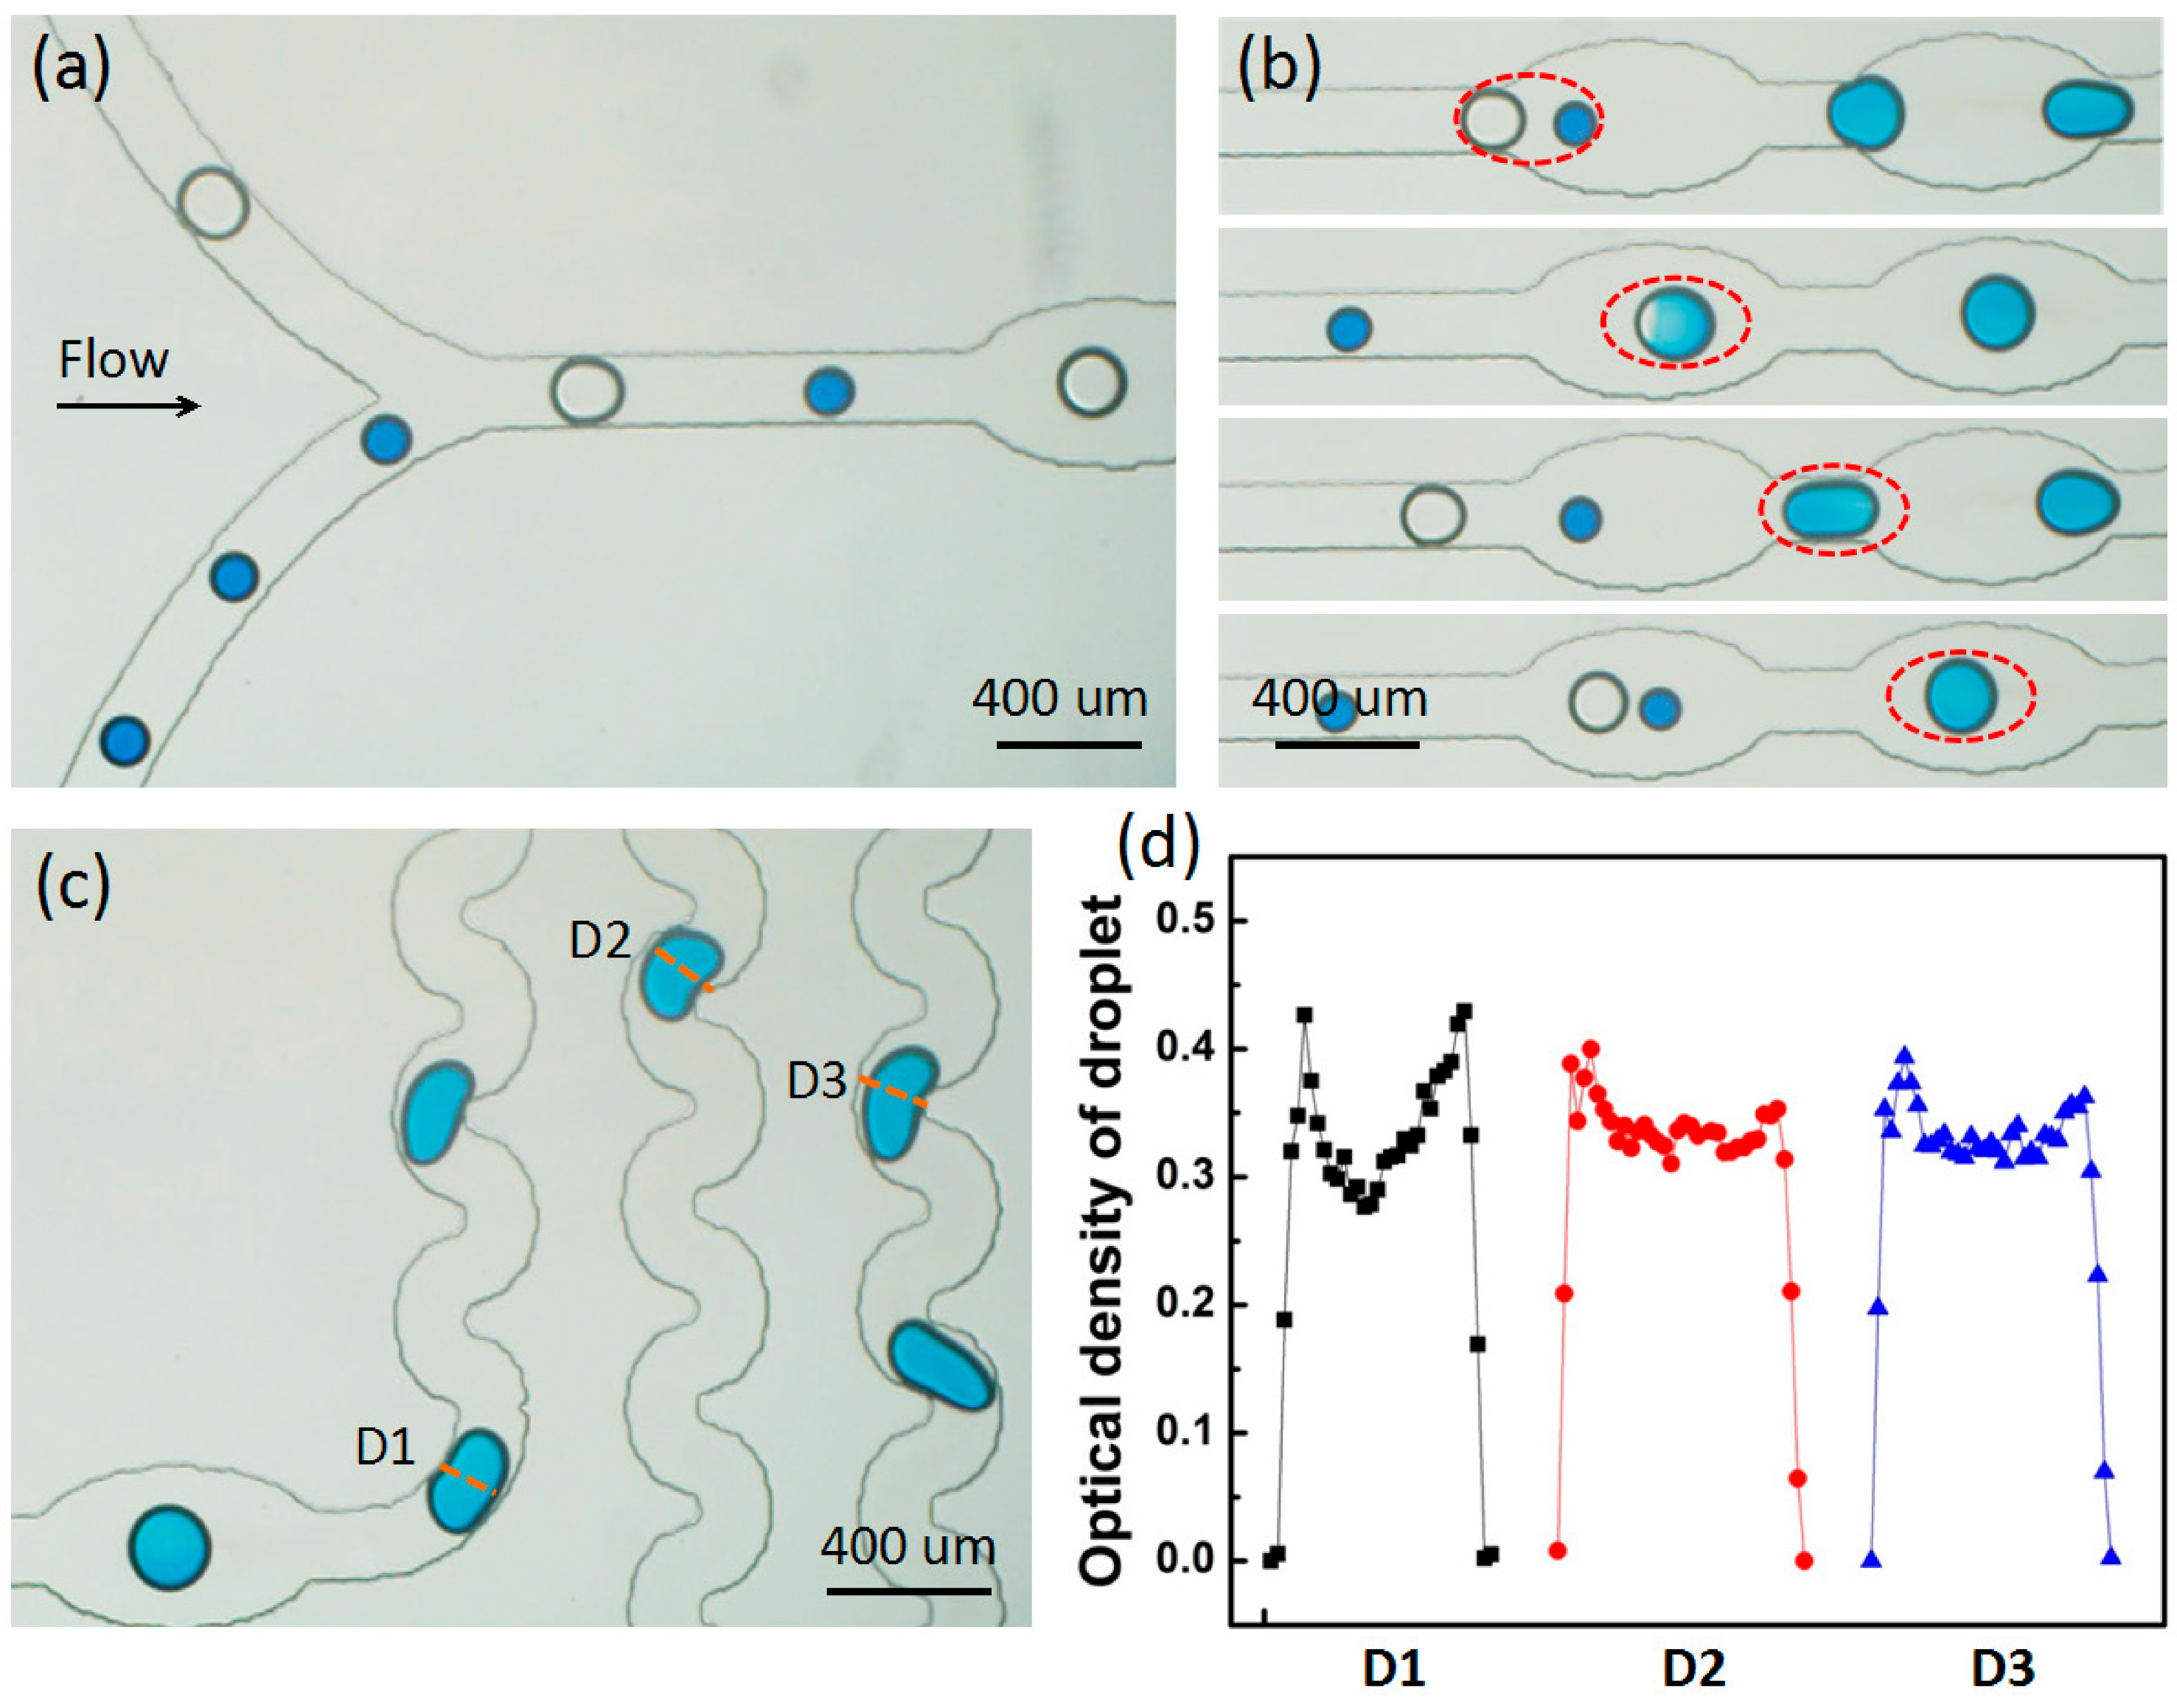
3.2. Droplet Generation and Fusion

Two kinds of droplets containing different components could be generated by the two individual flow-focusing channels. Dye droplets and water droplets were arrayed alternately along the channel before entering fusing chambers, which could prevent unwanted multiple droplets fusing (Figure 3a). Then droplets were merged in the fusing chambers caused by the fusion chambers expansion (Figure 3b). After that, fused droplets were directed to S-shape droplet mixing channel (Figure 3c). To verify the good efficiency of mixing two components inside droplets through mixing channel, three optical density detection points of droplets (D1–D3) were measured. As shown in Figure 3d, distribution of optical density in D1 was uneven, while in D3, it was almost even, which meant the two phases inside fused droplets were mixed completely after passing through the mixing channel.
It can be seen in Figure 4a,b that droplet volume could be precisely controlled by adjusting the flow rates. At the same time, the food dye concentration of merged droplet also changed with the droplet volume, which could be given as:
η= V o d V o d + V b d
where Vo-d is volume of original dye droplet, Vb-d is volume of water droplet.
In addition, the concentration of the mixed droplet could be detected directly by the API analysis:
η = ln ( I b d ) ln ( I m d ) ln ( I b d ) ln ( I o d )
where Ib-d, Im-d, Io-d are average optical intensity of background signal, the detection region of mixed droplet and original dye droplet, respectively.
To confirm the concentration of blue dye inside the mixed droplet, droplet teams with different VR were provided by adjusting the flow rates of oil and reagents. Then, they were examined by the API method, which were consistent with VR basically (Figure 4c) and the slight deviation is on account of the light curving over the boundary of droplets and software measurement error [25].
Figure 3. Droplets were (a) merged in the Y-shape channel and (b) collided in the inflated elliptical chambers and (c) mixed in the following S-shape channel and (d) The optical density analysis of the merging droplets from D1 to D3 in the mixing channel with the same mixing ratio.
Micromachines 06 00915 g003
Figure 4. Droplet mean diameters were controlled through (a) adjusting the flow rate of oil with the fixed flow rate of dispersed phase solution of 20 μL/h, or (b) adjusting the flow rate of dispersed phase solution with the fixed flow rate of oil of 100 μL/h. (c) A droplet team with a combination of the concentration gradient of food dye was provided by the desired volumetric ratio (VR) weighed and tested by the absorption percentage of the light (API) method.
Micromachines 06 00915 g004

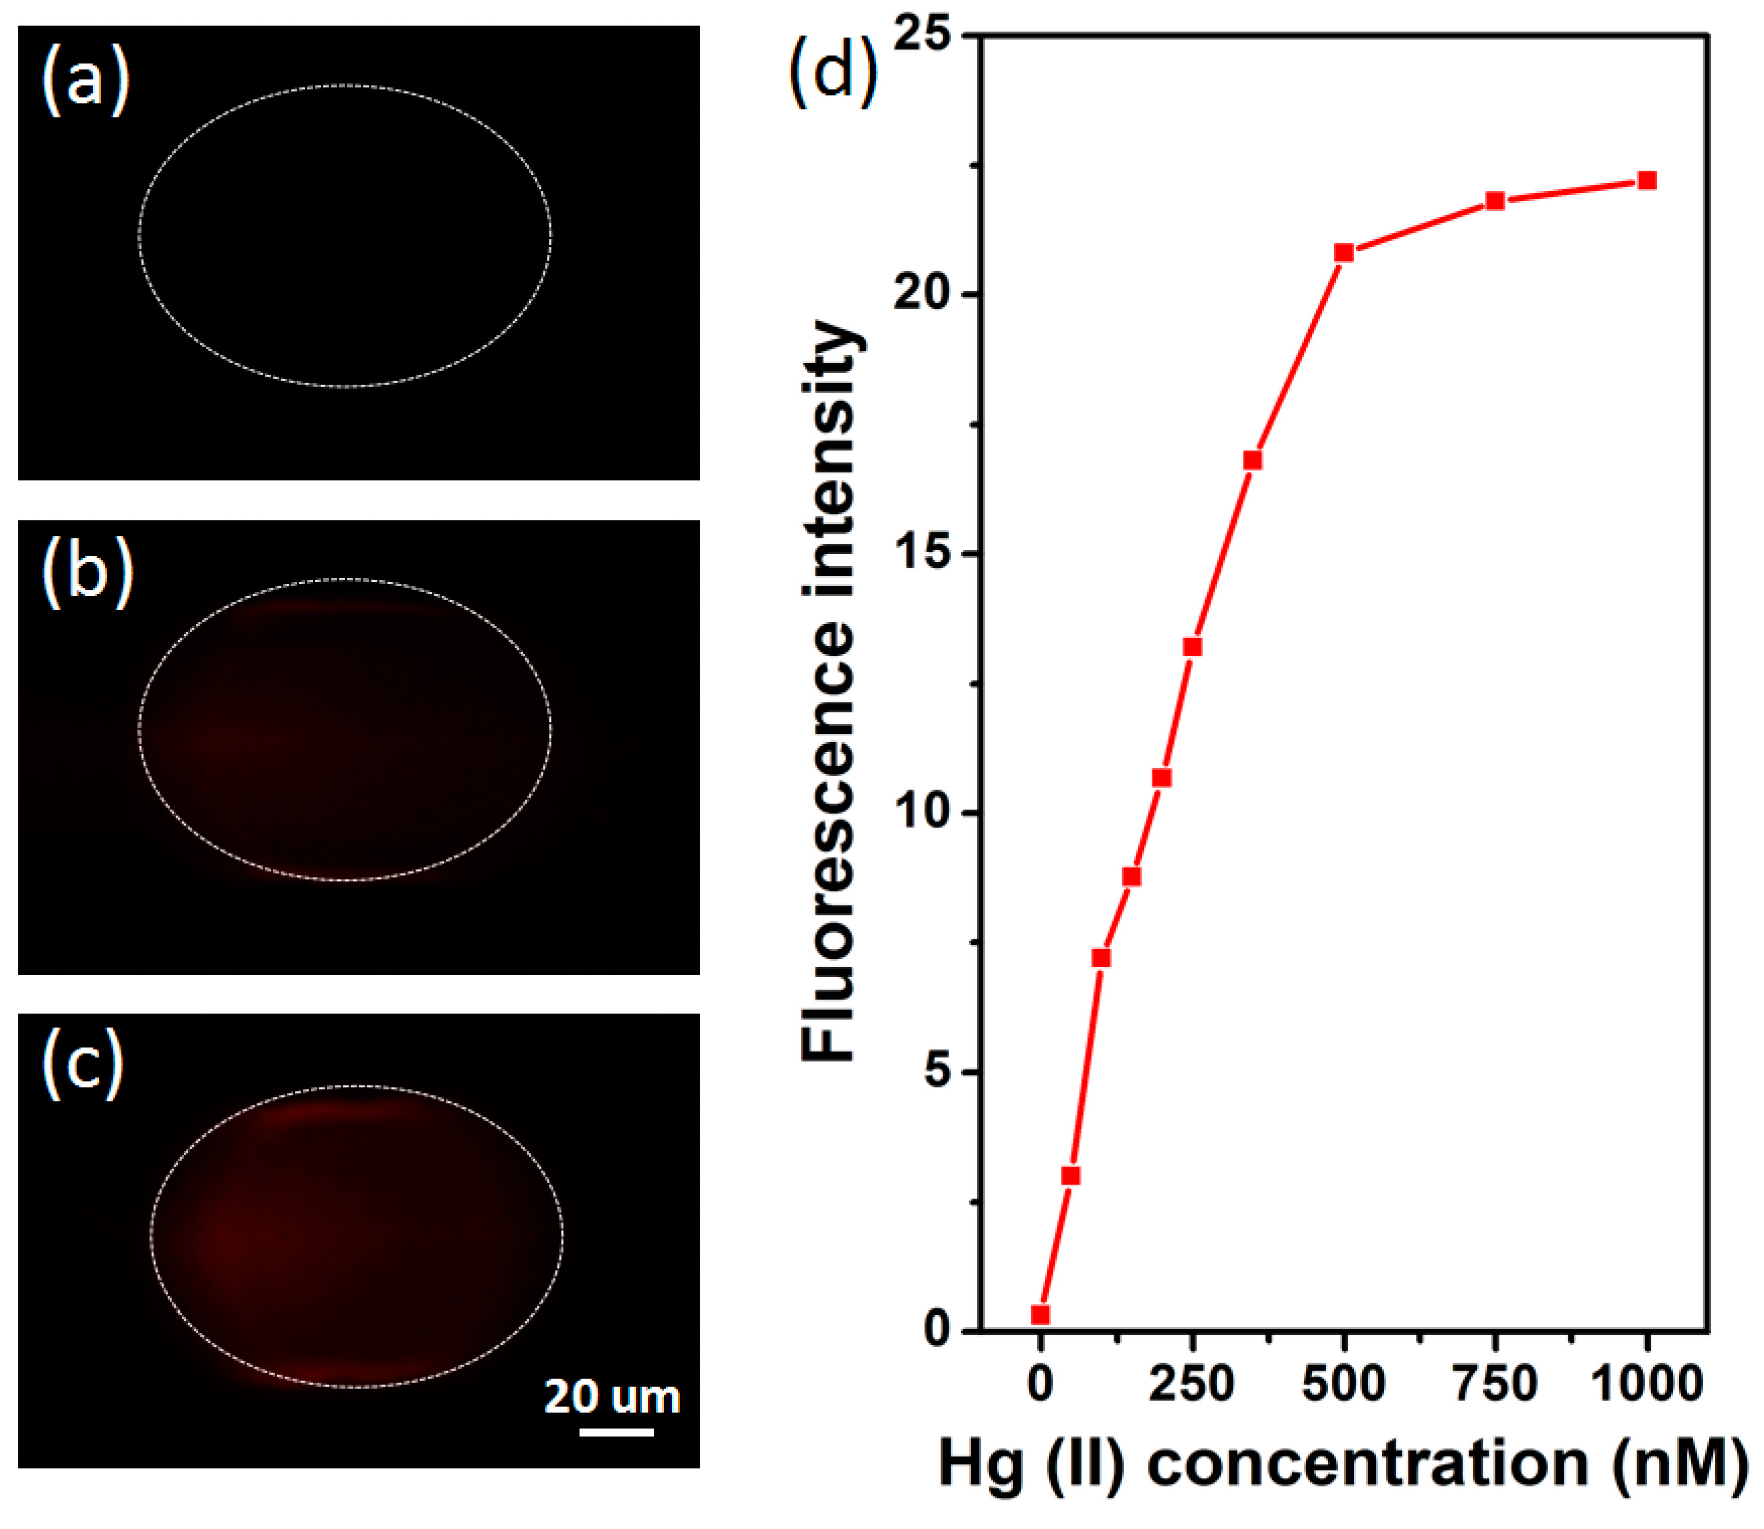
3.3. Hg(II) Ion Detection

After verifying the experimental feasibility of the droplet generation and fusion, we used this microfluidic device to detect Hg(II) ions. At first, 0.5% bovine serum albumin (BSA, Sigma-Aldrich, St. Louis, MO, USA) solution was introduced into the channels for 30 min to suppress reagent adsorption. Then, mineral oil, the detection probe, 1000 nM HgCl2 and DI water were introduced into the two oil inlets, inlet A, B and inlet C, at the flow rates of 140 μL/h, 20 μL/h, 5 μL/h and 15 μL/h, respectively. After HgCl2 and DI water streams mixed well in the S-shape channel, the concentration of Hg(II) in HgCl2 droplet was 250 nM. Probe droplets and HgCl2 droplets were merged in the expanded merging chambers and well-mixed in the S-shape droplet mixing channel. Fluorescence of merging droplets was detected in the detecting channel. Figure 5a illustrated the fluorescence image of the probe droplets, in which very weak fluorescence was observed, which indicated the fluorescence of RB had been strongly quenched by AuNPs. When the Hg(II) ion droplet and probe droplet were mixed, as shown in Figure 5b, a much stronger fluorescence was observed (with the same exposure time). The reason is as follows: fluorescence emission of RB-AuNPs is sensitive to Hg(II) ions, once the probe droplet in which the fluorescence of RB has been quenched by AuNPs and the 250 nM Hg(II) ion droplets are mixed with each other, there is a clear enhancement of the fluorescence in the mixed droplet region. The concentration of Hg(II) ion in HgCl2 droplet could be controlled by changing the flow rates of HgCl2 from inlet B and DI water from inlet C. Fixing the flow rates of the detection probe and oil phase, we adjusted the flow rates of DI water and HgCl2 to get HgCl2 droplets with the same size but different concentration of Hg(II) ions. Then, the flow rate of HgCl2 was increased to 20 μL/h, while the flow rate of DI water was decreased to 0. Thus, the DI water phase would not dilute the HgCl2, and the final concentration of Hg(II) ions in droplets was almost 1000 nM. It could be seen in Figure 5c that once the probe droplet and the 1000 nM Hg(II) ion droplet were mixed, a higher increase of the fluorescence brightness in the mixed droplet region could be observed comparing to the probe droplet exposed to the 250 nM Hg(II) ion droplets. Furthermore, the Hg(II) ion concentration in droplets was precisely adjusted from 0 to 1000 nM by changing the corresponding flow rates. The luminescent probe droplets were observed by a fluorescence microscopy and captured by a high speed CCD. Subsequently, the fluorescence intensity of the mixed droplets was quantitatively measured by analyzing the captured images using Image-Pro Plus software. As shown in Figure 5d, the intensity of the emission fluorescence was sensitive to Hg(II) ions and increased as the concentration of Hg(II) ions increased from 0 to 500 nM. Once the concentration was greater than 500 nM, the sensitive degree was reduced greatly. Hence, by determining the emission fluorescence intensity, the unknown Hg(II) ion concentration could be precisely calculated in a certain range of 0–500 nM. The droplet-based on-chip operations solved the challenges posed by other methods, such as large testing regent consumption, rough concentration control and unachievable in situ monitoring.
Figure 5. Representative fluorescence images of (a) probe (Rhodamine B mixed with AuNPs) droplet, probe droplet with (b) 250 nM and (c) 1000 nM Hg(II) ions; (d) Fluorescence intensity of probe droplet with different Hg(II) ion concentration.
Micromachines 06 00915 g005

4. Conclusions

The newly designed microfluidic device provided a methodology for the droplet-based chemical synthesis. Two individual flow-focusing channels played important roles in preventing the undesirable reaction before droplets fusion, which also allowed easy adjustment of the reagent concentration. The subsequent experiments demonstrated that, by adjusting the corresponding flow rates, suitable-concentration and -size droplets could be generated, merged and well-mixed in the PDMS channels. After optimizing the relative experimental conditions, the fluorescence enhancement of droplets was successfully used to detect Hg(II) ions in sample droplets by mixing with probe droplets (RB-AuNPs). The unknown Hg(II) ion concentration could be precisely detected by determining the emission fluorescence intensity. Our microfluidic droplet mixer could have a great potential for rapid chemical synthesis or micro-scale sample assays.

Acknowledgements

This work is supported by National Natural Science Foundation of China (Grant No. 81272443 and Grant No.51272184), the State Key Program of National Natural Science of China (Grant No. 51132001) and National Science Fund for Talent Training in Basic Science (Grant No. J1210061). The authors would like to thank Jia-Hong Wang’s and Yue Jia’s kind help in the characterization of gold nanoparticles.

Author Contributions

Wei Liu, Shi-Shang Guo and Xing-Zhong Zhao conceived and designed the experiments; Qian-Fang Meng and Lang Rao performed the experiments; Qian-Fang Meng, Lang Rao, Bo Cai and Su-Jian You analyzed the data; Qian-Fang Meng, Lang Rao and Bo Cai wrote the paper.

Conflicts of Interest

The authors declare no conflict of interest.

References

  1. Morel, F.; Kraepiel, A.; Amyot, M. The chemical cycle and bioaccumulation of mercury. Annu. Rev. Ecol. Syst. 1998, 29, 543–566. [Google Scholar] [CrossRef]
  2. Clarkson, T.W.; Magos, L.; Myers, G.J. The toxicology of mercury-current exposures and clinical manifestations. New Engl. J. Med. 2003, 349, 1731–1737. [Google Scholar] [CrossRef] [PubMed]
  3. Kopysc, E.; Pyrzynska, K.; Garbos, S.; Bulska, E. Determination of Mercury by cold-vapor atomic absorption spectrometry with preconcentration on a gold-trap. Anal. Sci. 2000, 16, 1309–1312. [Google Scholar] [CrossRef]
  4. Karunasagar, D.; Arunachalam, J.; Gangadharan, S. Development of a “collect and punch” cold vapour inductively coupled plasma mass spectrometric method for the direct determination of mercury at nanograms per litre levels. J. Anal. At. Spectrom. 1998, 13, 679–682. [Google Scholar] [CrossRef]
  5. Yu, L.-P.; Yan, X.-P. Flow injection on-line sorption preconcentration coupled with cold vapor atomic fluorescence spectrometry and on-line oxidative elution for the determination of trace mercury in water samples. At. Spectrosc. 2004, 25, 145–153. [Google Scholar]
  6. Yin, X.; Xu, Q.; Xu, X. Speciation analysis of mercury I. Separation and determination of methylmercury, ethylmercury, phenylmercury and mercury (II) by liquid chromatography after chloroform extraction. Chin. J. Anal. Chem. 1995, 10, 1168–1171. [Google Scholar]
  7. Shen, J.; Li, Y.; Gu, H.; Xia, F.; Zuo, X. Recent development of sandwich assay based on the nanobiotechnologies for proteins, nucleic acids, small molecules, and ions. Chem. Rev. 2014, 114, 7631–7677. [Google Scholar] [CrossRef] [PubMed]
  8. Chen, J.; Zheng, A.; Chen, A.; Gao, Y.; He, C.; Kai, X.; Wu, G.; Chen, Y. A functionalized gold nanoparticles and Rhodamine 6G based fluorescent sensor for high sensitive and selective detection of mercury (II) in environmental water samples. Anal. Chim. Acta 2007, 599, 134–142. [Google Scholar] [CrossRef] [PubMed]
  9. Guo, C.; Irudayaraj, J. Fluorescent Ag clusters via a protein-directed approach as a Hg(II) ion sensor. Anal. Chem. 2011, 83, 2883–2889. [Google Scholar] [CrossRef] [PubMed]
  10. Duan, J.; Jiang, X.; Ni, S.; Yang, M.; Zhan, J. Facile synthesis of N-acetyl-l-cysteine capped ZnS quantum dots as an eco-friendly fluorescence sensor for Hg2+. Talanta 2011, 85, 1738–1743. [Google Scholar] [CrossRef] [PubMed]
  11. Chen, K.; Lu, G.; Chang, J.; Mao, S.; Yu, K.; Cui, S.; Chen, J. Hg(II) ion detection using thermally reduced graphene oxide decorated with functionalized gold nanoparticles. Anal. Chem. 2012, 84, 4057–4062. [Google Scholar] [CrossRef] [PubMed]
  12. Huang, C.C.; Yang, Z.; Lee, K.H.; Chang, H.T. Synthesis of highly fluorescent gold nanoparticles for sensing mercury (II). Angew. Chem. 2007, 119, 6948–6952. [Google Scholar] [CrossRef]
  13. Ye, B.C.; Yin, B.C. Highly sensitive detection of mercury (II) ions by fluorescence polarization enhanced by gold nanoparticles. Angew. Chem. Int. Ed. 2008, 47, 8386–8389. [Google Scholar] [CrossRef] [PubMed]
  14. Rex, M.; Hernandez, F.E.; Campiglia, A.D. Pushing the limits of mercury sensors with gold nanorods. Ana. Chem. 2006, 78, 445–451. [Google Scholar] [CrossRef] [PubMed]
  15. Whitesides, G.M. The origins and the future of microfluidics. Nature 2006, 442, 368–373. [Google Scholar] [CrossRef] [PubMed]
  16. Demello, A.J. Control and detection of chemical reactions in microfluidic systems. Nature 2006, 442, 394–402. [Google Scholar] [CrossRef] [PubMed]
  17. Lafleur, J.P.; Senkbeil, S.; Jensen, T.G.; Kutter, J.P. Gold nanoparticle-based optical microfluidic sensors for analysis of environmental pollutants. Lab Chip 2012, 12, 4651–4656. [Google Scholar] [CrossRef] [PubMed]
  18. Sara Gómez-de, P.; Lopes, D.; Miltsov, S.; Izquierdo, D.; Alonso-Chamarro, J.; Puyol, M. Optical microfluidic system based on ionophore modified gold nanoparticles for the continuous monitoring of mercuric ion. Sens. Actuators B Chem. 2014, 194, 19–26. [Google Scholar]
  19. Brouzes, E.; Medkova, M.; Savenelli, N.; Marran, D.; Twardowski, M.; Hutchison, J.B.; Rothberg, J.M.; Link, D.R.; Perrimon, N.; Samuels, M.L. Droplet microfluidic technology for single-cell high-throughput screening. Proc. Nat. Acad. Sci. 2009, 106, 14195–14200. [Google Scholar] [CrossRef] [PubMed]
  20. Guo, F.; Ji, X.-H.; Liu, K.; He, R.-X.; Zhao, L.-B.; Guo, Z.-X.; Liu, W.; Guo, S.-S.; Zhao, X.-Z. Droplet electric separator microfluidic device for cell sorting. Appl. Phys. Lett. 2010, 96, 193701. [Google Scholar] [CrossRef]
  21. Rao, L.; Cai, B.; Wang, J.; Meng, Q.; Ma, C.; He, Z.; Xu, J.; Huang, Q.; Li, S.; Cen, Y.; et al. A microfluidic electrostatic separator based on pre-charged droplets. Sen. Actuators B Chem. 2015, 210, 328–335. [Google Scholar] [CrossRef]
  22. Hsu, K.-C.; Lee, C.-F.; Tseng, W.-C.; Chao, Y.-Y.; Huang, Y.-L. Selective and eco-friendly method for determination of mercury (II) ions in aqueous samples using an on-line AuNPs–PDMS composite microfluidic device/ICP-MS system. Talanta 2014, 128, 408–413. [Google Scholar] [CrossRef] [PubMed]
  23. Xia, Y.; Whitesides, G.M. Soft Lithography. Angew. Chem. Int. Ed. 1998, 37, 550–575. [Google Scholar] [CrossRef]
  24. Cai, B.; Guo, F.; Zhao, L.; He, R.; Chen, B.; He, Z.; Yu, X.; Guo, S.; Xiong, B.; Liu, W.; Zhao, X.-Z. Disk-like hydrogel bead-based immunofluorescence staining toward identification and observation of circulating tumor cells. Microfluid. Nanofluid. 2014, 16, 29–37. [Google Scholar] [CrossRef]
  25. Liu, K.; Ding, H.; Chen, Y.; Zhao, X.-Z. Droplet-based synthetic method using microflow focusing and droplet fusion. Microfluid. Nanofluid. 2007, 3, 239–243. [Google Scholar] [CrossRef]
  26. Rao, L.; Cai, B.; Yu, X.-L.; Guo, S.-S.; Liu, W.; Zhao, X.-Z. One-step fabrication of 3D silver paste electrodes into microfluidic devices for enhanced droplet-based cell sorting. AIP Adv. 2015, 5, 057134. [Google Scholar] [CrossRef]
  27. Huang, C.-C.; Chang, H.-T. Selective gold-nanoparticle-based “turn-on” fluorescent sensors for detection of mercury (II) in aqueous solution. Anal. Chem. 2006, 78, 8332–8338. [Google Scholar] [CrossRef] [PubMed]
  28. Guo, Z.-X.; Zeng, Q.; Zhang, M.; Hong, L.-Y.; Zhao, Y.-F.; Liu, W.; Guo, S.-S.; Zhao, X.-Z. Valve-based microfluidic droplet micromixer and mercury (II) ion detection. Sens. Actuators A Phy. 2011, 172, 546–551. [Google Scholar] [CrossRef]

