
Towards Improved Airborne Fire Detection Systems Using Beetle Inspired Infrared Detection and Fire Searching Strategies

Abstract
:1. Introduction
2. Photomechanic IR Receptors in Pyrophilous Melanophila Beetles
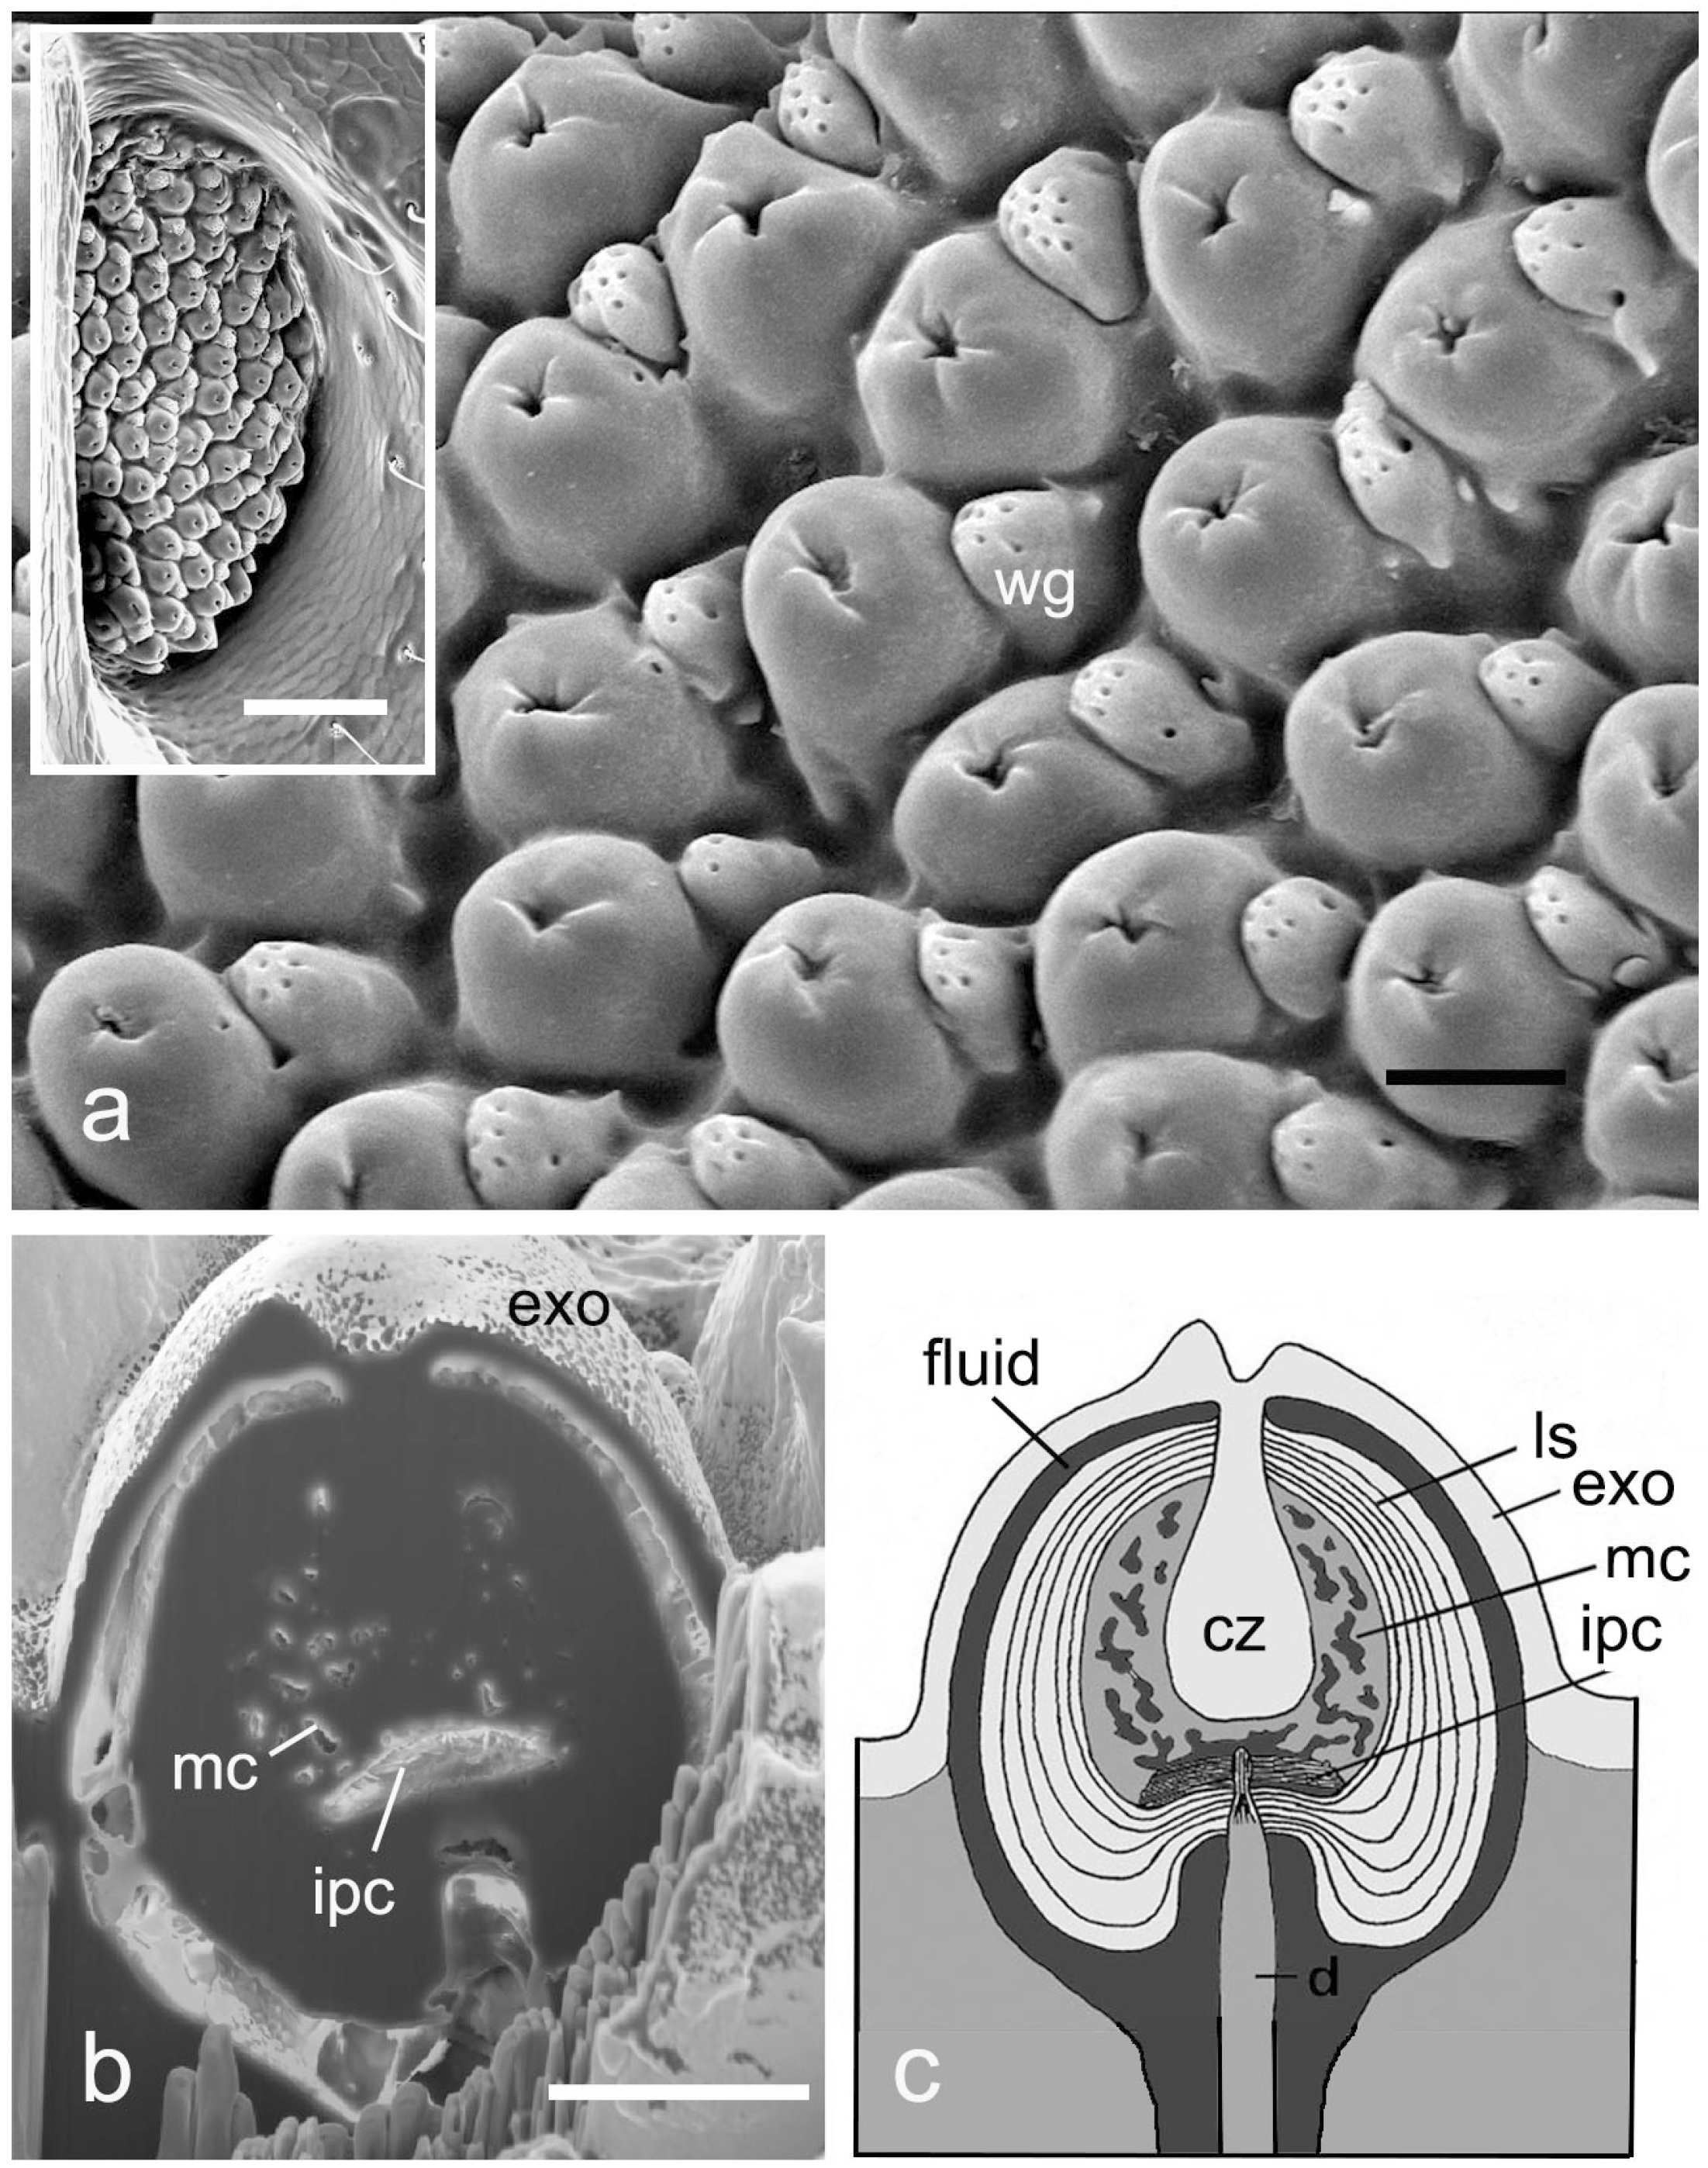
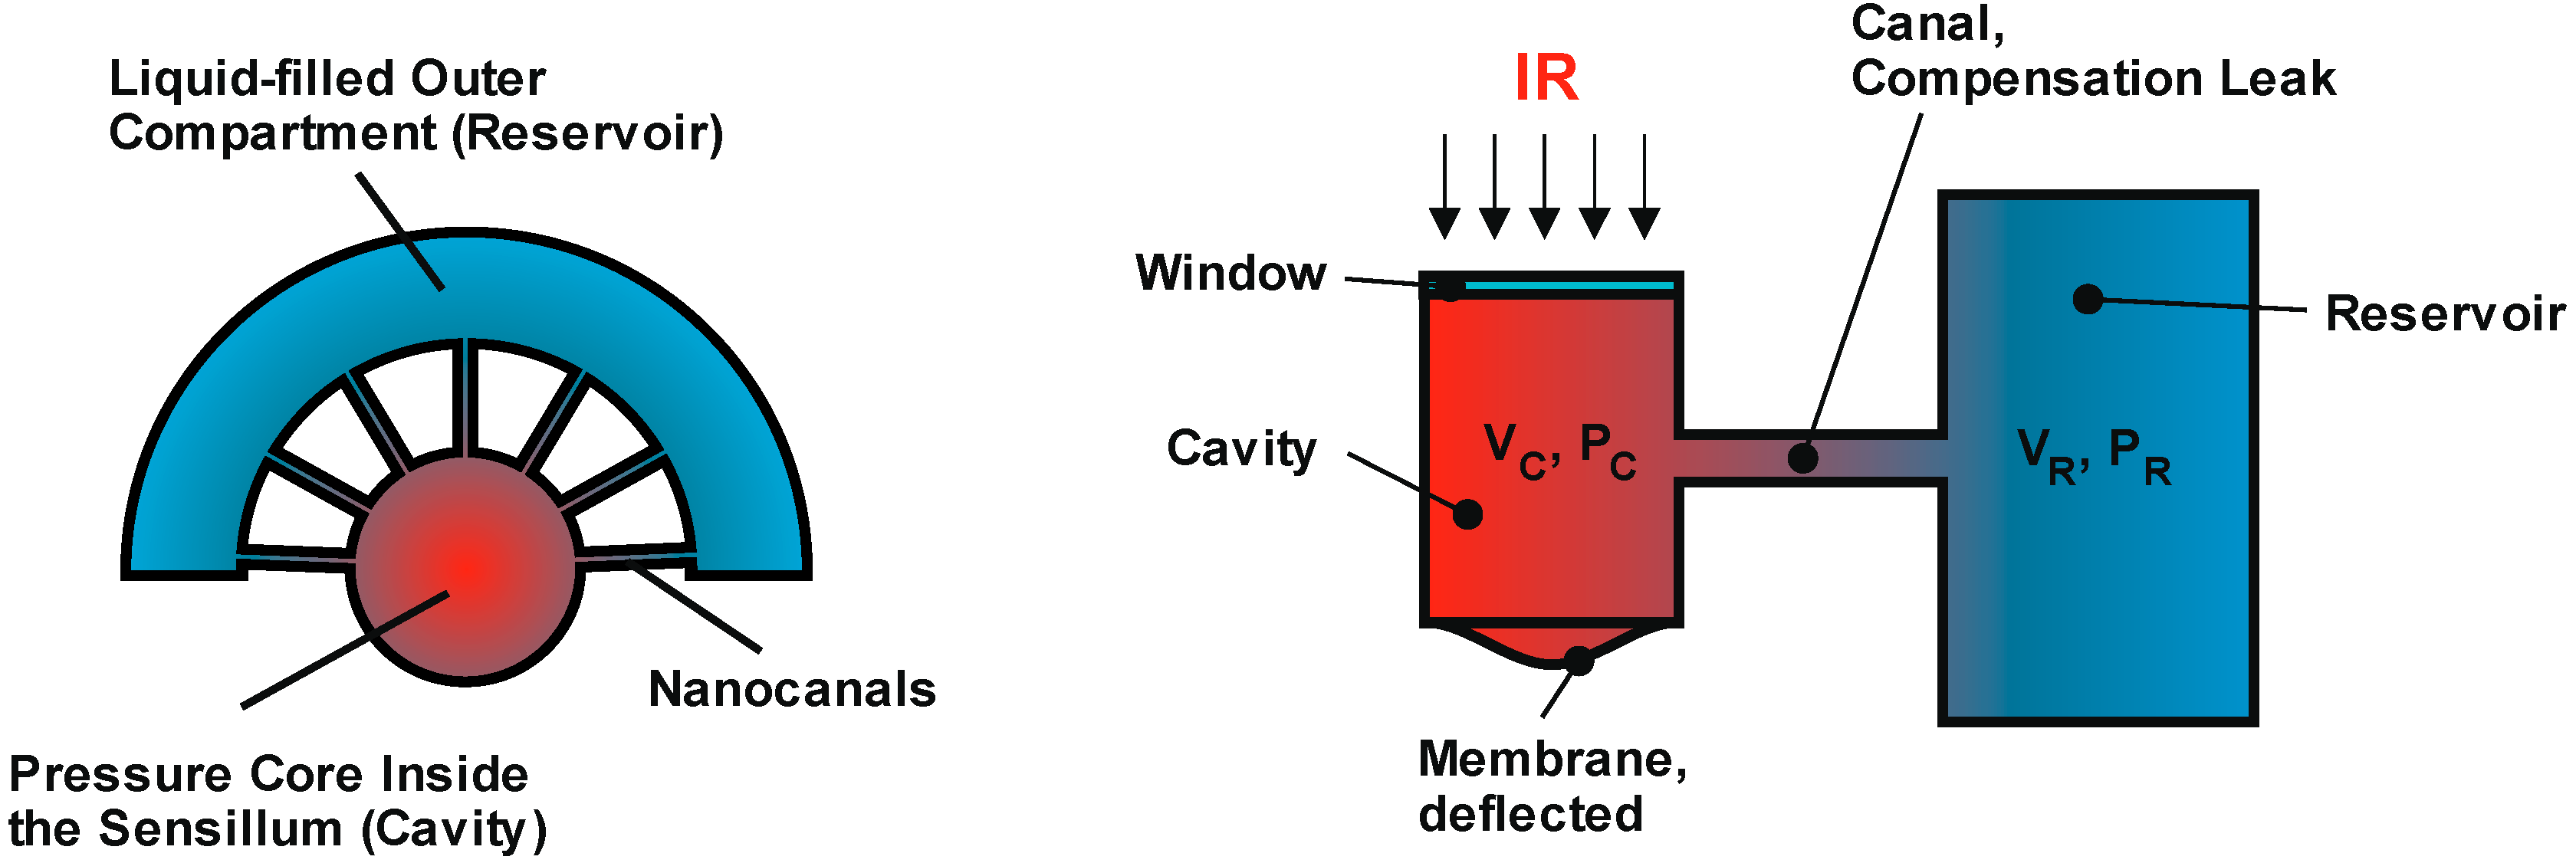
Structure and Function of Melanophila IR Receptors

| Parameter | “Little Ash Beetle” Acanthocnemus nigricans Only species in the genus | “Australian Fire Beetle” Merimna atrata Only species in the genus | “Black Fire Beetle” Melanophila spec. 11 species | “Pyrophilous Flat Bugs” Aradus spec. 4 IR sensitive species in the genus Aradus (200 species) |
|---|---|---|---|---|
| Systematic position | Beetle (family: Acanthocnemidae) | Jewel beetles (family: Buprestidae) | Flat bugs (family: Aradidae) | |
| Ventral habitus IR organs/receptors indicated in yellow Legs omitted L: body length |  | 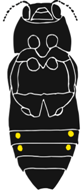 | 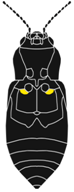 | 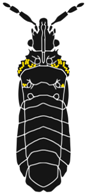 |
| L: 4 mm | L: 20 mm | L: 10 mm | L: 4 mm | |
| Position of IR receptor | prothorax | abdomen | metathorax | pro-/mesothorax |
| Picture of IR organ or single sensillum | 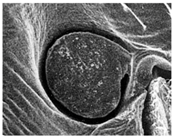 |  |  |  |
| Left IR organ (sensory disc with numerous tiny sensilla) | Left anterior IR organ (trough-shaped cuticular depression) | Single IR sensillum (about 70 dome-shaped sensilla in a sensory pit) | Single IR sensillum (dome-shaped sensilla interspersed between hair mechanoreceptors) | |
| Mode of operation | Bolometer (in Merimna with additional photomechanic unit) | Photomechanic receptors | ||

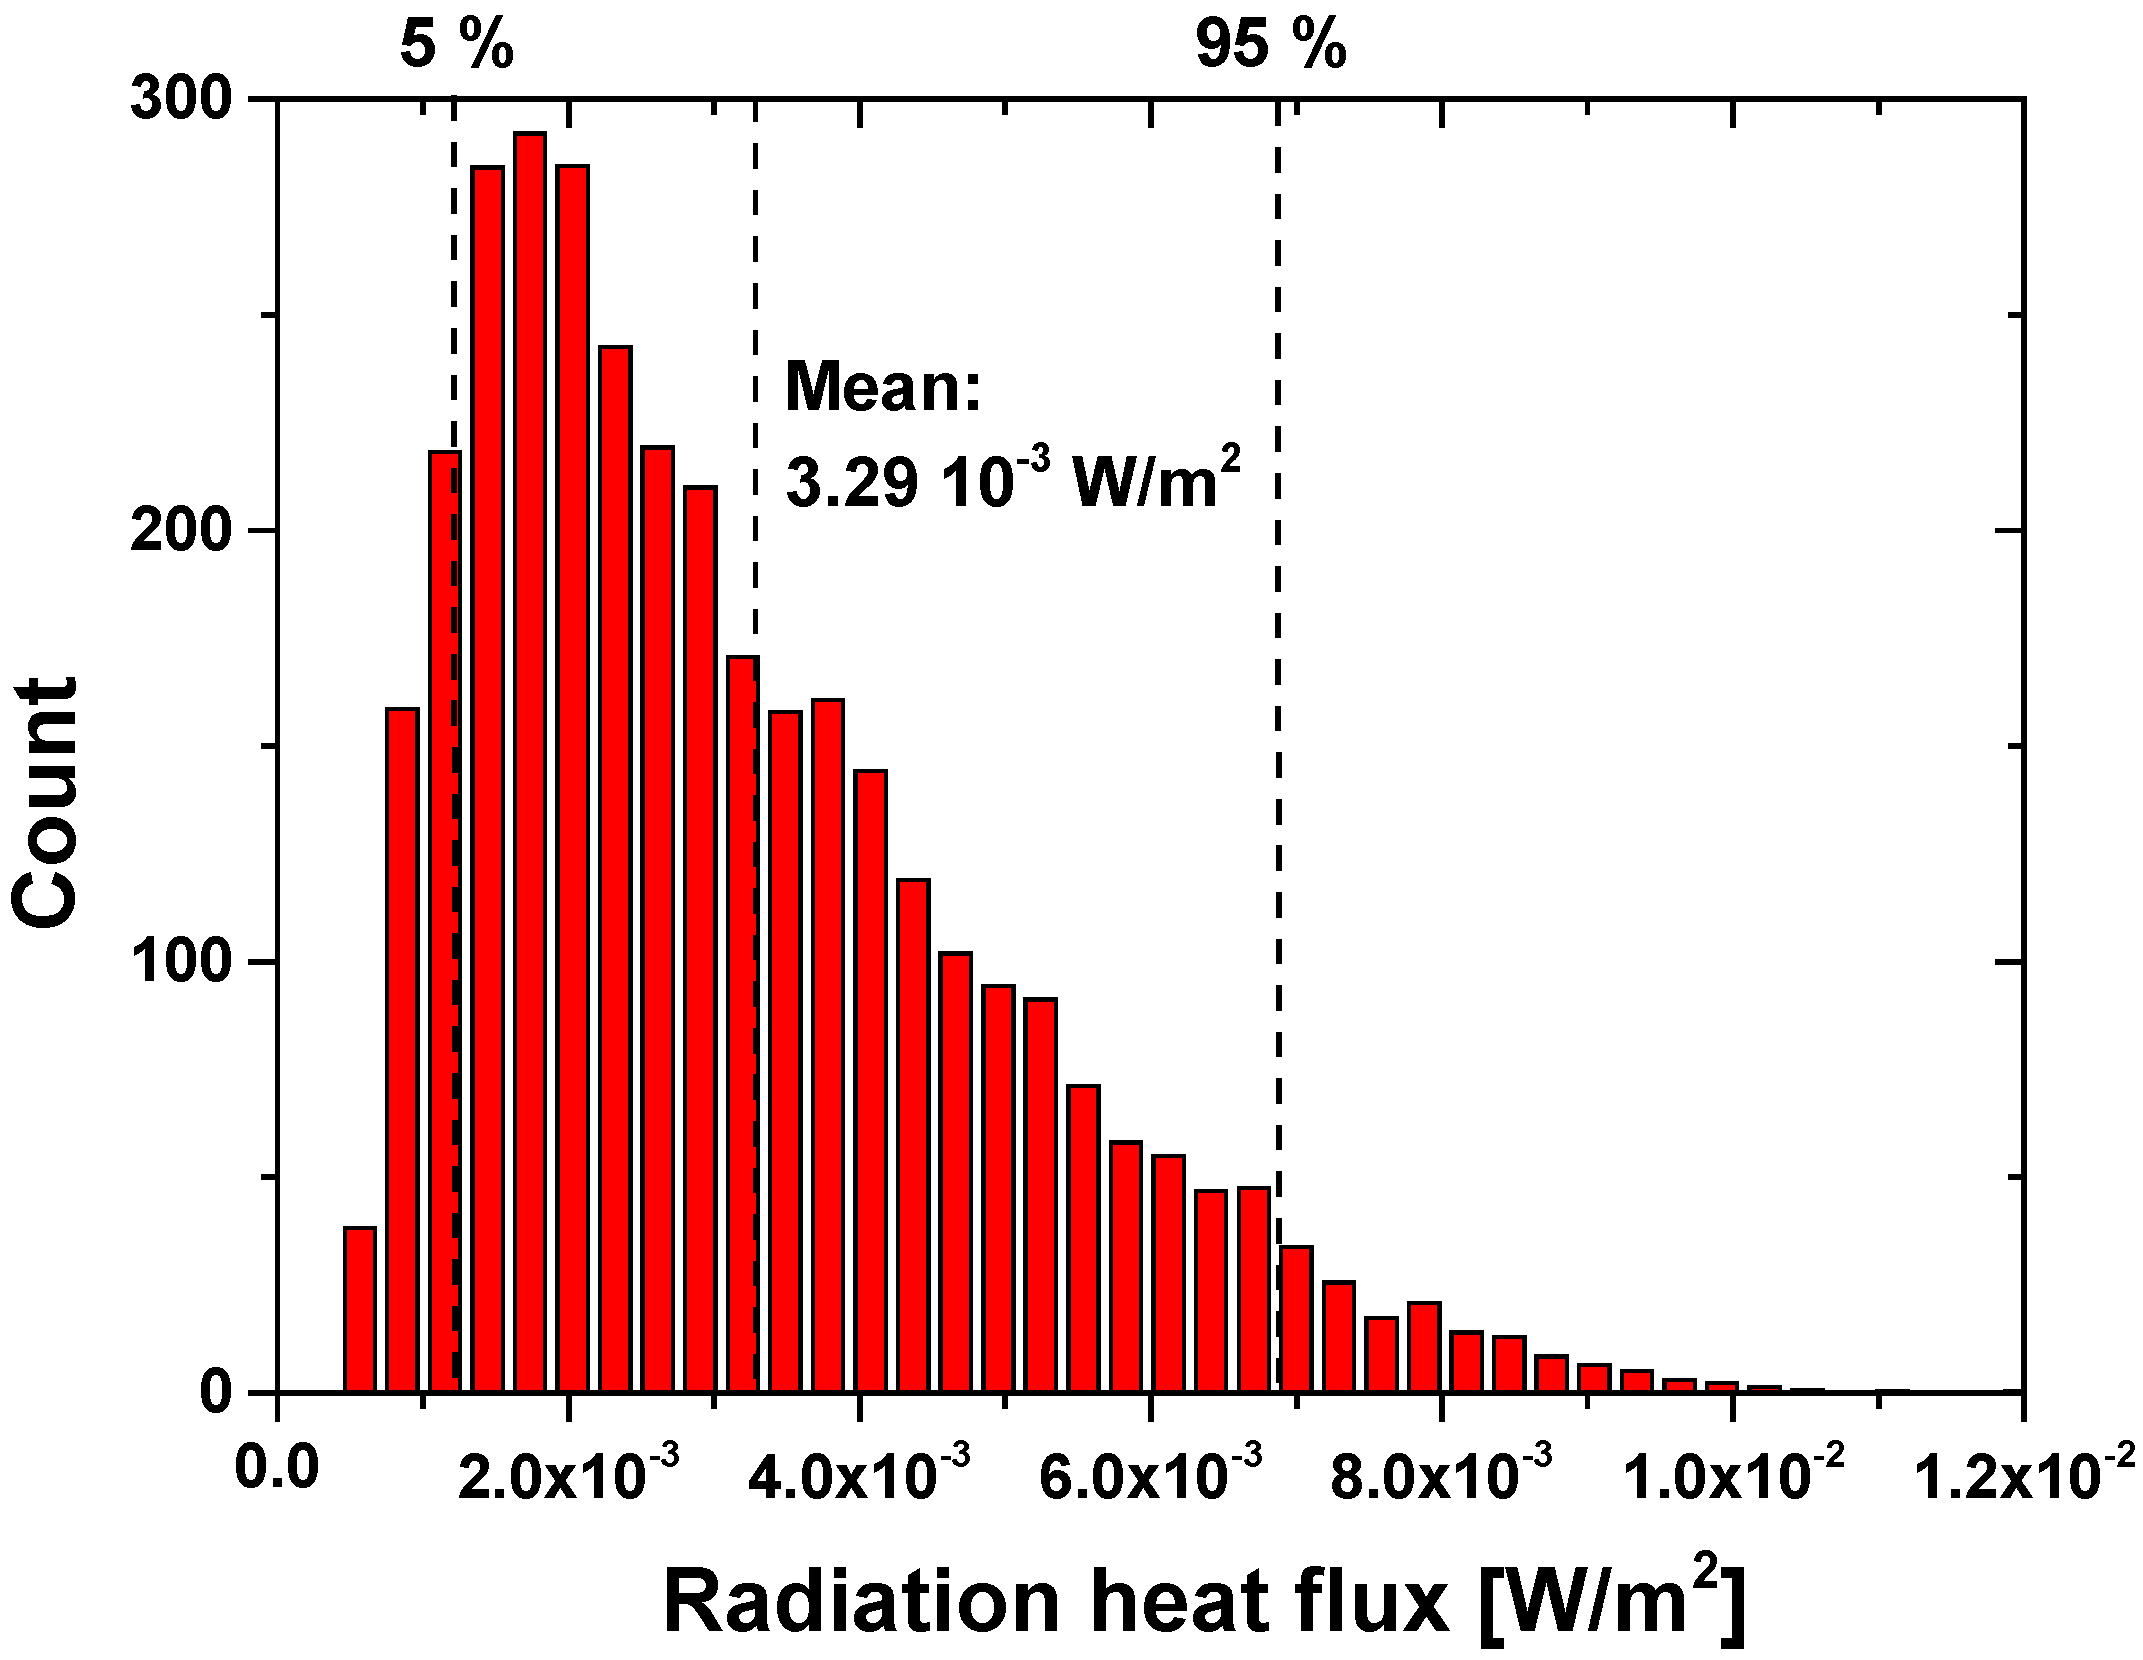
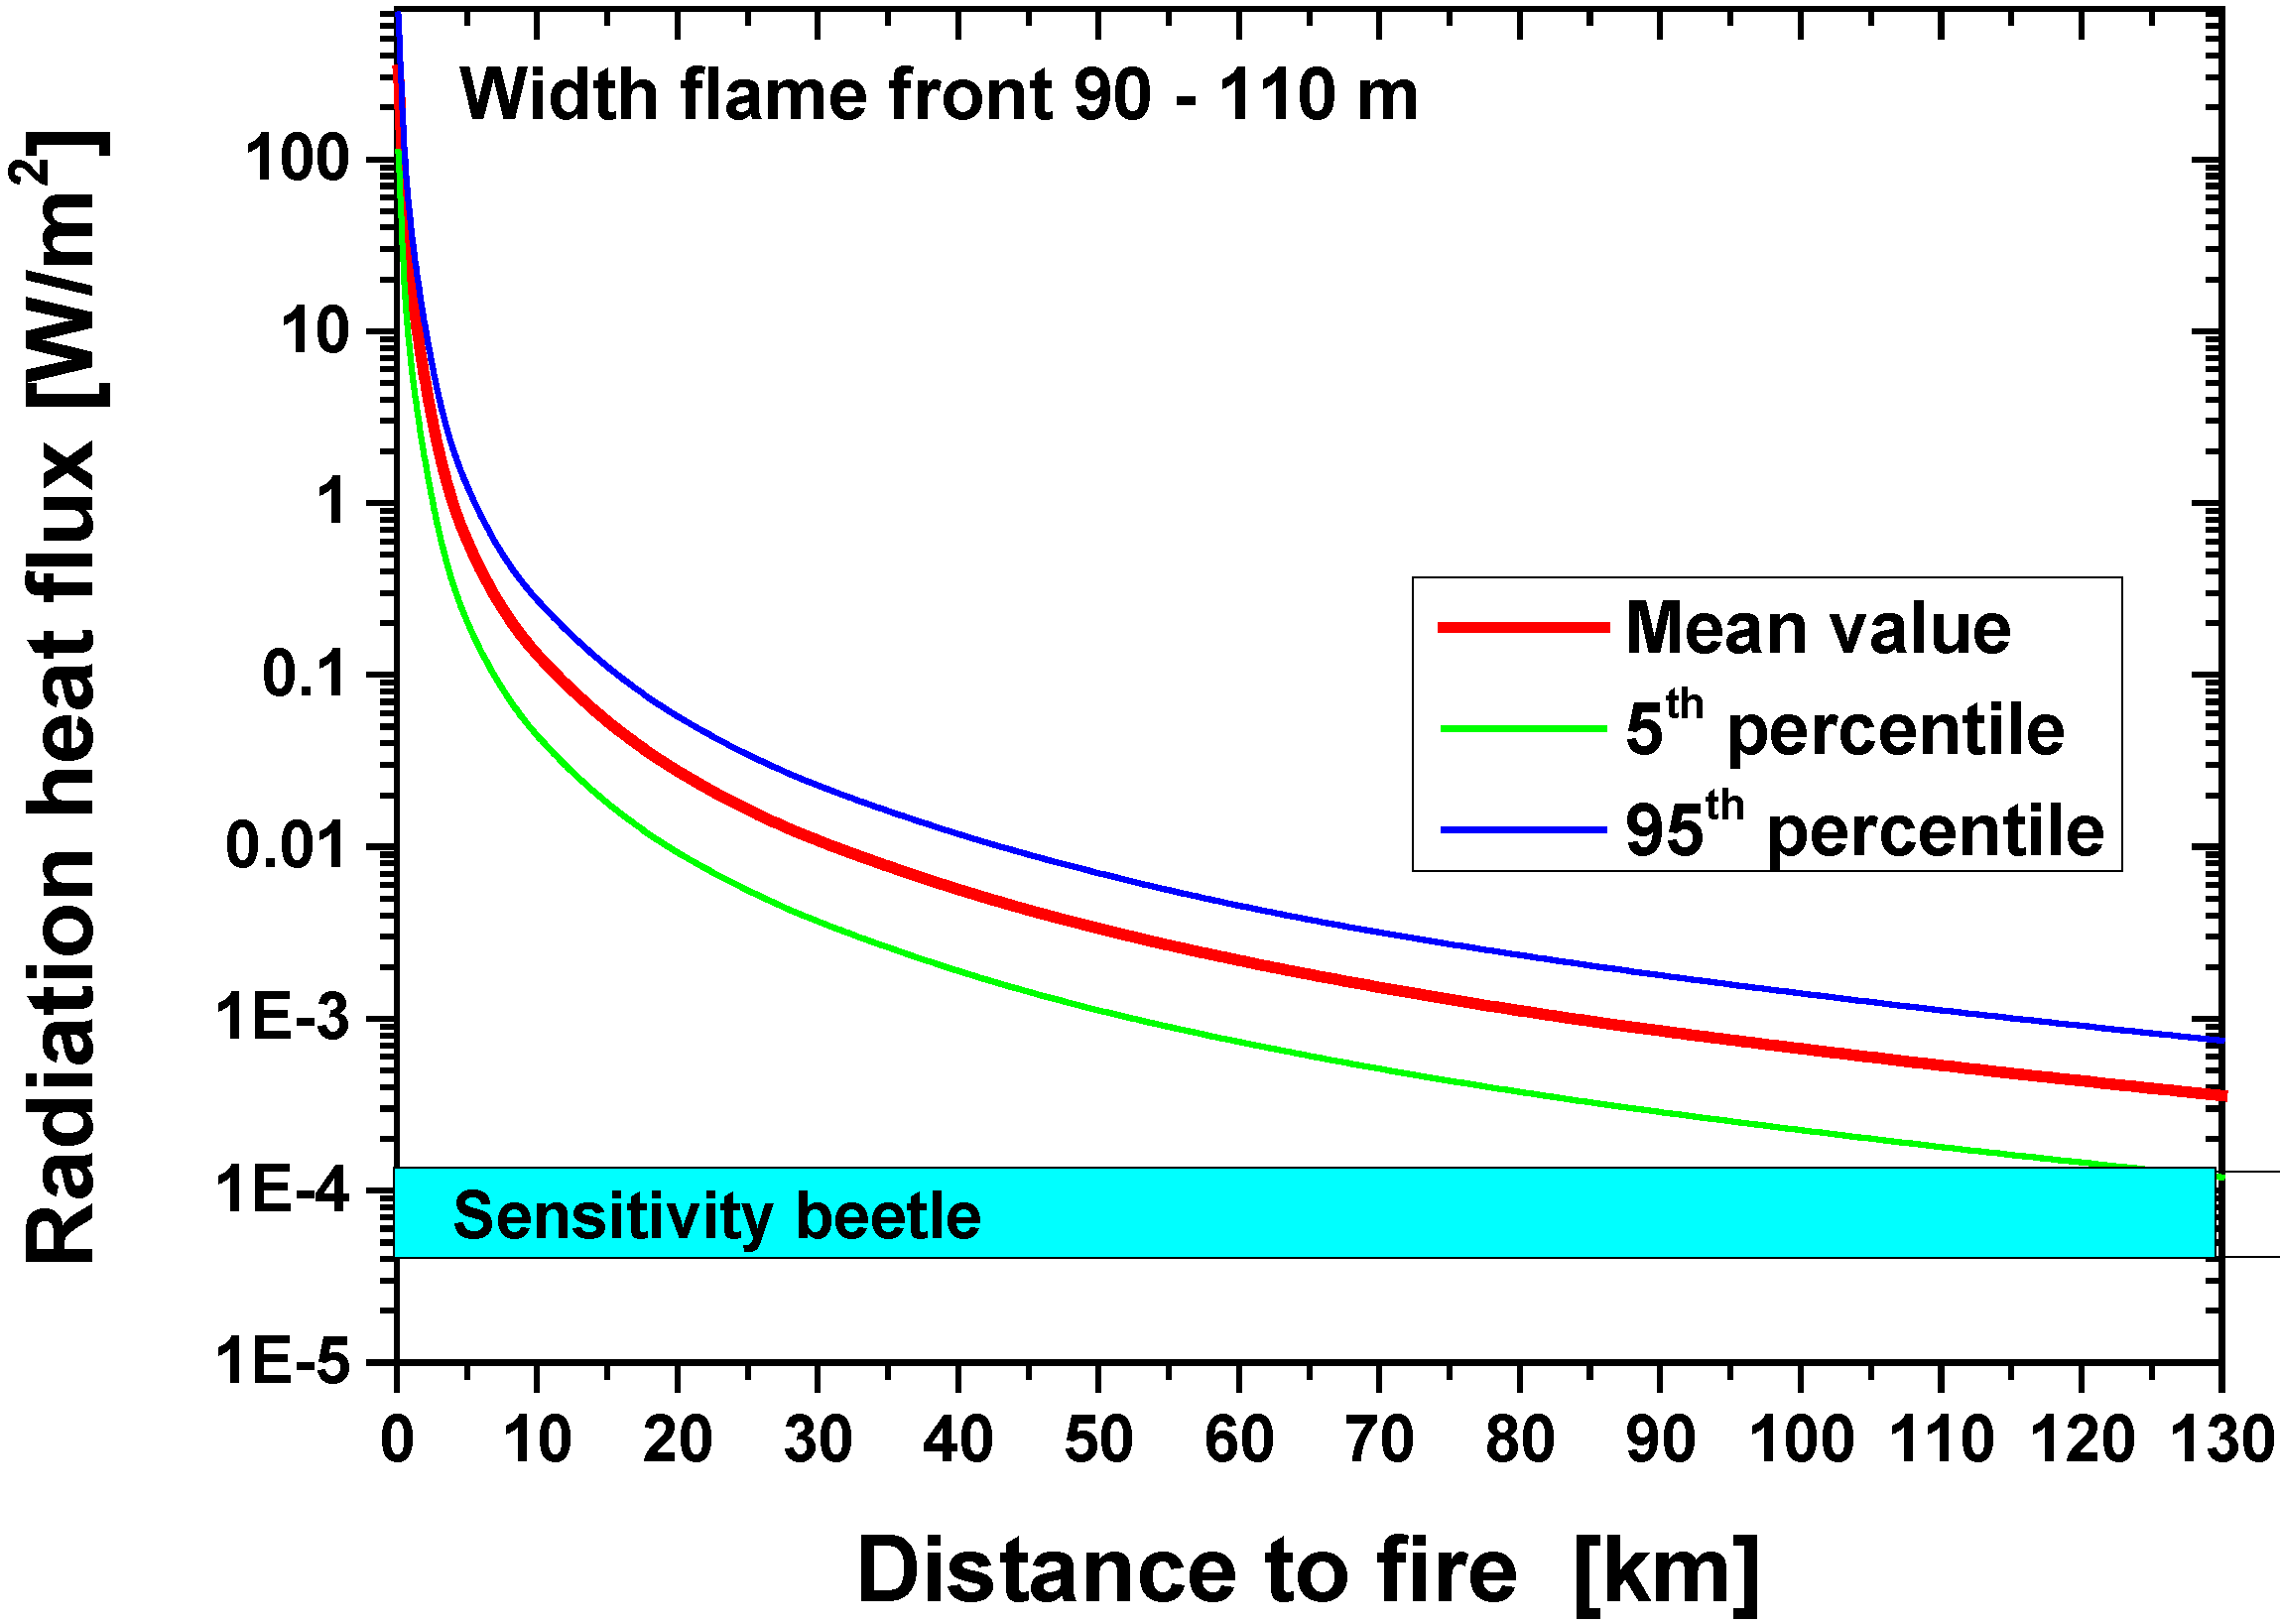
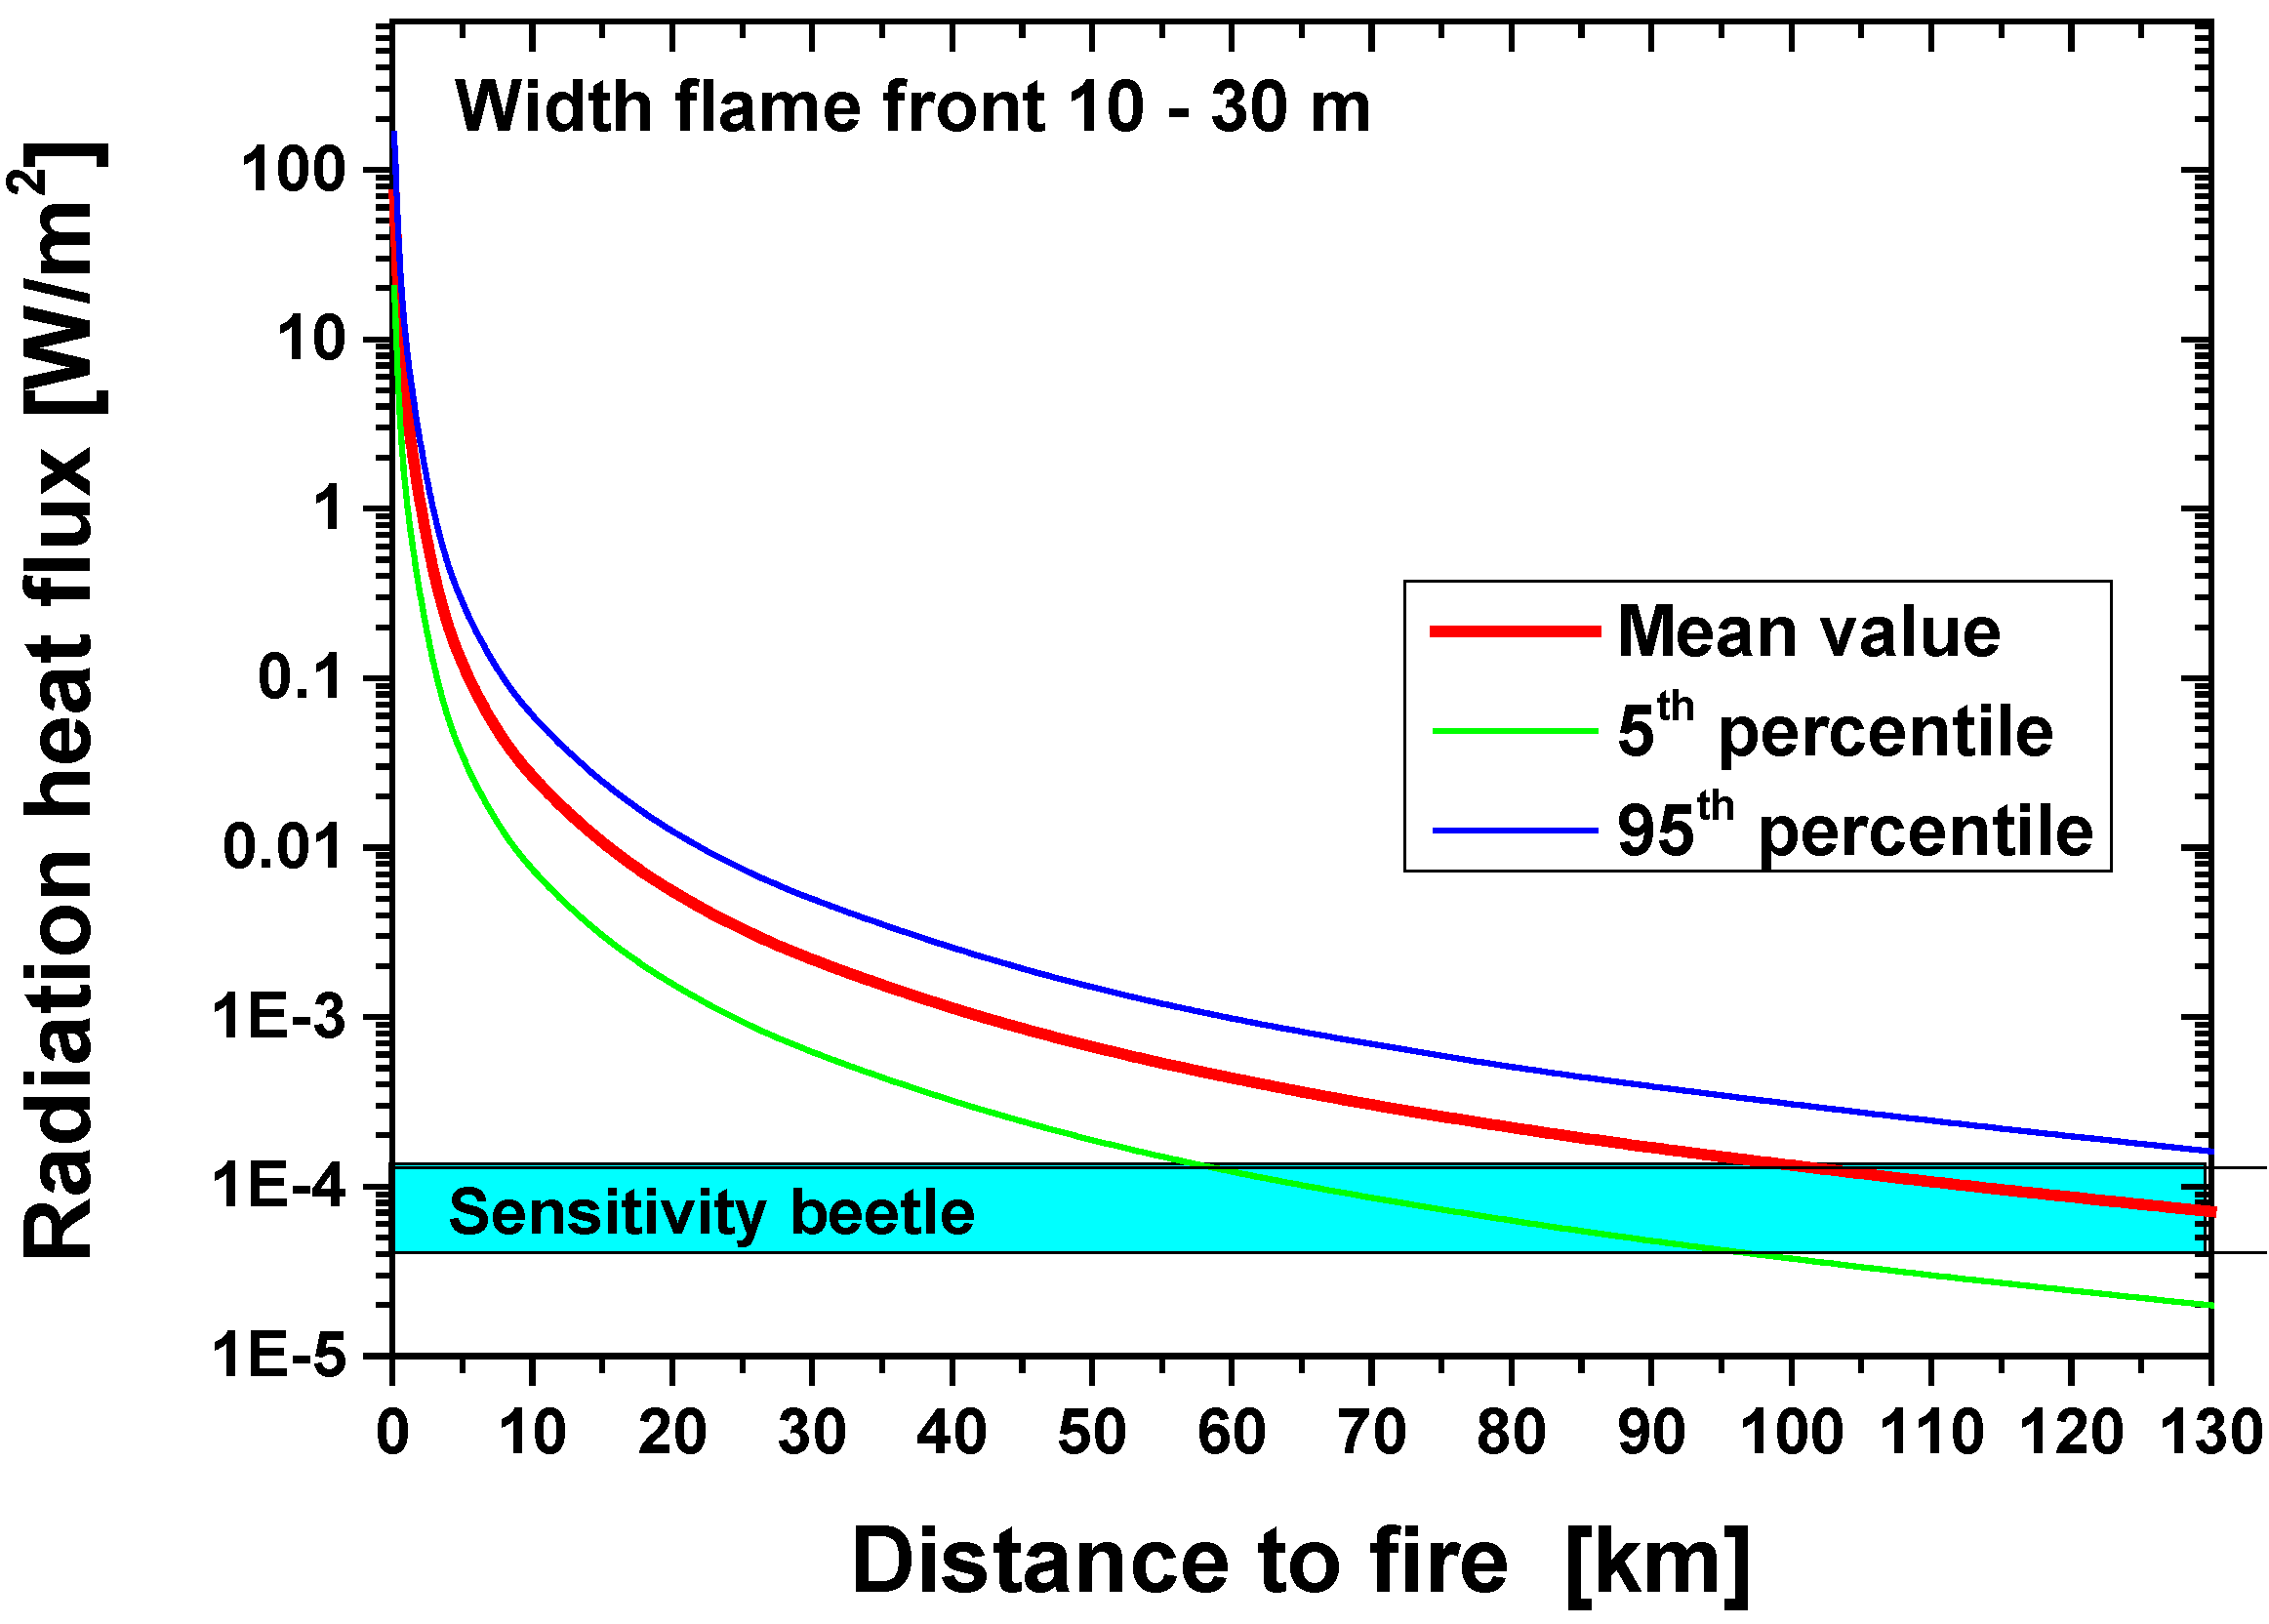
3. Detection Distances of Forest Fires by Melanophila Beetles

| Parameter | Value |
|---|---|
| Emissivity flame ε | 0.7–1.0 |
| Flame temperature T | 800–1200 °C |
| Heat of combustion H | 17000–18600 kJ/kg |
| Surface fuel load w | 8–25 t/ha |
| Fire Danger Index FDI | 50–75 |
| Slope of ground | 0° |
| Visibility atmosphere | 7–13 km |
| Temperature air | 25–30 °C |
| Humidity | 25%–35% |
| Wind velocity | 30–60 km/h |
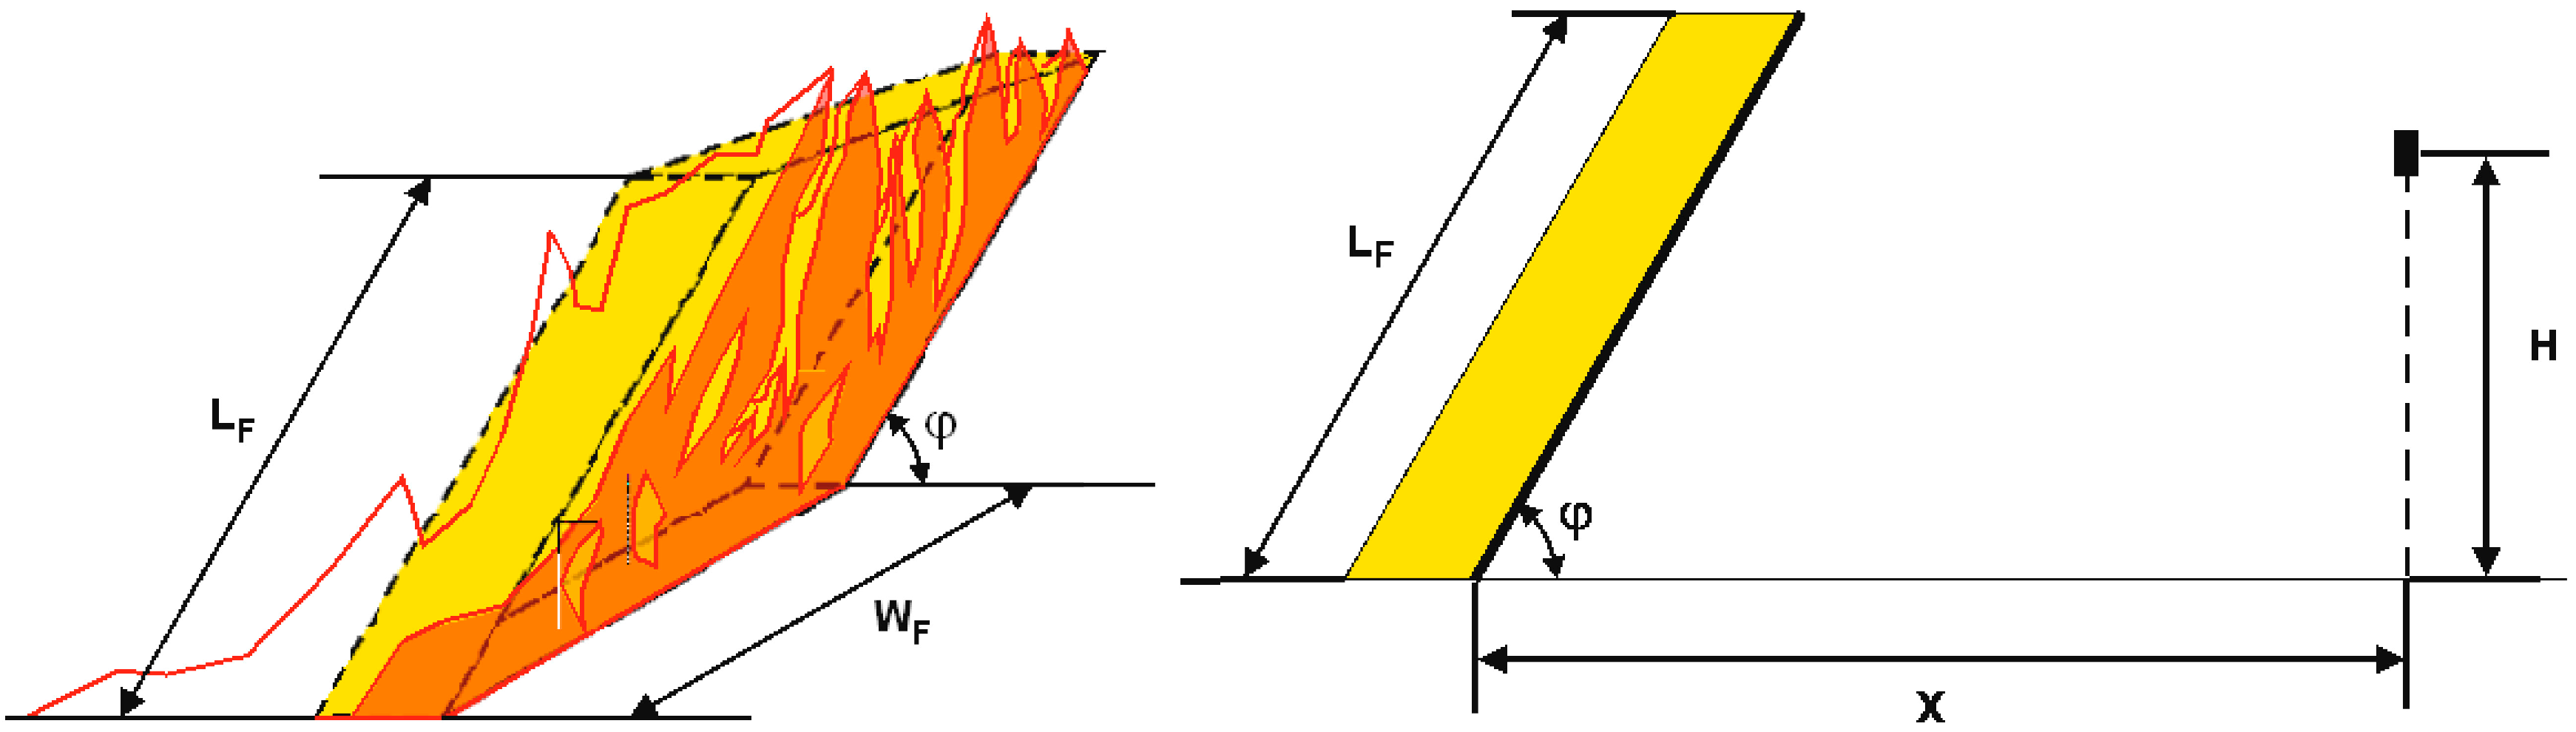
| Parameter | Flame front 10–30 m | Flame front 90–110 m |
|---|---|---|
| Rate of spread R | 0.6–1.9 km/h | 0.6–1.9 km/h |
| Flame height LF | 6.5–16.5 m | 6.5–16.5 m |
| Fire intensity I | 6,125–31,755 kW/m | 6,062–31,660 kW/m |
| Flame angle | 63°–79° | 63°–79° |
| Transmittance τ | 0.34–0.43 (at 90 km) | 0.30–0.38 (at 130 km) |
| View factor F1→2 | 3.6 × 10⁻⁹–1.5 × 10⁻⁸ (at 90 km) | 1.2 × 10⁻⁸–2.9 × 10⁻⁸ (at 130 km) |
| Radiant heat flux qrad | 4.7 × 10⁻⁵–3.9 × 10⁻⁴ W/m2 (at 90 km) | 1.2 × 10⁻⁴–7.5 × 10⁻⁴ W/m2 (at 130 km) |
4. Evaluation of a Biomimetic IR Sensor Based on the Melanophila IR Receptor
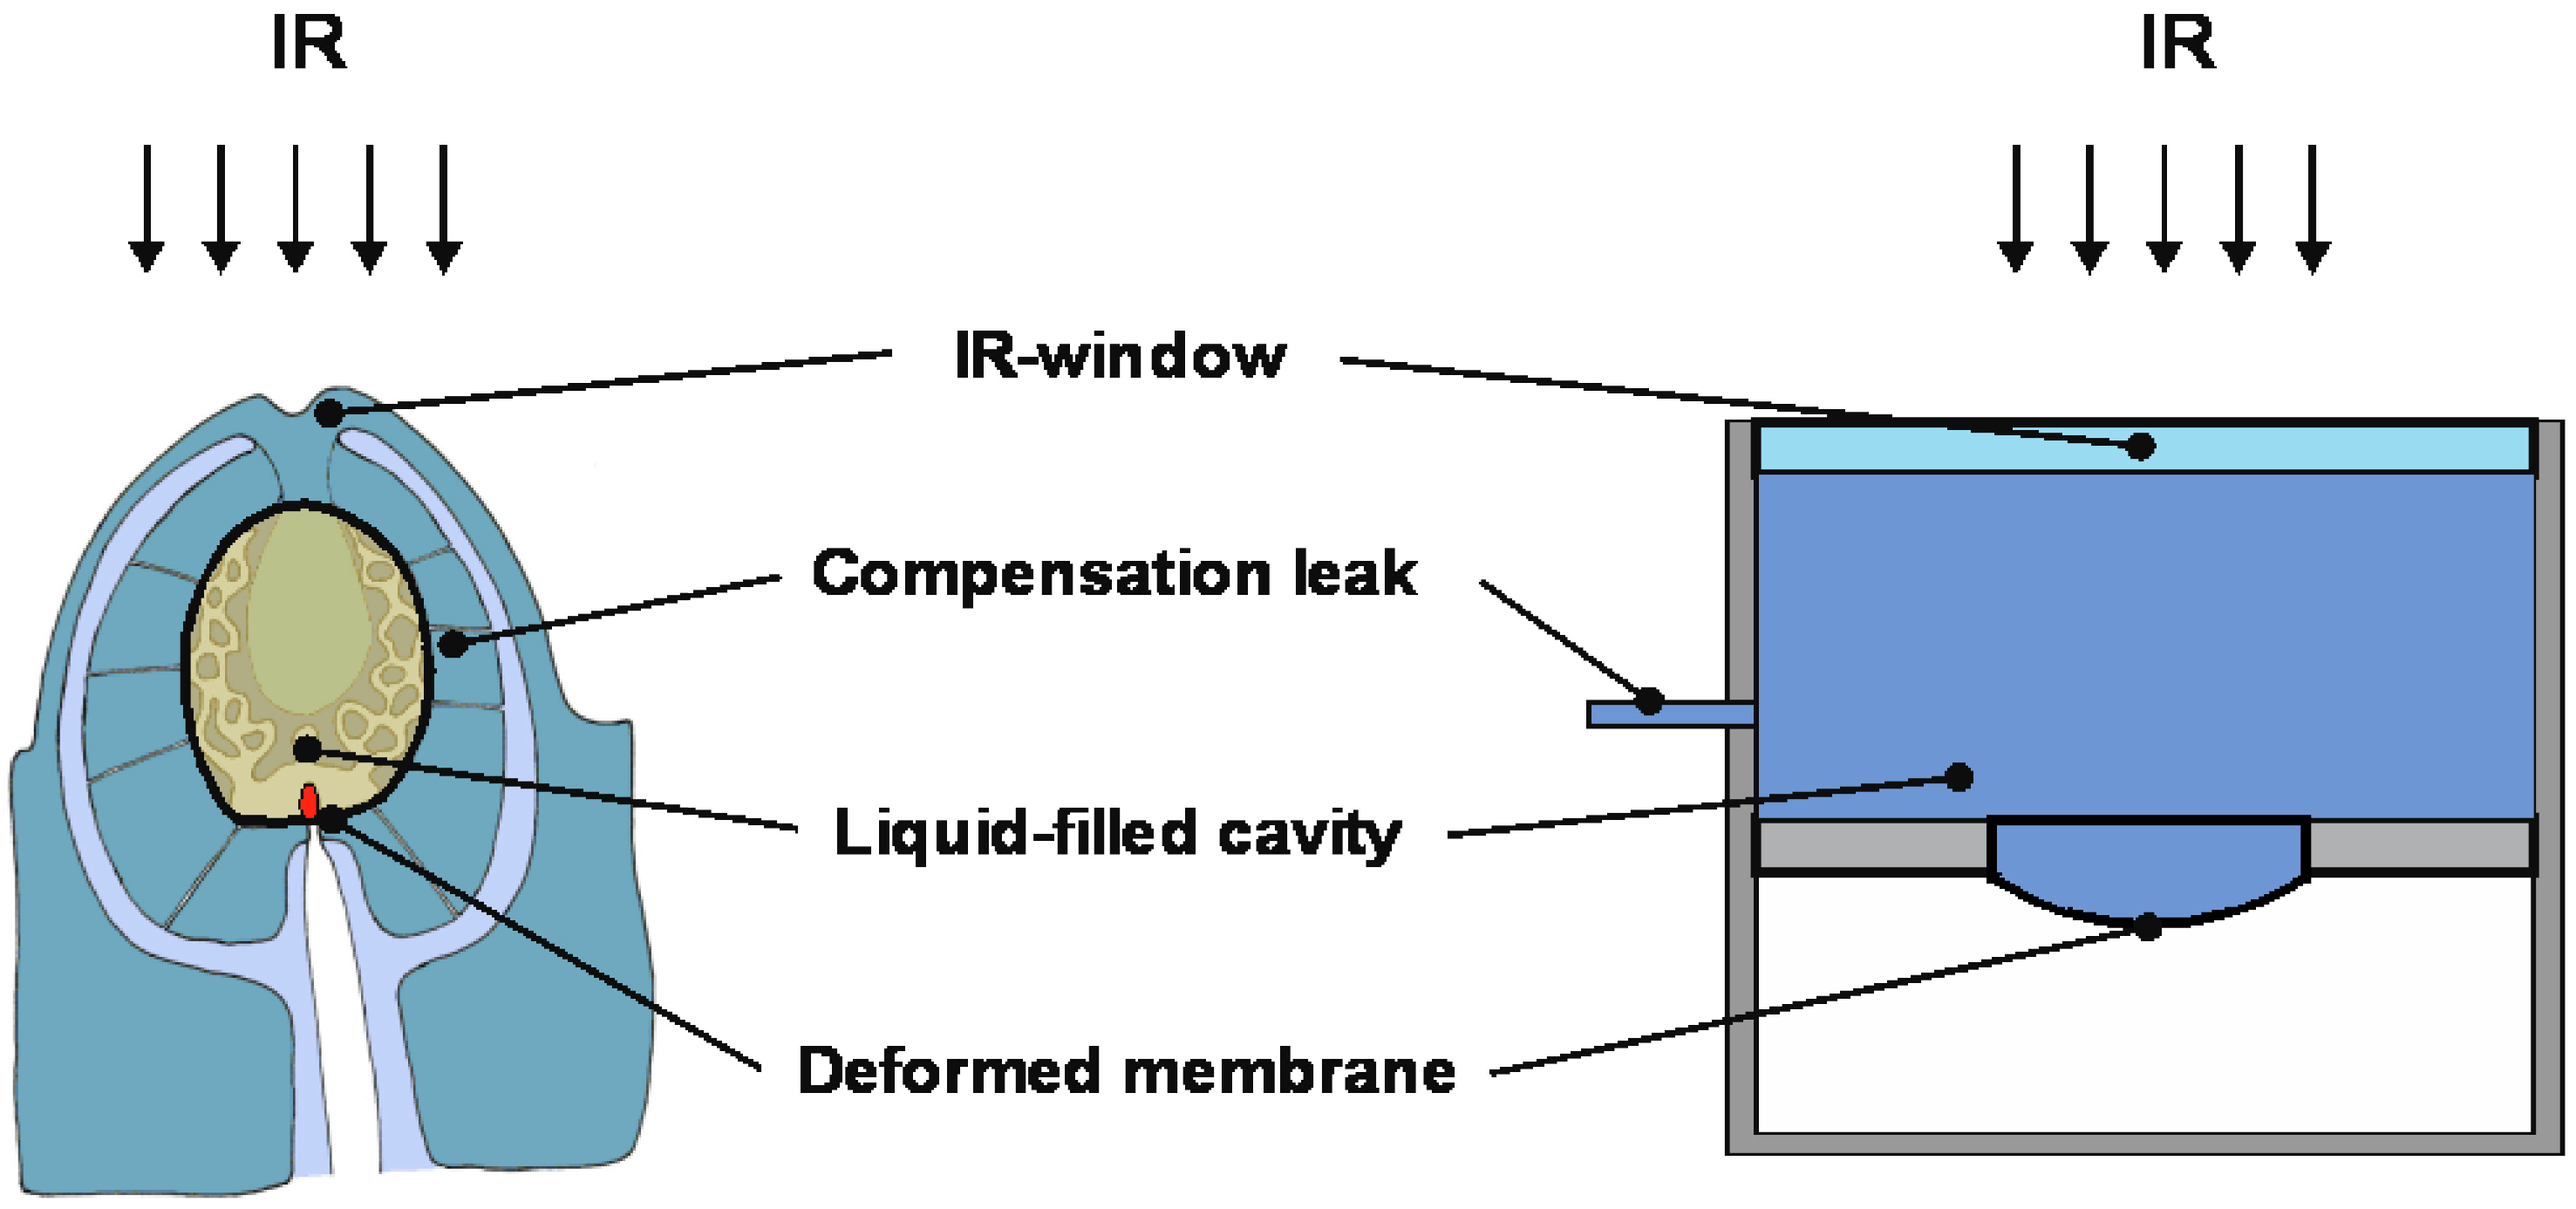
4.1. Sensor Model

4.2. Calculation of the Pressure Increase in the Cavity and the Membrane Deflection
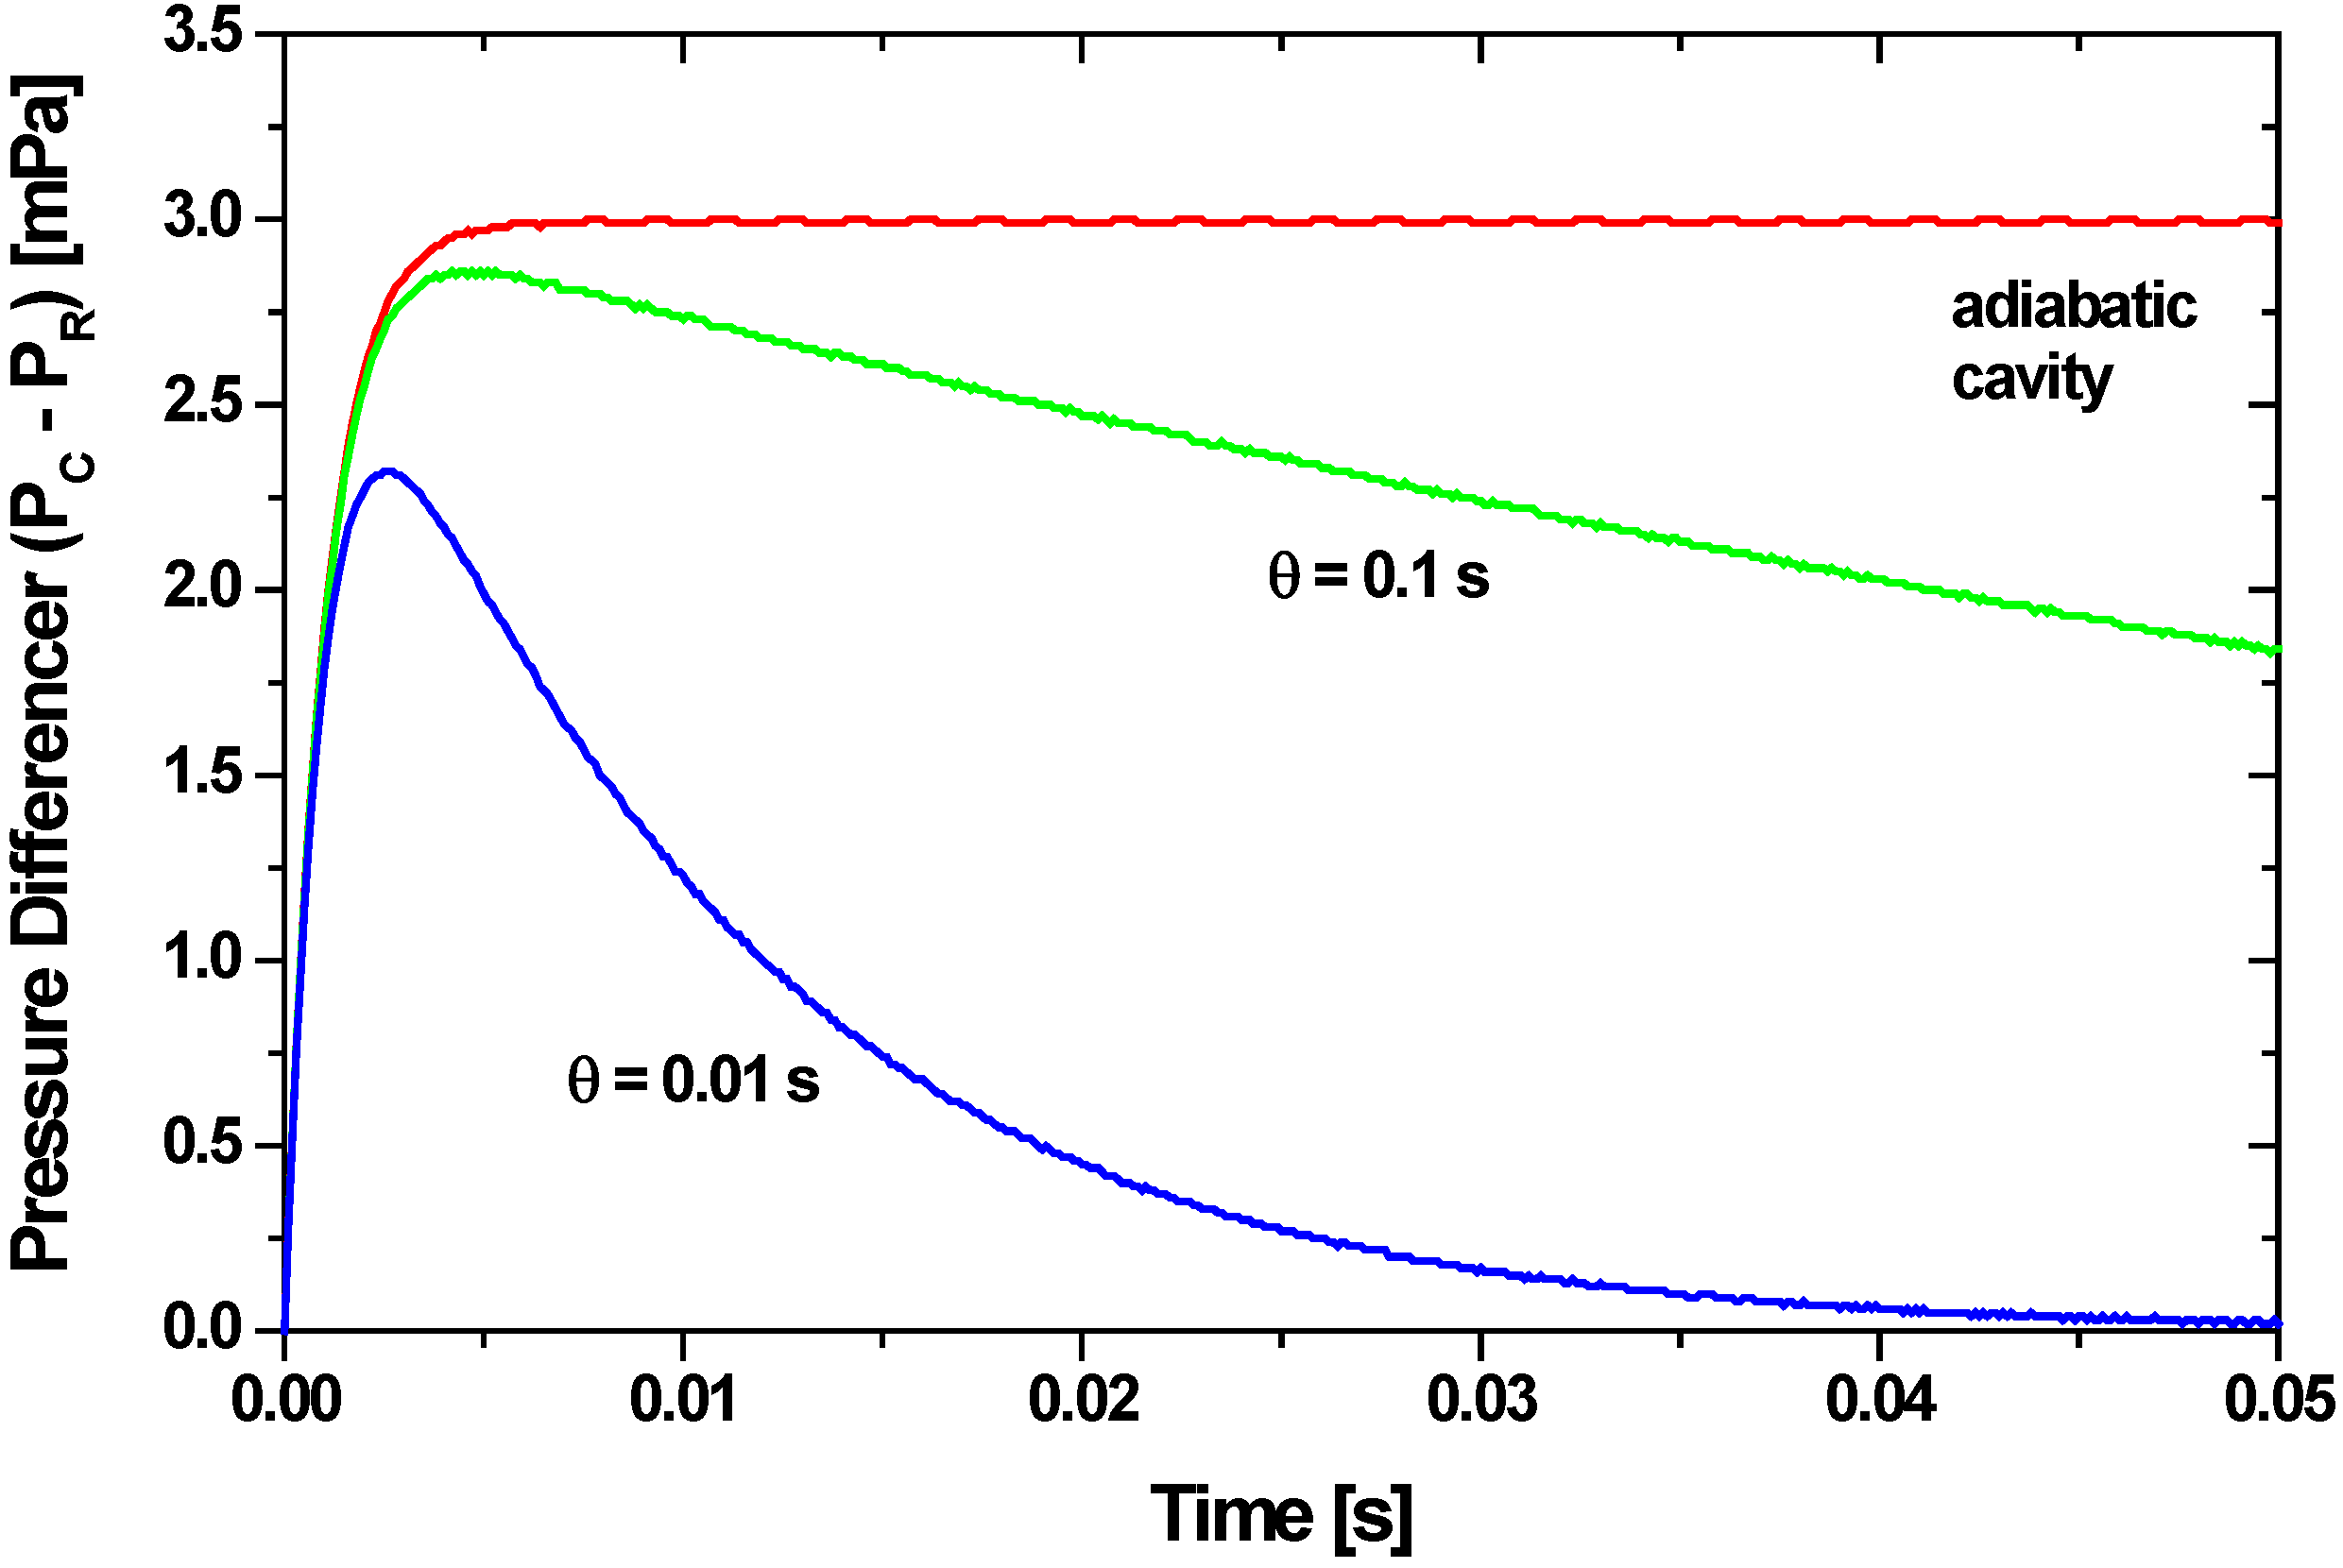
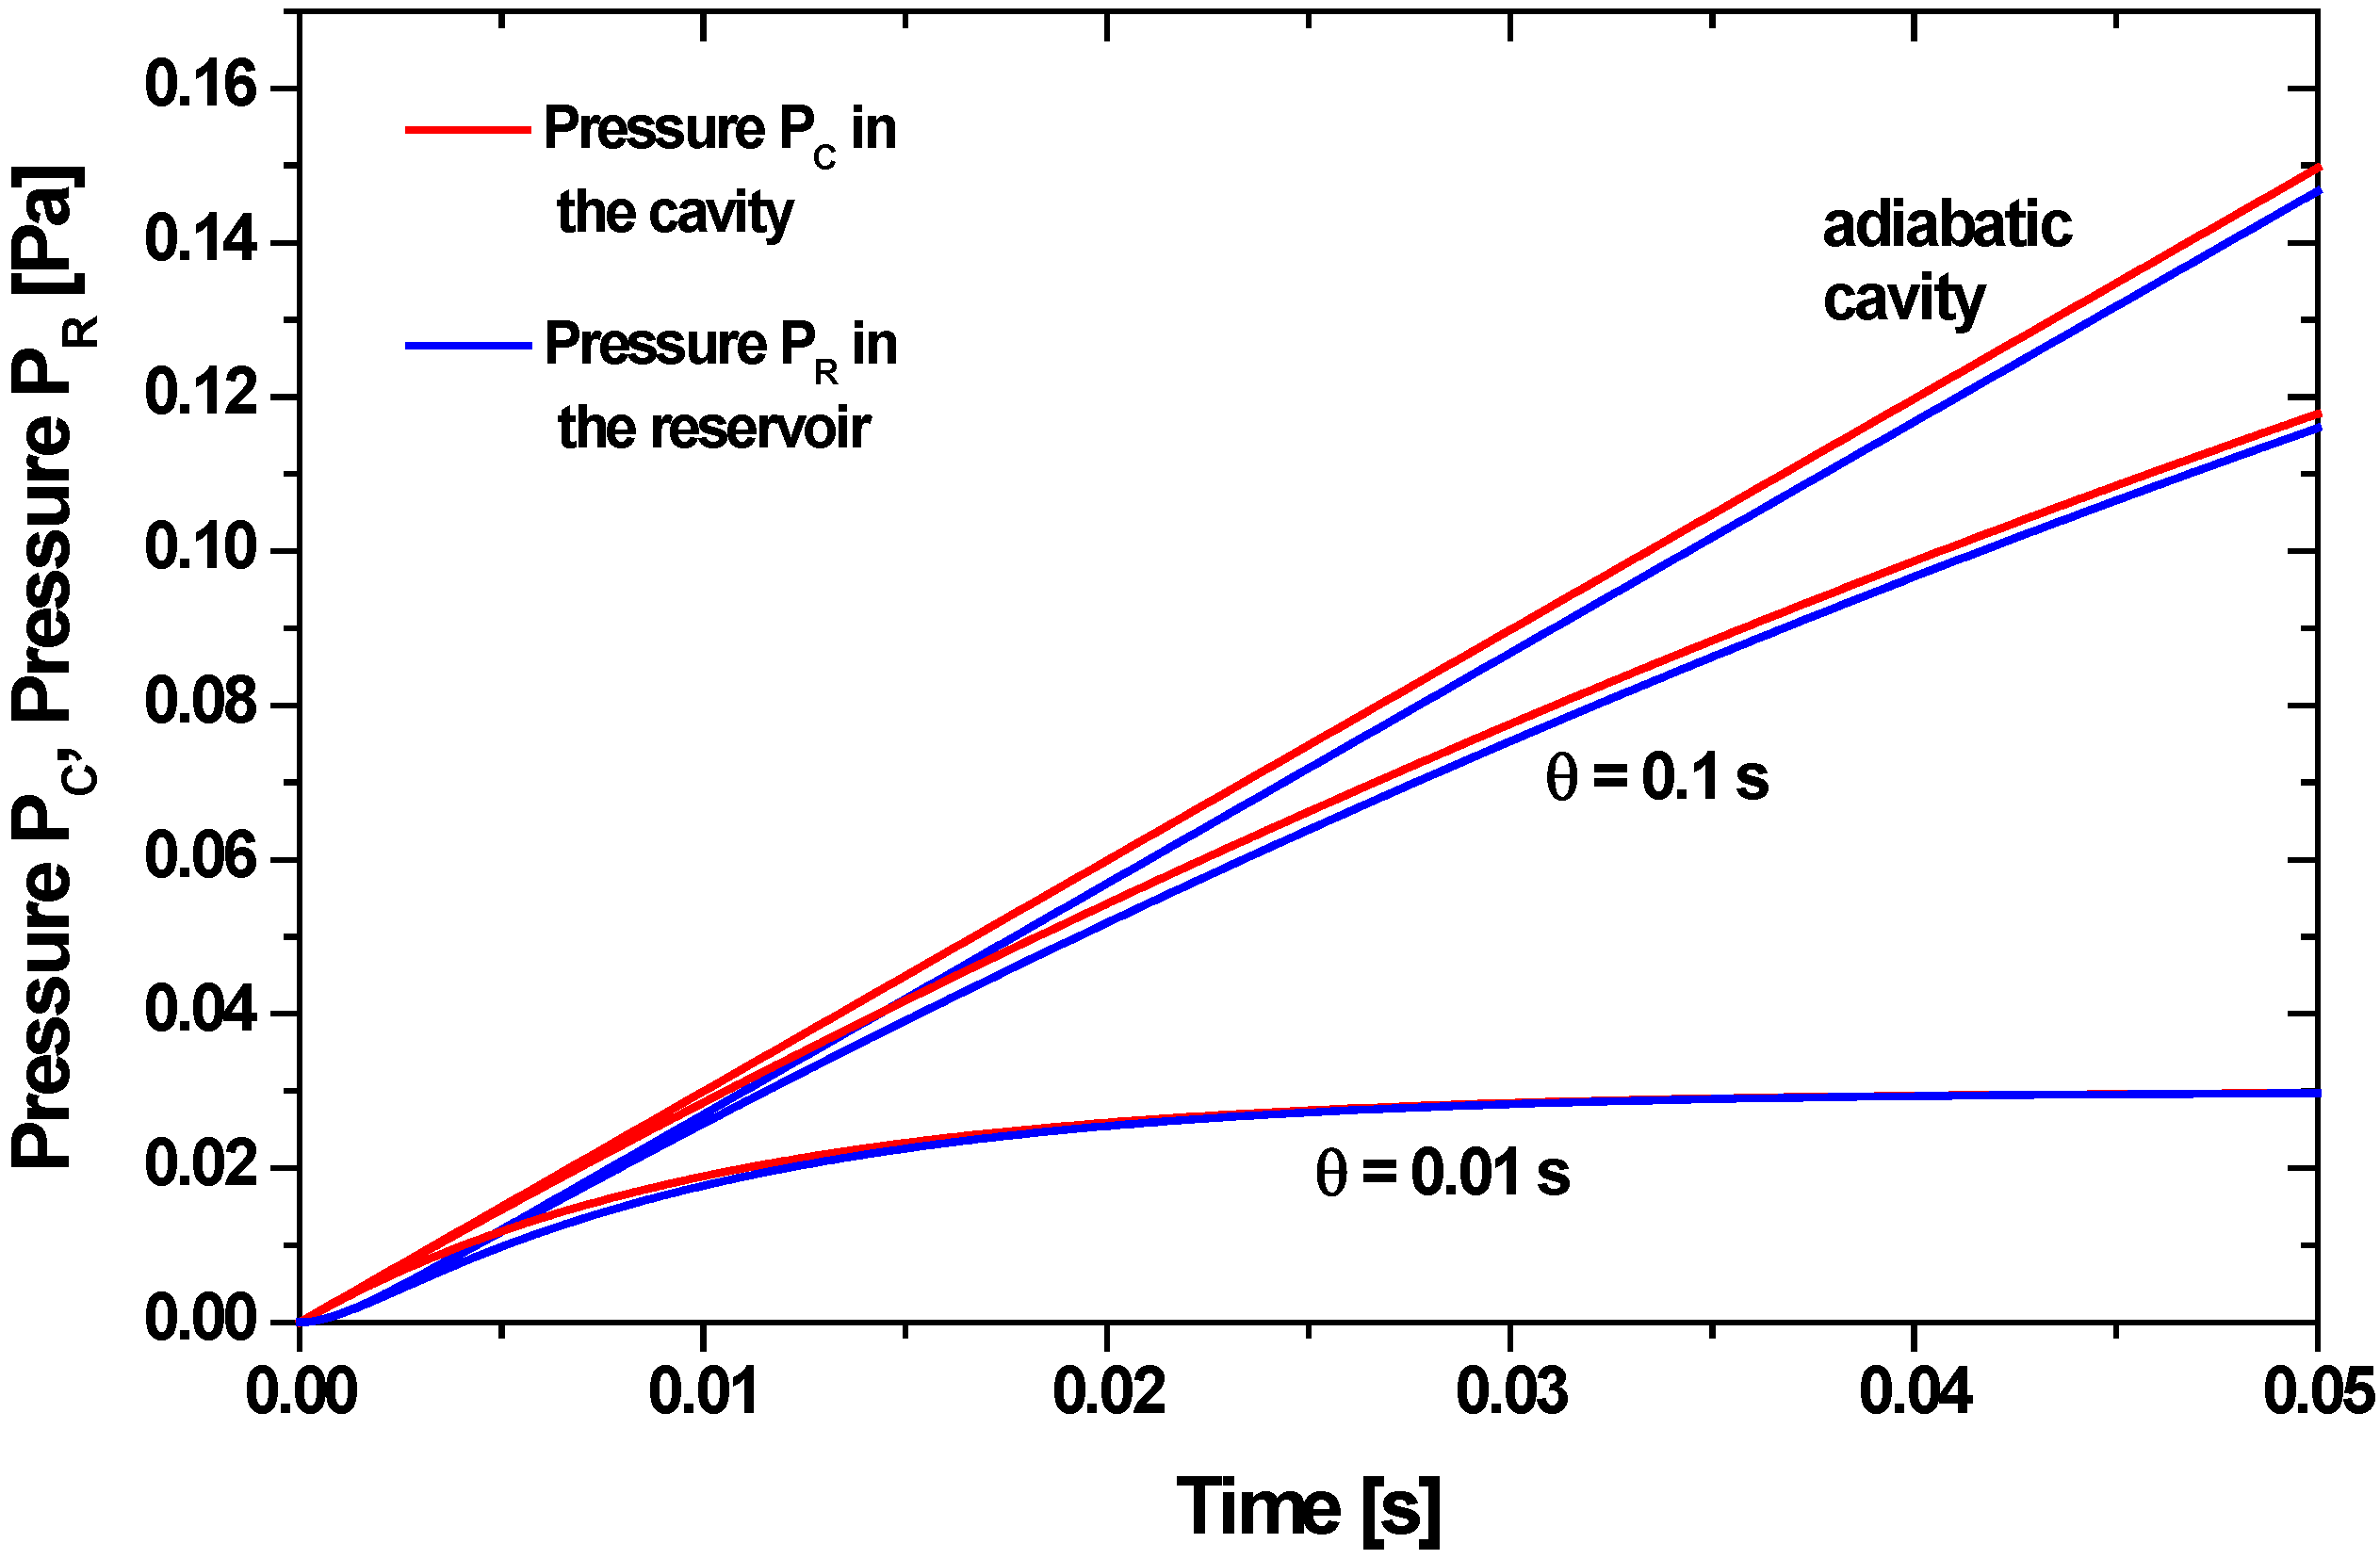
4.2.1. Adiabatic Cavity without Compensation Leak

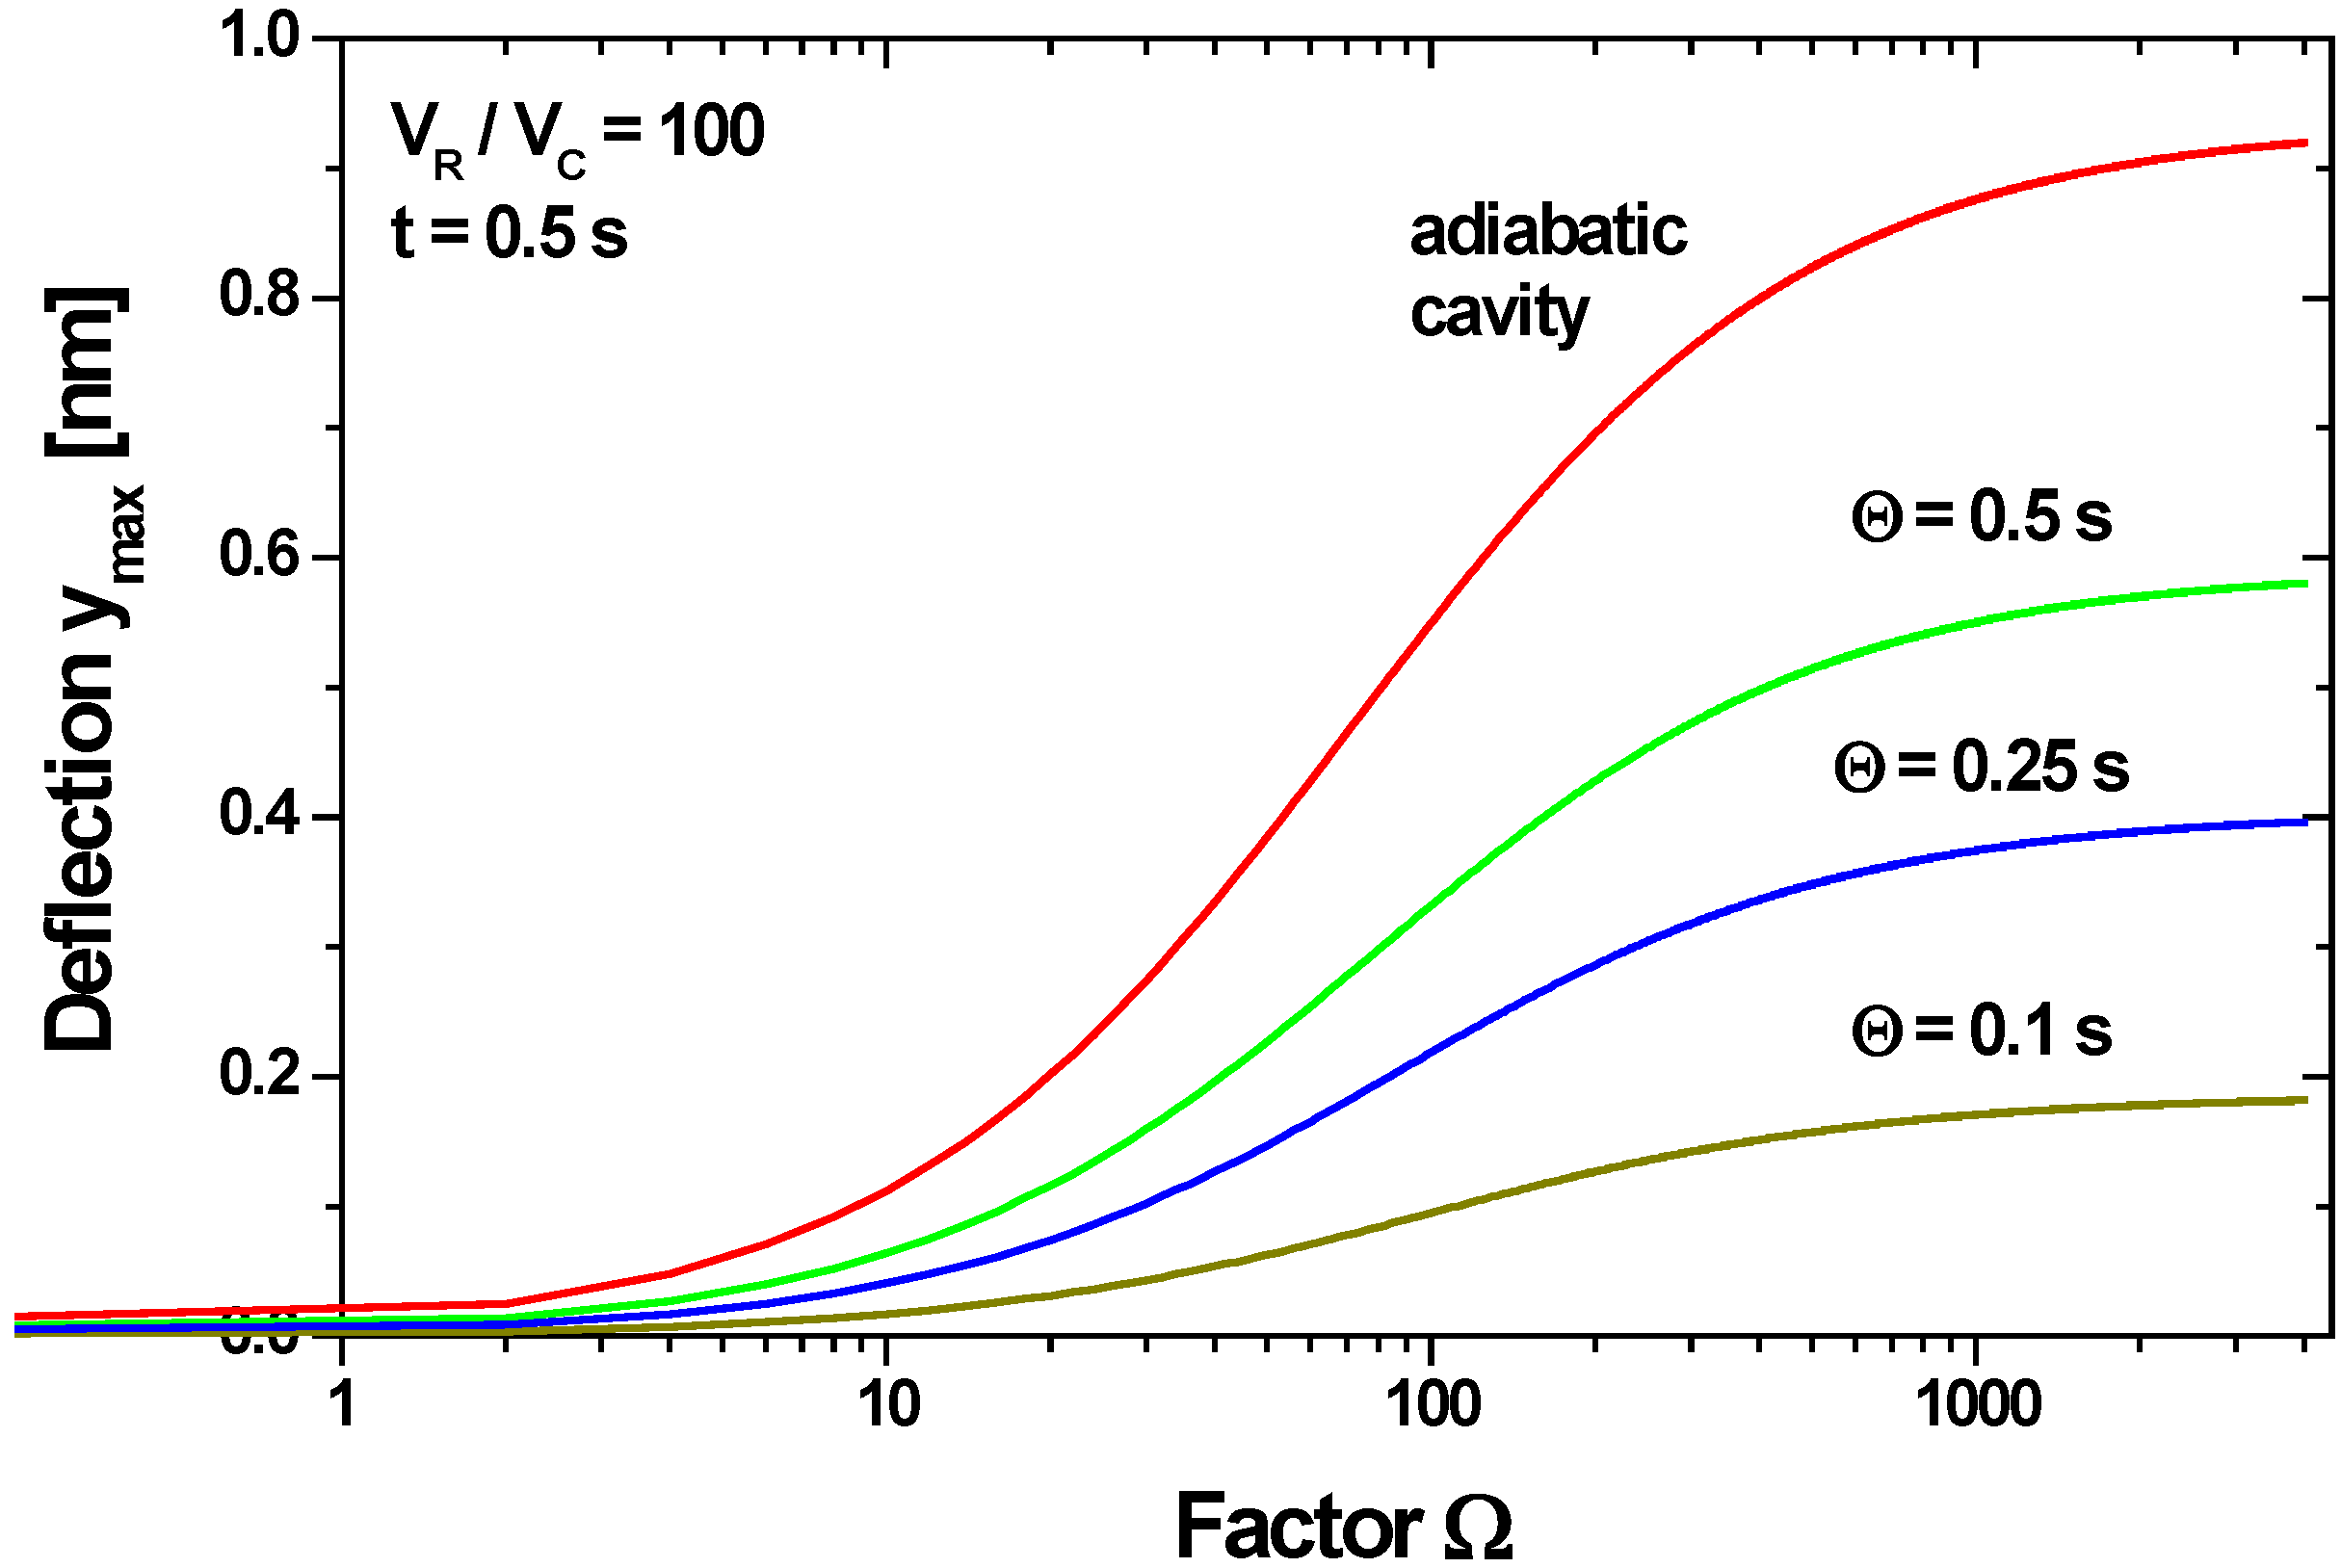
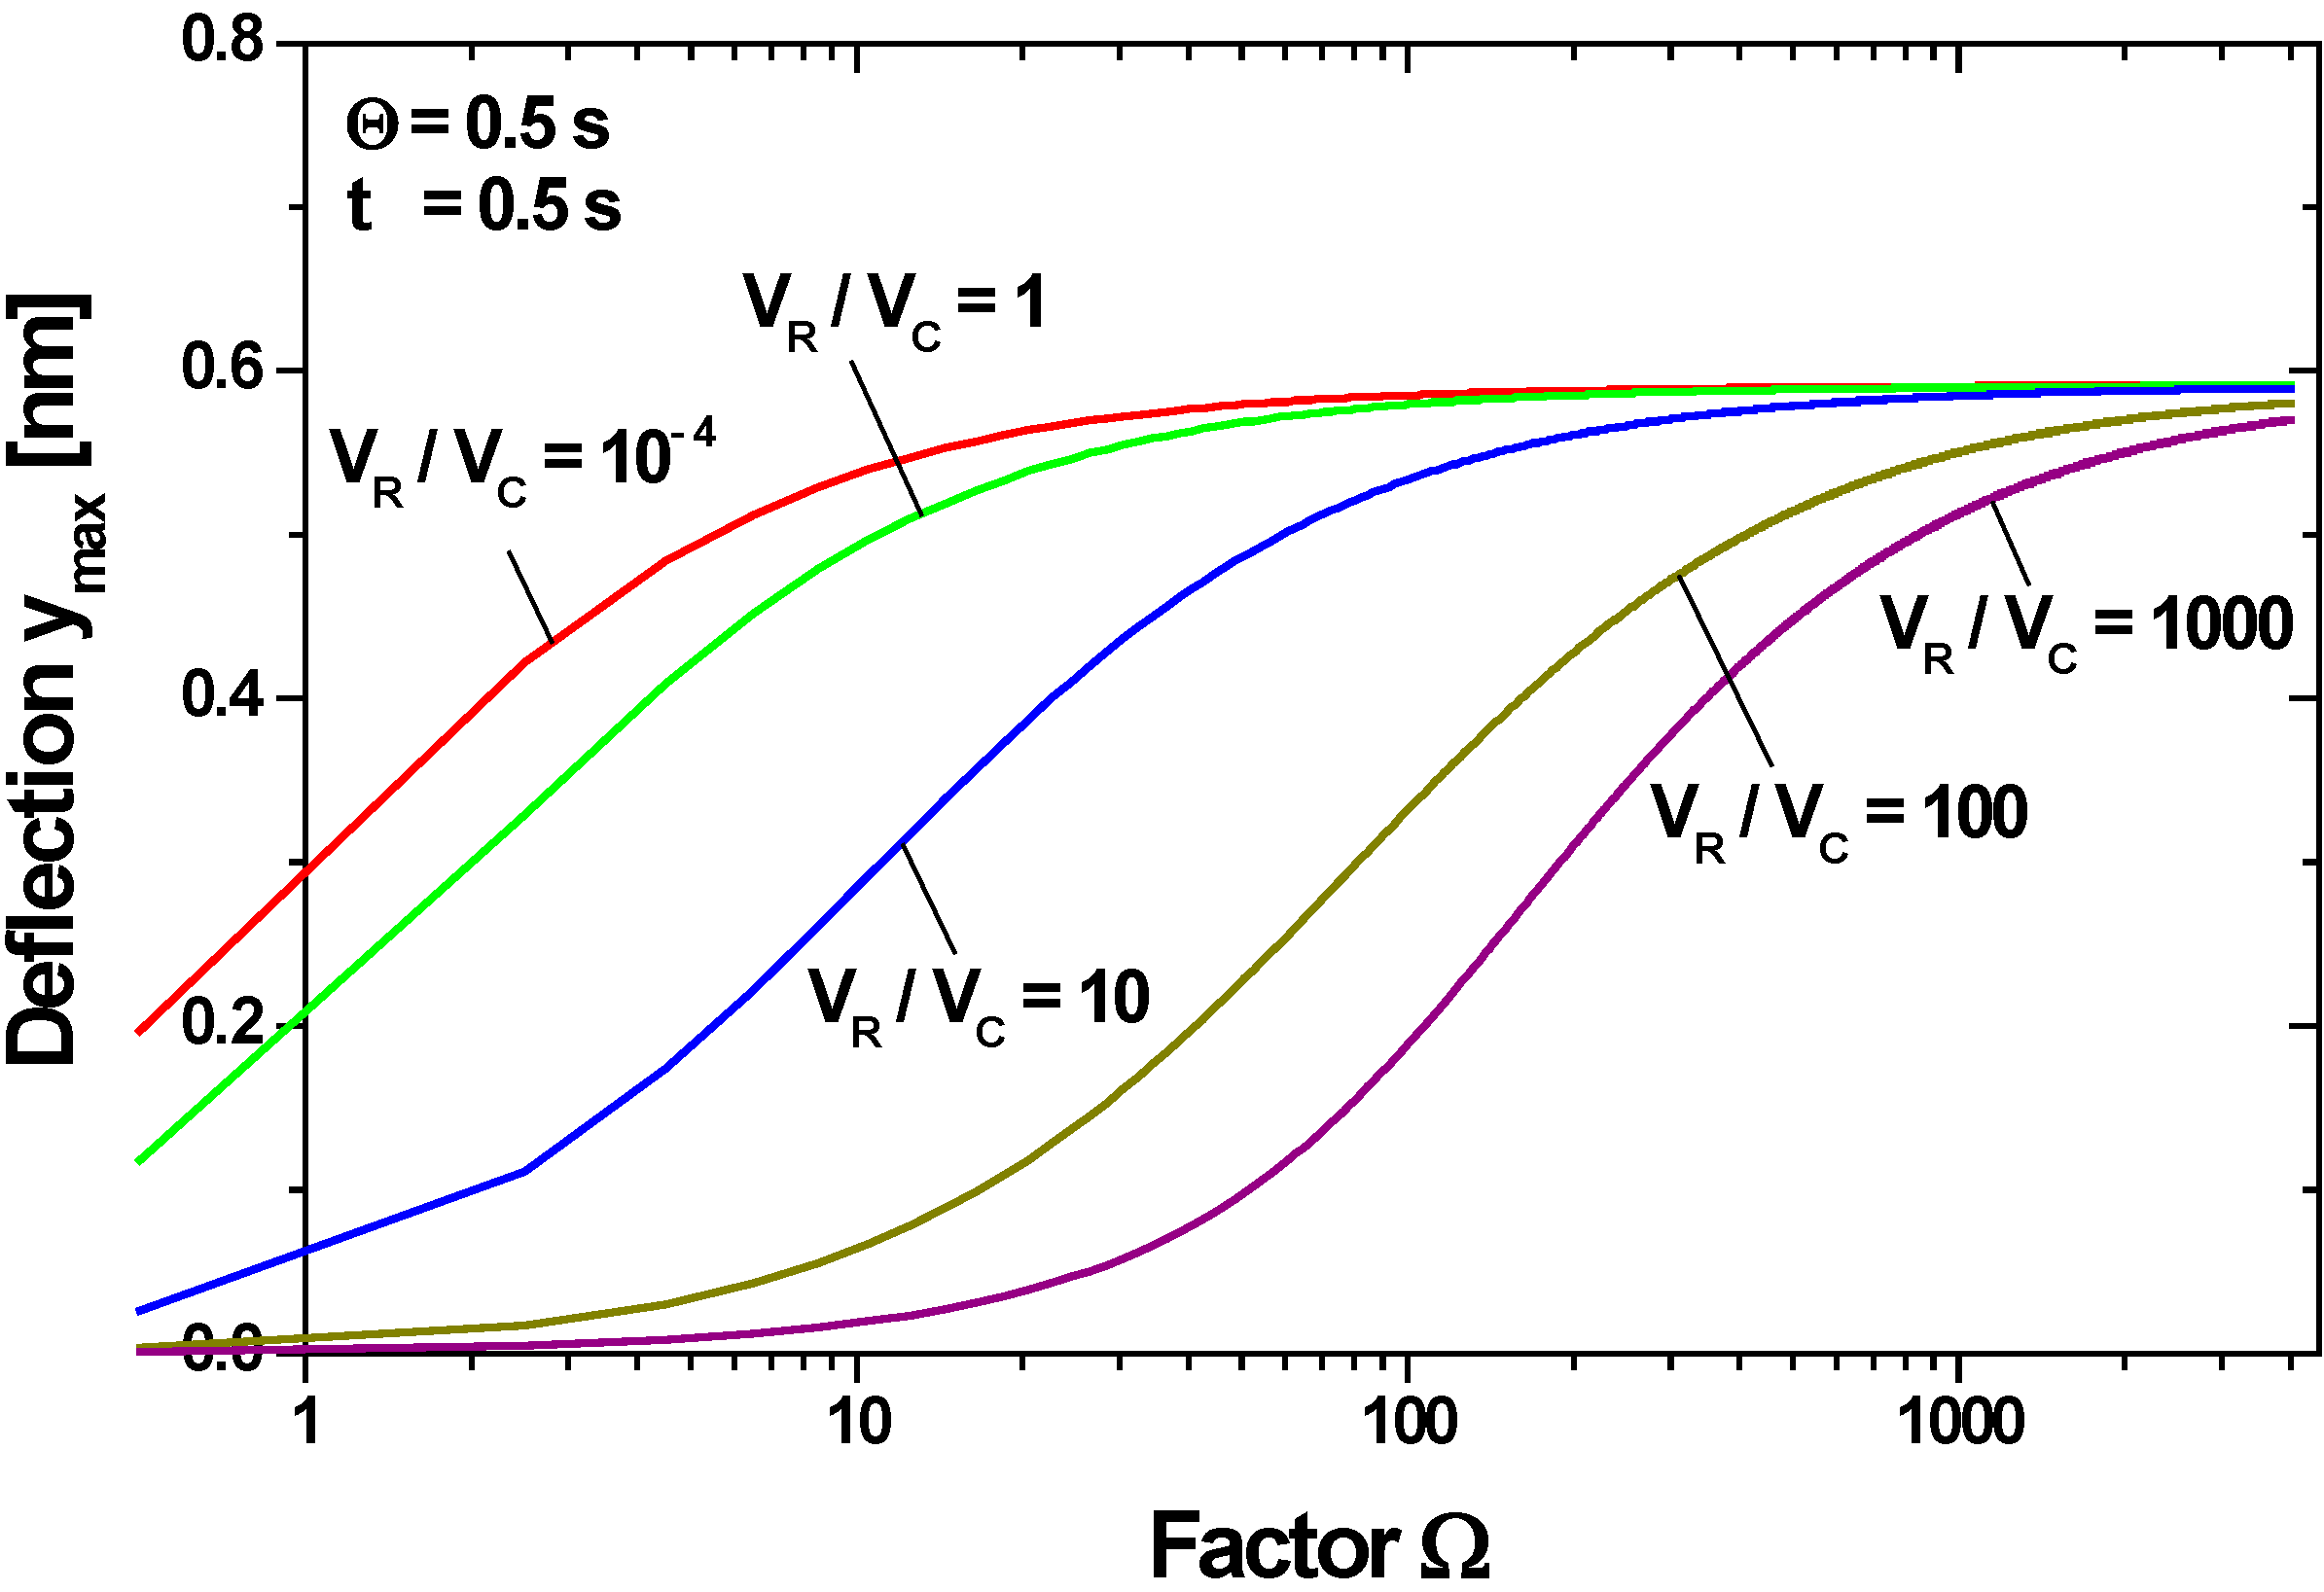
4.2.2. Non-Adiabatic Cavity with Compensation Leak


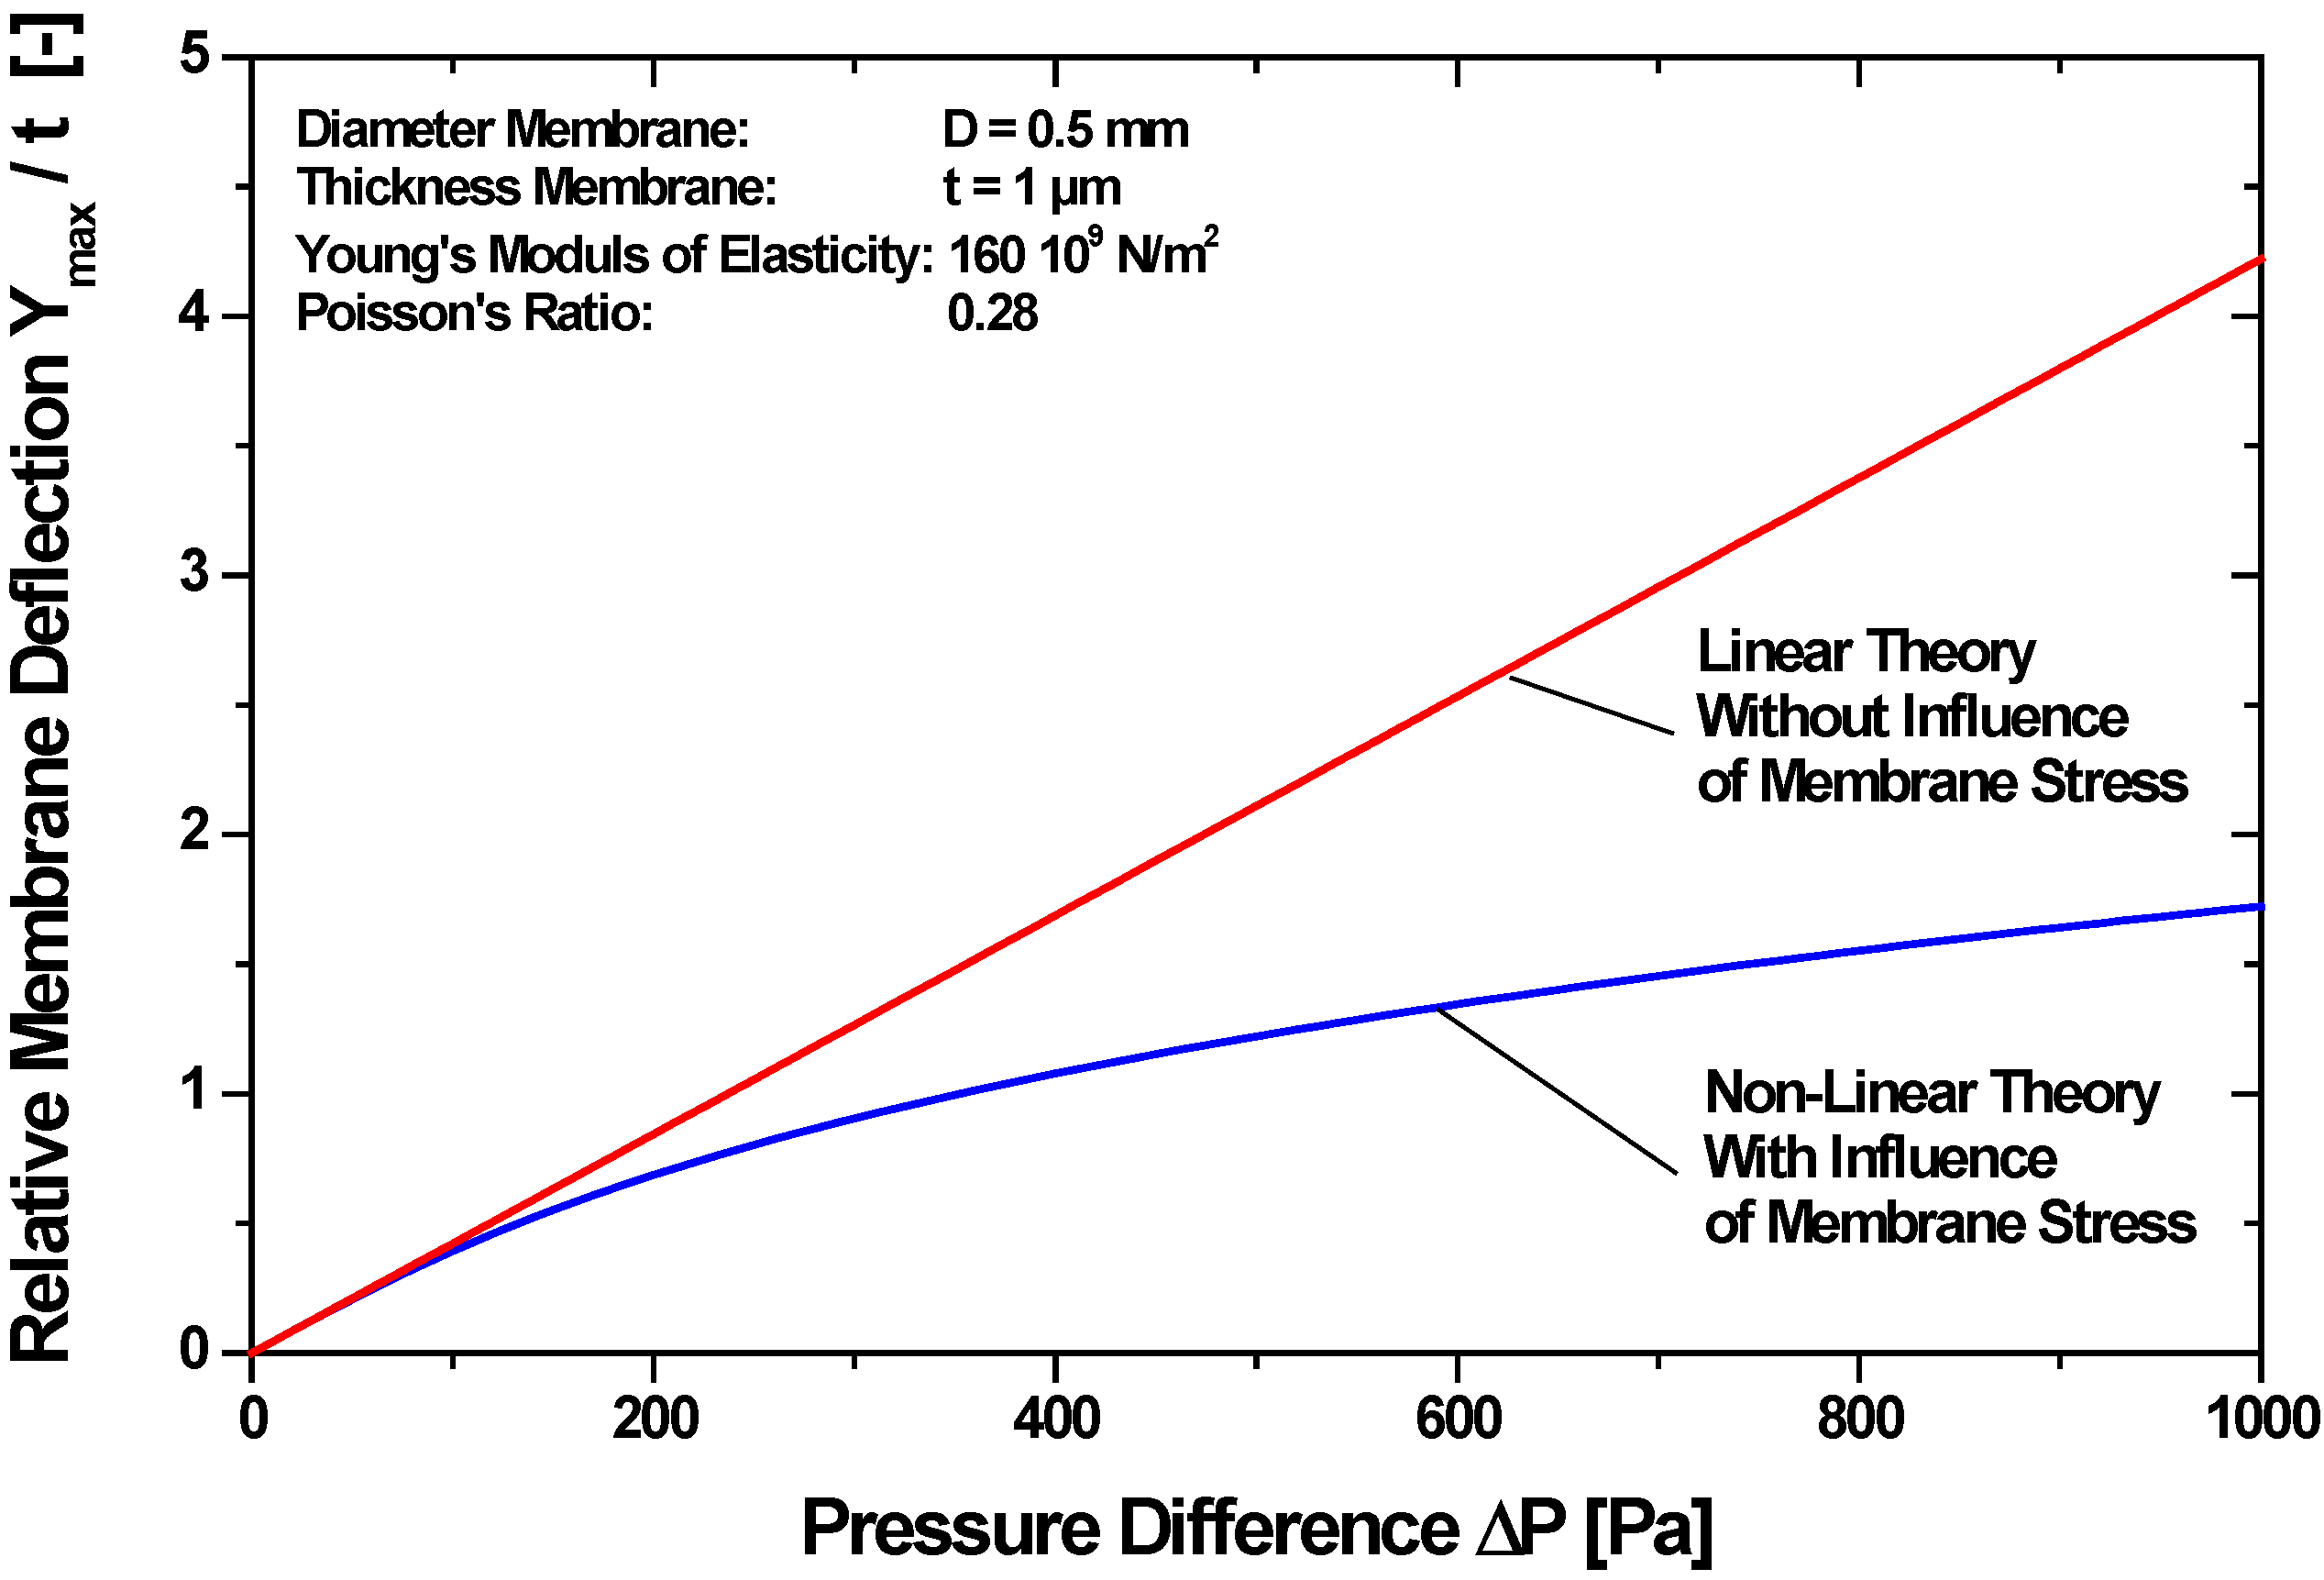
4.2.3. Influence of Membrane Stress on the Membrane Deflection

4.3. Evaluation of Sensor Components
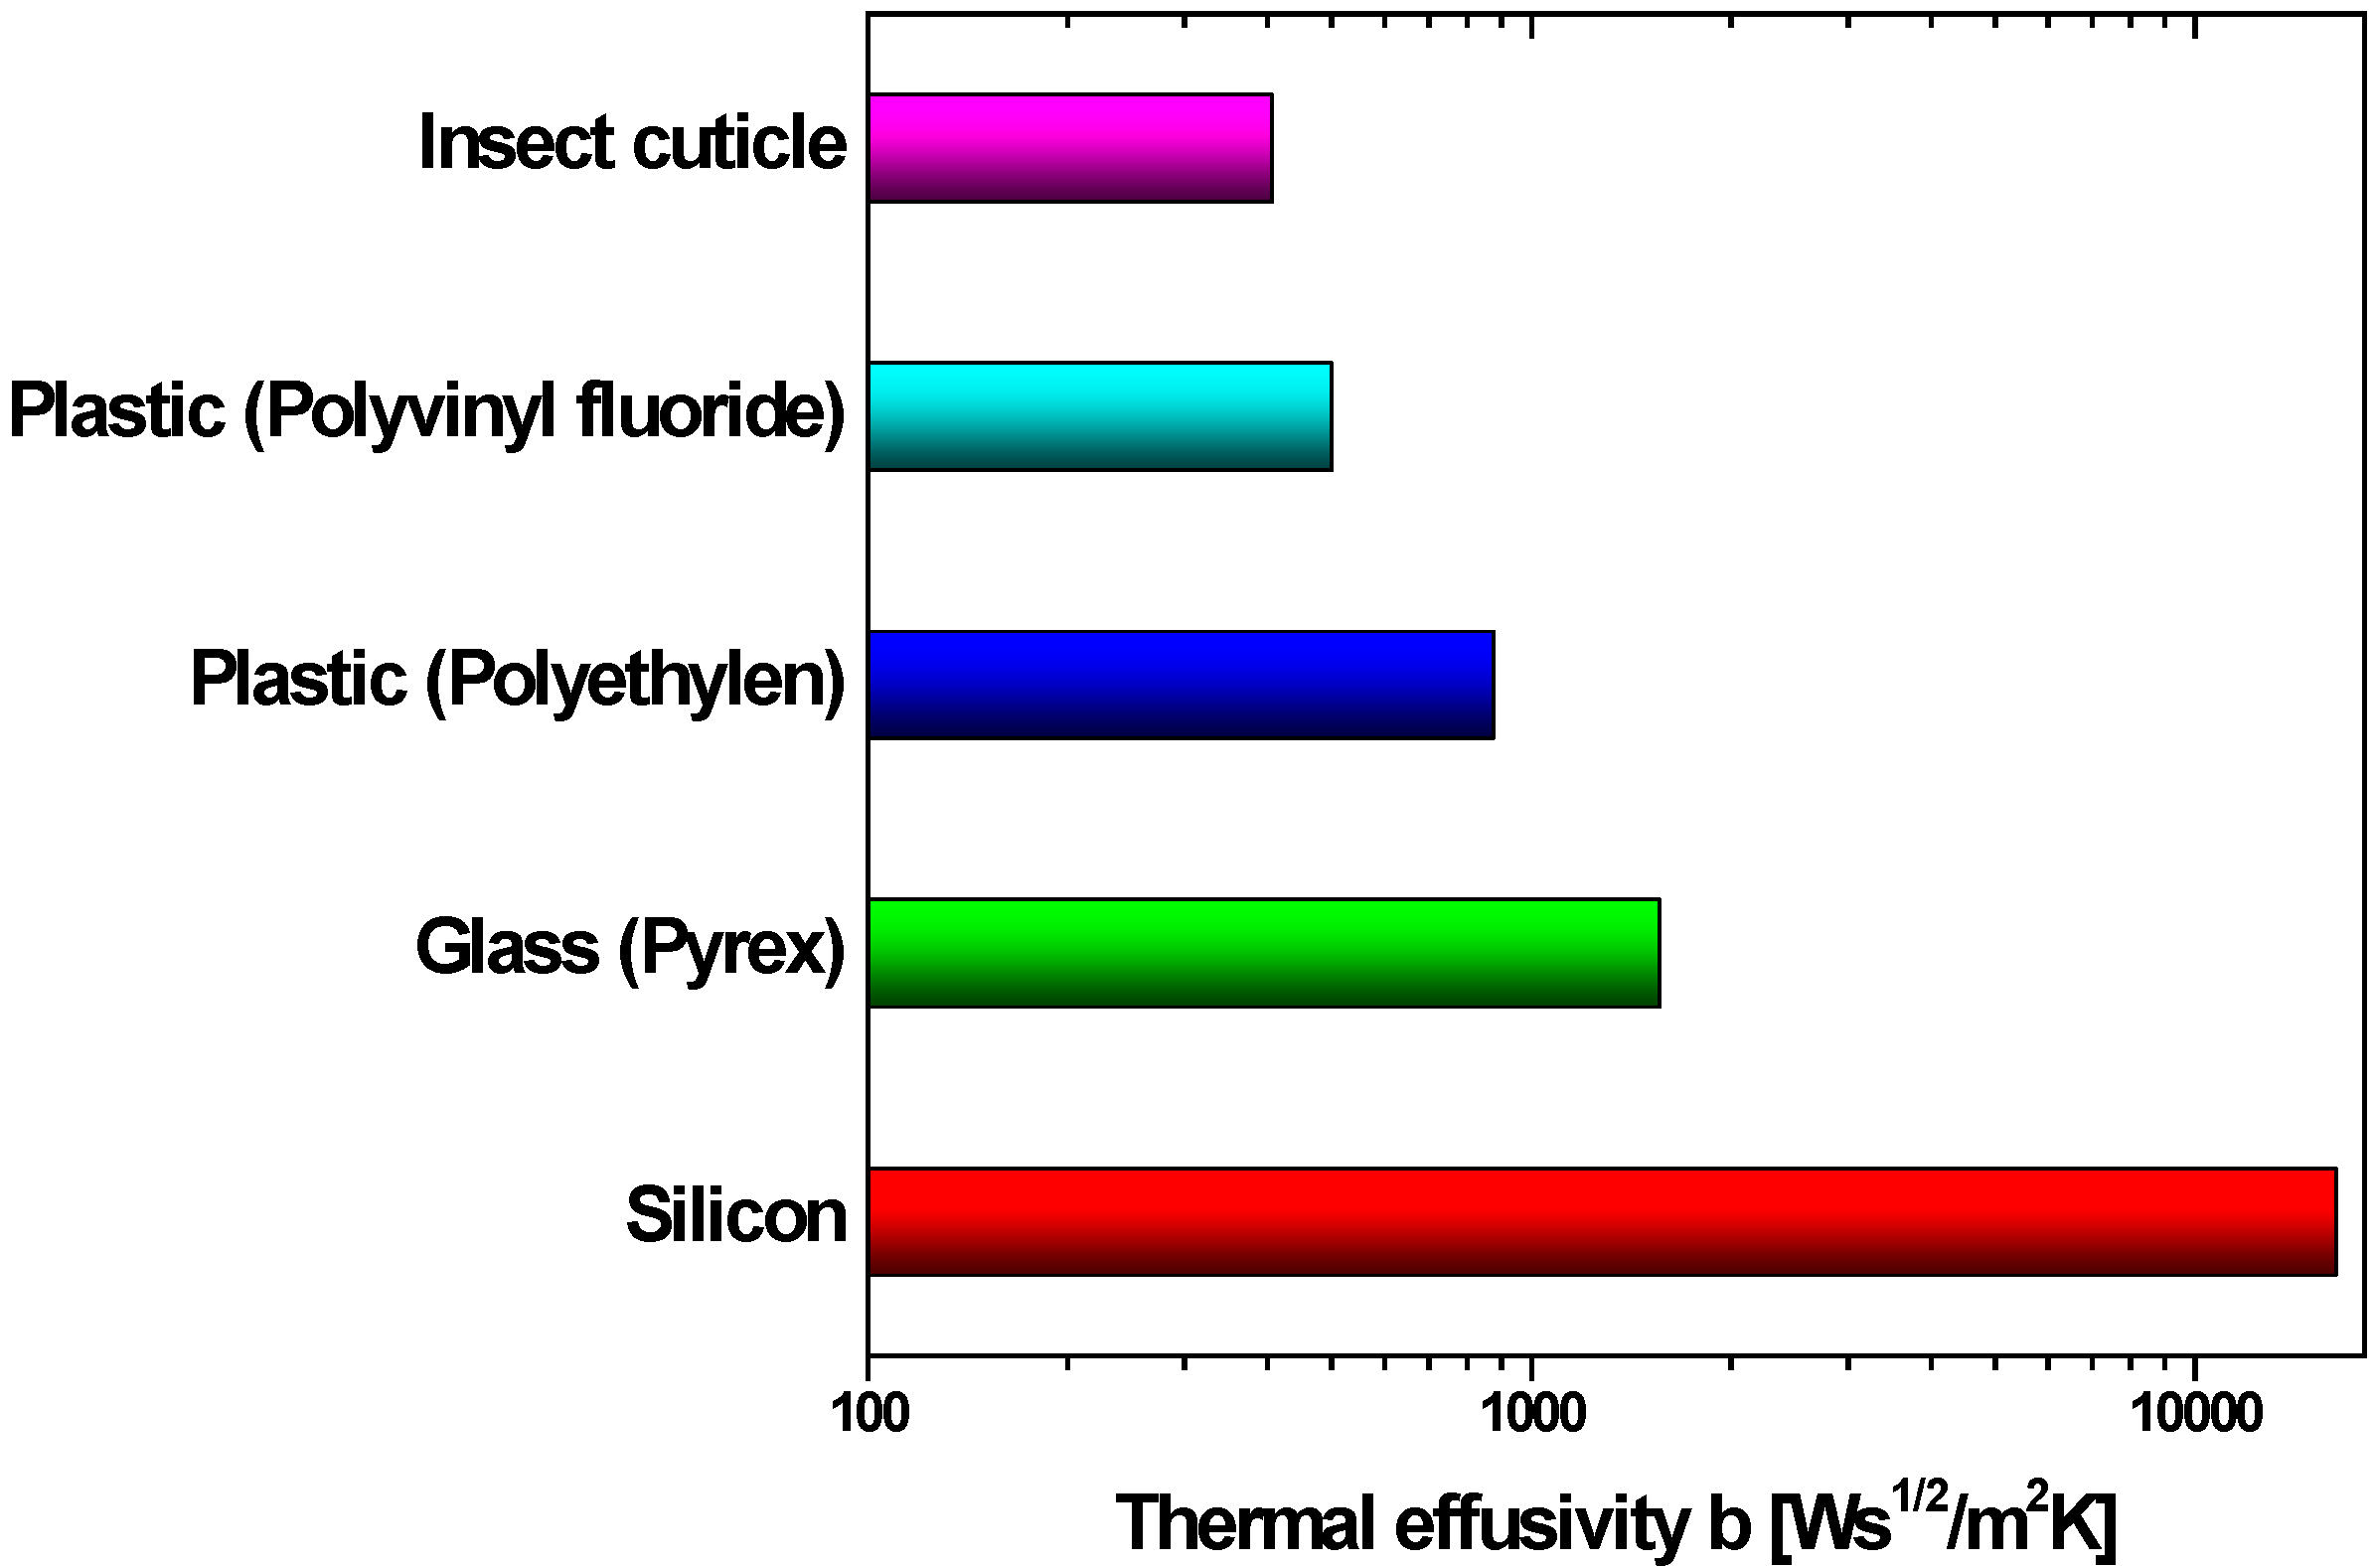
4.3.1. Cavity Material
4.3.2. Window Material
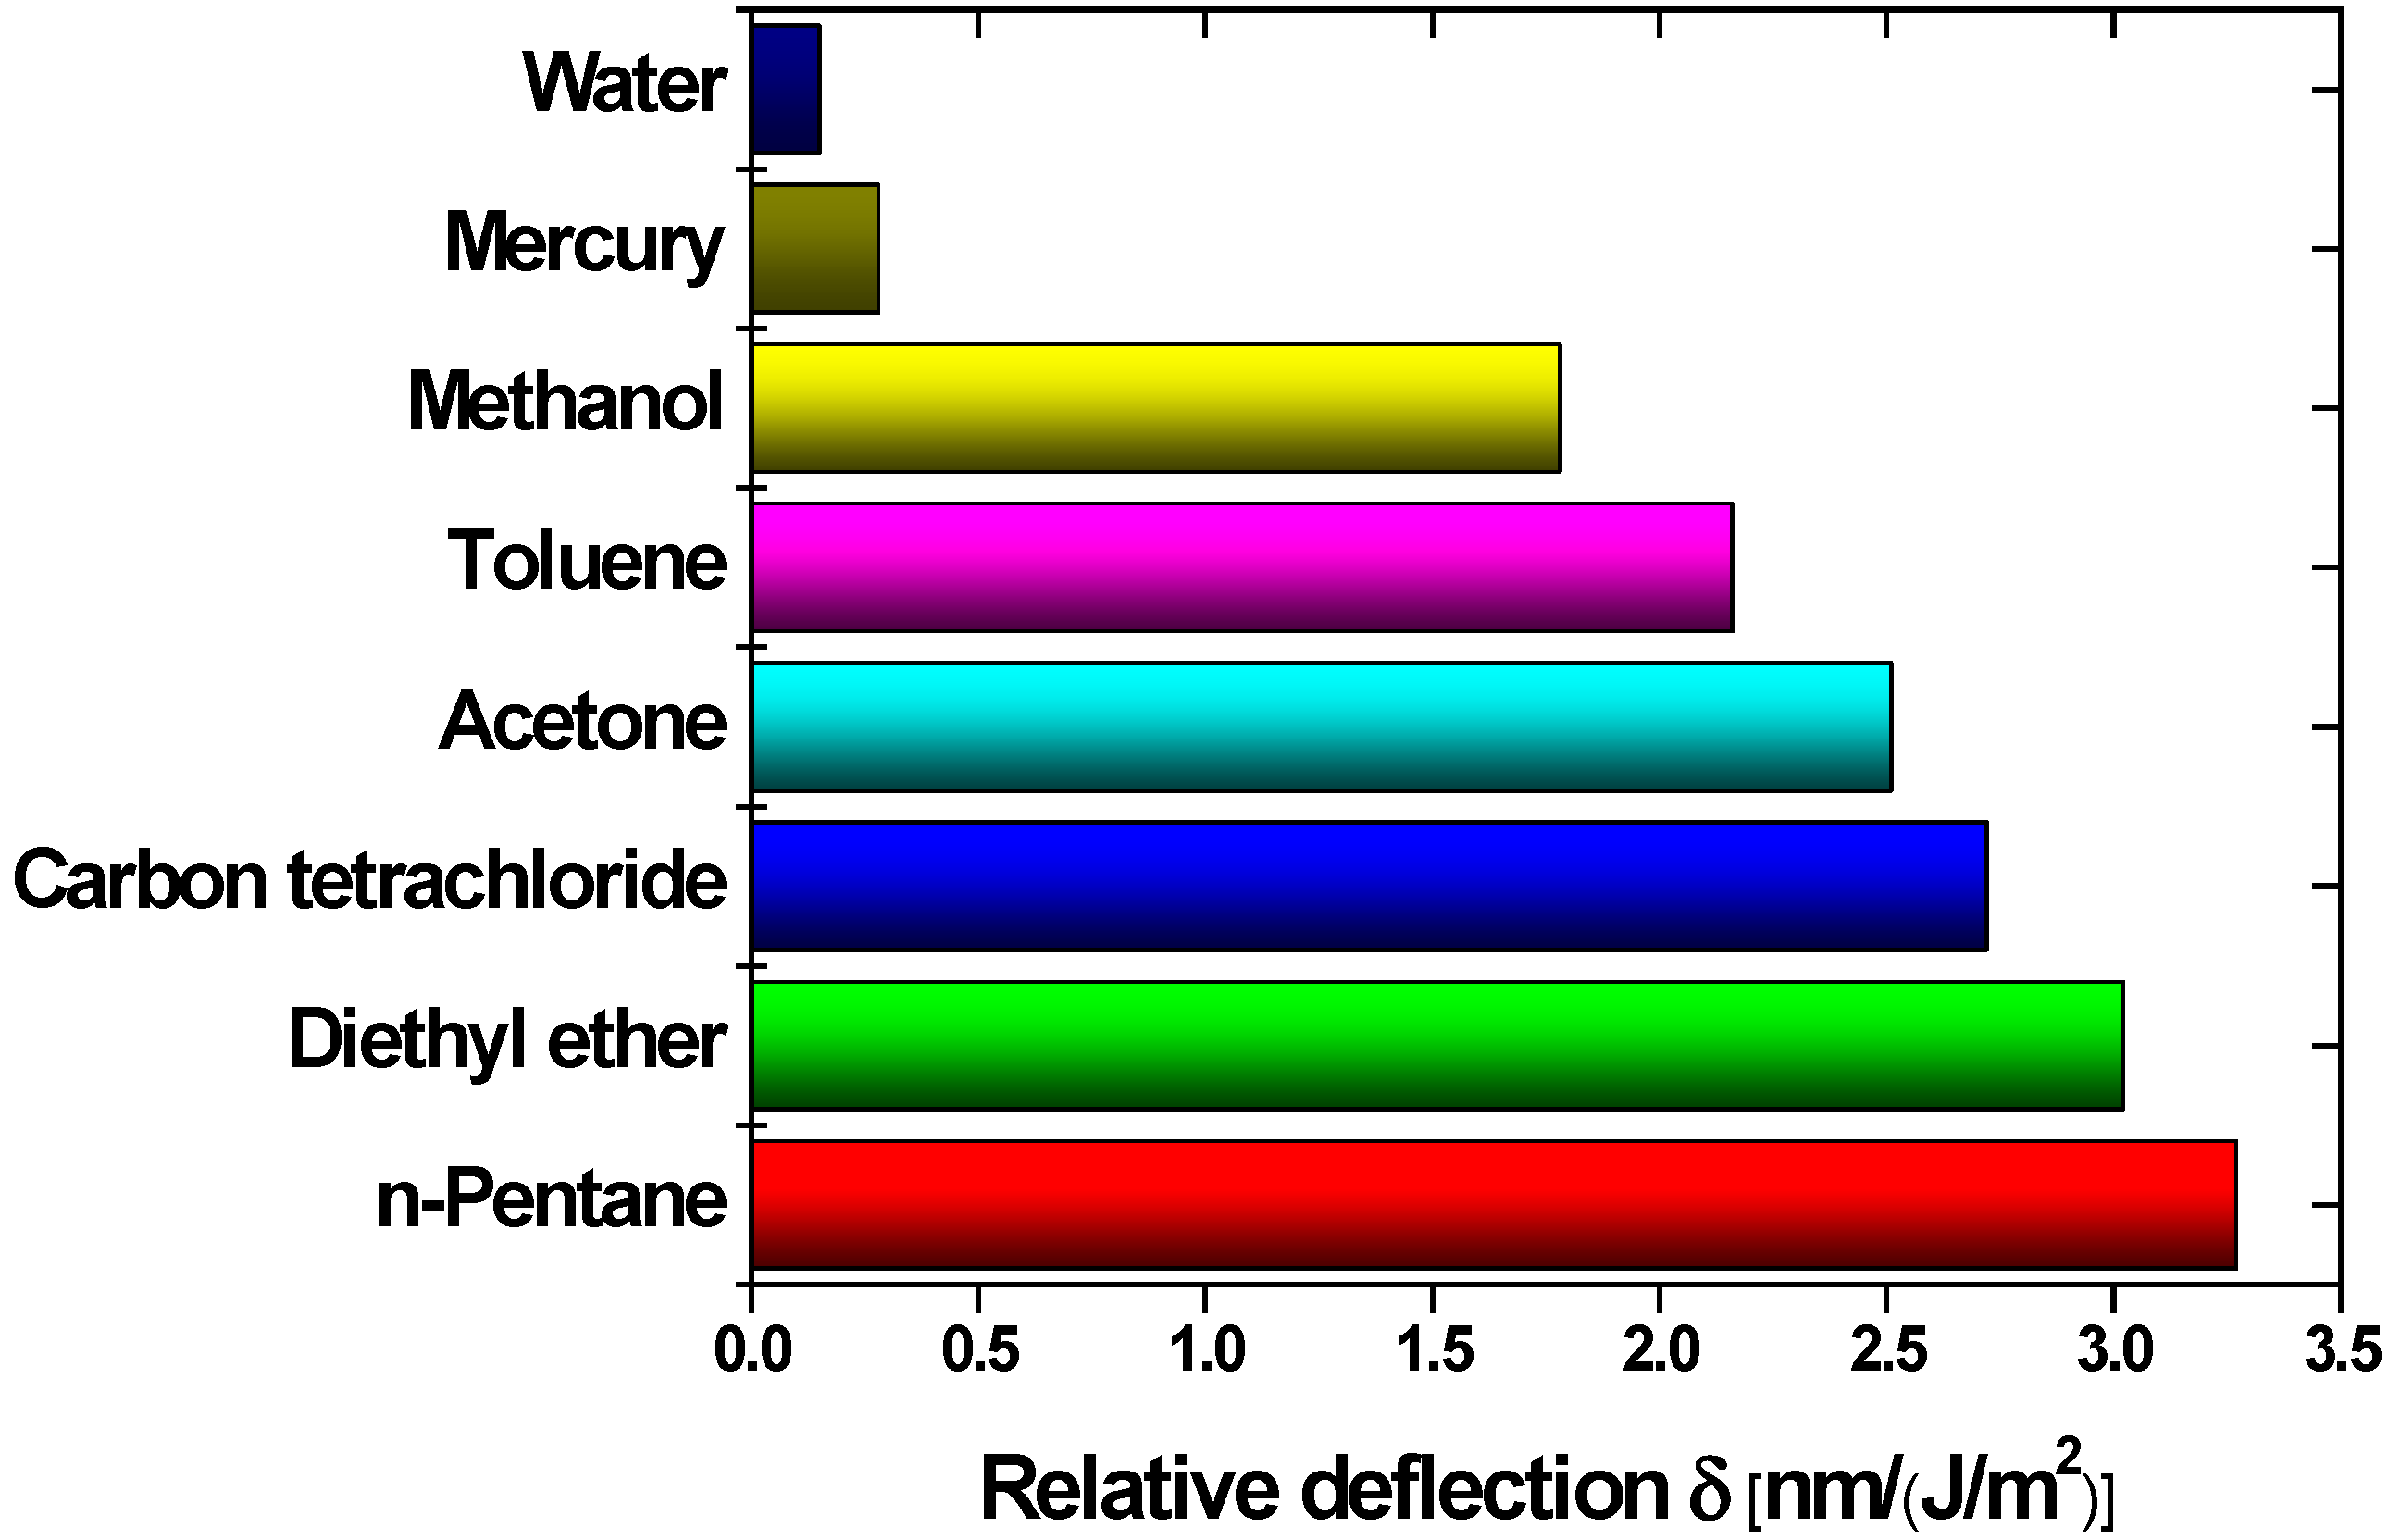
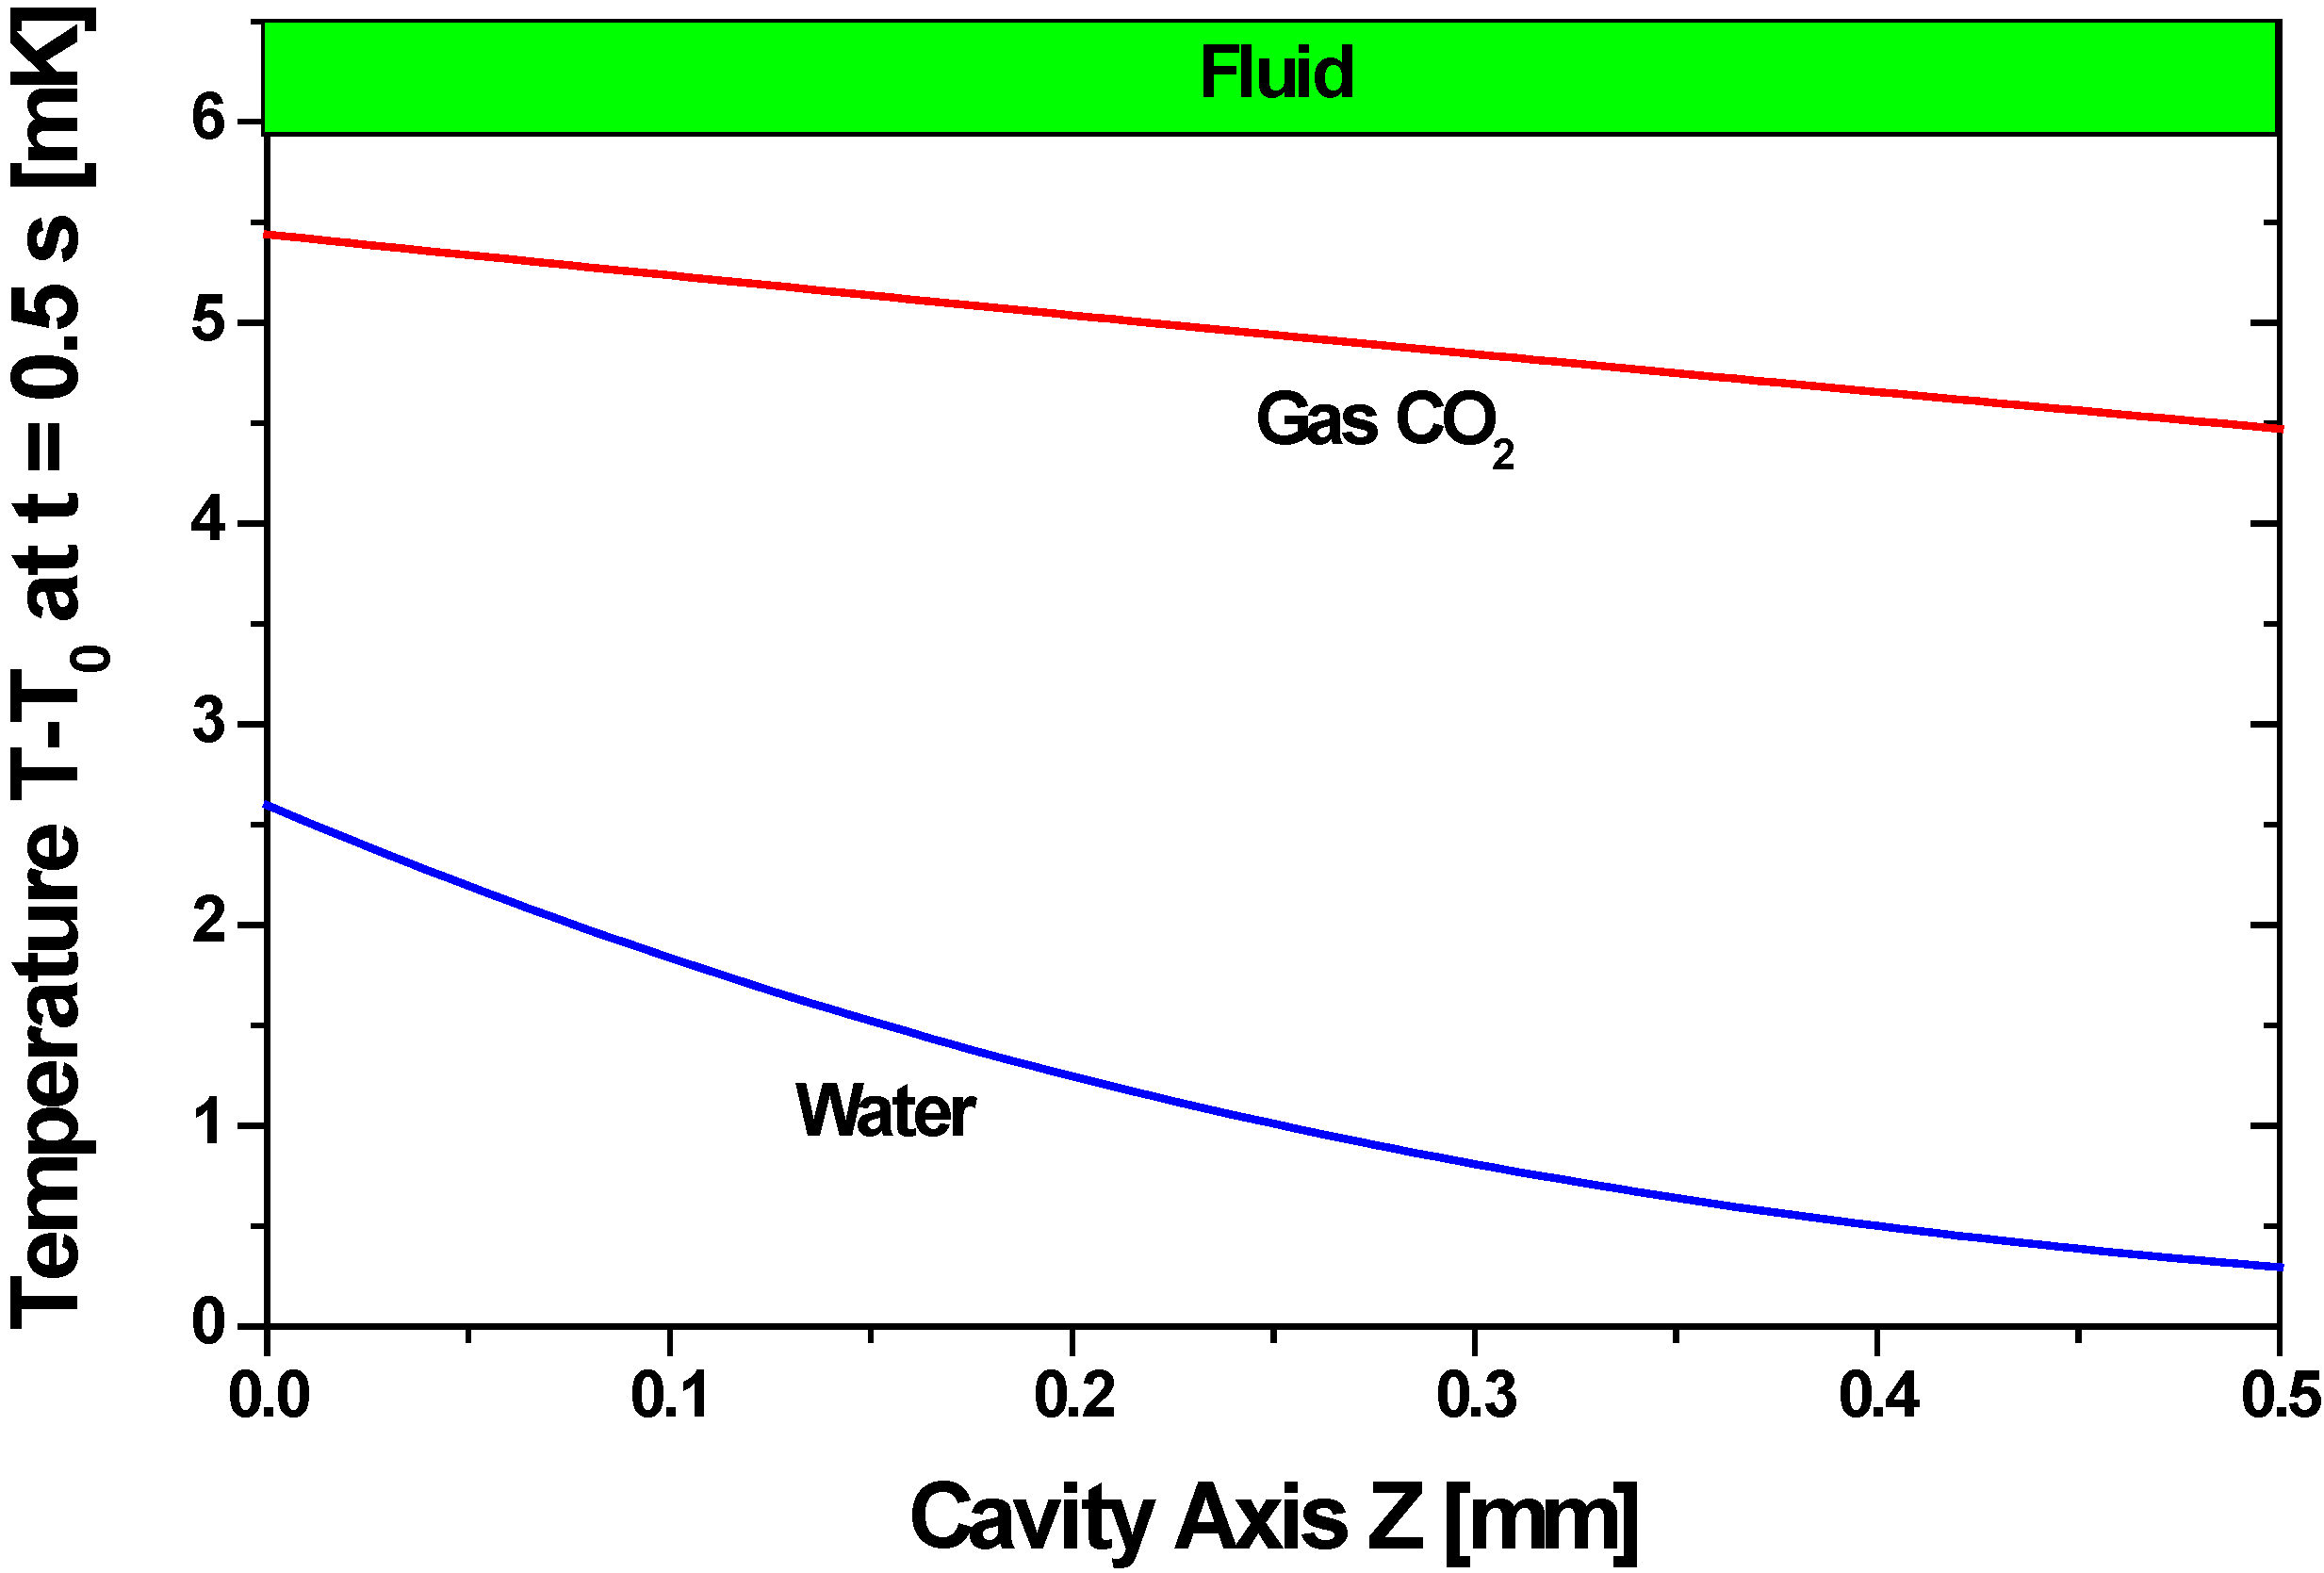
4.3.3. Liquid as Cavity Filling

| Compound | Absorption Coefficient (cm−1) |
|---|---|
| Water | 1140 |
| n-Pentane | 73 |
| Toluene | 94 |
| Methanol | 7 |
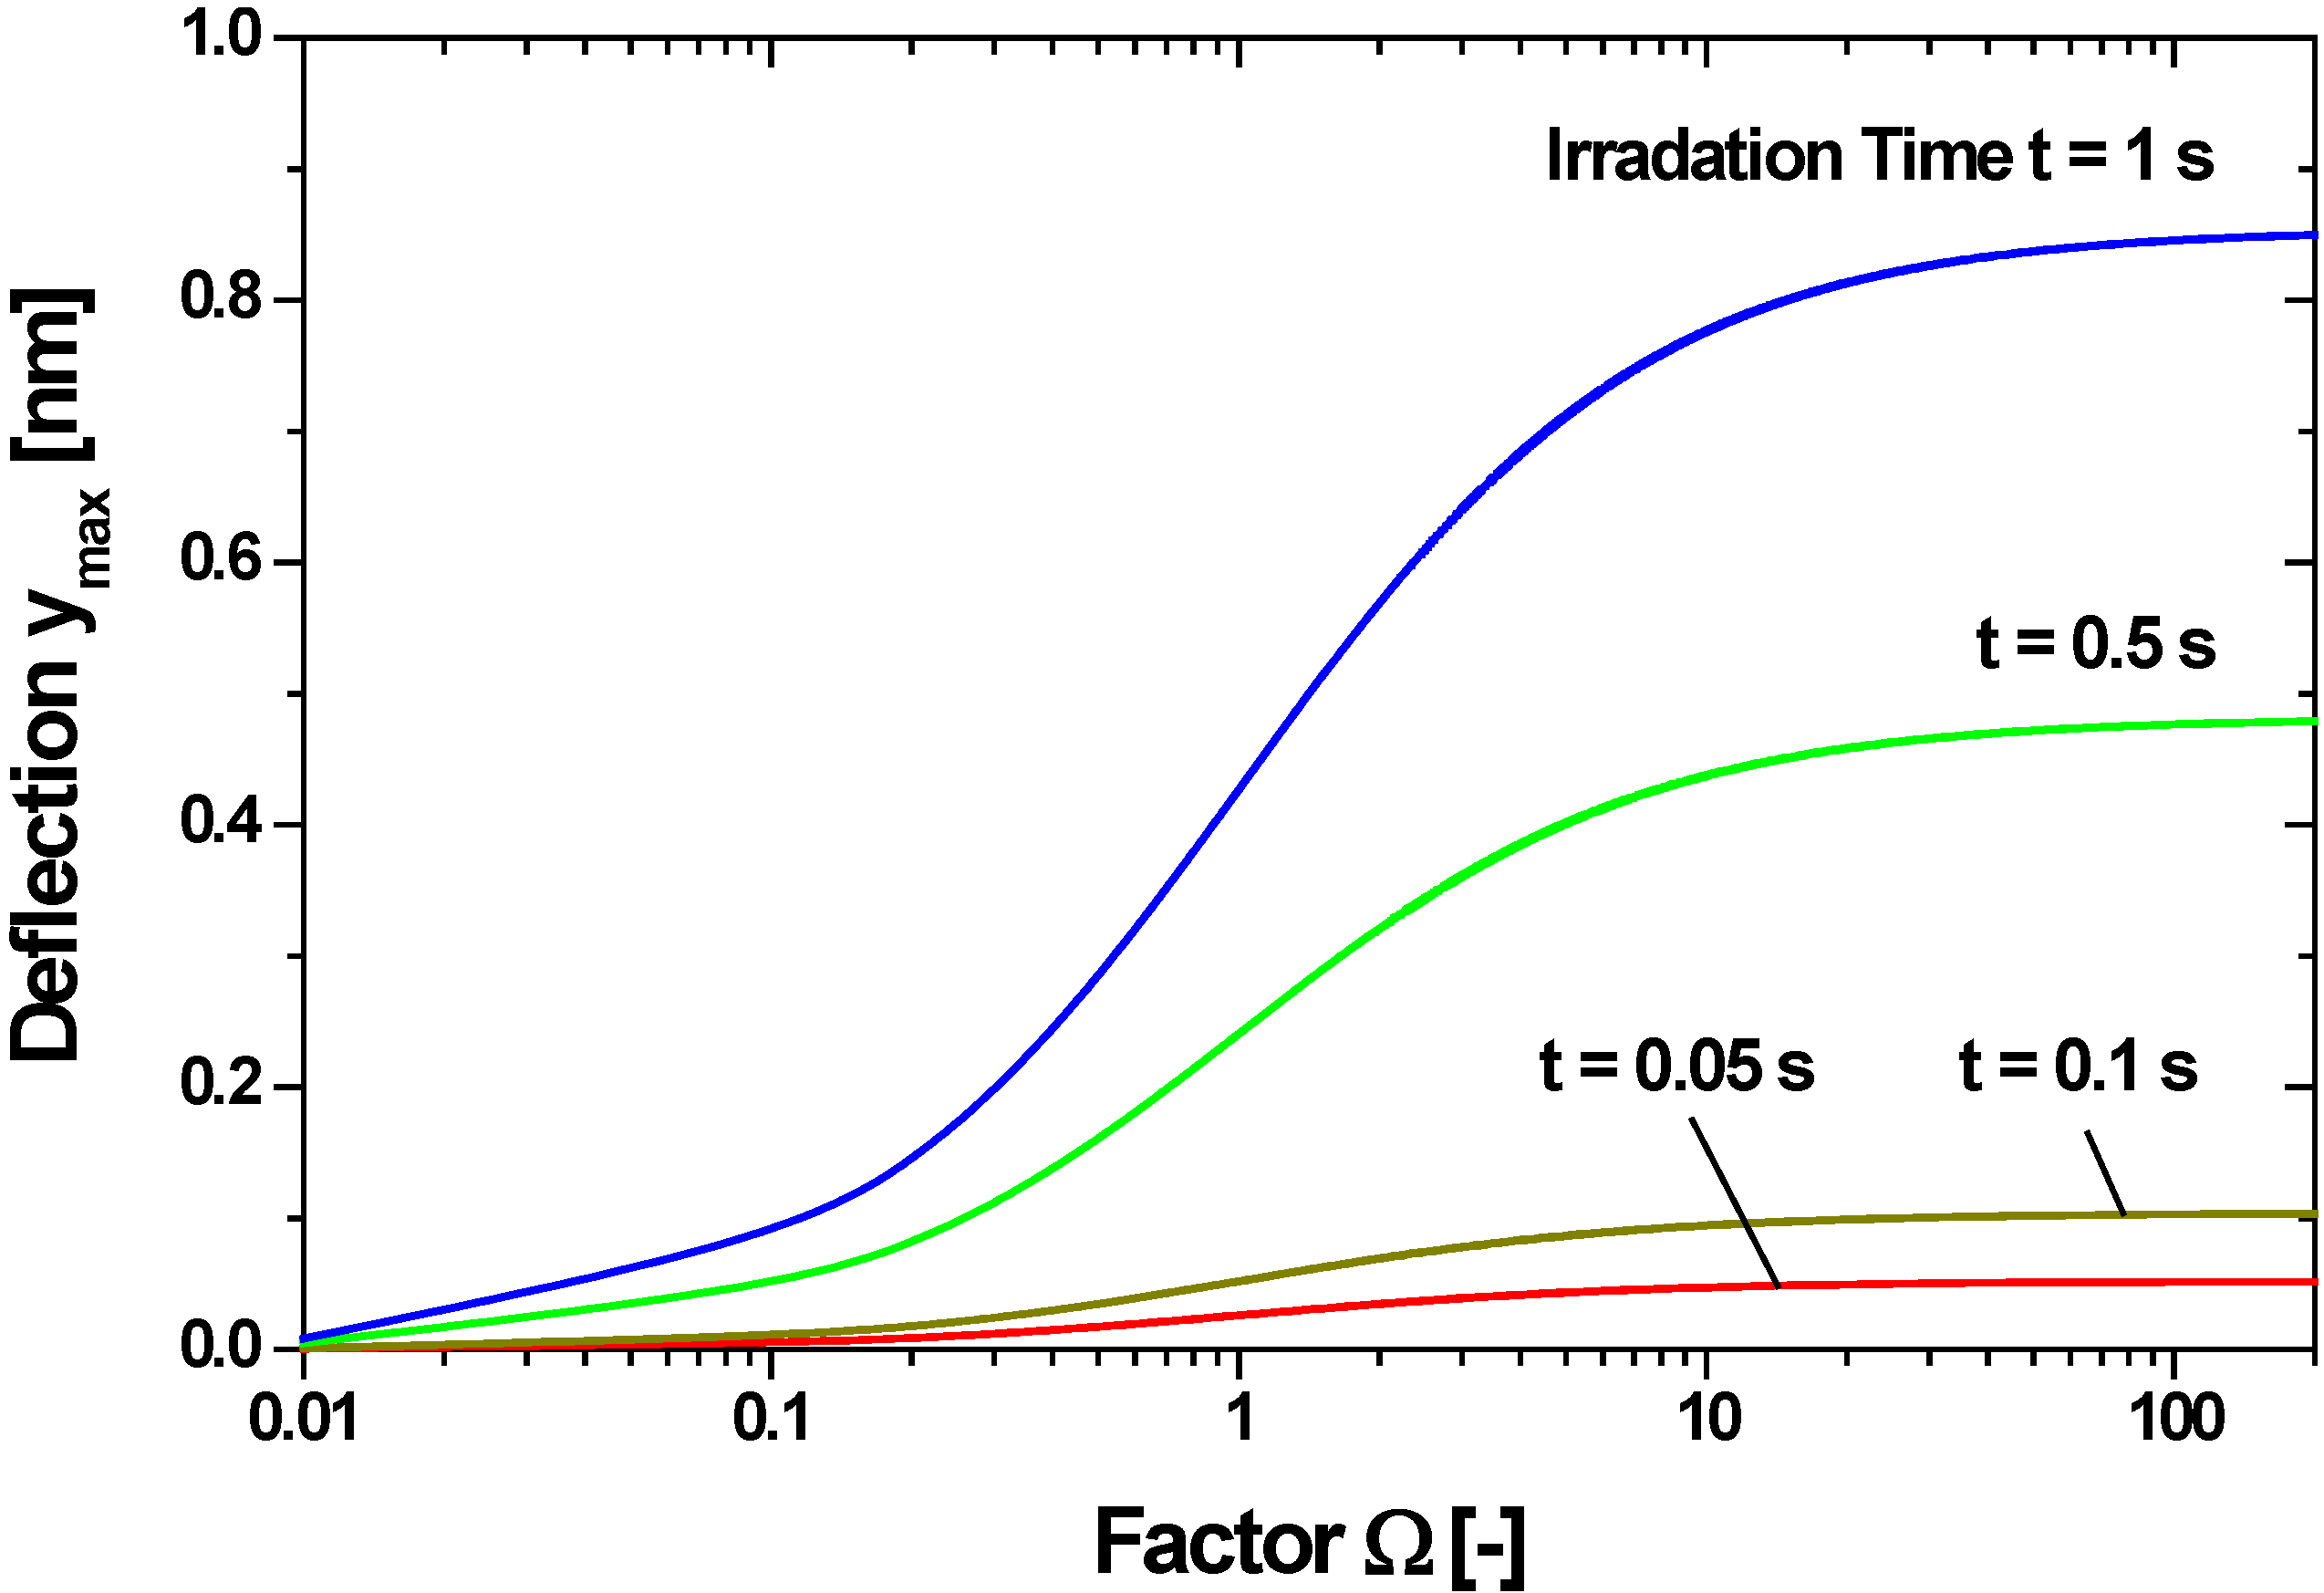
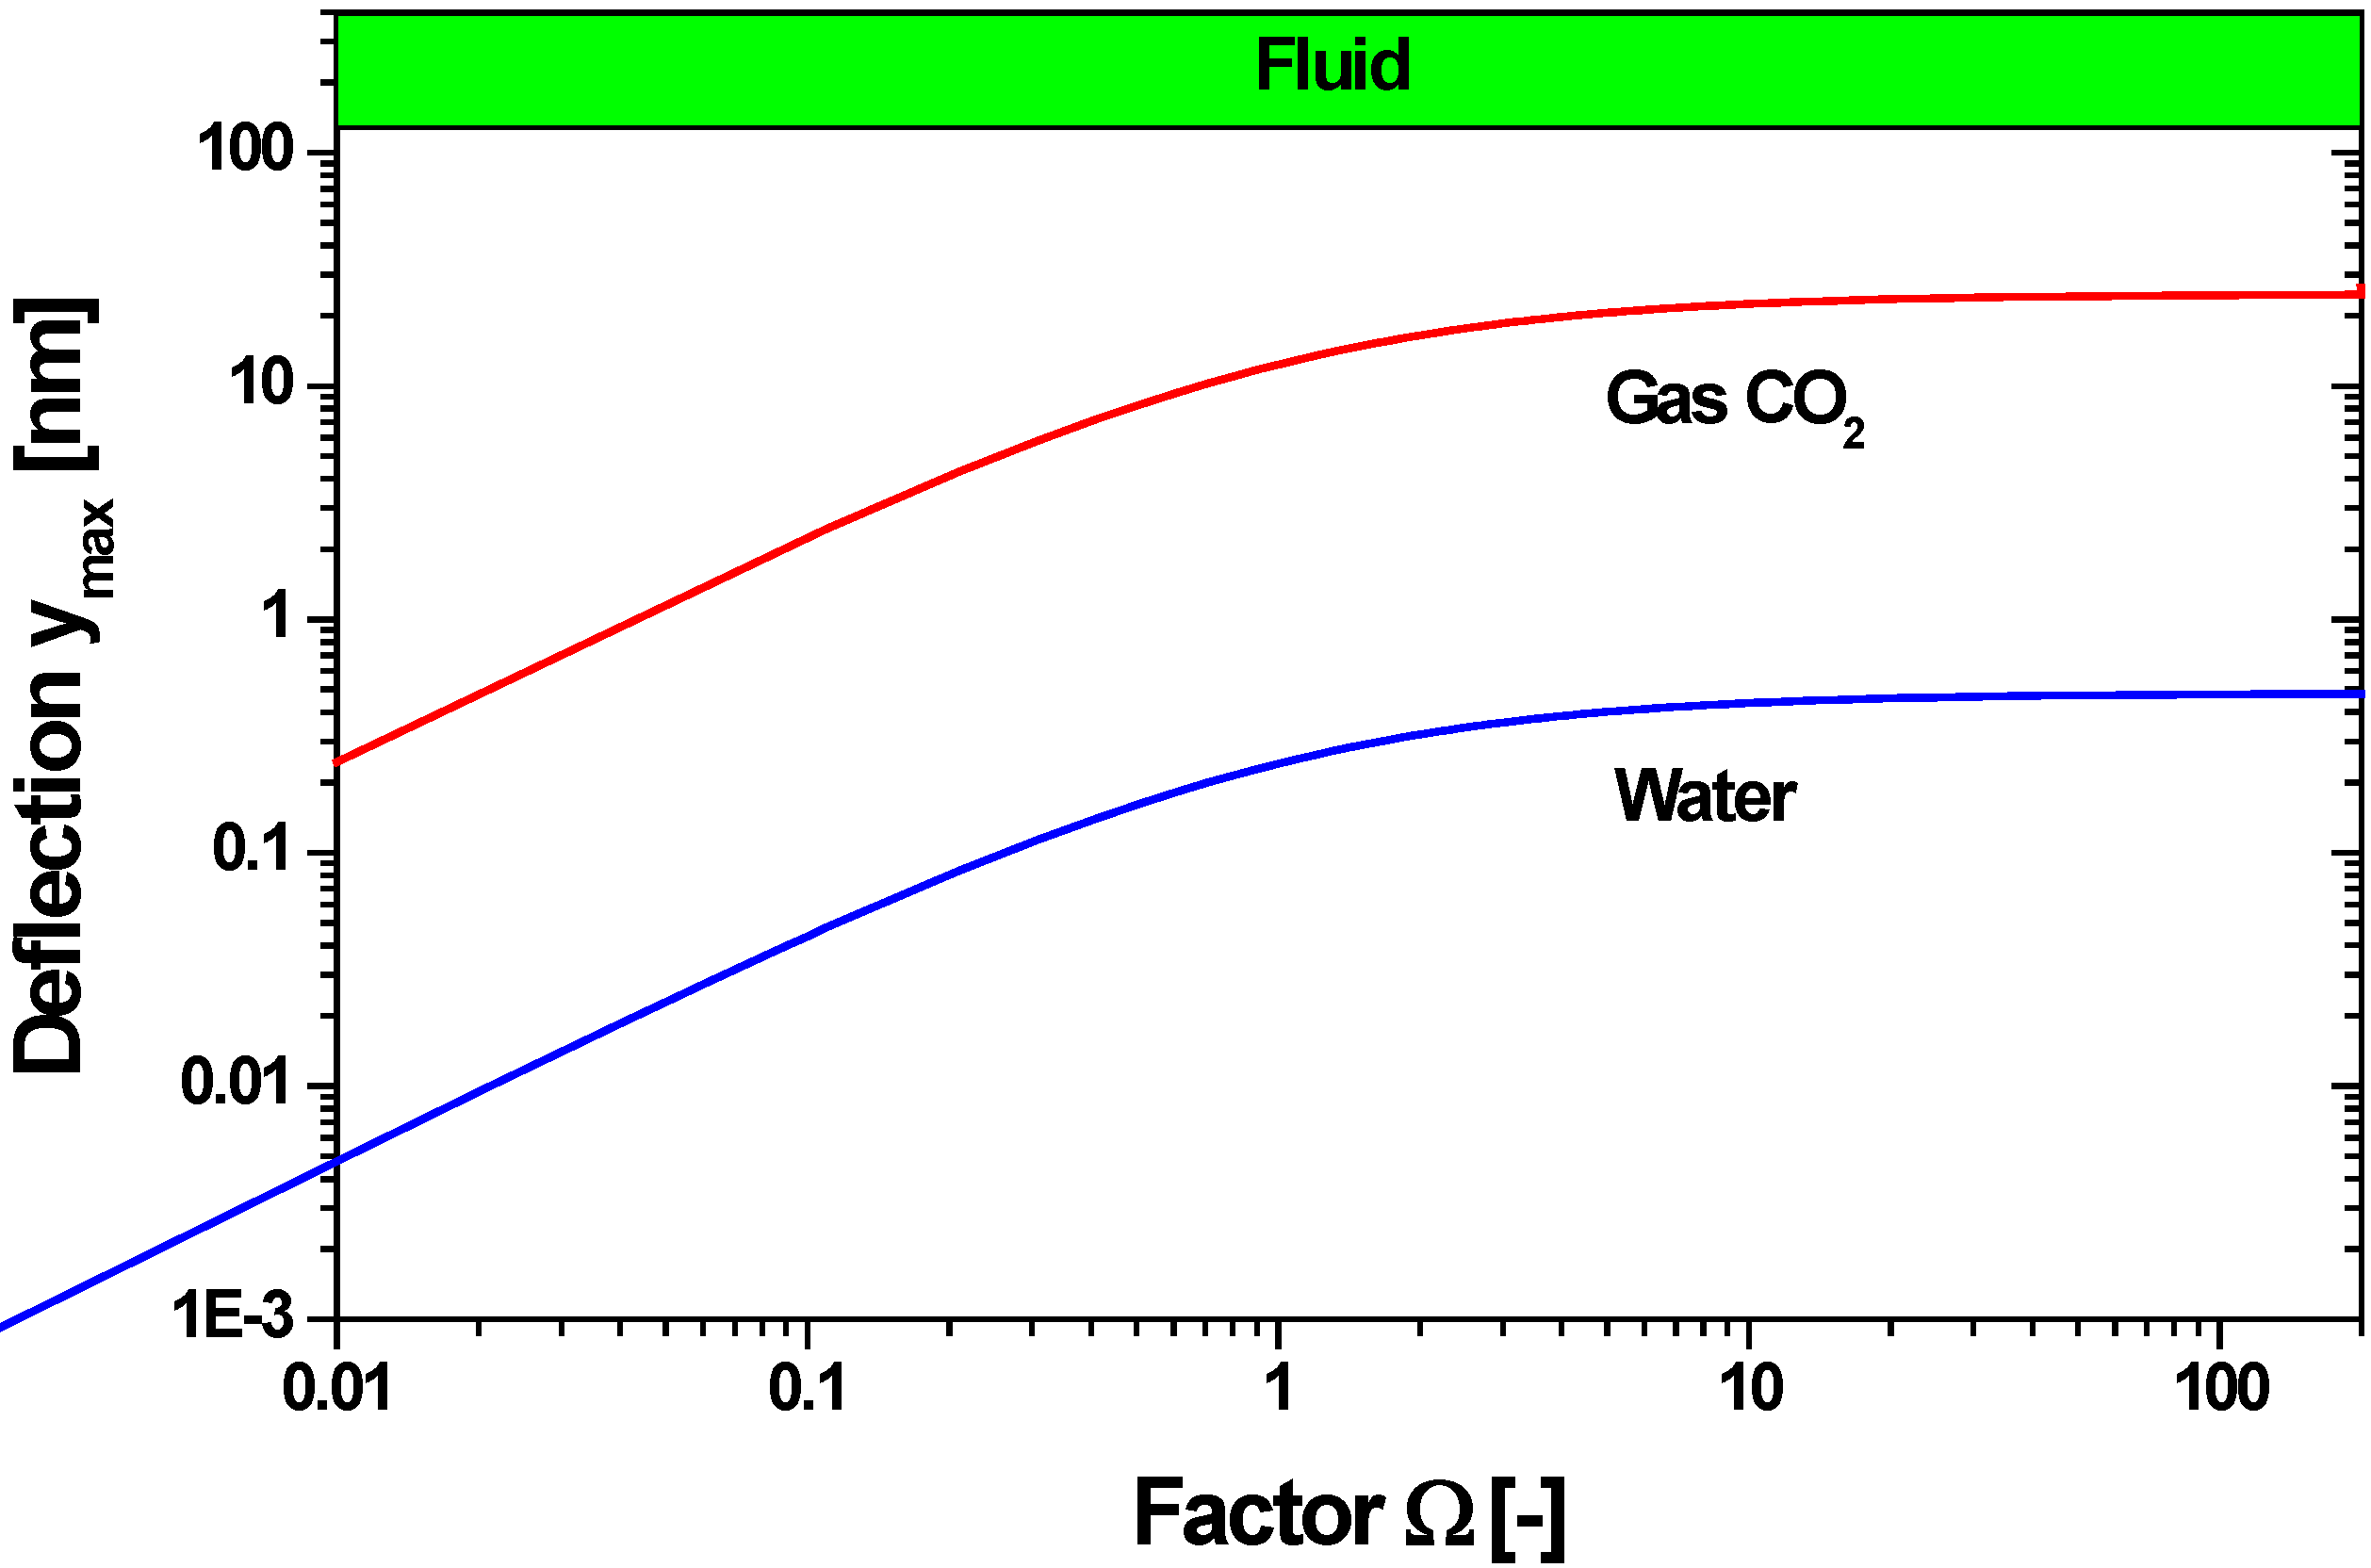
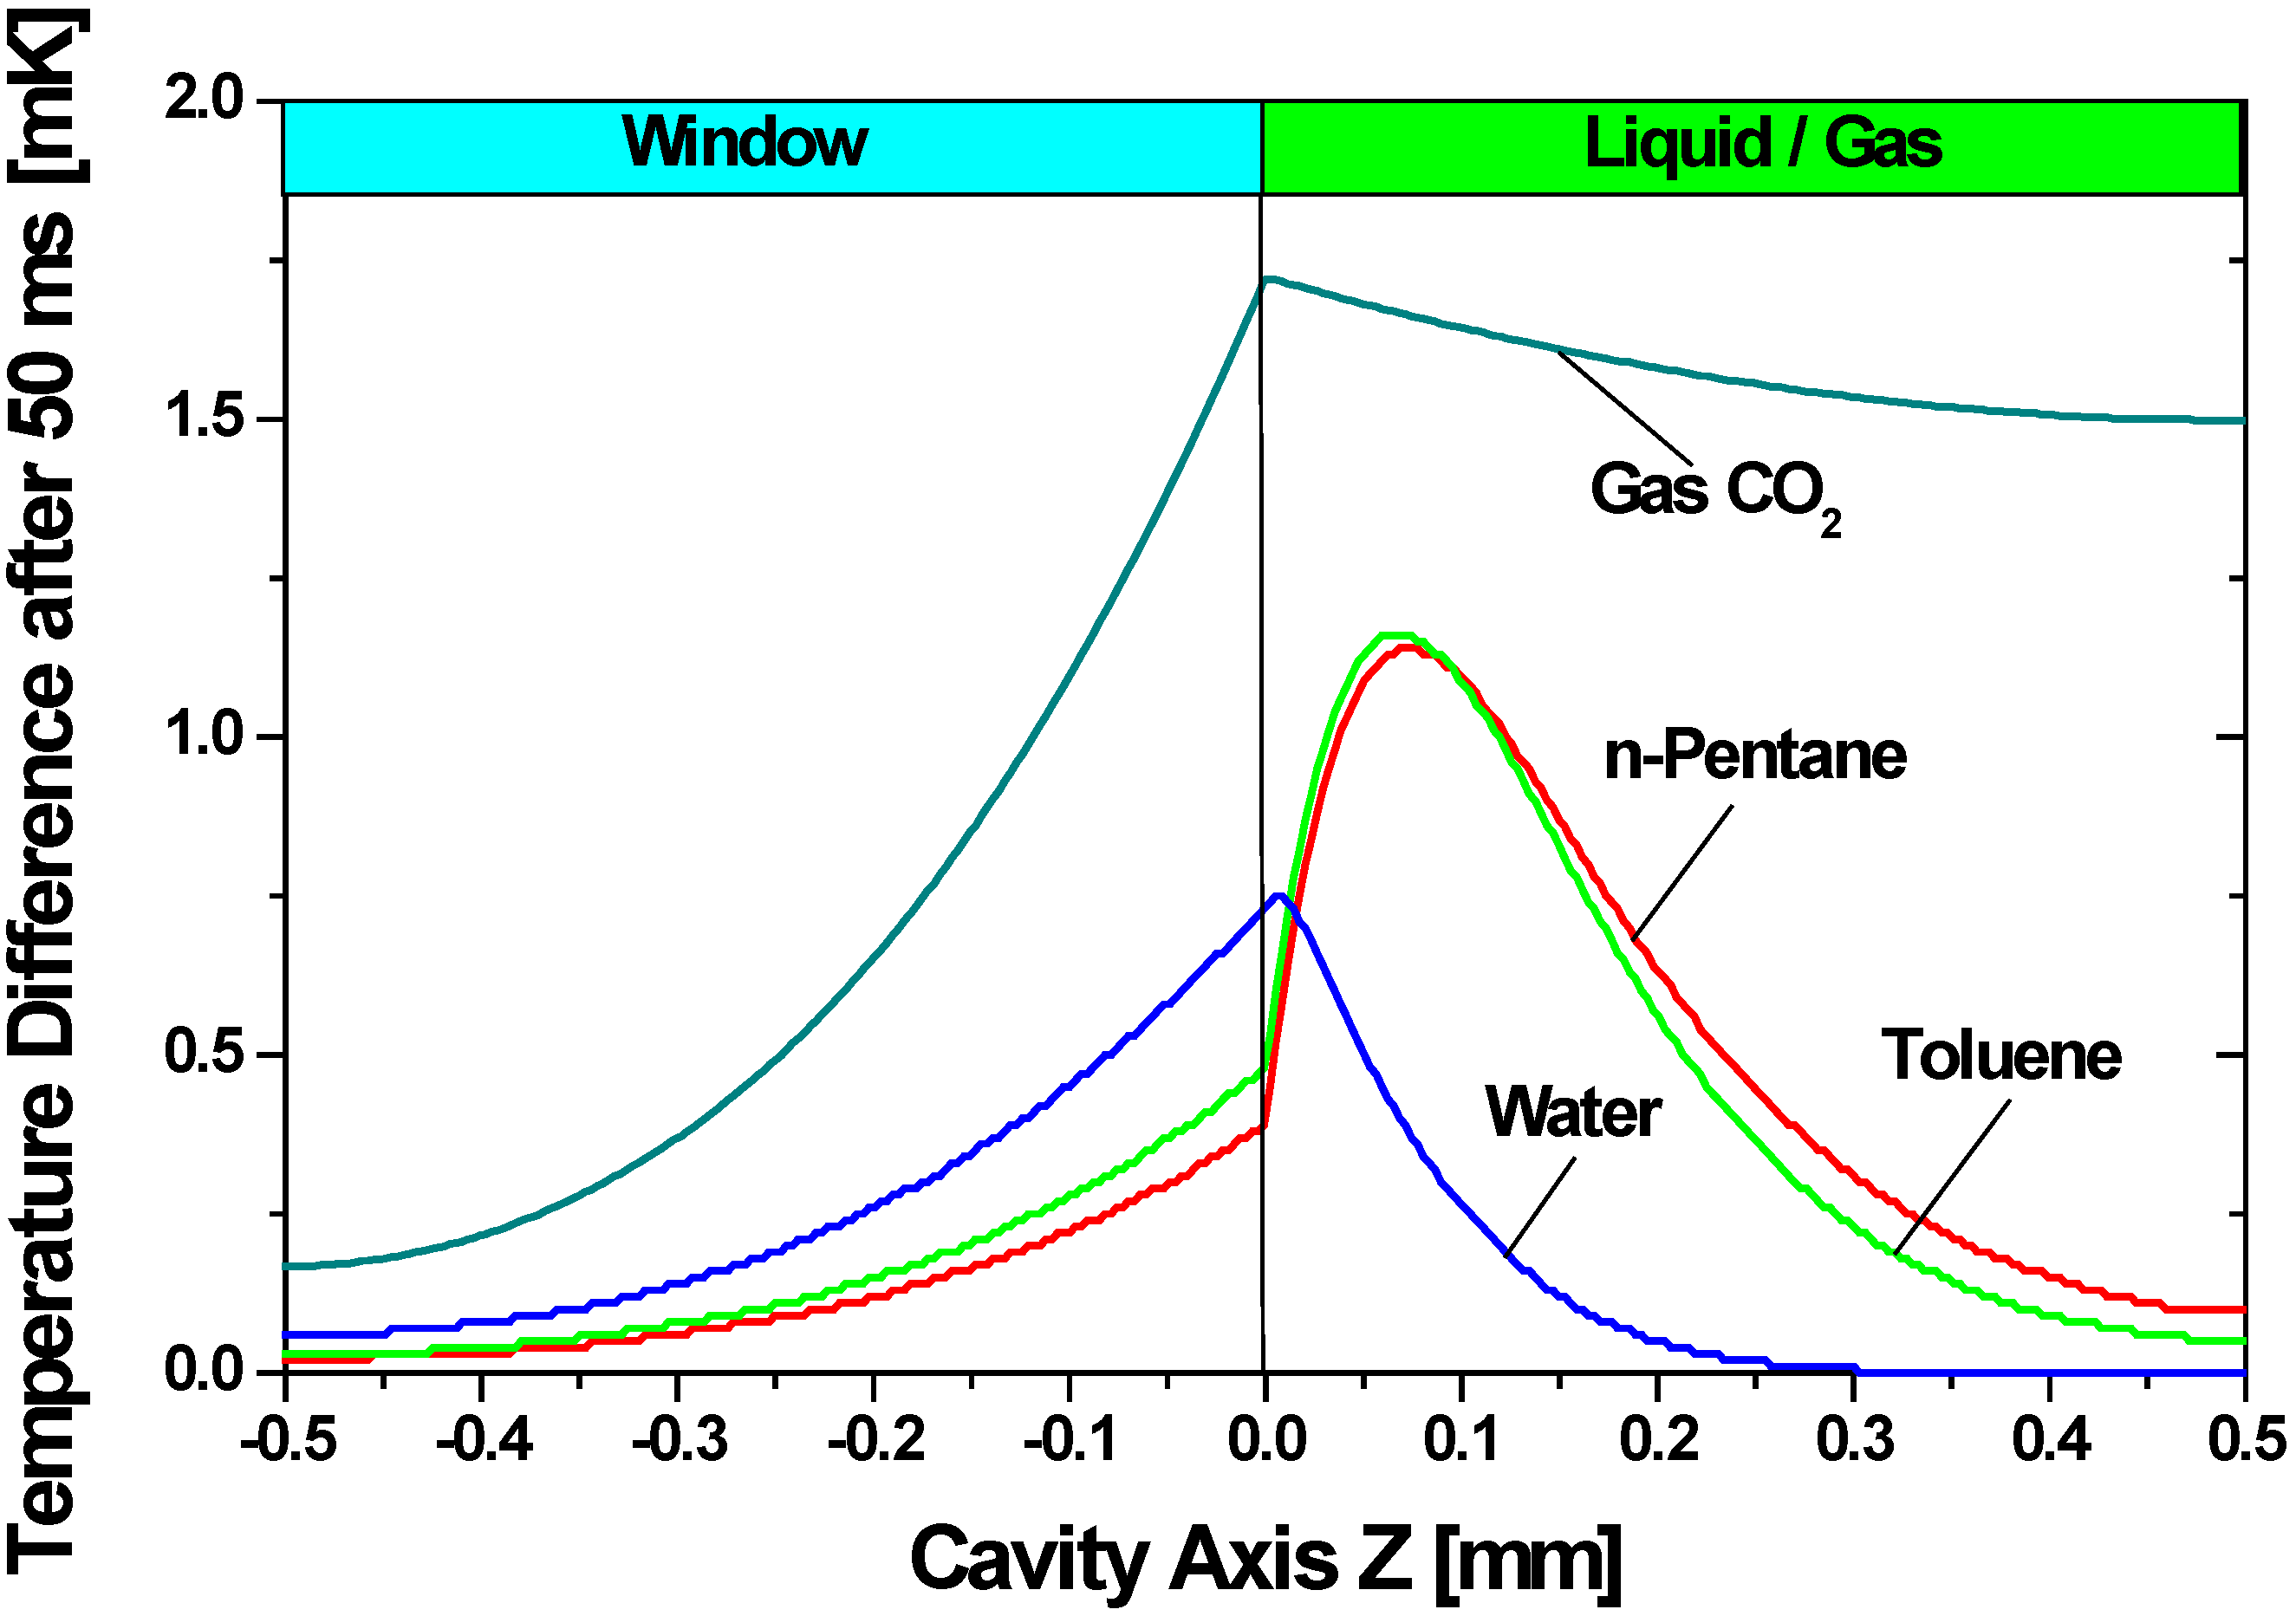
4.3.4. Gas as Cavity Filling

| Compound | ΔTmean (mK) | Ω | ymax (nm) |
|---|---|---|---|
| Water | 0.14 | 6245 | 0.04 |
| n-Pentane | 0.53 | 1126 | 1.26 |
| Toluene | 0.64 | 3093 | 1.03 |
| CO2, Gas | 1.57 | 0.281 | 2.18 |
4.3.5. Read-Out of the Membrane Deflection
4.3.6. Final Recommendation for the Design of the Sensor
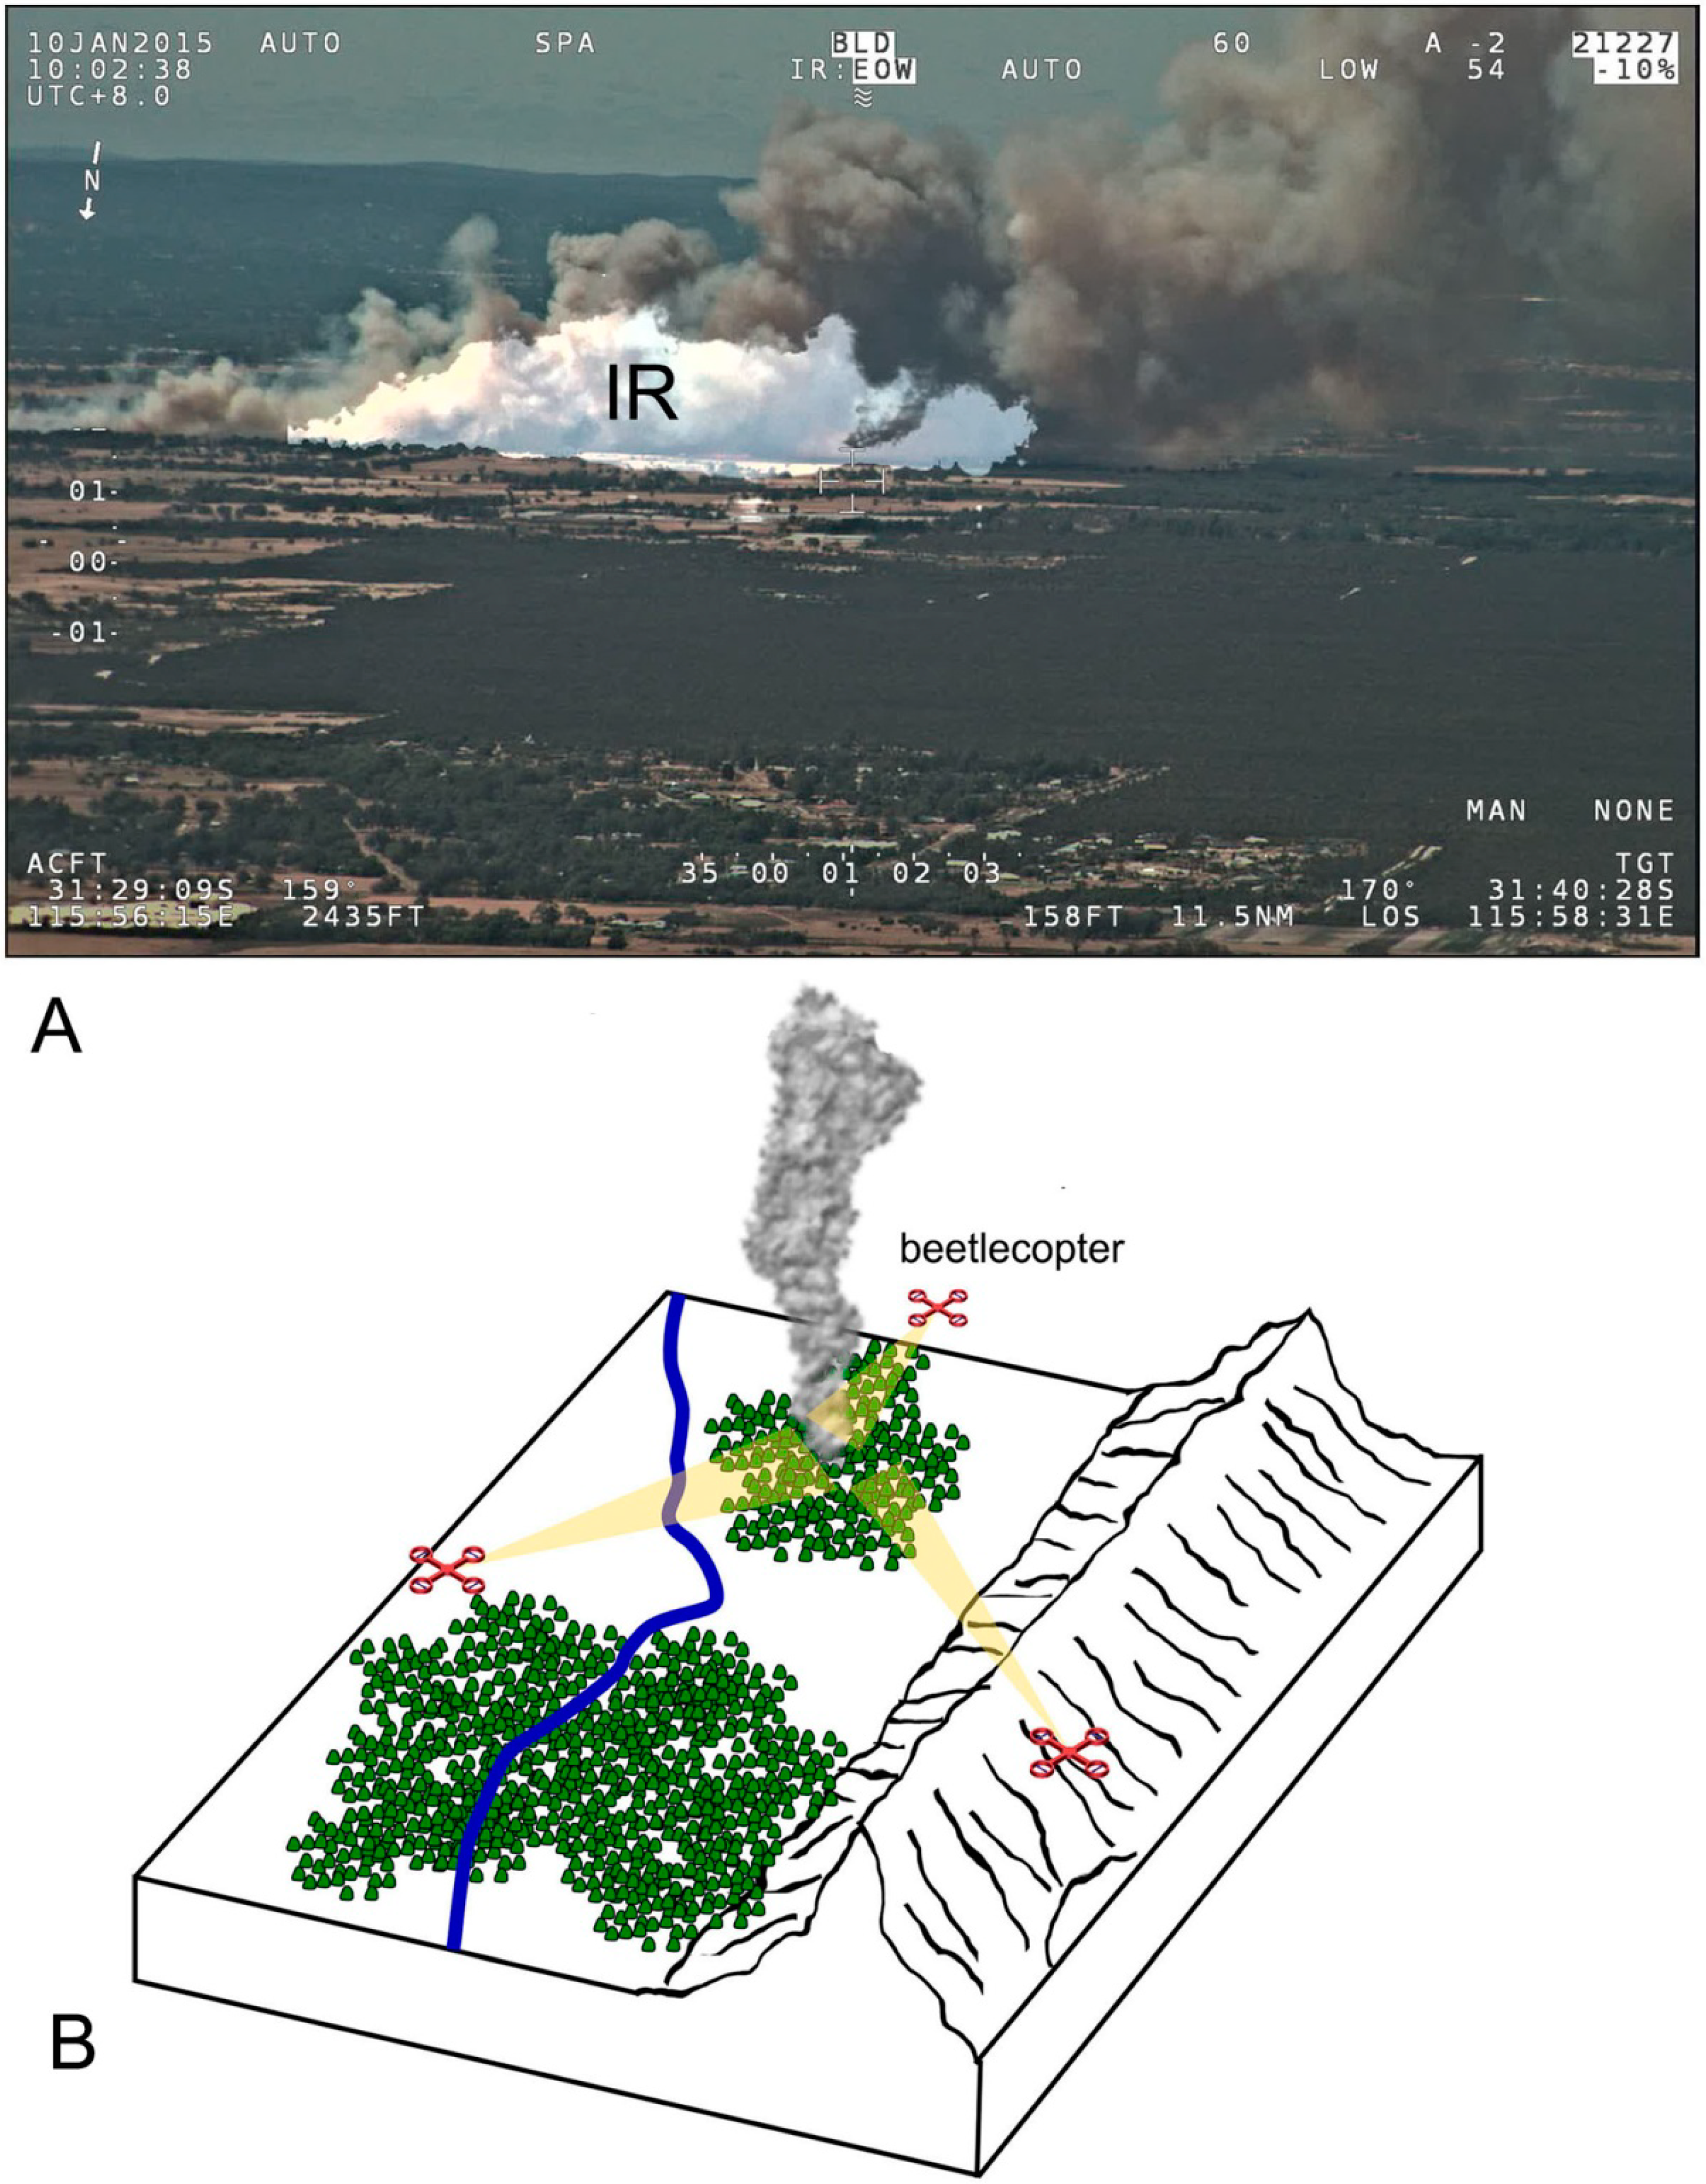
5. Discussion: Bioinspired Improvements of Fire-Detecting UAVs
- The drone is equipped with a high-resolution video camera and a highly sensitive image forming IR sensor.
- At adjustable times, the drone ascends from a base station to a preset height and—by turning through 360°—scans its surrounding area (1 or 2 min per search flight). Afterwards, the drone lands on its base station.
- If a fire is detected, an alarm is send to an earth station.
- Several drones can be used to establish a “beetlecopter” network suitable to monitor a large area (Figure 19B).

Acknowledgments
Author Contributions
Conflicts of Interest
References
- Economic Loss due to Mayor Forest and Wildfires Worldwide from 1900 to 2014; Centre for Resarch on the Epidemology of Desasters (CRED): Brussels, Belgium, 2014.
- Ashe, B.; McAneney, K.J.; Pitman, A.J. Total cost of fire in Australia. J. Risk Res. 2009, 12, 121–136. [Google Scholar] [CrossRef]
- Hirschberger, P. Wälder in Flammen—Ursachen und Folgen der Weltweiten Waldbrände; World Wildlife Fund Berlin: Berlin, Germany, 2011. (In German) [Google Scholar]
- Lloret, J.; Garcia, M.; Bri, D.; Sendra, S. A wireless sensor network deployment for rural and forest fire detection and verification. Sensors 2009, 9, 8722–8747. [Google Scholar] [CrossRef] [PubMed]
- Alkhatib, A.A.A. A review on forest fire detection techniques. Int. J. Distrib. Sens. Netw. 2014, 2014, 597368. [Google Scholar] [CrossRef]
- Martinez-de Dios, J.R.; Merino, L.; Caballero, F.; Ollero, A. Automatic forest-fire measuring using ground stations and unmanned aerial systems. Sensors 2011, 11, 6328–6353. [Google Scholar] [CrossRef] [PubMed]
- Schmitz, H.; Schmitz, A.; Schneider, E.S. Matched filter properties of infrared receptors used for fire and heat detection in insects. In The Ecology of Animal Senses: Matched Filtering for Economical Sensing; Warrant, G.V.D.E.E., Ed.; Springer-Verlag: Berlin, Heidelberg, Germany, 2015. [Google Scholar]
- Bellamy, C.L. A World Catalogue and Bibliography of the Jewel Beetels (Coleoptera: Buprestidae); Pensoft: Sofia, Bulgaria, 2008. [Google Scholar]
- Linsley, E.G. Attraction of Melanophila beetles by fire and smoke. J. Econ. Entomol. 1943, 36, 341–342. [Google Scholar] [CrossRef]
- Apel, K.-H. Die Kiefernprachtkäfer; Forschungsanstalt für Forst und Holzwirtschaft: Eberswalde, Germany, 1991. (In German) [Google Scholar]
- Horion, A. Faunistik der mitteleuropäischen Käfer, Bd. 4: Sternoxia (Buprestidae), Fossipedes, Macrodactylia, Brachymera. Entomol; Tutzing (Selbstverlag): München, Germany, 1955. (In German) [Google Scholar]
- Evans, W.G. Morphology of the infrared sense organ of Melanophila acuminata (buprestidae: Coleoptera). Ann. Entomol. Soc. Am. 1966, 59, 873–877. [Google Scholar] [CrossRef]
- Vondran, T.; Apel, K.-H.; Schmitz, H. The infrared receptor of Melanophila acuminata De Geer (Coleoptera: Buprestidae): Ultrastructural study of a unique insect thermoreceptor and its possible descent from a hair mechanoreceptor. Tissue Cell 1995, 27, 645–658. [Google Scholar] [CrossRef]
- Schmitz, H.; Bleckmann, H. The photomechanic infrared receptor for the detection of forest fires in the buprestid beetle Melanophila acuminata. J. Comp. Physiol. A 1998, 182, 647–657. [Google Scholar] [CrossRef]
- Schmitz, H.; Mürtz, M.; Bleckmann, H. Infrared detection in a beetle. Nature 1997, 386, 773–774. [Google Scholar] [CrossRef]
- Schmitz, A.; Sehrbrock, A.; Schmitz, H. The analysis of the mechanosensory origin of the infrared sensilla in Melanophila acuminata (Coleoptera: Buprestidae) adduces new insight into the transduction mechanism. Arthropod Struct. Develop. 2007, 36, 291–303. [Google Scholar] [CrossRef] [PubMed]
- French, A.S. Mechanotransduction. Ann. Rev. Physiol. 1992, 54, 135–152. [Google Scholar] [CrossRef] [PubMed]
- Thurm, U.; Erler, G.; Gödde, J.; Kastrup, H.; Keil, T.A. Cilia specialized for mechanoreception. J. Submicrosc. Cytol. 1983, 15, 151–155. [Google Scholar]
- Schmitz, H.; Mürtz, M.; Bleckmann, H. Responses of the infrared sensilla of Melanophila acuminata (Coleoptera: Buprestidae) to monochromatic infrared stimulation. J. Comp. Physiol. A Sens. Neural Behav. Physiol. 2000, 186, 543–549. [Google Scholar] [CrossRef]
- Van Dyke, E.C. Buprestid swarming. Pan Pac. Ent. 1926, 3, 41. [Google Scholar]
- Schmitz, H.; Bousack, H. Modelling a historic oil-tank fire allows an estimation of the sensitivity of the infrared receptors in pyrophilous Melanophila beetles. PloS ONE 2012, 7, e37627. [Google Scholar] [CrossRef] [PubMed]
- Pastor, E.; Zarate, L.; Planas, E.; Arnaldos, J. Mathematical models and calculation systems for the study of wildland fire behaviour. Prog. Energy Combust. Sci. 2003, 29, 139–153. [Google Scholar] [CrossRef]
- Rossi, J.L.; Chetehouna, K.; Collin, A.; Moretti, B.; Balbi, J.H. Simplified flame models and prediction of the thermal radiation emitted by a flame front in an outdoor fire. Combust. Sci. Technol. 2010, 182, 1457–1477. [Google Scholar] [CrossRef]
- Sullivan, A.L.; Ellis, P.F.; Knight, I.K. A review of radiant heat flux models used in bushfire applications. Int. J. Wildland Fire 2003, 12, 101–110. [Google Scholar] [CrossRef]
- Siegel, R.; Howell, J.R.; Menguc, M.P. Thermal Radiation Heat Transfer, 5th ed.; Taylor and Francis: Oxford, UK, 2010. [Google Scholar]
- Knight, I.K.; Sullivan, A.L. A semi-transparent model of bushfire flames to predict radiant heat flux. Int. J. Wildland Fire 2004, 13, 201–207. [Google Scholar] [CrossRef]
- Cruz, M.G.; Butler, B.W.; Viegas, D.X.; Palheiro, P. Characterization of flame radiosity in shrubland fires. Combust. Flame 2011, 158, 1970–1976. [Google Scholar] [CrossRef]
- Midgley, S.; Tan, Z. A methodology for determining minimum separation distance between a structure and bushfire hazard. In Proceedings of Bushfire Conference 2006: Life In A Fire-Prone Environment: Translating Science into Practice, Brisbane, Australia, 5–9 June 2006.
- Wotton, B.M.; McAlpine, R.S.; Hobbs, M.W. The effect of fire front width on surface fire behaviour. Int. J. Wildland Fire 2000, 9, 247–253. [Google Scholar] [CrossRef]
- Planning for Bushfire Protection—A Guide for Councils, Planners, Fire Authorities, Developers and Home Owners; NSW Rural Fire Service: Sydney, Australia, 2001.
- Cruz, M.G.; Alexander, M.E.; Wakimoto, R.H. Development and testing of models for predicting crown fire rate of spread in conifer forest stands. Can. J. For. Res. 2005, 35, 1626–1639. [Google Scholar] [CrossRef]
- Noble, I.R.; Bary, G.A.V.; Gill, A.M. Mcarthur fire-danger meters expressed as equations. Aust. J. Ecol. 1980, 5, 201–203. [Google Scholar] [CrossRef]
- Construction of Buildings in Bushfire-Prone Areas; Australian Standard 3959; Standards Australia: Sydney, NSW, Australia, 2009.
- McCaw, W.L.; Gould, J.S.; Cheney, N.P. Existing fire behaviour models under-predict the rate of spread of summer fires in open jarrah (Eucalyptus marginata) forest. Aust. For. 2008, 71, 16–26. [Google Scholar] [CrossRef]
- Tan, Z.; Midgley, S. A stochastic model for assessing bush fire attack on the buildings in bush fire prone areas. In Proceedings of The 18th World IMACS Congress and MODSIM09 International Congress on Modelling and Simulation, Cairns, Australia, 13–17 July 2009; pp. 289–295.
- Dowdy, A.J.; Mills, G.A.; Finkele, K.; de Groot, W. Australian Fire Weather as Represented by the Mcarthur Forest Fire Danger Index and the Canadian Forest Fire Weather Index; CAWCR Technical Report No. 10; The Centre for Australian Weather and Climate Research: Melbourne, Autralia, 2009. [Google Scholar]
- Budzier, H.; Gerlach, G. Thermal Infrared Sensors: Theory, Optimization and Practice; Wiley: West Sussex, UK, 2010. [Google Scholar]
- PerkinElmer. Infrared Sensing Technologies 008900_01; PerkinElmer: Waltham, MA, USA, 2009. [Google Scholar]
- Hänggi, P. Stochastic resonance in biology—How noise can enhance detection of weak signals and help improve biological information processing. Chem. Phys. Chem. 2002, 3, 285–290. [Google Scholar] [CrossRef]
- Wiesenfeld, K.; Moss, F. Stochastic resonance and the benefits of noise—From ice ages to crayfish and squids. Nature 1995, 373, 33–36. [Google Scholar] [CrossRef] [PubMed]
- Adali, T.; Haykin, S.S. Adaptive Signal Processing: Next Generation Solutions; Wiley-IEEE: Hoboken, NJ, USA, 2010. [Google Scholar]
- Jafari, M.G.; Chambers, J.A. Adaptrive noise cancellation and blind source separation. In Proceedings of 4th International Symposium on Independent Component Analysis and Blind Signal Separation (ICA2003), Nara, Japan, 1–4 April 2003; pp. 627–632.
- Johnson, M.T.; Povinelli, R.J. Generalized phase space projection for nonlinear noise reduction. Physica D 2005, 201, 306–317. [Google Scholar] [CrossRef]
- Golay, M.J.E. A pneumatic infra-red detector. Rev. Sci. Instrum. 1947, 18, 357–362. [Google Scholar] [CrossRef] [PubMed]
- Chevrier, J.B.; Baert, K.; Slater, T. An infrared pneumatic detector made by micromachining technology. J. Micromech. Microeng. 1995, 5, 193–195. [Google Scholar] [CrossRef]
- Kenny, T.W.; Reynolds, J.K.; Podosek, J.A.; Vote, E.C.; Miller, L.M.; Rockstad, H.K.; Kaiser, W.J. Micromachined infrared sensors using tunneling displacement transducers. Rev. Sci. Instrum. 1996, 67, 112–128. [Google Scholar] [CrossRef]
- Weast, R.C. CRC Handbook of Chemistry and Physics, 1st ed.; CRC Press: Boca Raton, FL, USA, 1988. [Google Scholar]
- Szabo, I. Höhere Technische Mechanik: Nach Vorlesungen, 6th ed.; Springer: Berlin, Germany, 2000. (In German) [Google Scholar]
- Timoshenko, S.P.; Woinowsky-Krieger, S. Theory of Plates and Shells, 2nd ed.; McGraw-Hill: New York, NY, USA, 1959. [Google Scholar]
- Schmitz, H.; Kahl, T.; Soltner, H.; Bousack, H. Biomimetic infrared sensors based on the infrared receptors of pyrophilous insects. Proc. SPIE 2011, 7975. [Google Scholar] [CrossRef]
- Soltner, H.; Bousack, H.; Schmitz, H. Zur transienten temperaturentwicklung in einem fluidischen infrarot-detektor aud der basis der infrarotempfindlichen sensillen des schwarzen kiefernprachtkäfers melanophia acuminata. In Proceedings of Mikrosystemtechnik Kongress 2009, Berlin, Germany, 12–14 October 2009; pp. 401–404.
- Klocke, D.; Schmitz, A.; Soltner, H.; Bousack, H.; Schmitz, H. Infrared receptors in pyrophilous (“fire loving”) insects as model for new un-cooled infrared sensors. Beilstein J. Nanotechnol. 2011, 2, 186–197. [Google Scholar] [CrossRef] [PubMed]
- Nowel, M.S. Functional organization of the metathoracic femoral chordotonal organ in the cricket Acheta domesticus. J. Exp. Biol. 1995, 198, 1977–1988. [Google Scholar] [PubMed]
- Understanding Capacitive Position Sensors. Available online: http://www.microsense.net/caa60b50-cb74-4646-9f8b-2bfbf1ff8d85/resource-center-cps-delivery.htm (accessed on 13 March 2015).
- Bousack, H.; Banzet, M.; Mayer, D.; Soltner, H. Infrared Sensor Comprising Tunnel Junction Measuring the Deformation of a Membrane. U.S. Patent No. 5,959,200, 28 September 1999. [Google Scholar]
- Merino, L.; Caballero, F.; Martinez-de-Dios, J.R.; Maza, I.; Ollero, A. An unmanned aircraft system for automatic forest fire monitoring and measurement. J. Intell. Robot. Syst. 2012, 65, 533–548. [Google Scholar] [CrossRef]
- Ambrosia, V.G.; Wegener, S.S.; Sullivan, D.V.; Buechel, S.W.; Dunagan, S.E.; Brass, J.A.; Stoneburner, J.; Schoenung, S.M. Demonstrating UAV-acquired real-time thermal data over fires. Photogramm. Eng. Remote Sens. 2003, 69, 391–402. [Google Scholar] [CrossRef]
- Casbeer, D.W.; Kingston, D.B.; Beard, R.W.; McLain, T.W. Cooperative forest fire surveillance using a team of small unmanned air vehicles. Int. J. Syst. Sci. 2006, 37, 351–360. [Google Scholar] [CrossRef]
- Sujit, P.B.; Kingston, D.; Beard, R. Cooperative forest fire monitoring using multiple UAVs. In Proceedings of 2007 46th IEEE Conference on Decision and Control, New Orleans, LA, USA, 12–14 December 2007; pp. 4875–4880.
- Restas, A. Forest fire management supporting by UAV based air reconnaissance results of Szendro fire department, Hungary. In Proceedings of 1st International Symposium on Environment Identities and Mediterranean Area (ISEIMA’06), Corte-Ajaccio, France, 9–12 July 2006; pp. 73–77.
- Arrue, B.C.; Ollero, A.; de Dios, J.R.M. An intelligent system for false alarm reduction in infrared forest fire detection. IEEE Intell. Syst. Their Appl. 2000, 15, 64–73. [Google Scholar] [CrossRef]
- Wietfeld, C. Airborne Remote Sensing for Hazard Inspection by Lightweight Drones (Airshield); BMBF Informationsservice: Berlin, Germany, 2011. [Google Scholar]
© 2015 by the authors; licensee MDPI, Basel, Switzerland. This article is an open access article distributed under the terms and conditions of the Creative Commons Attribution license (http://creativecommons.org/licenses/by/4.0/).
Share and Cite
Bousack, H.; Kahl, T.; Schmitz, A.; Schmitz, H. Towards Improved Airborne Fire Detection Systems Using Beetle Inspired Infrared Detection and Fire Searching Strategies. Micromachines 2015, 6, 718-746. https://doi.org/10.3390/mi6060718
Bousack H, Kahl T, Schmitz A, Schmitz H. Towards Improved Airborne Fire Detection Systems Using Beetle Inspired Infrared Detection and Fire Searching Strategies. Micromachines. 2015; 6(6):718-746. https://doi.org/10.3390/mi6060718
Chicago/Turabian StyleBousack, Herbert, Thilo Kahl, Anke Schmitz, and Helmut Schmitz. 2015. "Towards Improved Airborne Fire Detection Systems Using Beetle Inspired Infrared Detection and Fire Searching Strategies" Micromachines 6, no. 6: 718-746. https://doi.org/10.3390/mi6060718
APA StyleBousack, H., Kahl, T., Schmitz, A., & Schmitz, H. (2015). Towards Improved Airborne Fire Detection Systems Using Beetle Inspired Infrared Detection and Fire Searching Strategies. Micromachines, 6(6), 718-746. https://doi.org/10.3390/mi6060718