
Self-Healing 3D-Printed Polyurethane Nanocomposites Based on Graphene


Abstract
1. Introduction
2. Materials and Methods
2.1. Materials
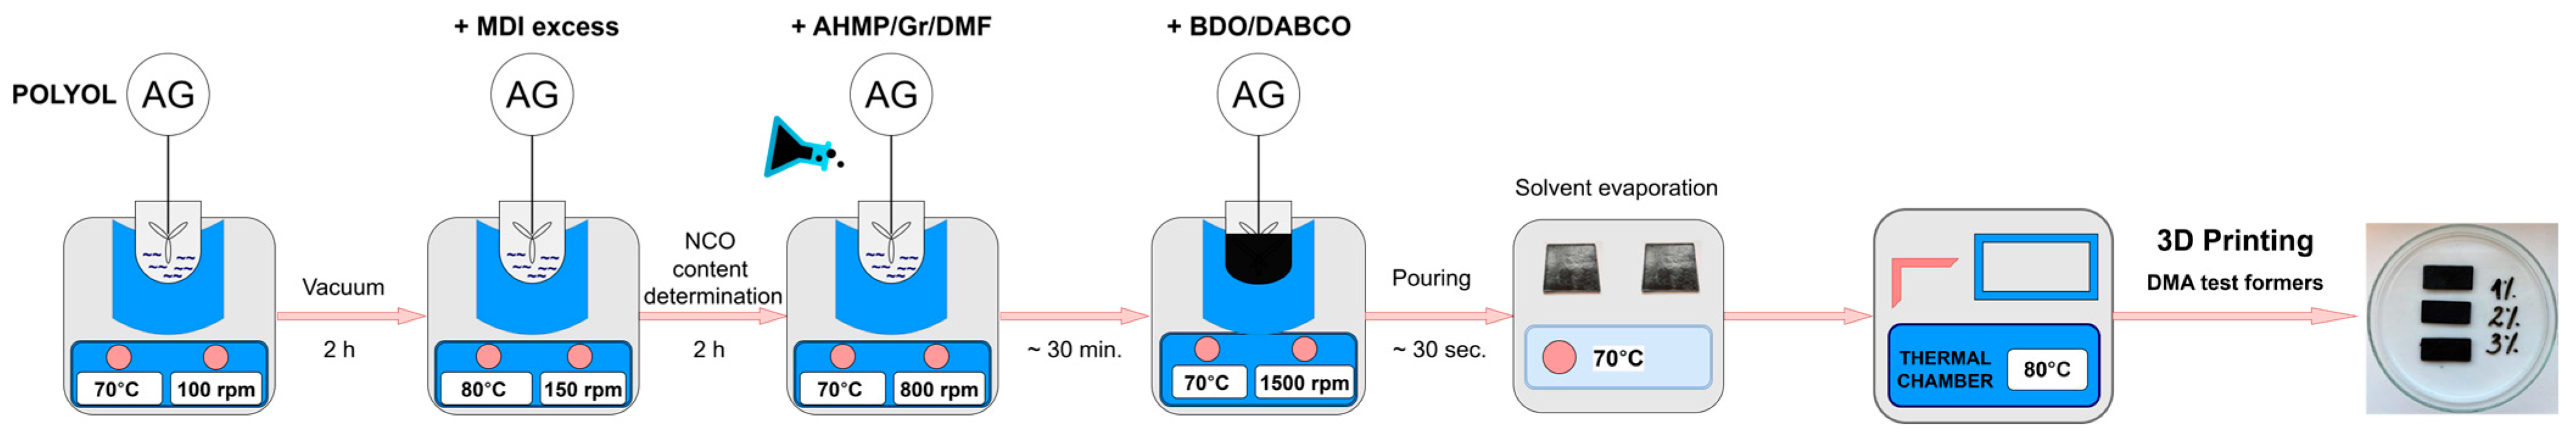
2.2. Synthesis
2.3. Method
3. Results and Discussion
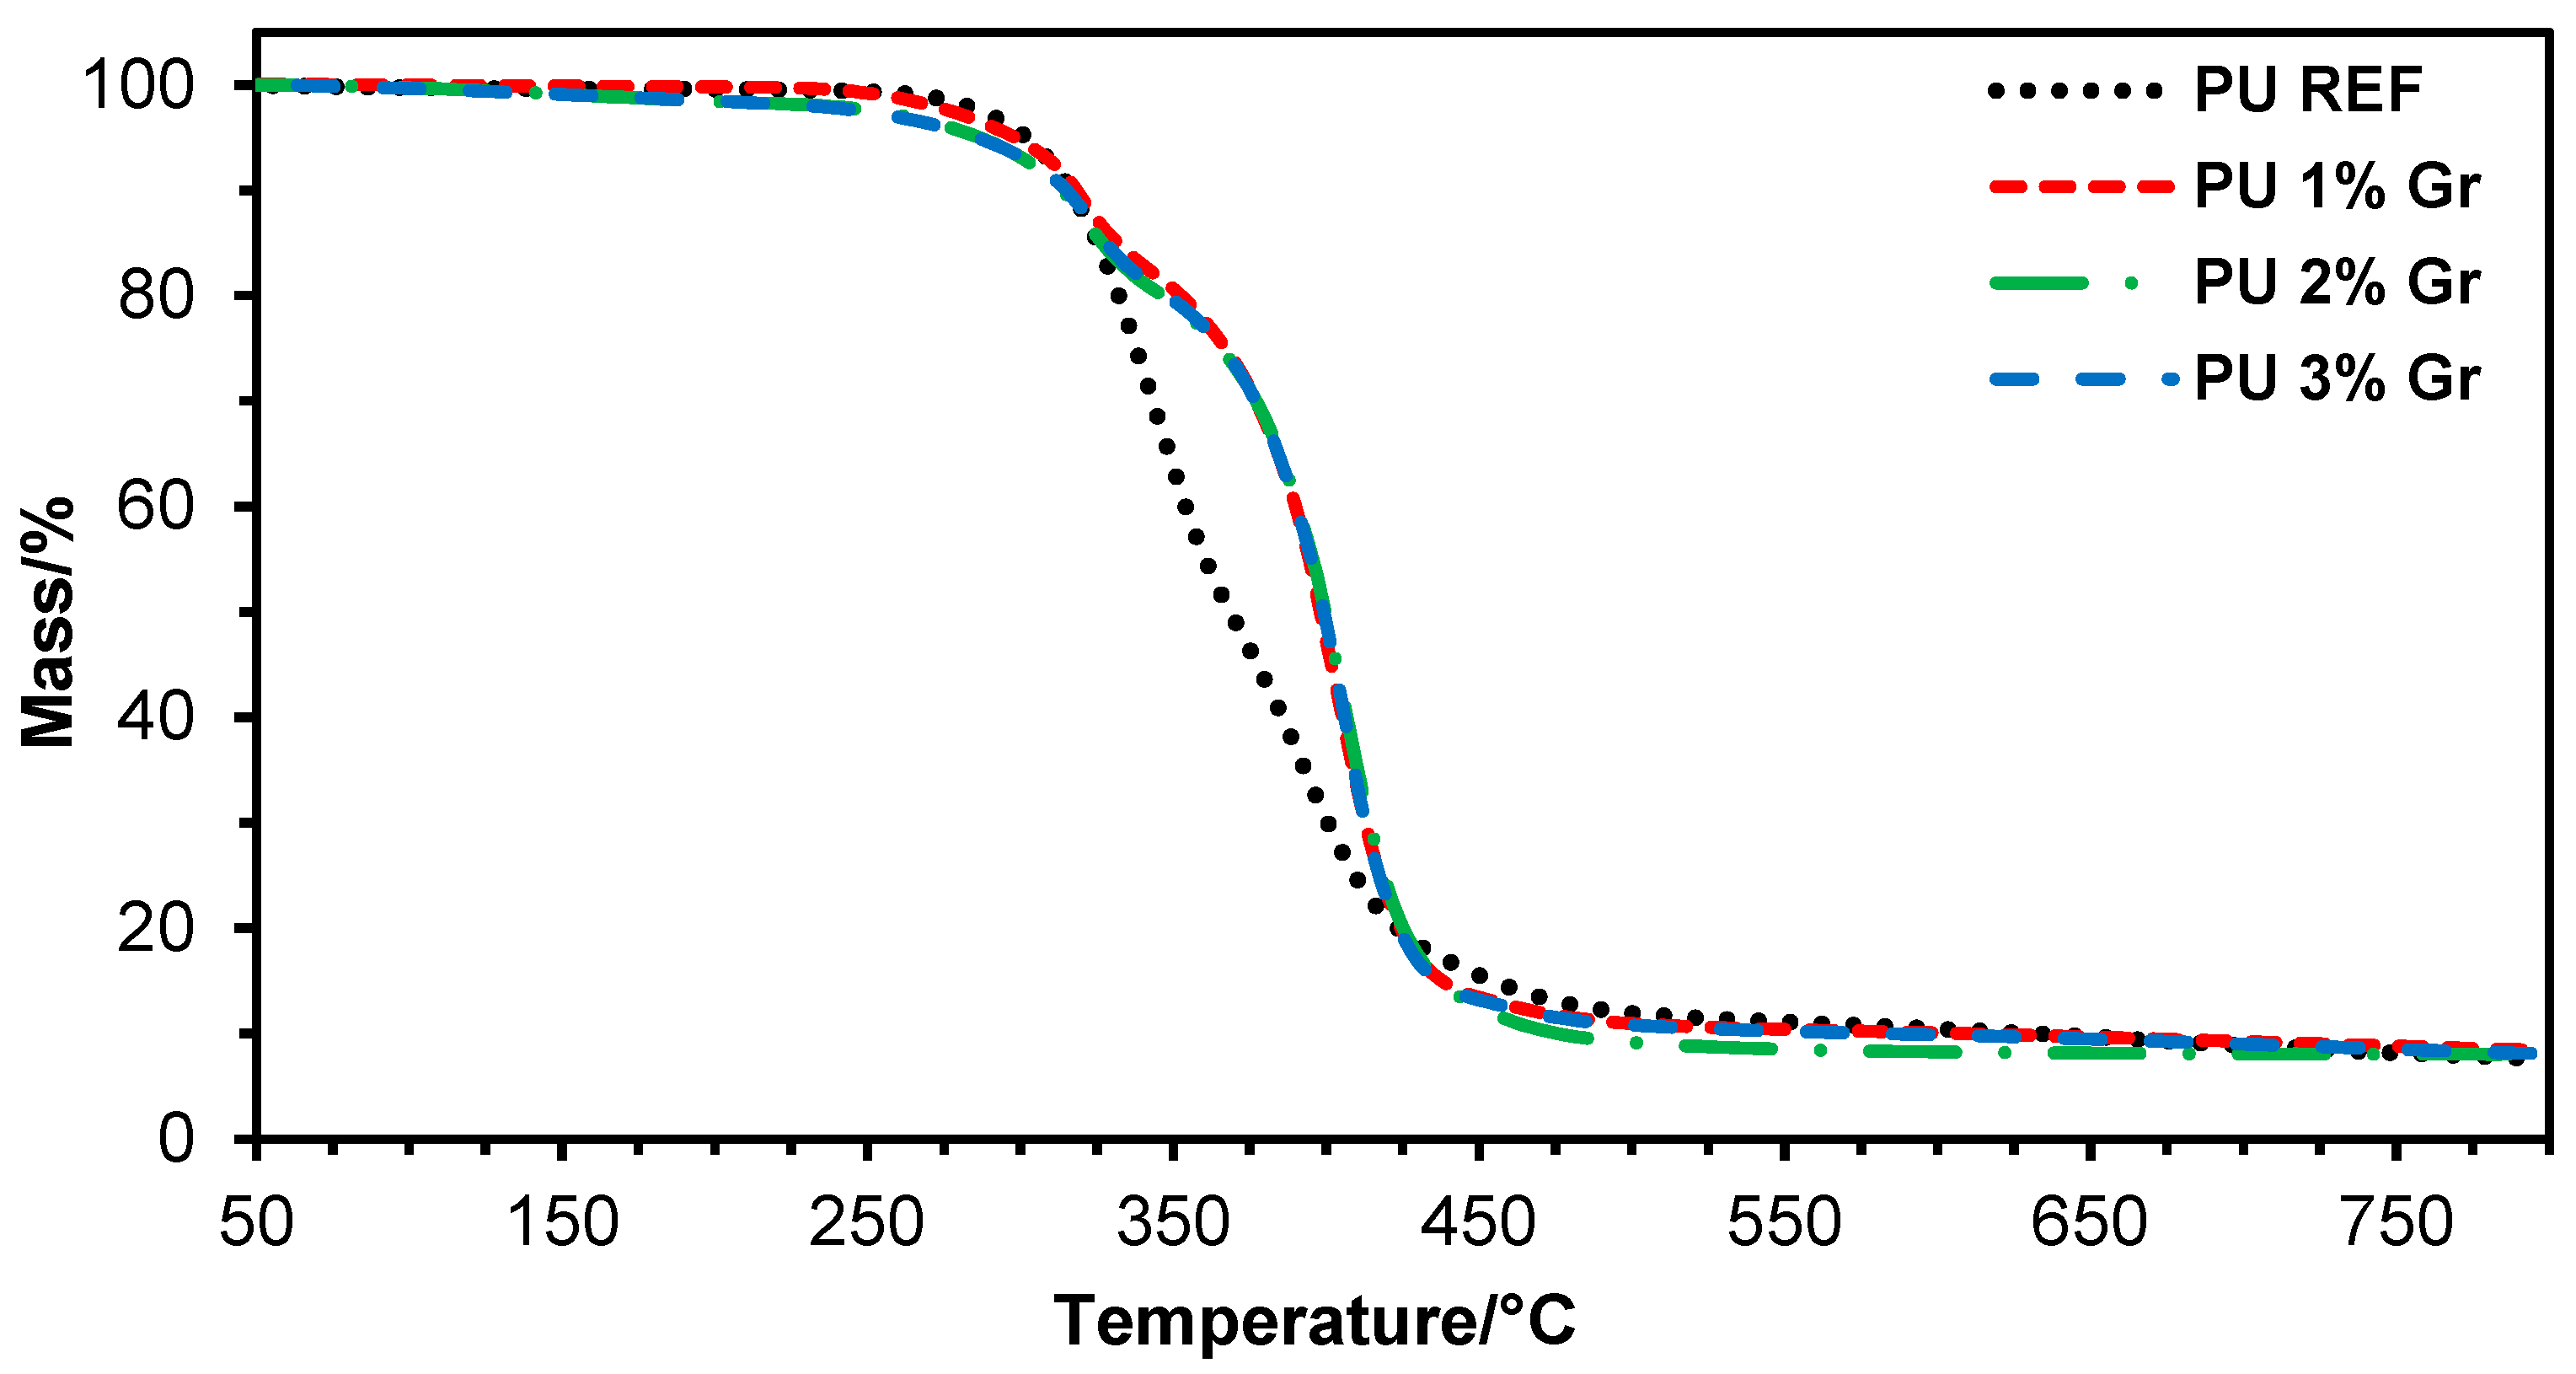
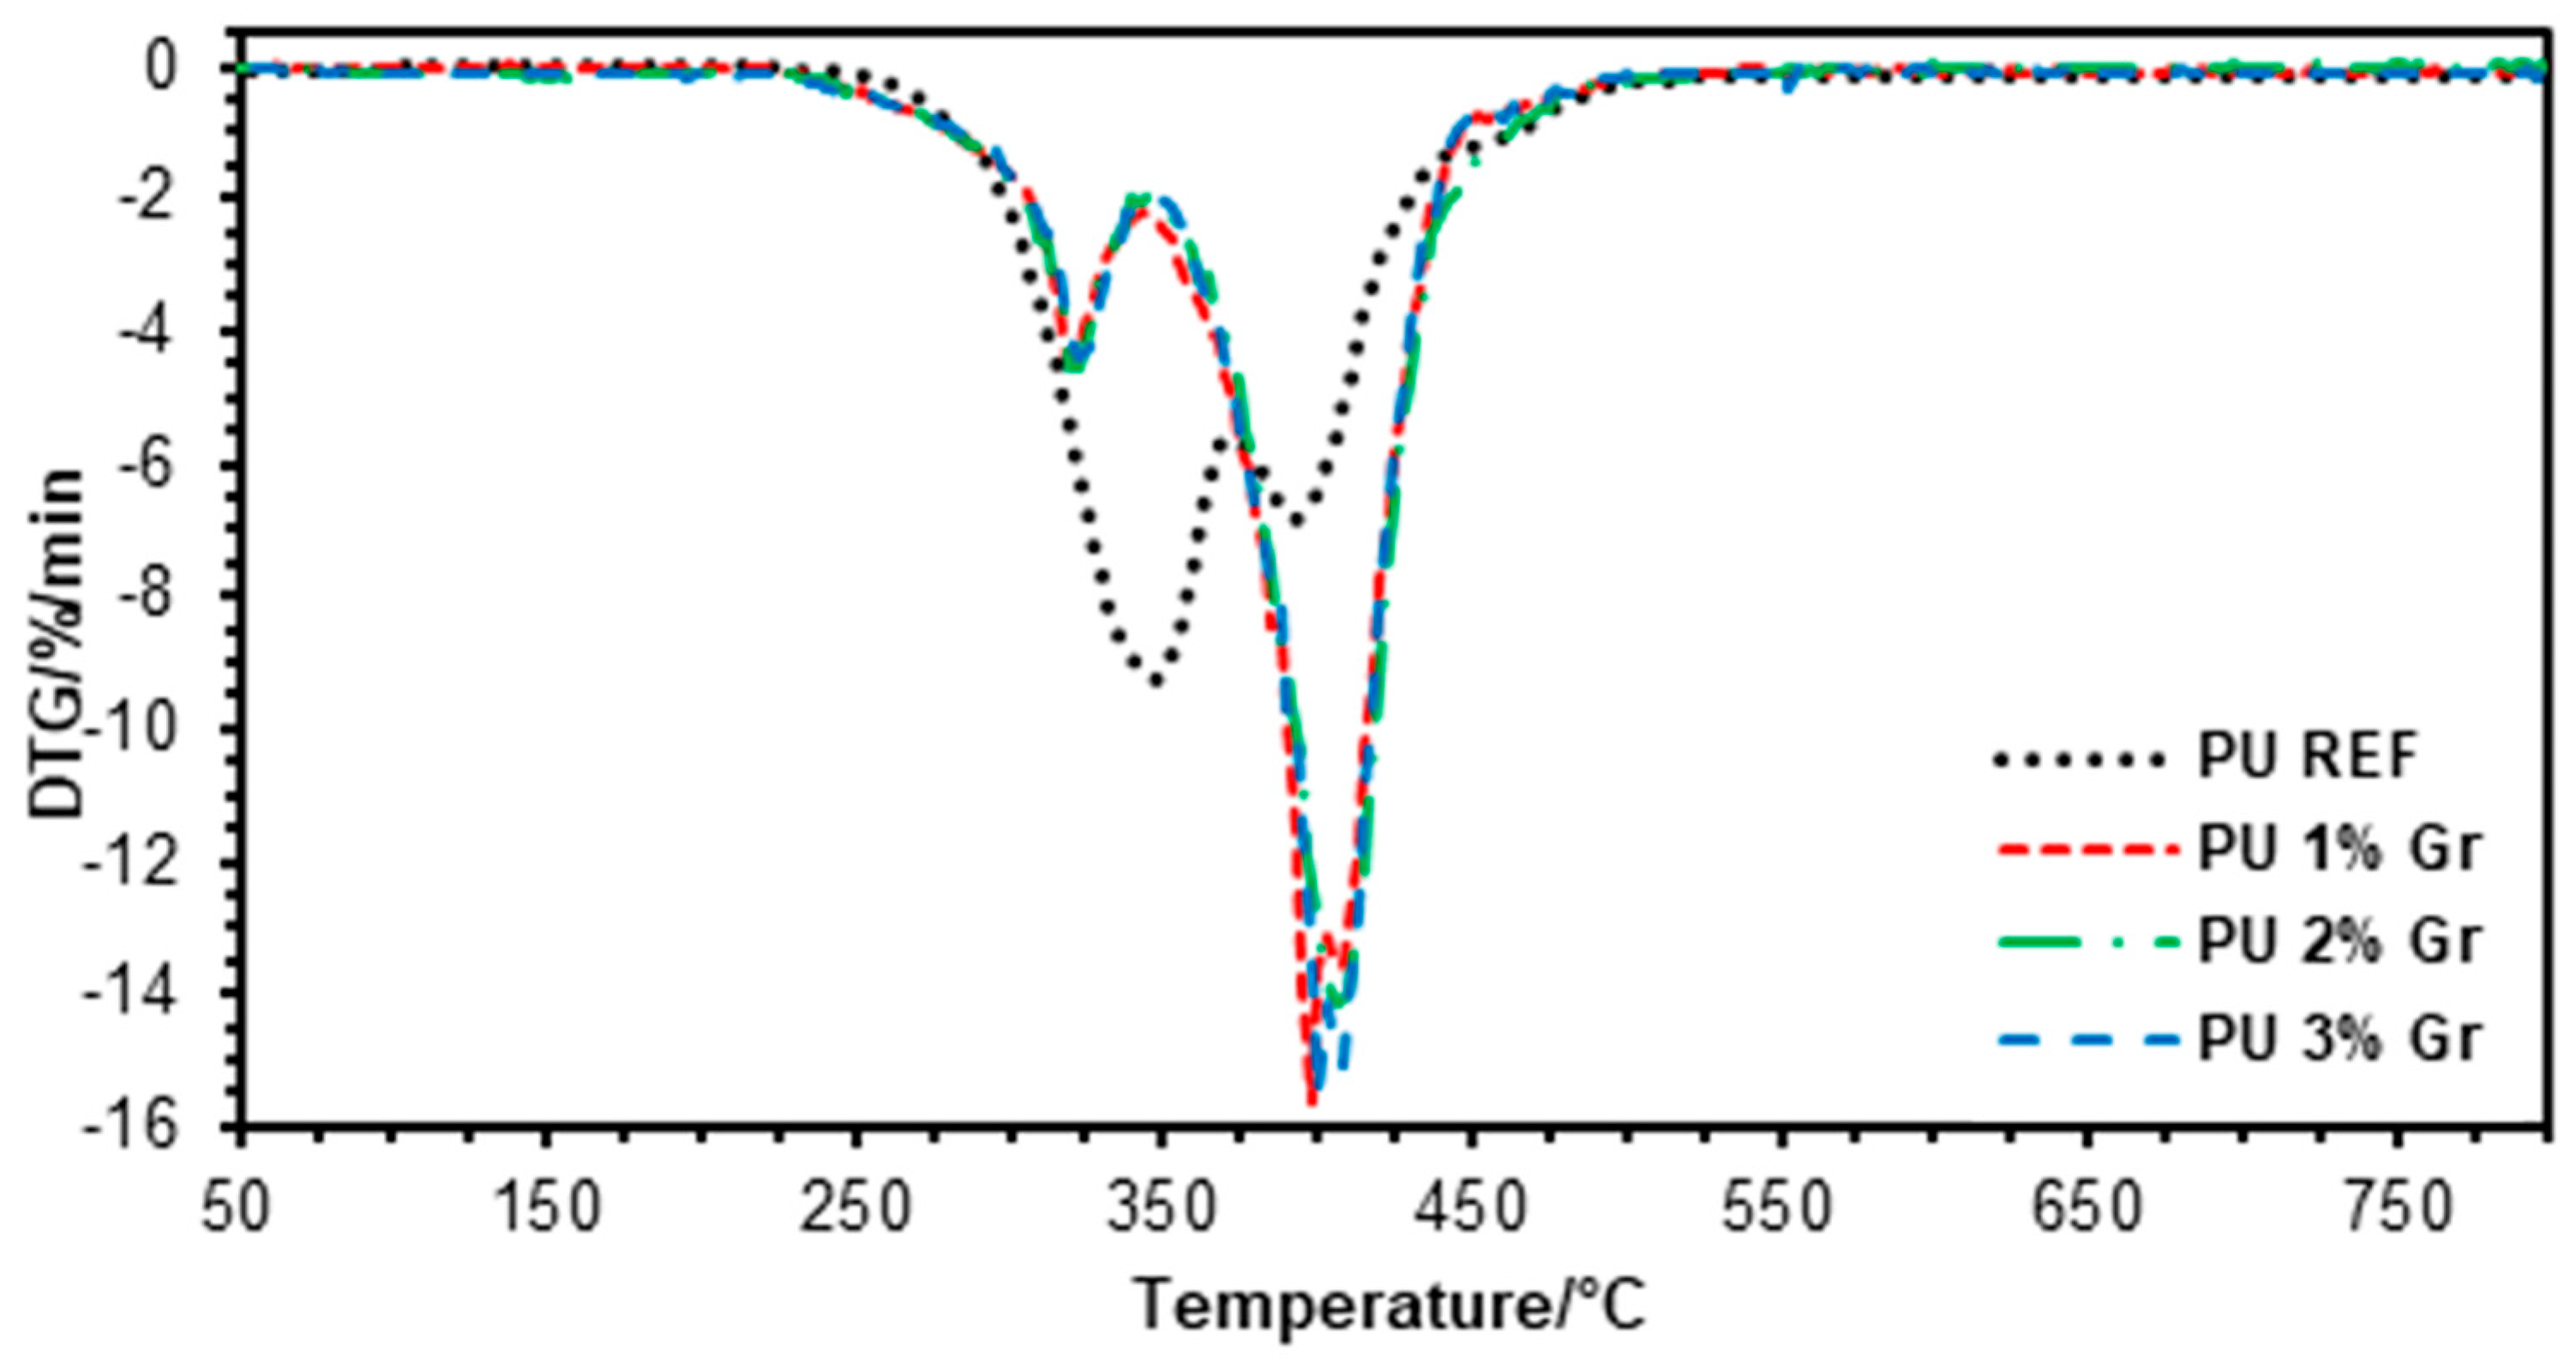
3.1. TGA Studies
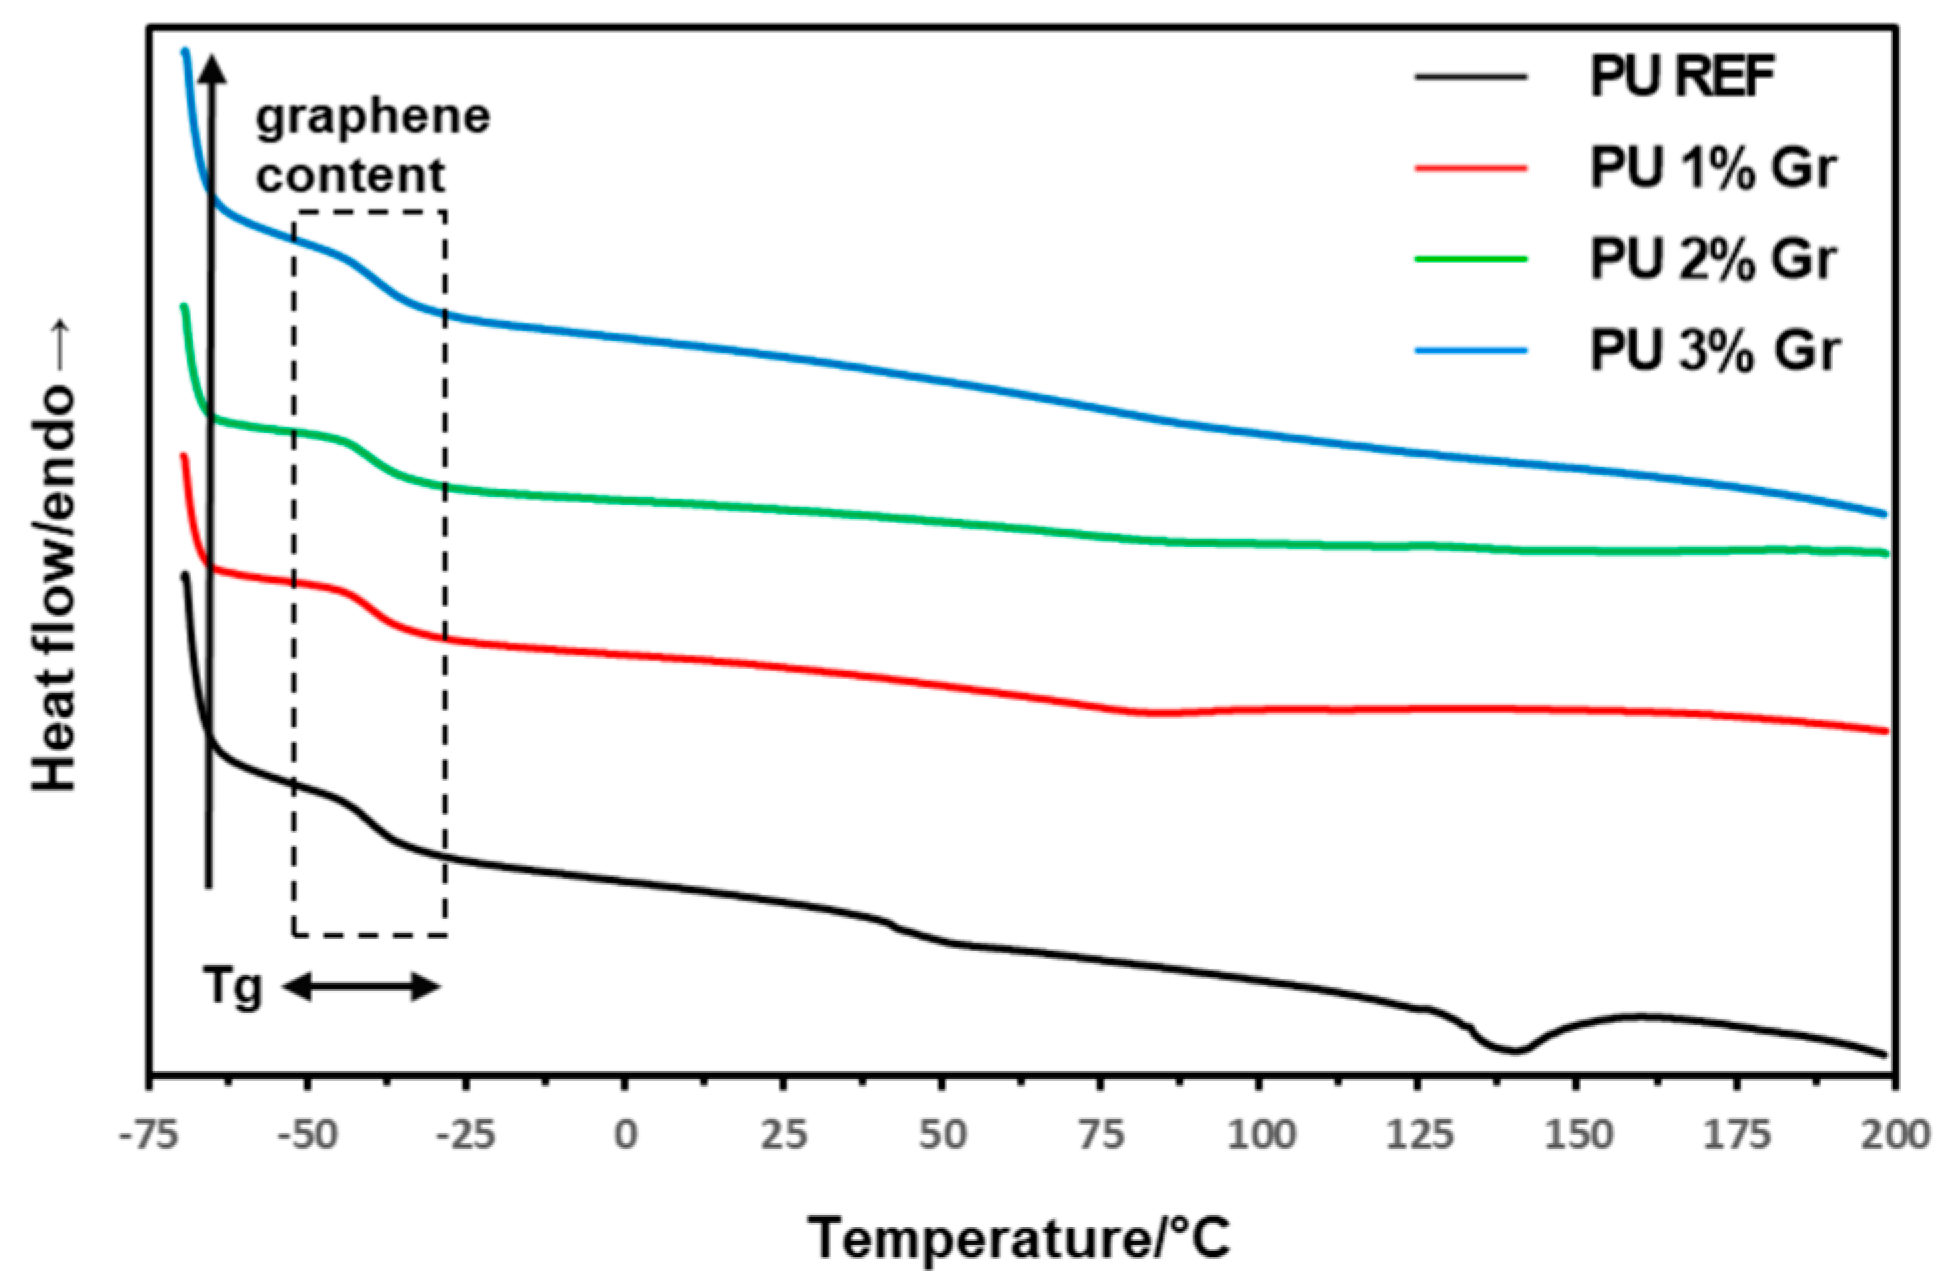
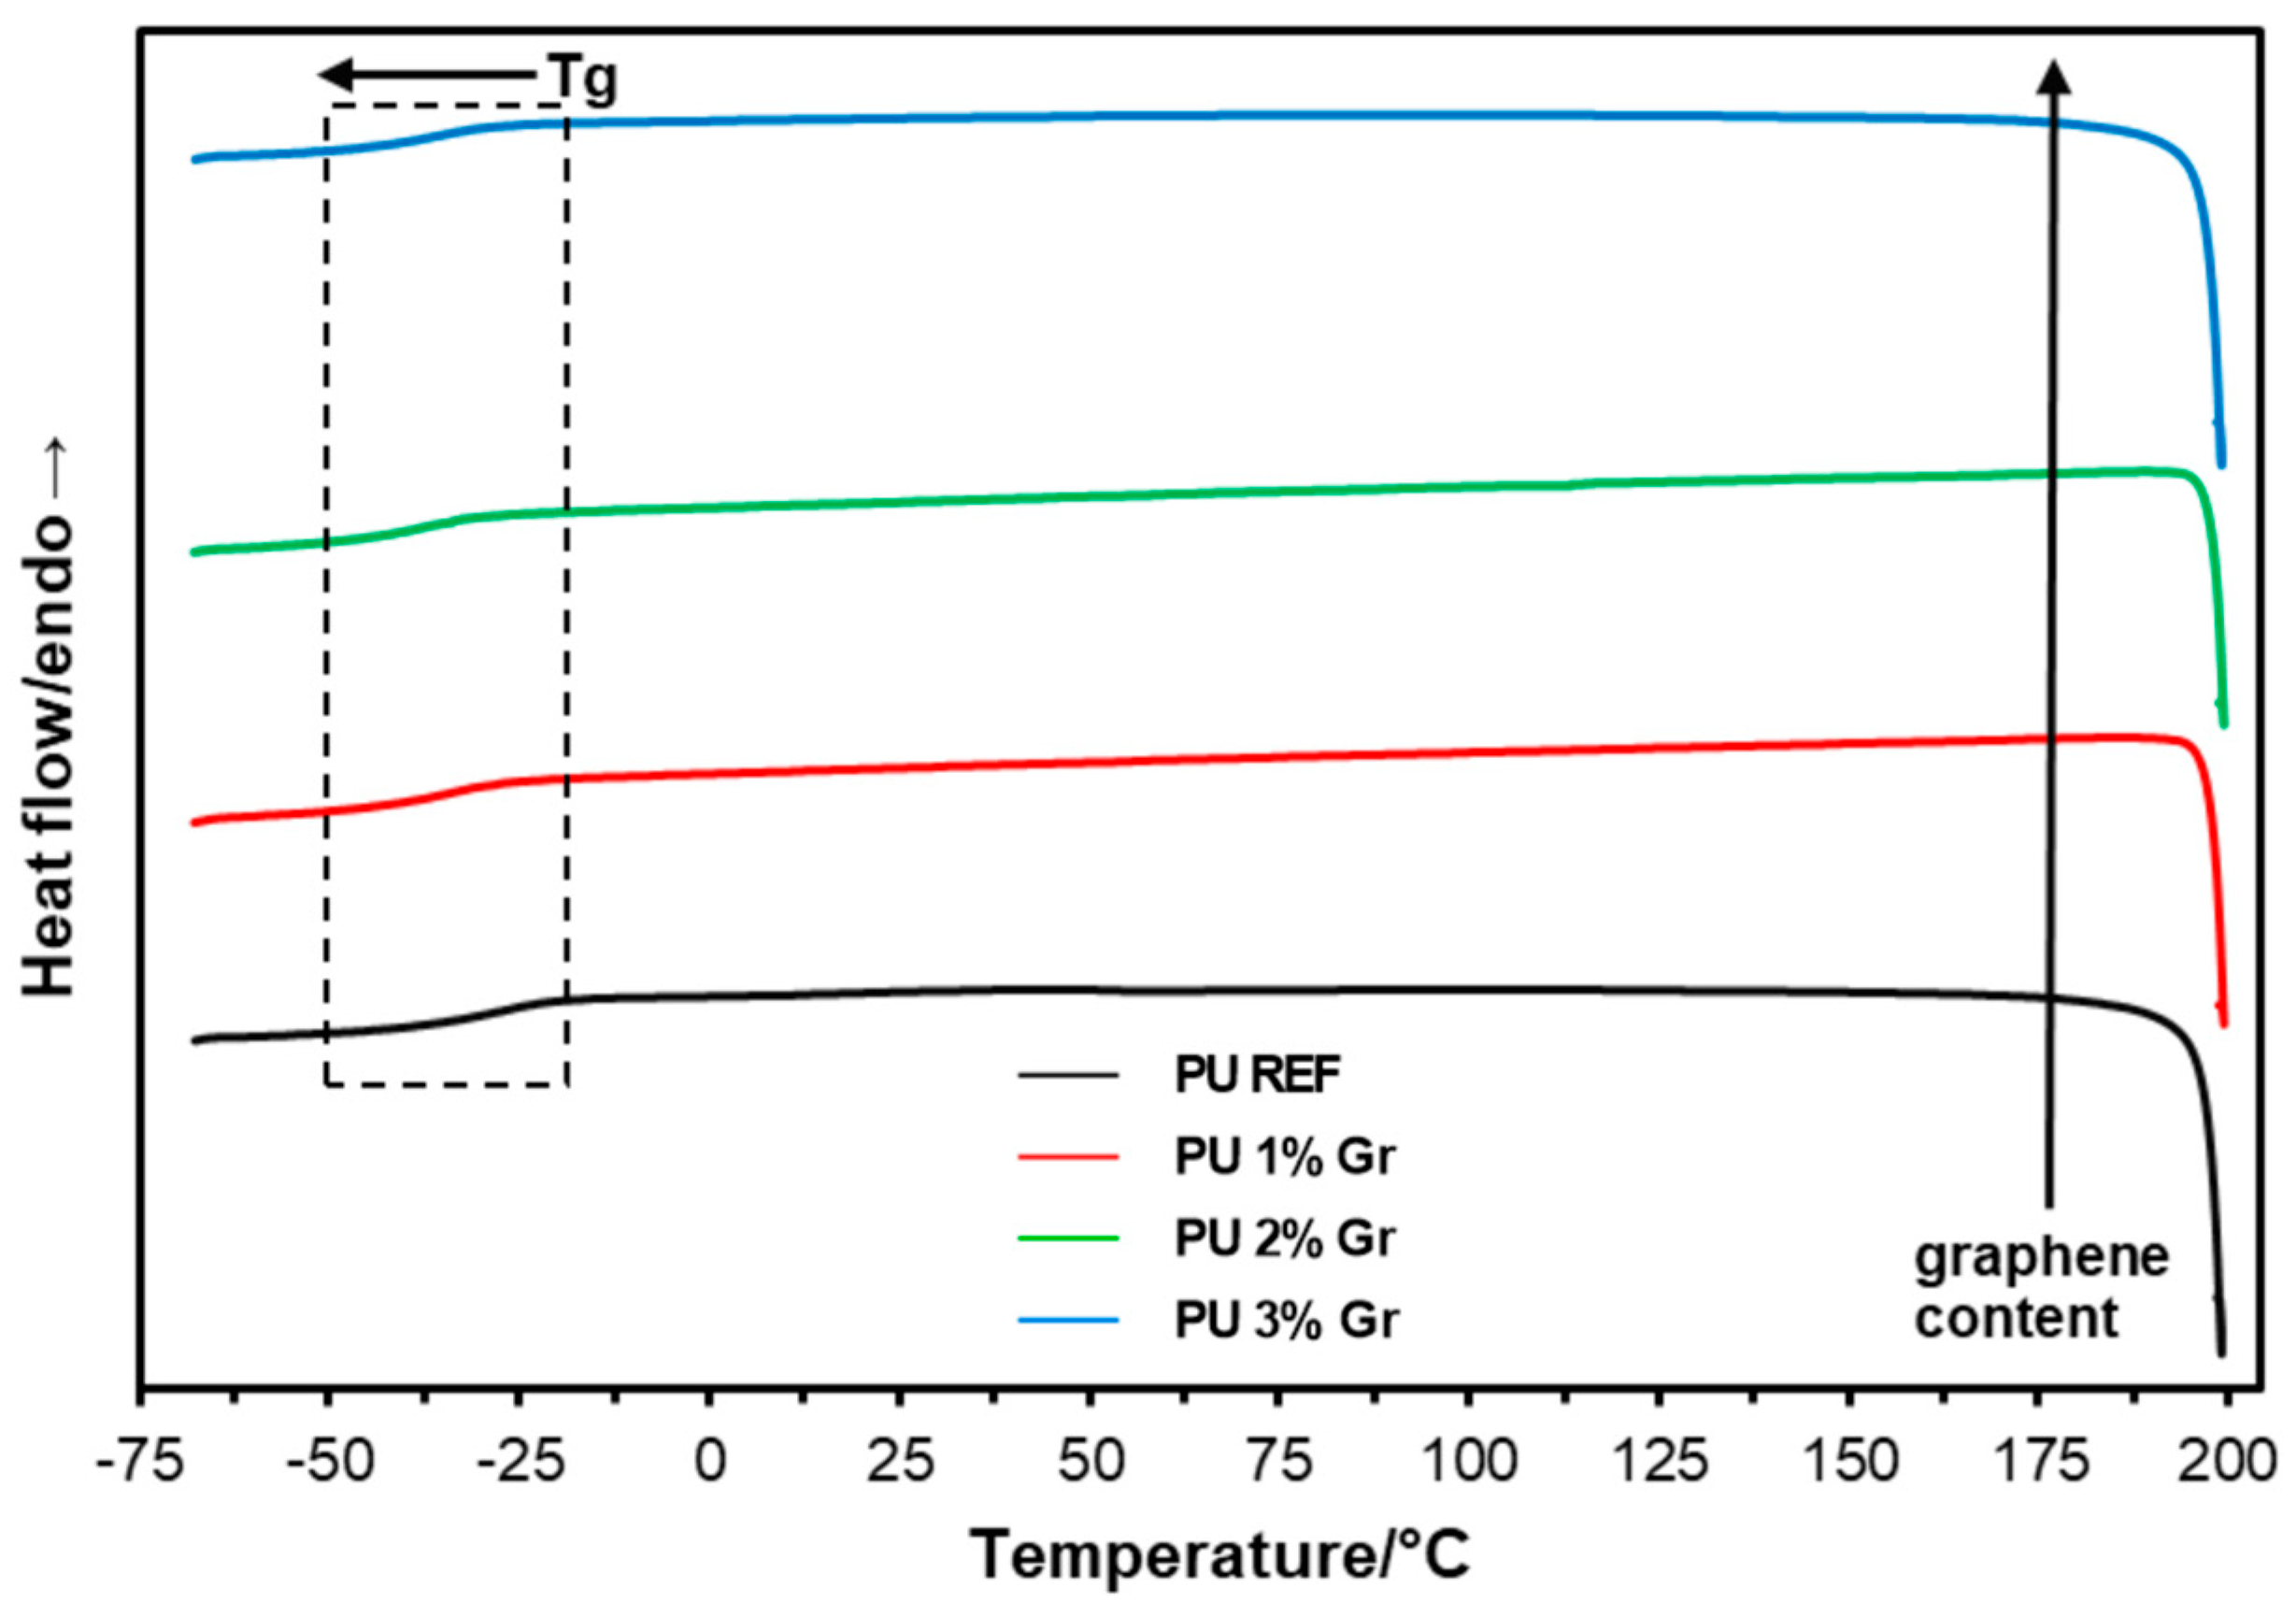
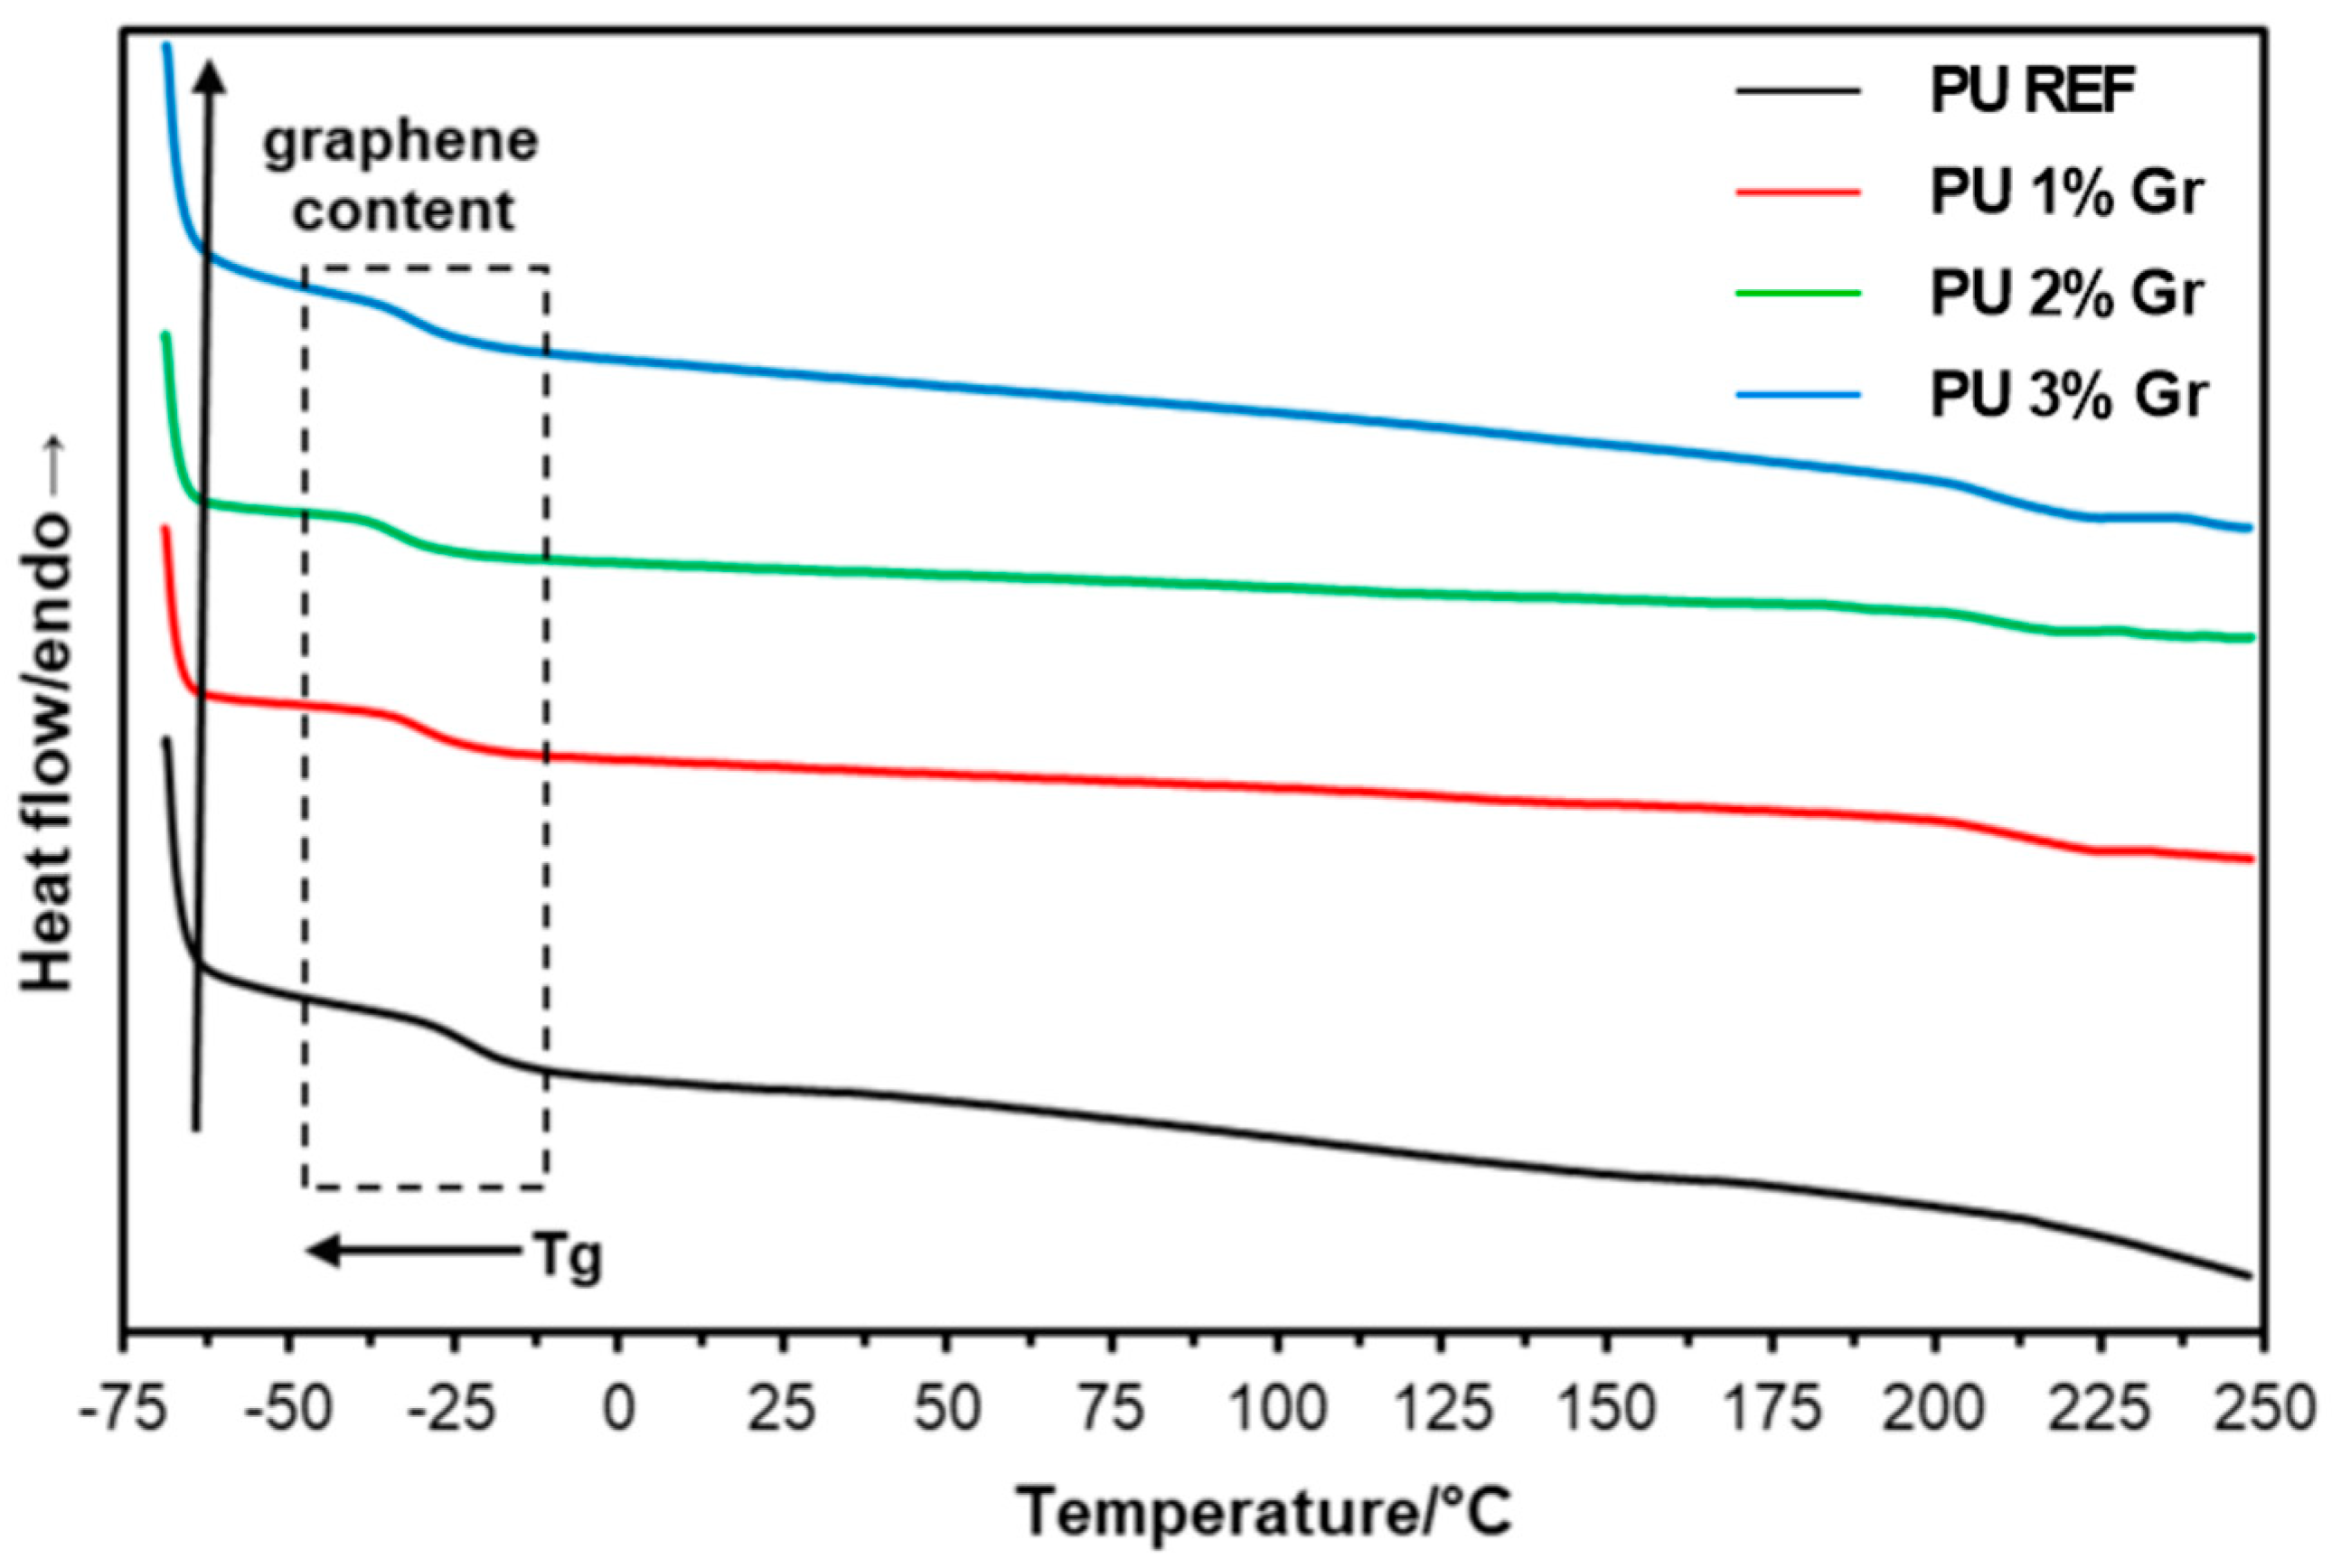
3.2. DSC Studies
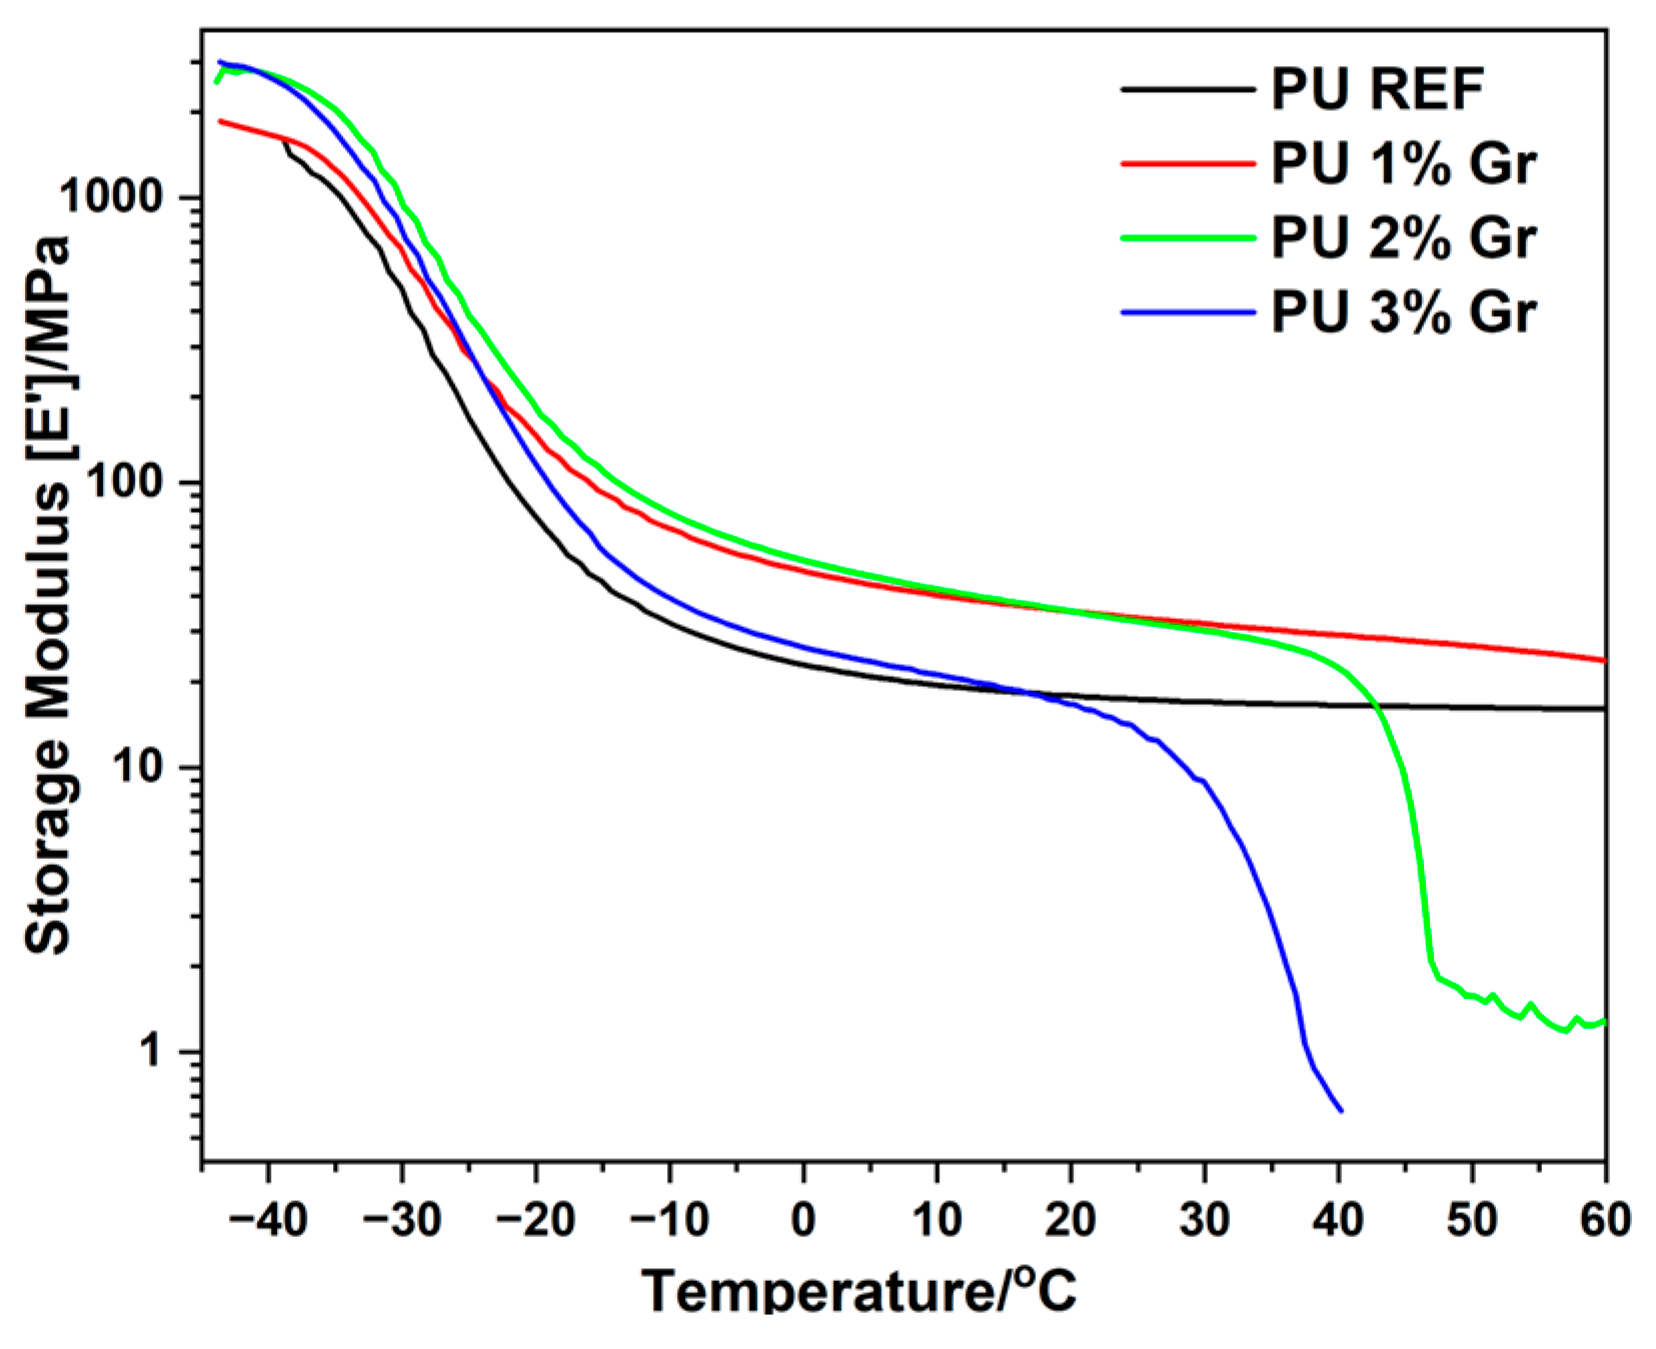
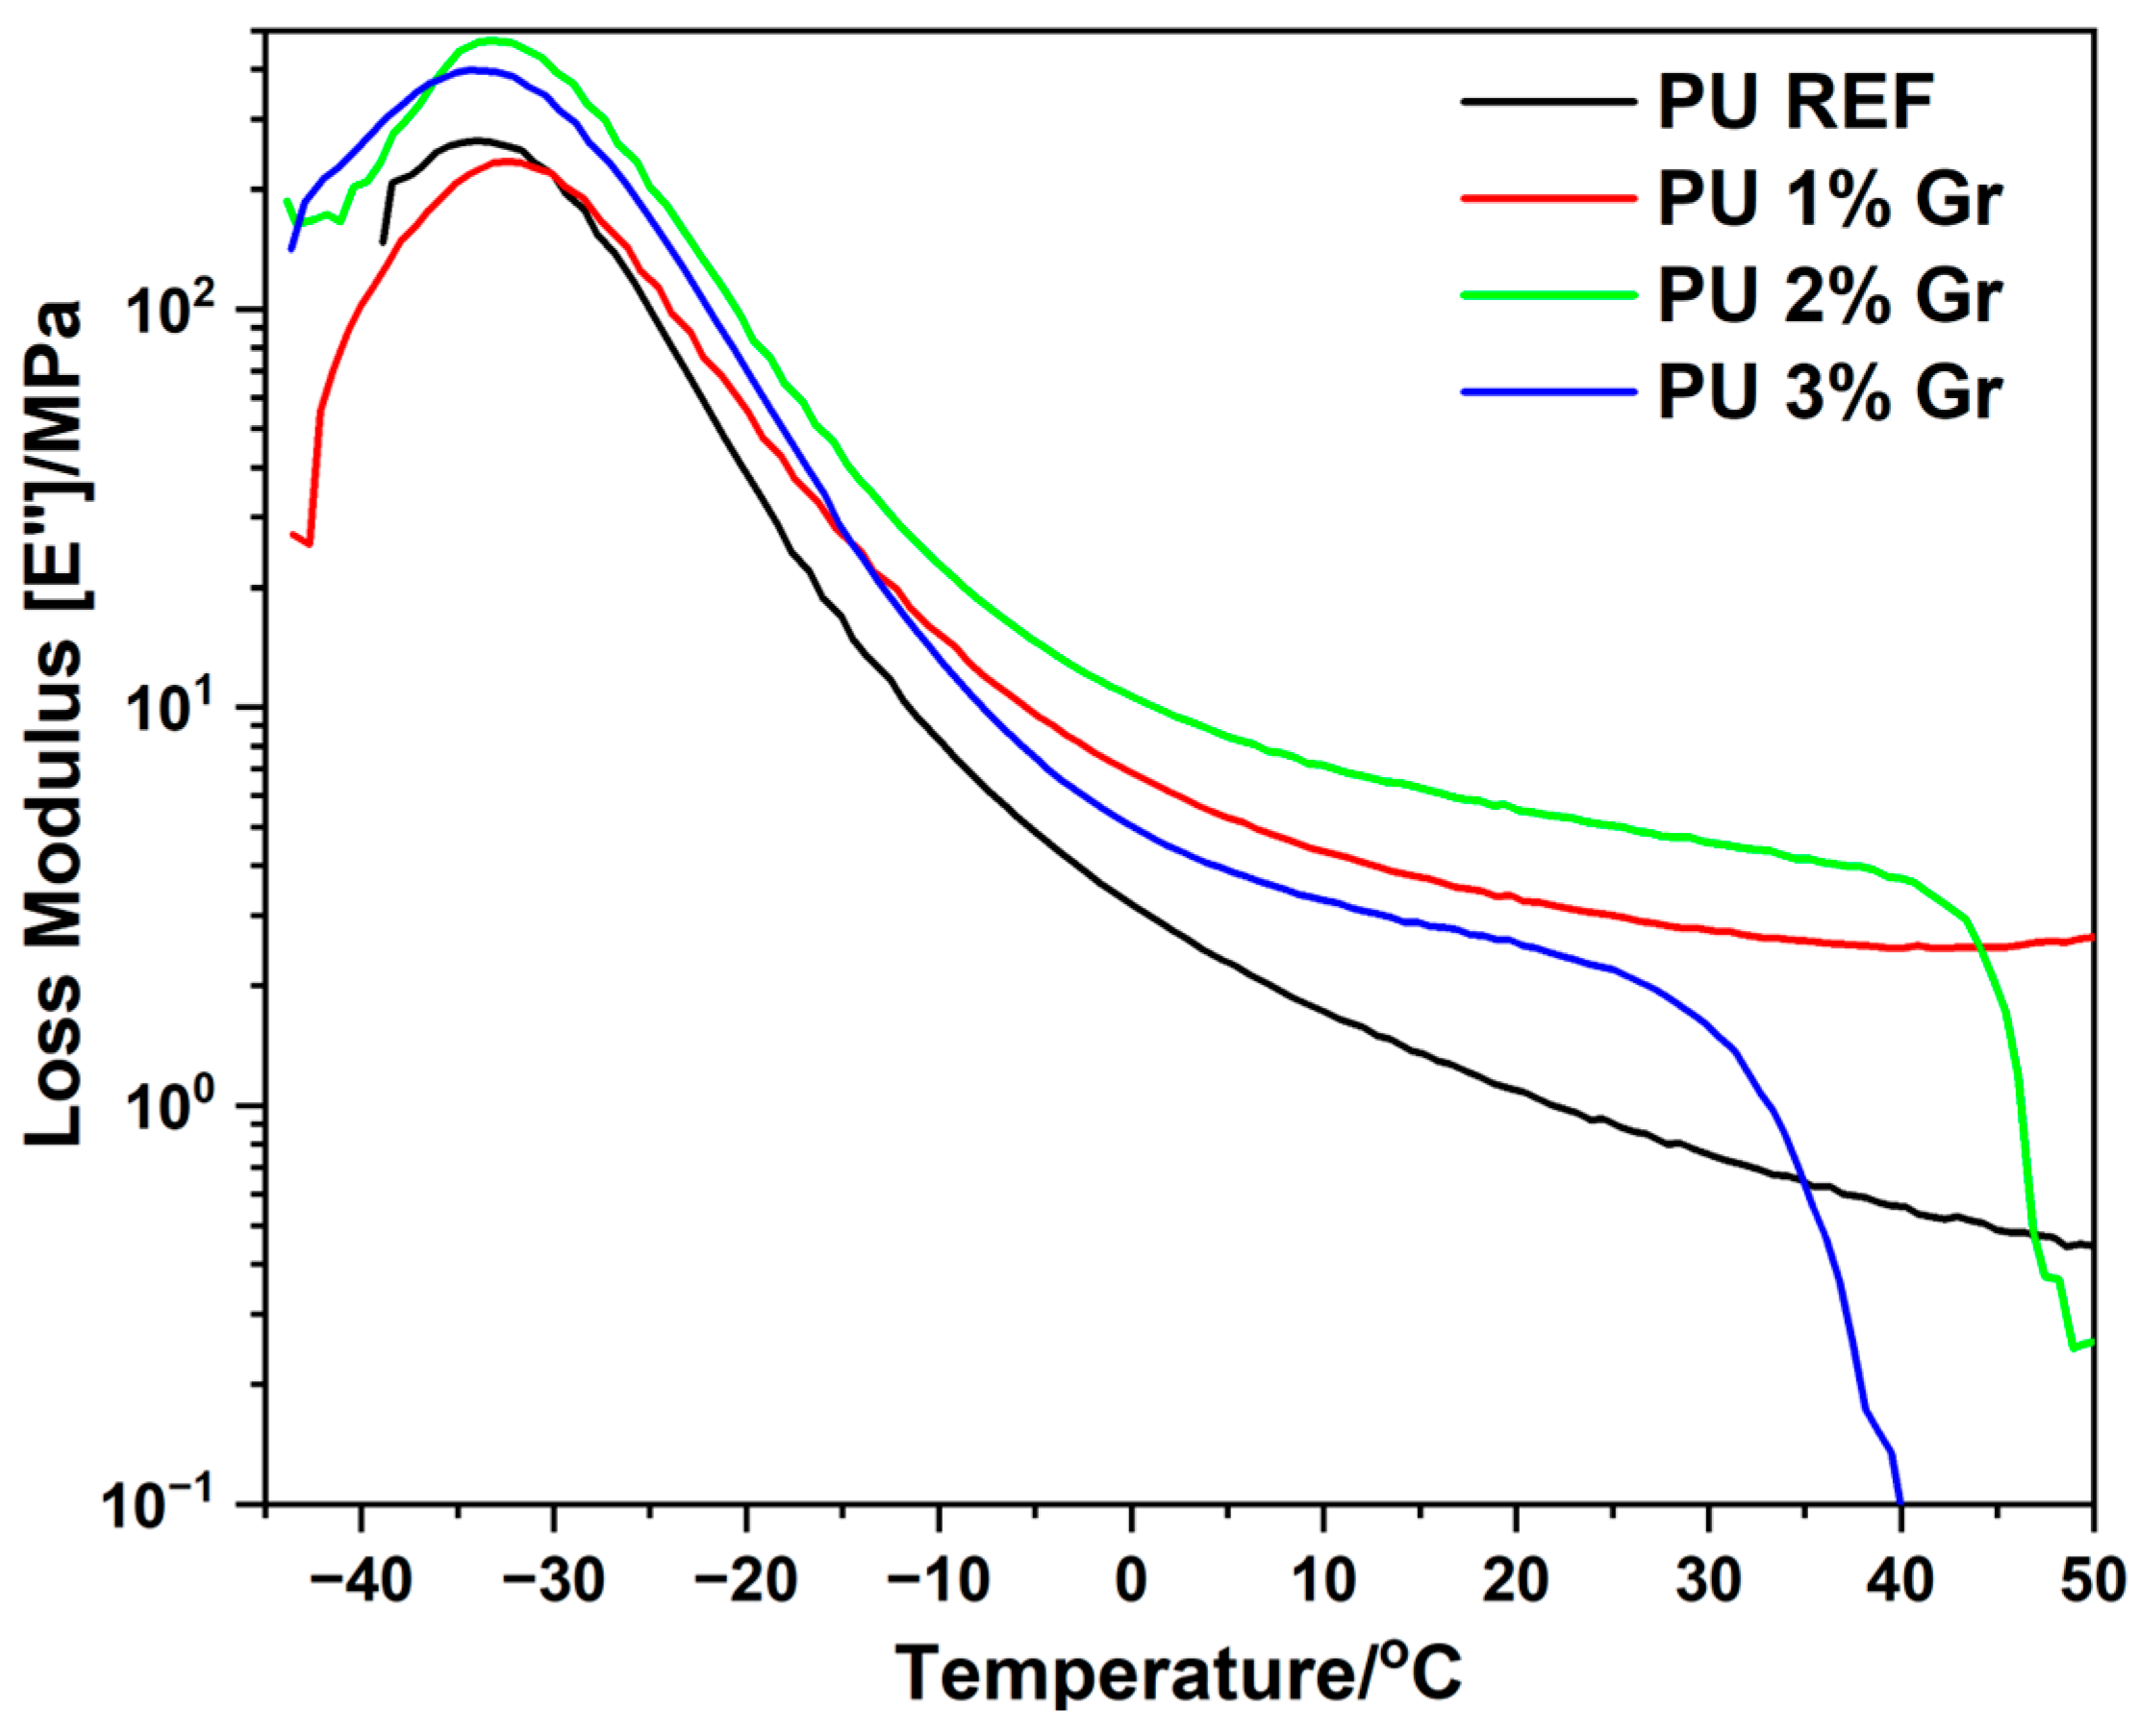
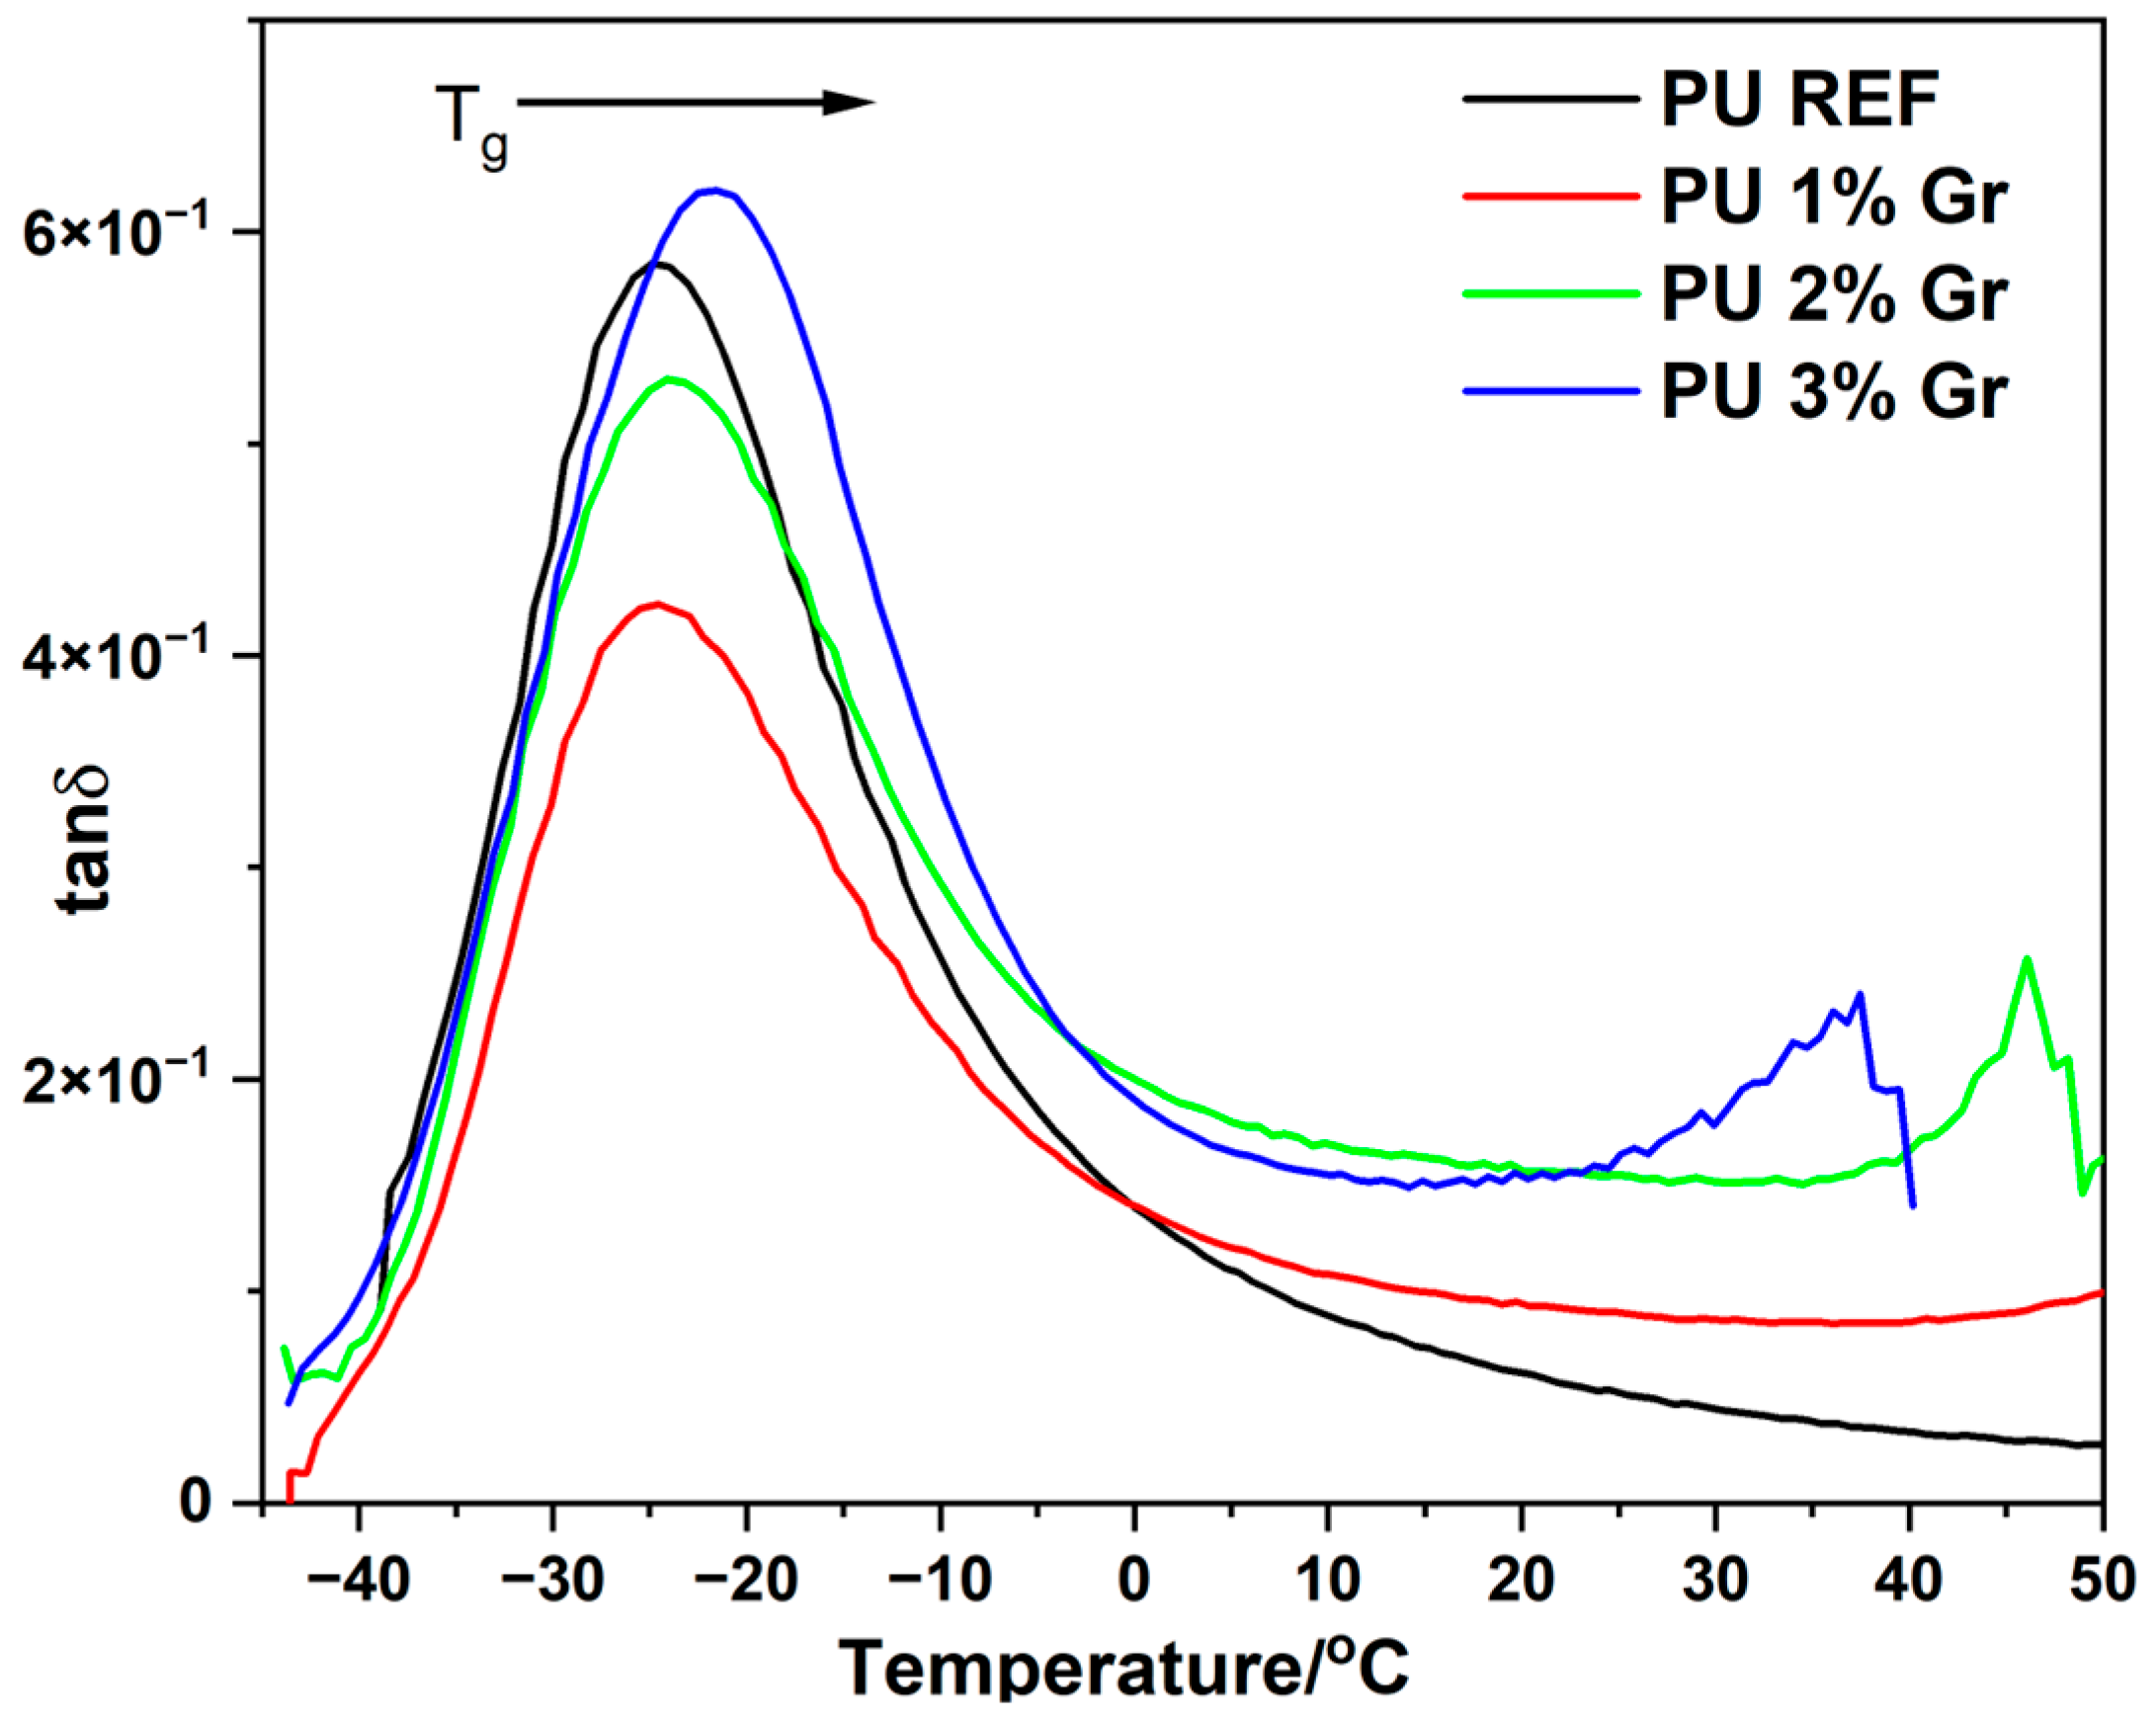
3.3. DMA Studies
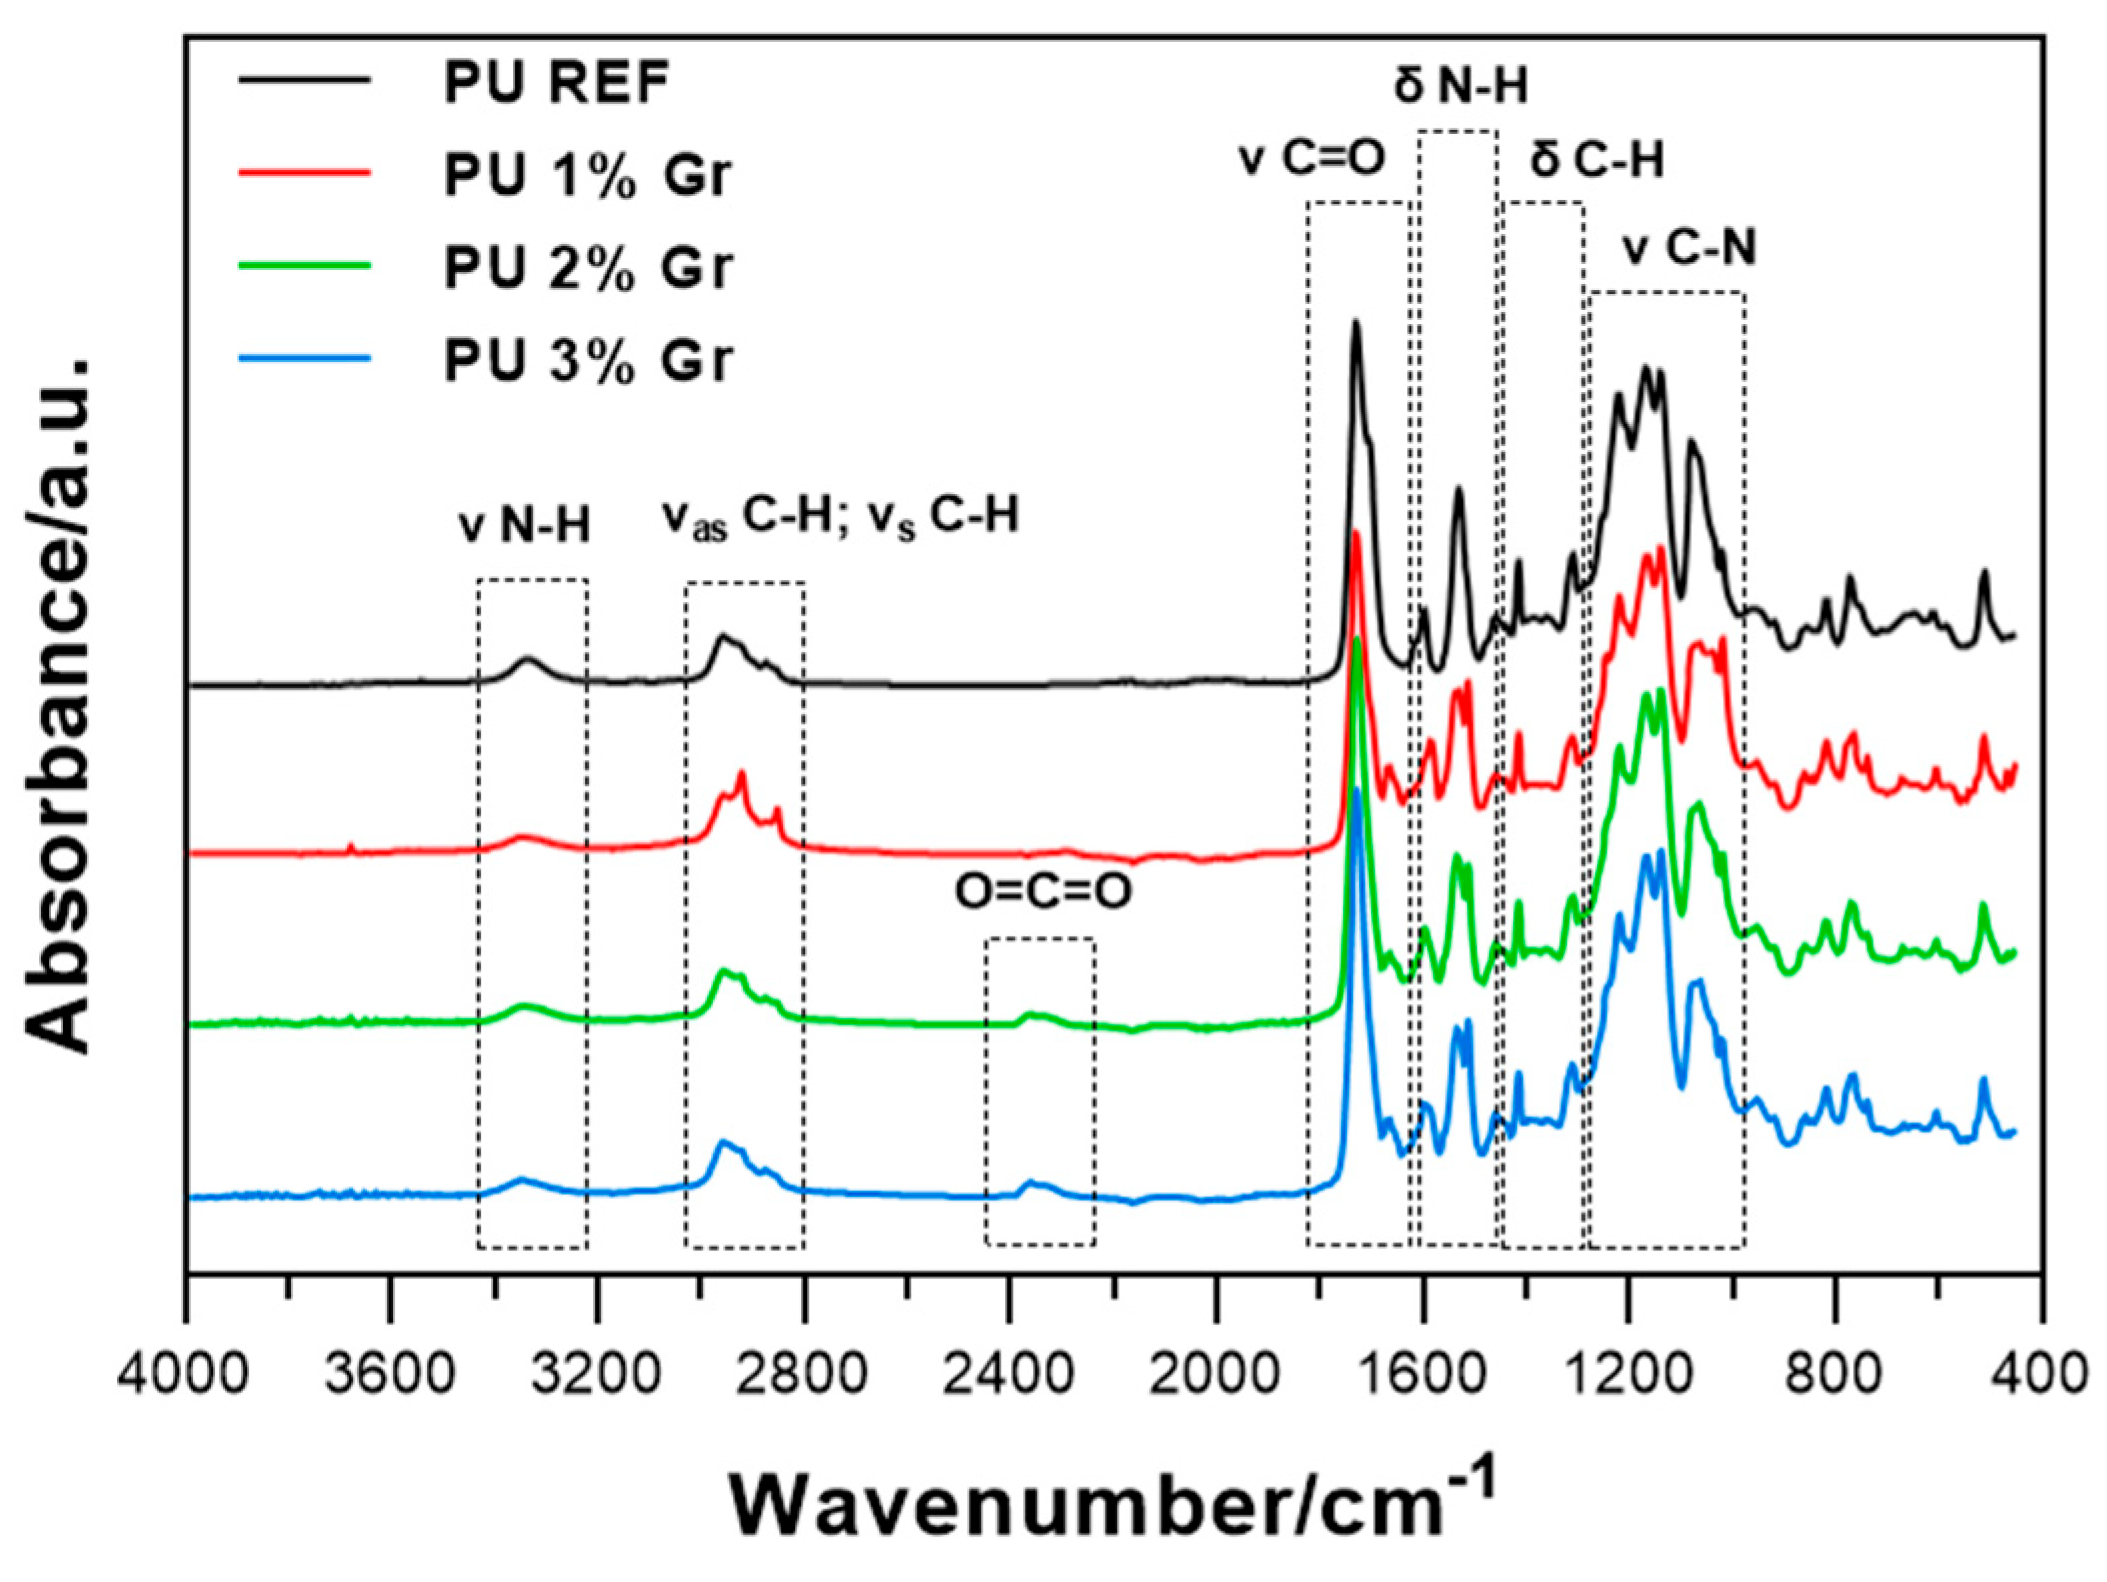
3.4. FTIR Spectroscopic Studies
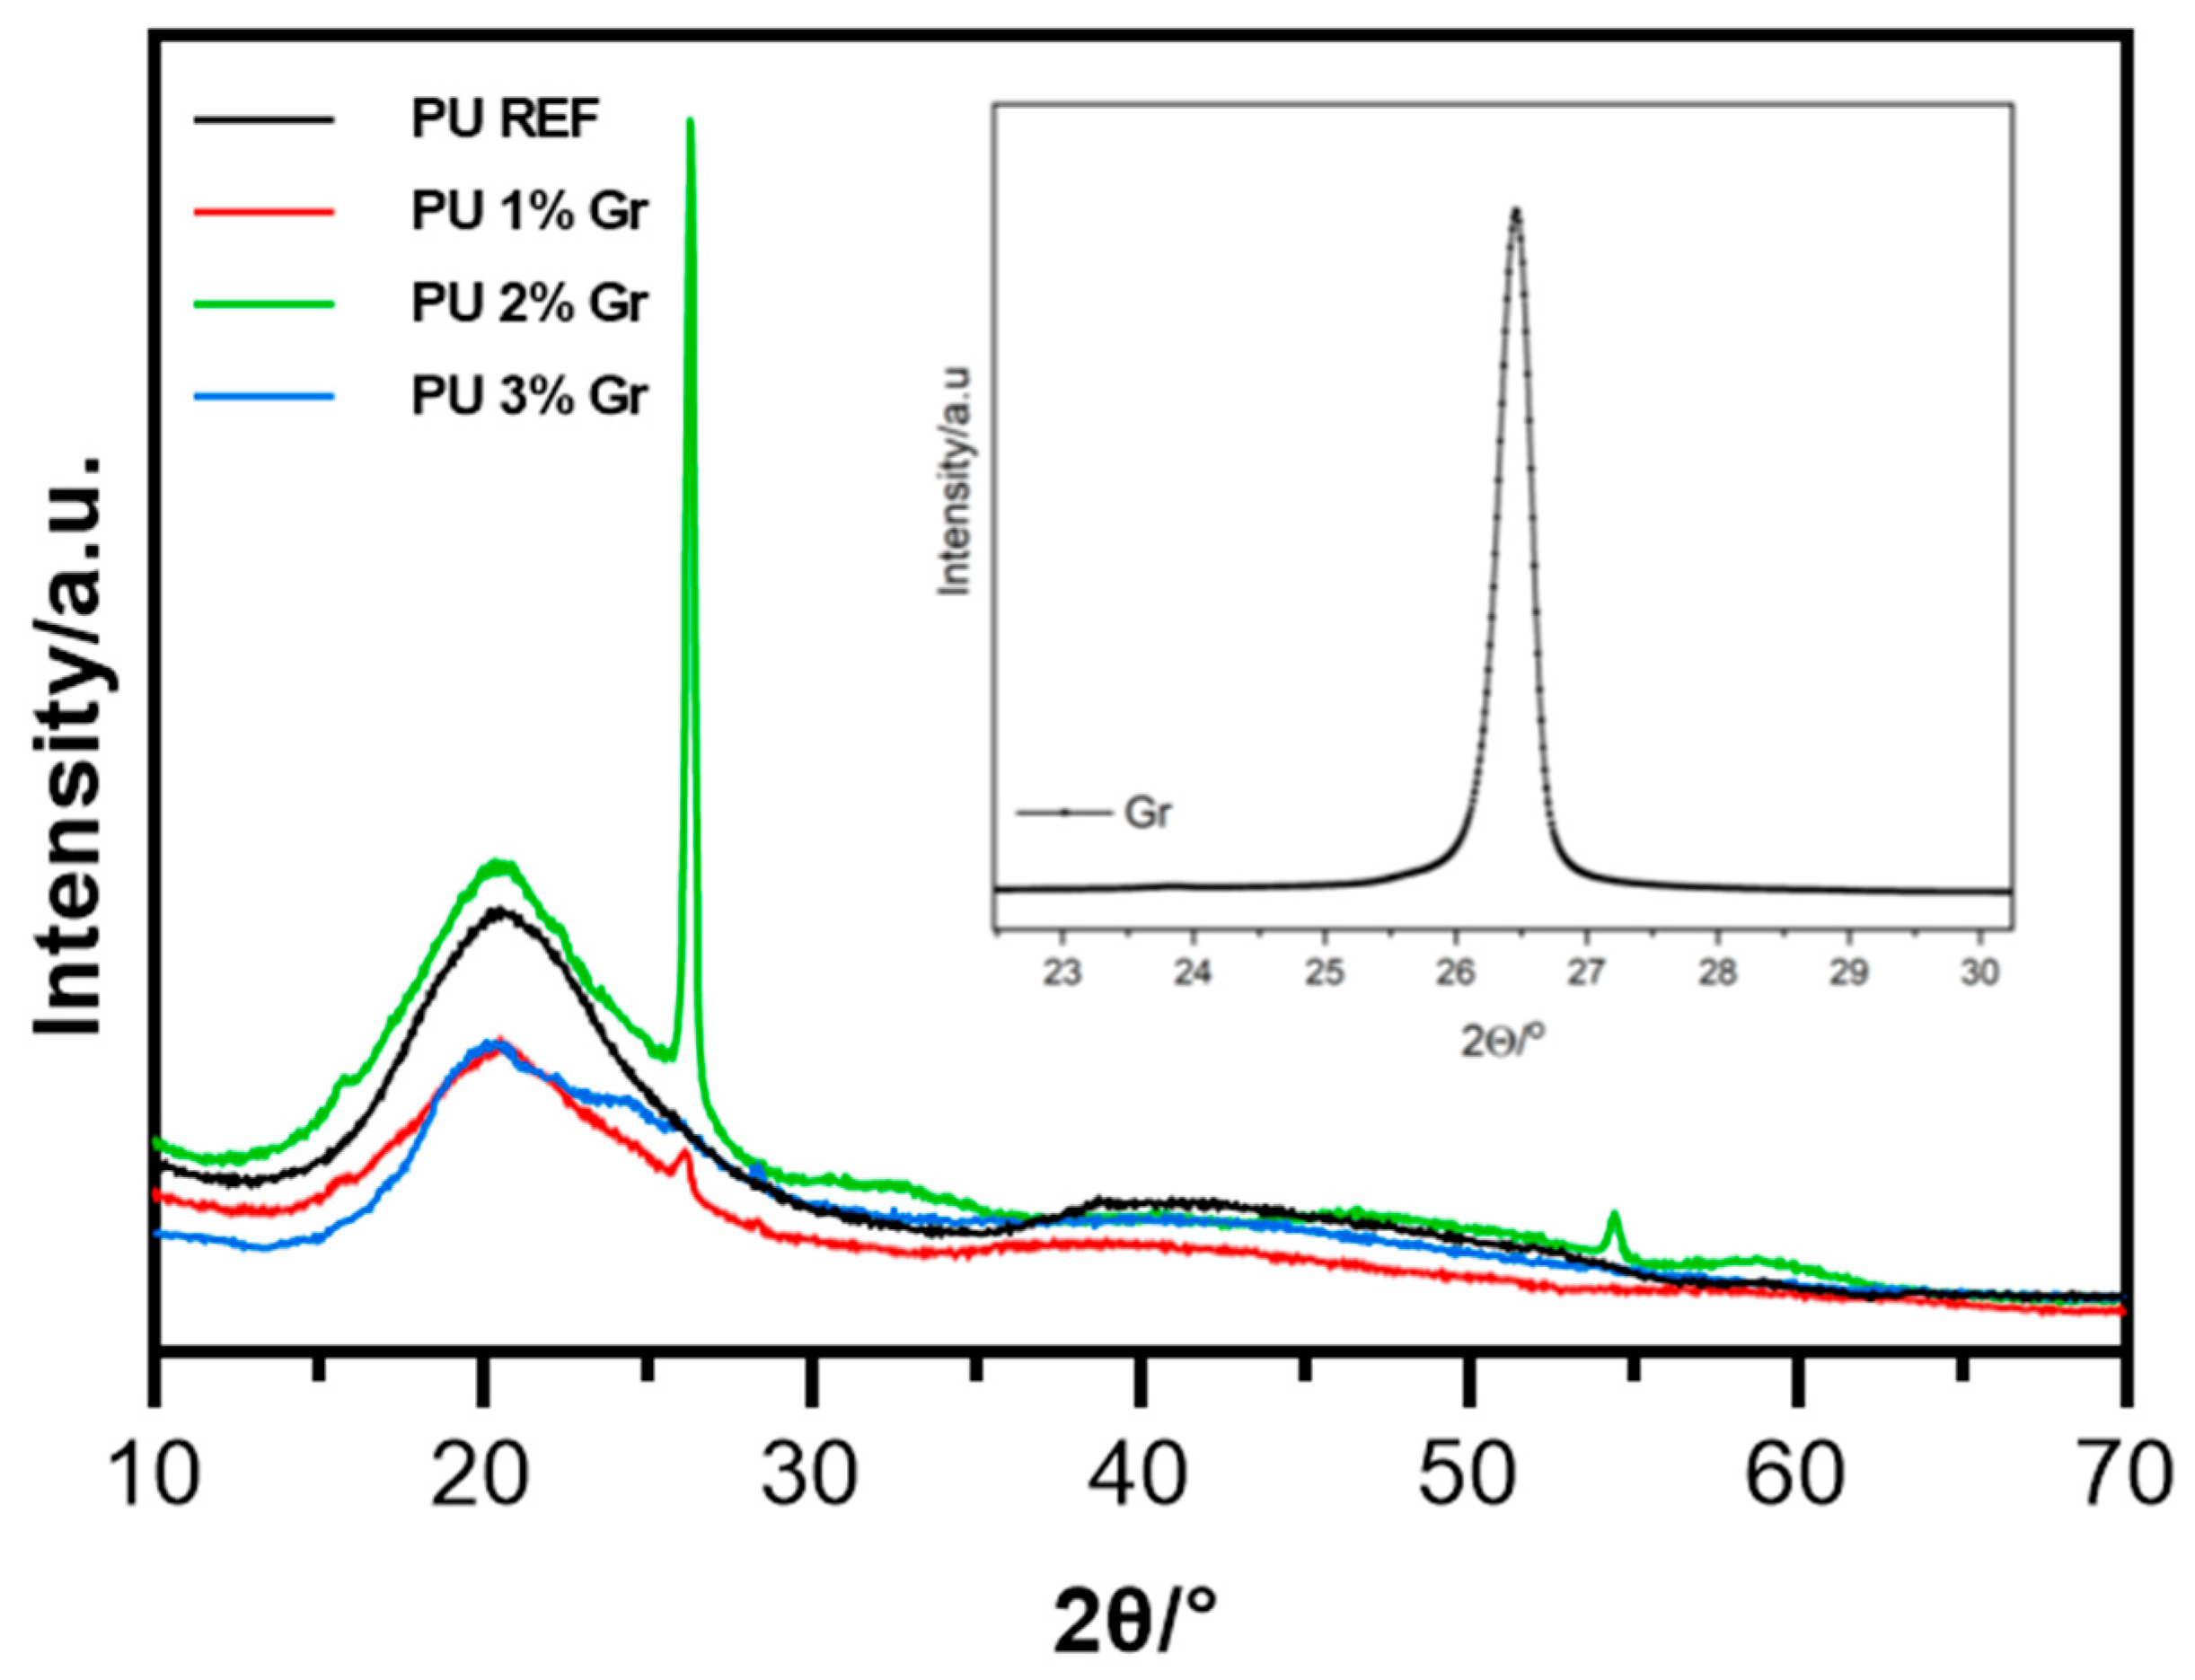
3.5. XRD Studies
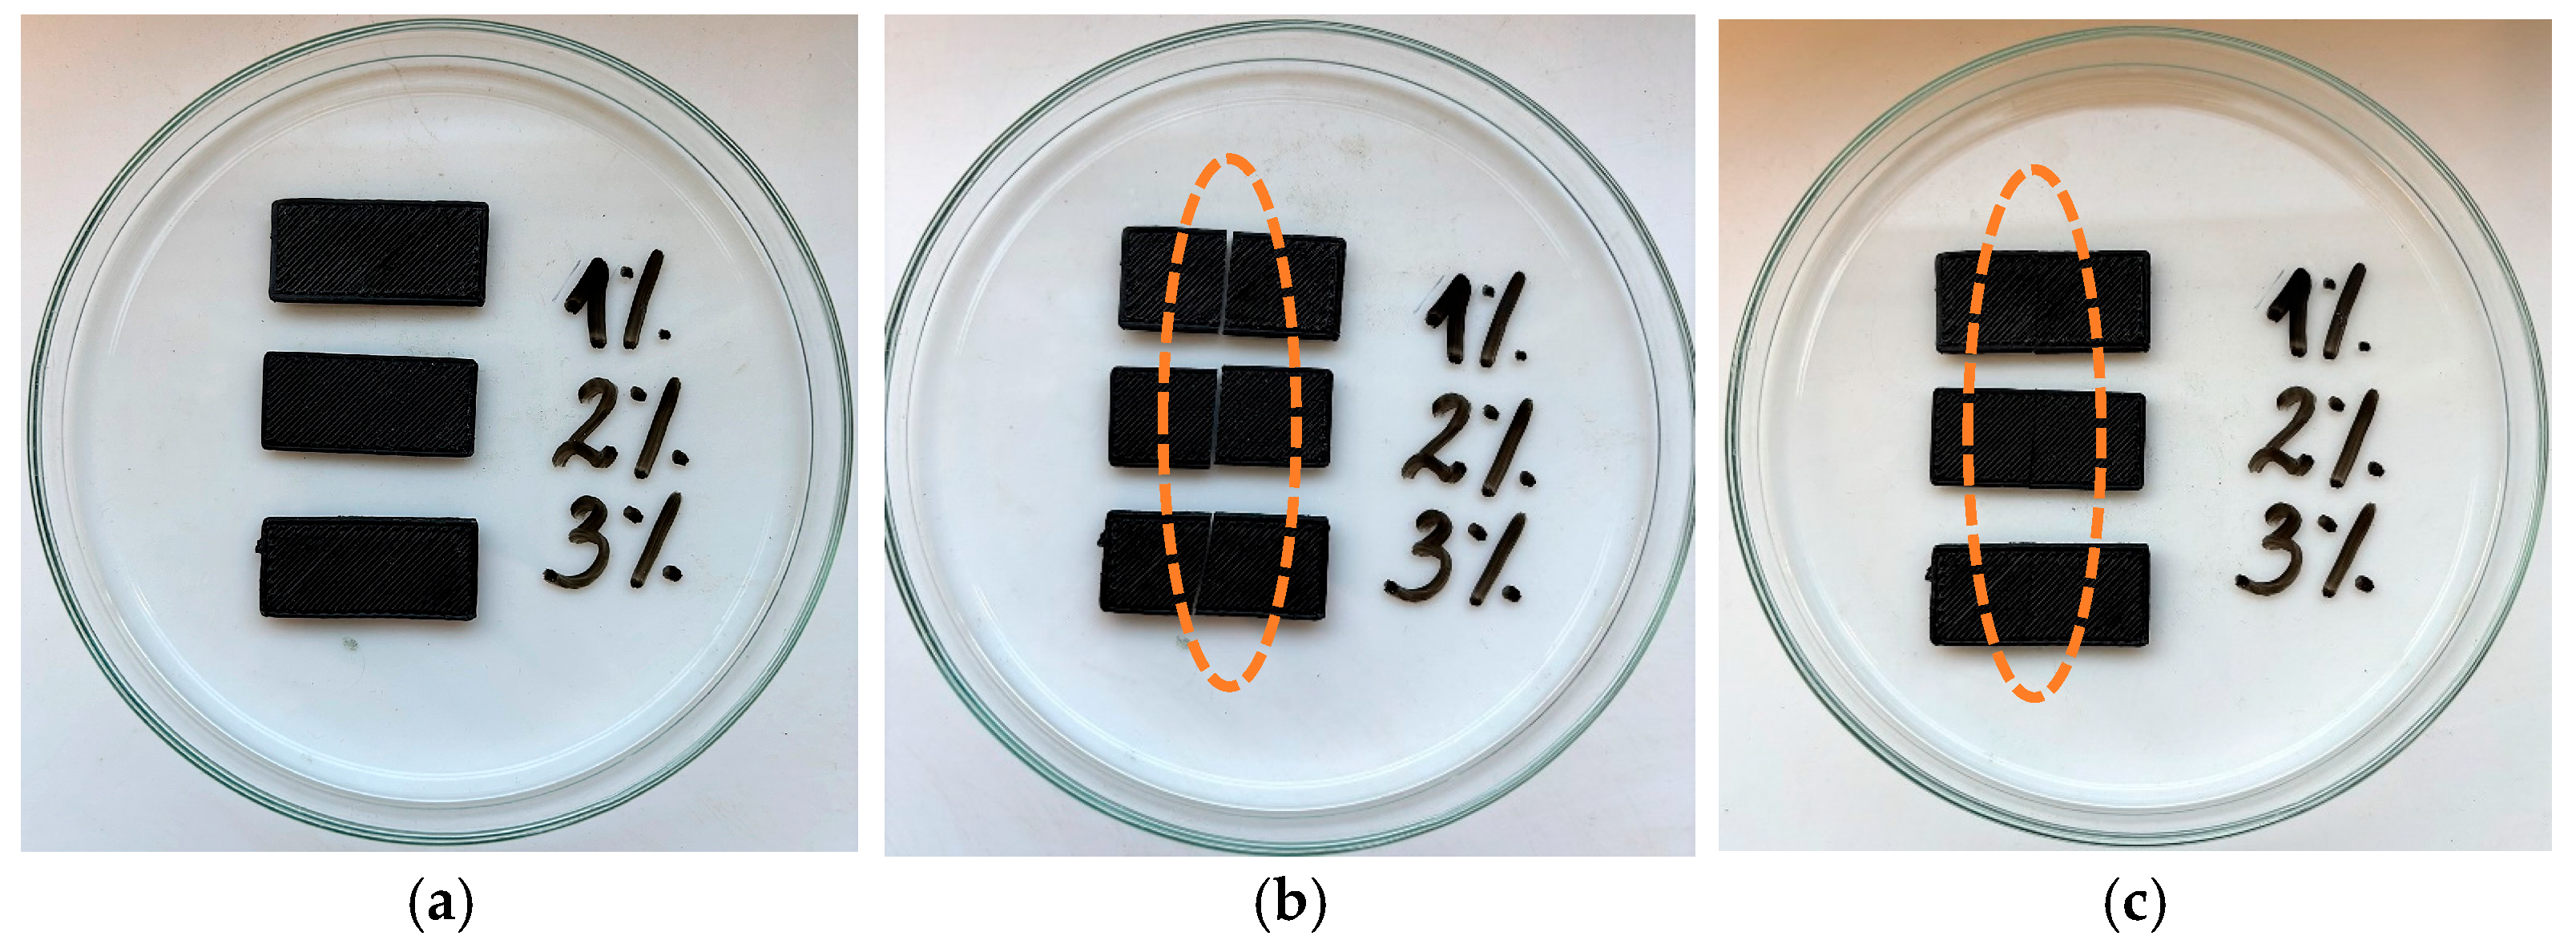
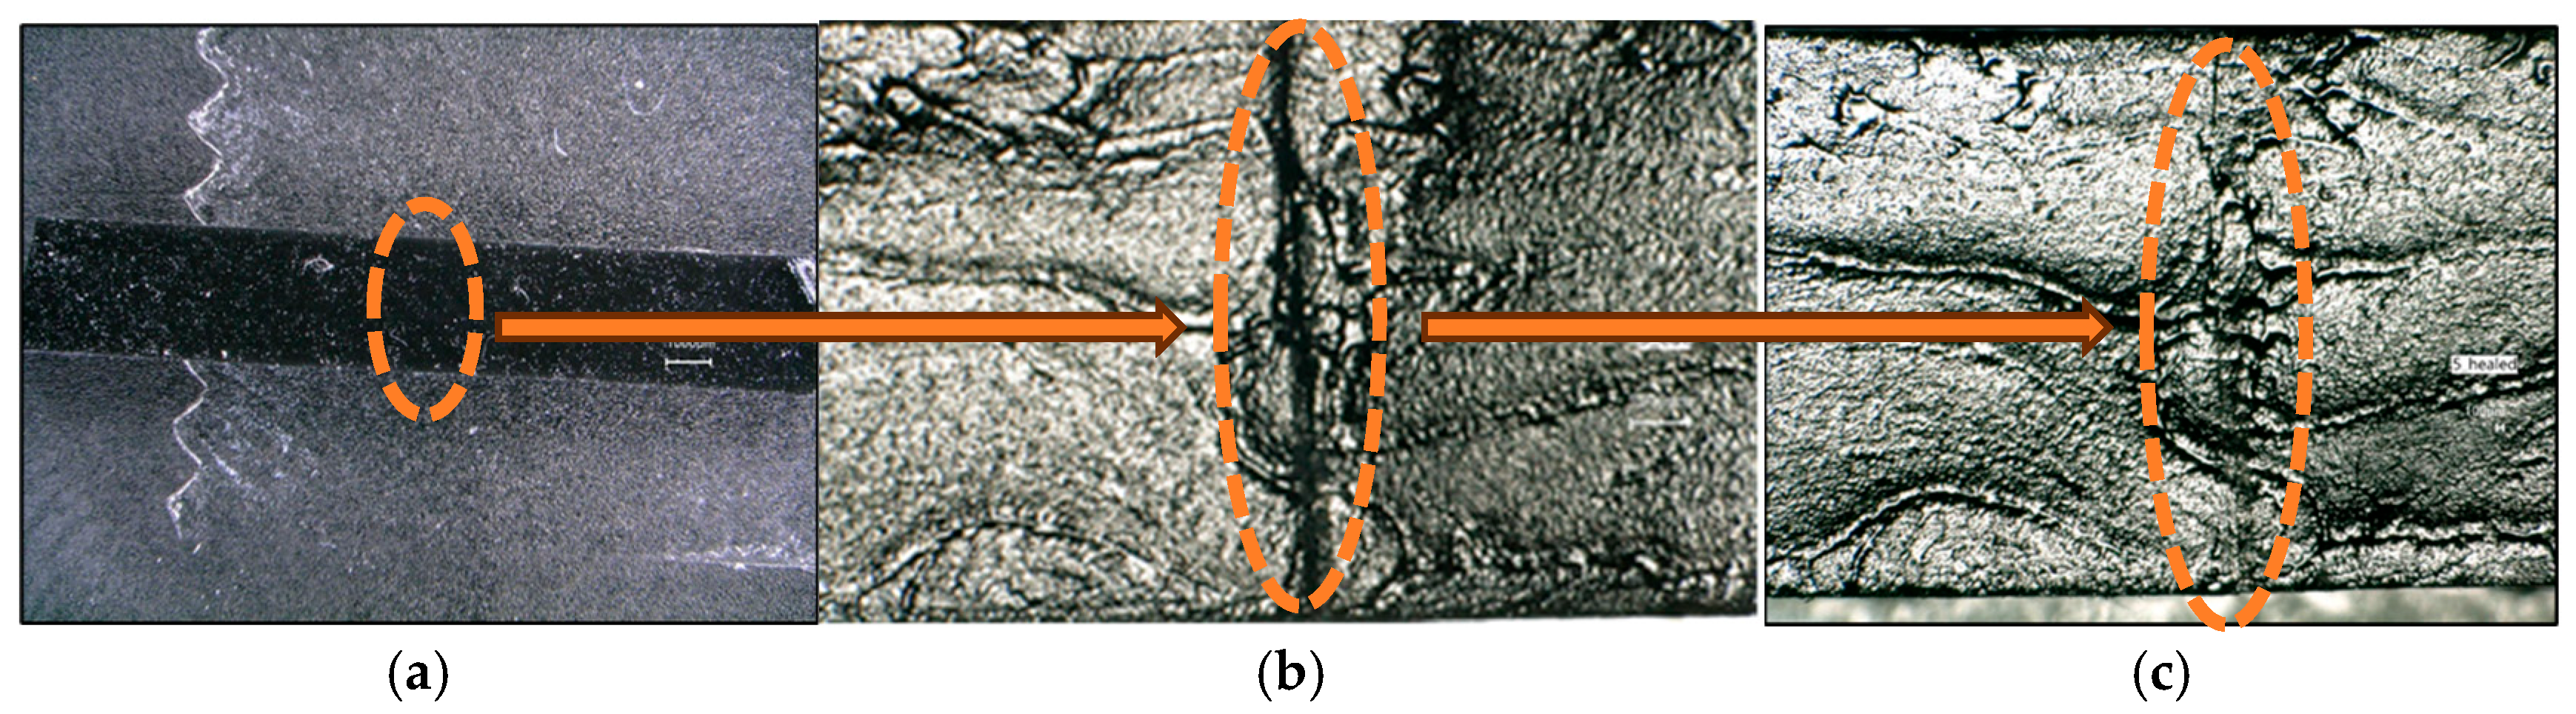
3.6. Self-Healing Properties Studies
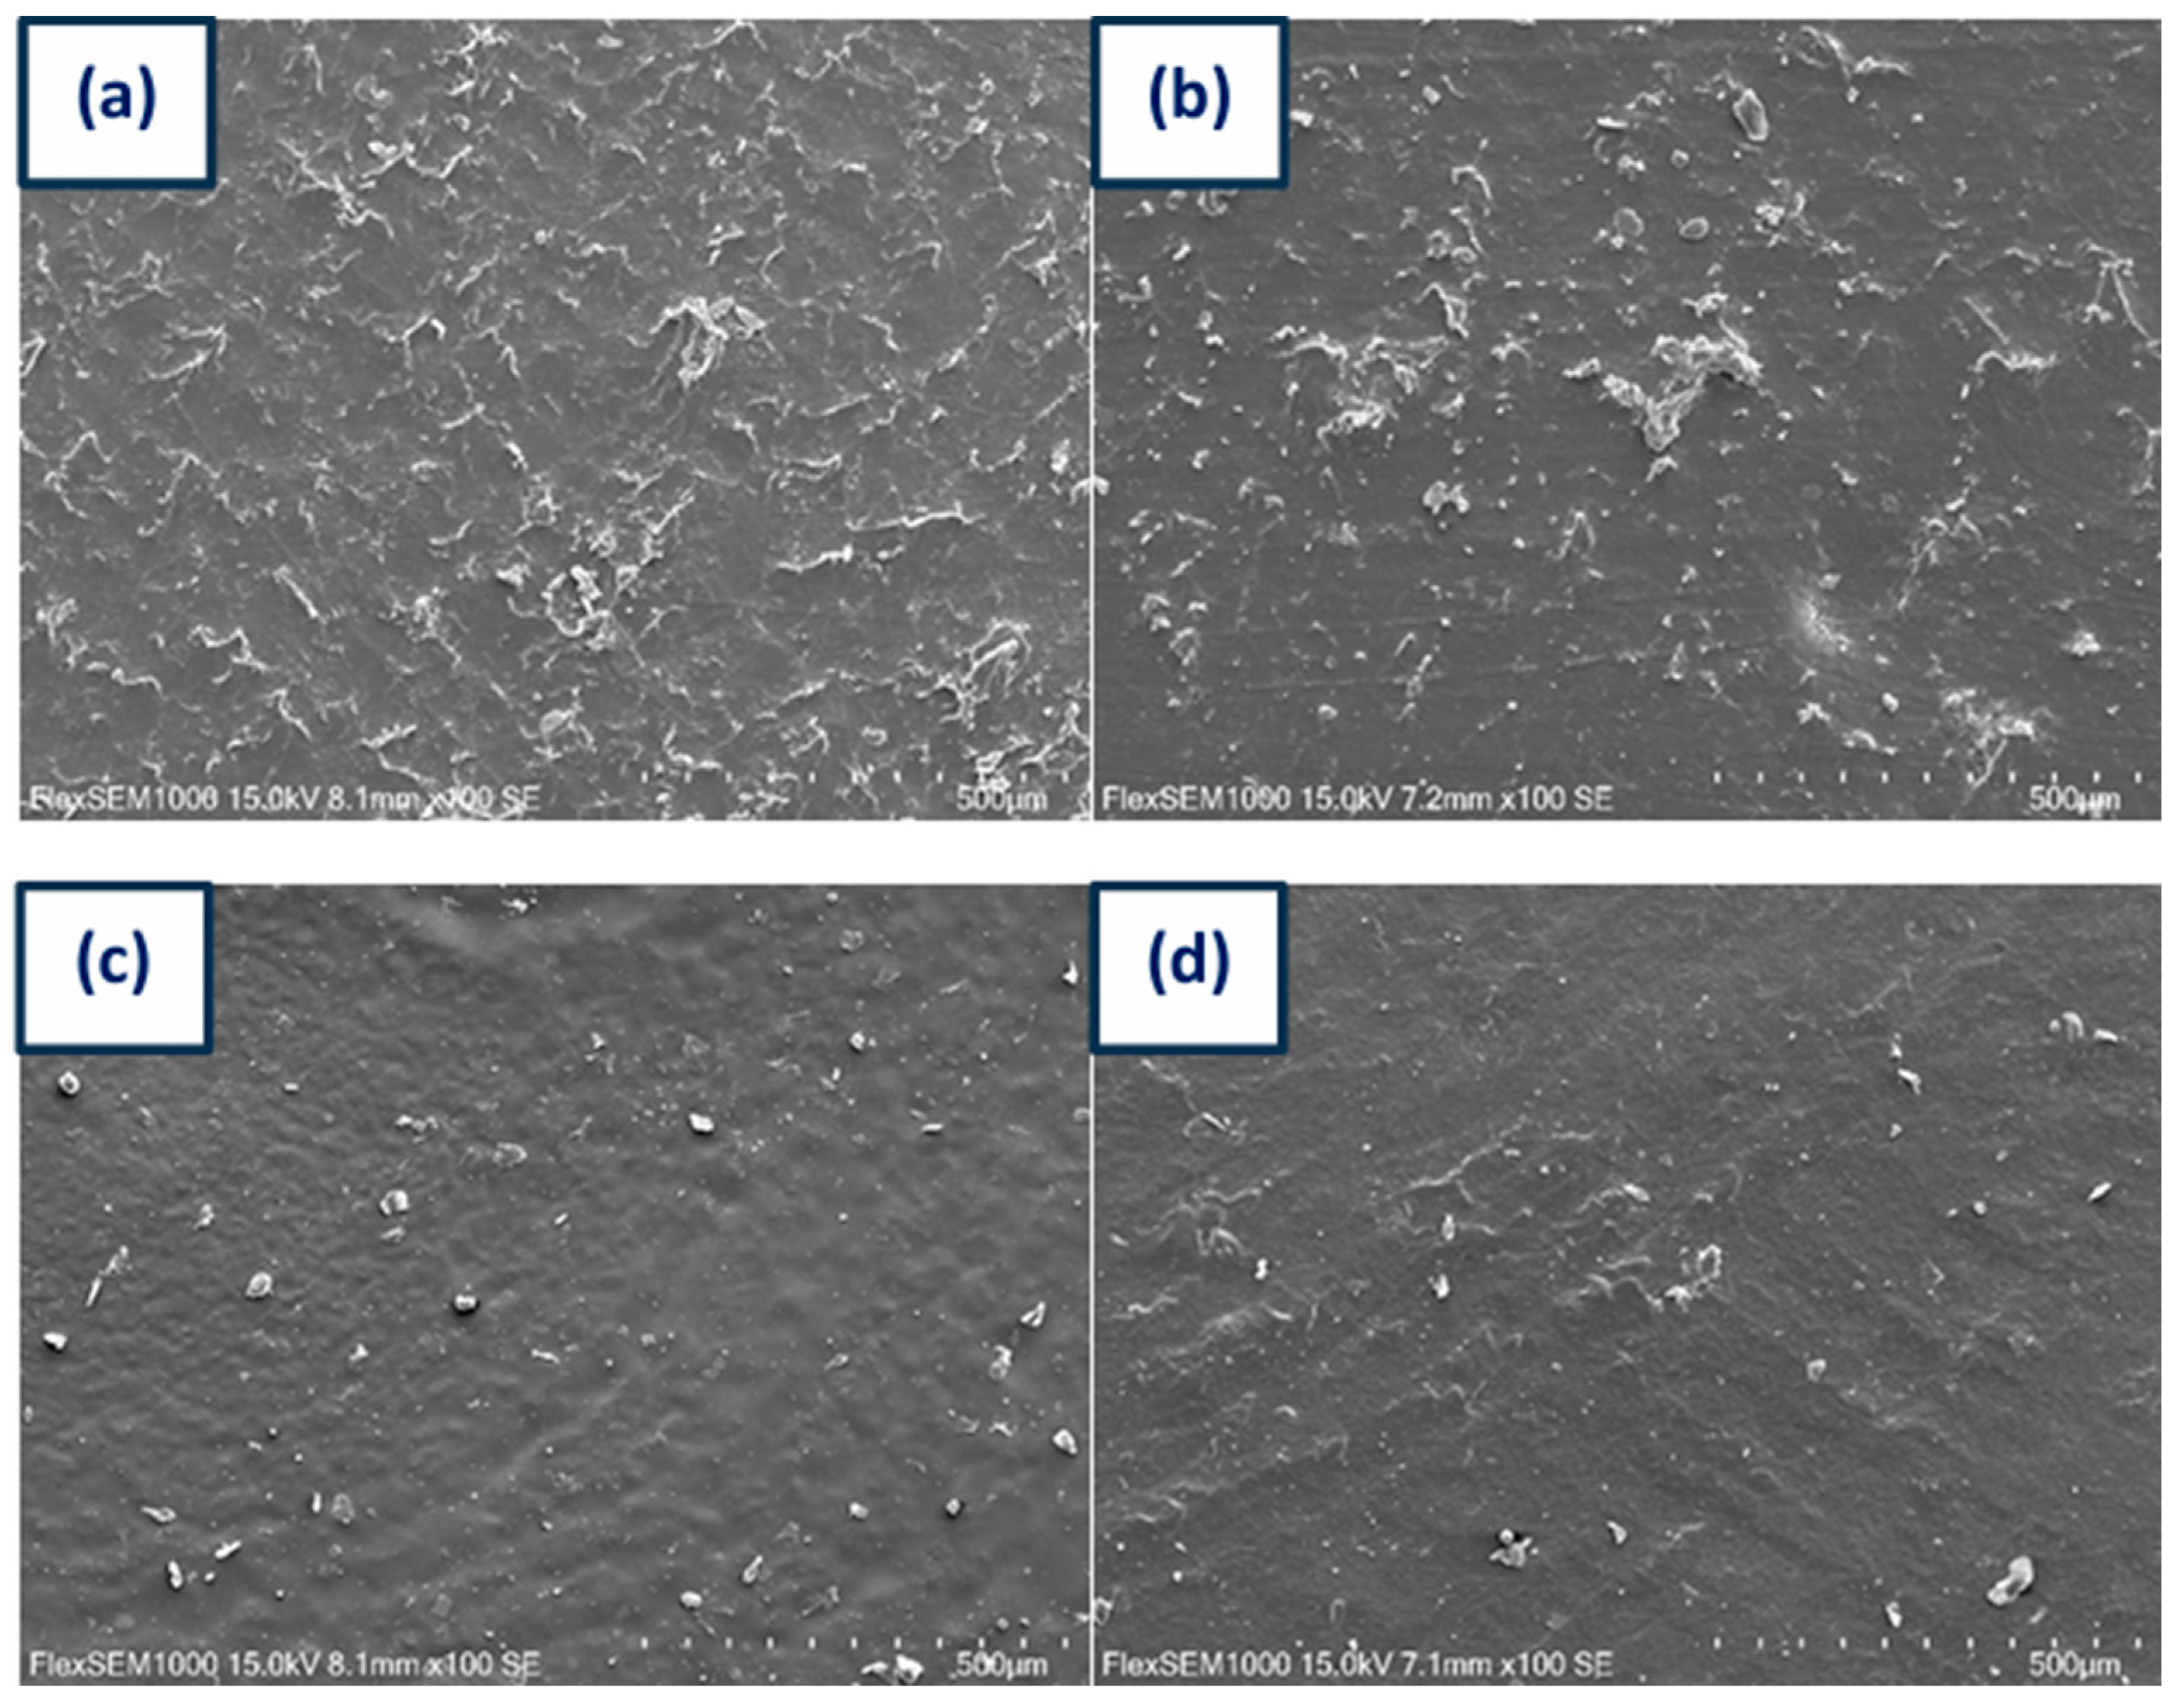
3.7. SEM Studies
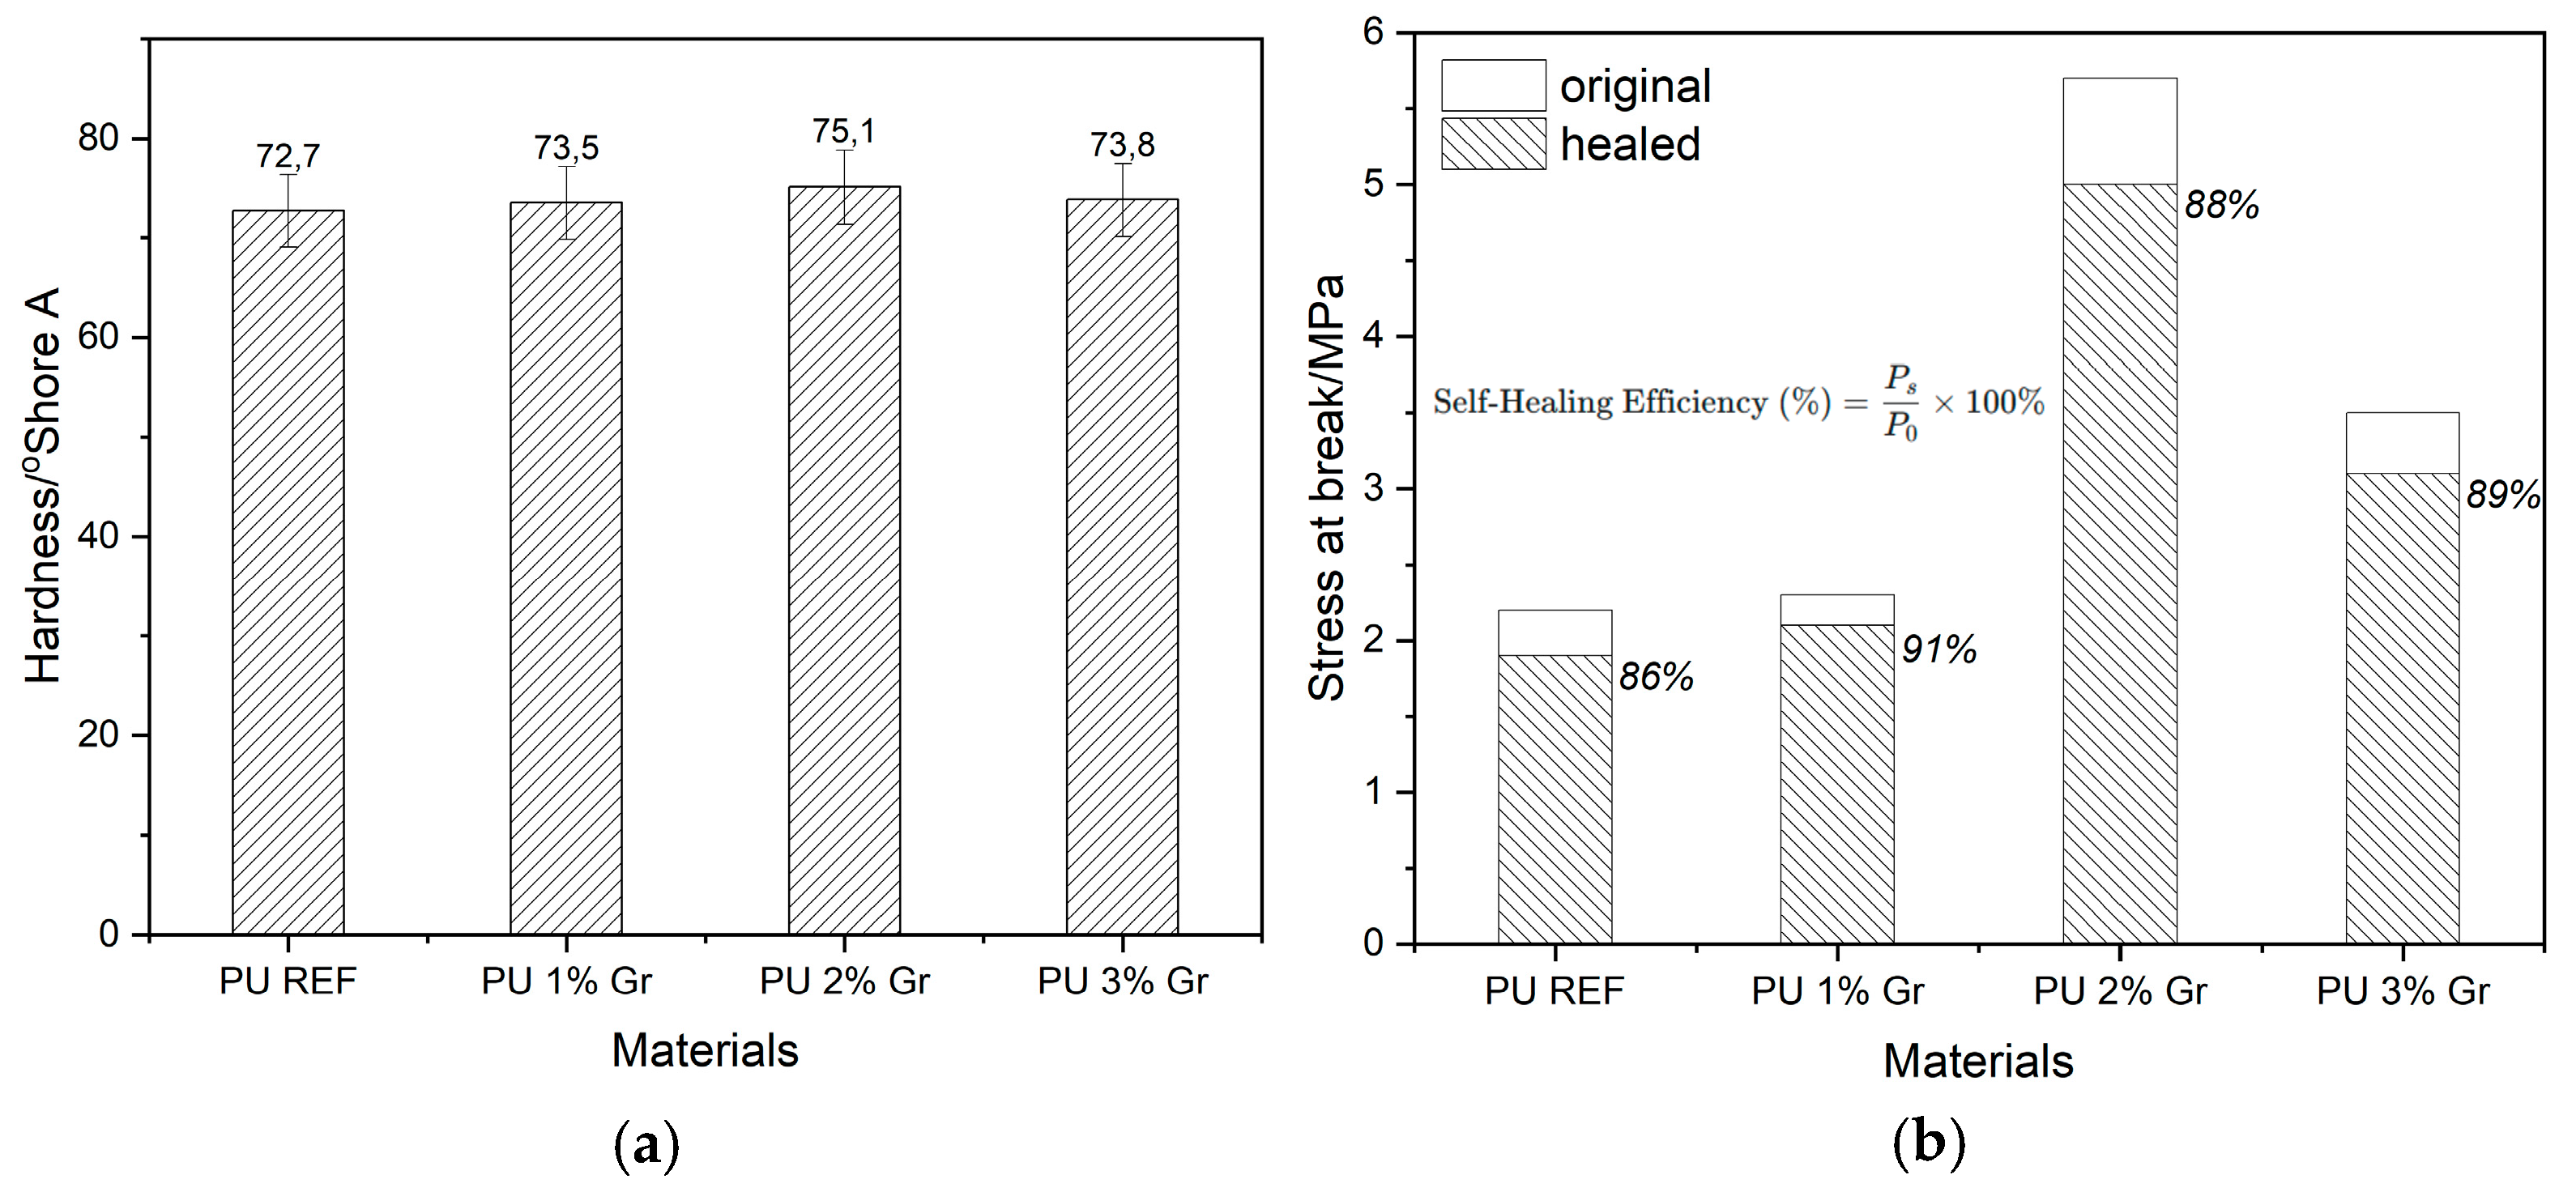
3.8. Mechanical Properties
4. Conclusions
Author Contributions
Funding
Data Availability Statement
Acknowledgments
Conflicts of Interest
Abbreviations
| PU | Polyurethane |
| TPU | Thermoplastic polyurethane |
| MDI | 4,4′-diphenylmethane diisocyanate |
| AHMP | 2-amino-4-hydroxy-6-methylpyrimidine |
| UPy | Ureido-pyrimidinone |
| Gr | Graphene |
| GO | Graphene oxide |
| BDO | 1,4-butanediol |
| DMF | N,N-dimethylformamide |
| DMA | Dynamic mechanical analysis |
| DTA | Derivative thermogravimetric |
| TGA | Thermogravimetric analyzer |
| DSC | Differential scanning calorimeter |
| FTIR | Fourier transform infrared spectroscopy |
| XRD | X-ray diffraction |
| SEM | Scanning electron microscopy |
| REF | Reference sample |
| Td | The temperature at the initial decomposition |
| Tg | Glass transition temperature |
| DTA | Differential thermal analysis |
| E′ | Storage modulus |
| E″ | Loss modulus |
| tanδ | Loss tangent |
References
- Utrera-Barrios, S.; Verdejo, R.; López-Manchado, M.A.; Hernández Santana, M. Evolution of Self-Healing Elastomers, from Extrinsic to Combined Intrinsic Mechanisms: A Review. Mater. Horiz. 2020, 7, 2882–2902. [Google Scholar] [CrossRef]
- Yan, Z.; Luo, S.; Li, Q.; Wu, Z.S.; Liu, S. Recent Advances in Flexible Wearable Supercapacitors: Properties, Fabrication, and Applications. Adv. Sci. 2024, 11, 2302172. [Google Scholar] [CrossRef]
- Tran, D.K.; Veeralingam, S.; Kim, J.W. Self-Repairing Thermoplastic Polyurethane-Based Triboelectric Nanogenerator with Molybdenum Disulfide Charge-Trapping for Advanced Wearable Devices. Nano Energy 2024, 127, 109714. [Google Scholar] [CrossRef]
- He, J.; Cao, L.; Cui, J.; Fu, G.; Jiang, R.; Xu, X.; Guan, C. Flexible Energy Storage Devices to Power the Future. Adv. Mater. 2024, 36, 2306090. [Google Scholar] [CrossRef]
- Son, J.H.; Kim, H.; Choi, Y.; Lee, H. 3D Printed Energy Devices: Generation, Conversion, and Storage. Microsyst. Nanoeng. 2024, 10, 93. [Google Scholar] [CrossRef]
- Xing, L.; Wang, X.; Li, M.; Jia, Y.; Yang, G.; Liu, C.; Shen, C.; Liu, X. Self-Adhesive, Stretchable Waterborne Polyurethane-Based Flexible Film as Wearable Conformal Strain Sensor for Motion and Health Monitoring. Adv. Nanocomposites 2024, 1, 171–179. [Google Scholar] [CrossRef]
- Ren, Z.; Zhang, Y.; Dong, C.; Li, N.; Cui, Z.; Guan, Z. Light- and Heat-Induced Shape Deformation Polyurethane Actuators That Combine Self-Healing Capabilities. Mater. Today Commun. 2024, 39, 109102. [Google Scholar] [CrossRef]
- Yao, Y.; Xiao, M.; Liu, W.; Yao, Y.; Xiao, M.; Liu, W. A Short Review on Self-Healing Thermoplastic Polyurethanes. Macromol. Chem. Phys. 2021, 222, 2100002. [Google Scholar] [CrossRef]
- Li, Y.; Jin, Y.; Fan, W.; Zhou, R. A Review on Room-Temperature Self-Healing Polyurethane: Synthesis, Self-Healing Mechanism and Application. J. Leather Sci. Eng. 2022, 4, 24. [Google Scholar] [CrossRef]
- Dong, F.; Yang, X.; Guo, L.; Wang, Y.; Shaghaleh, H.; Huang, Z.; Xu, X.; Wang, S.; Liu, H. Self-Healing Polyurethane with High Strength and Toughness Based on a Dynamic Chemical Strategy. J. Mater. Chem. A Mater. 2022, 10, 10139–10149. [Google Scholar] [CrossRef]
- Islam, S.; Bhat, G. Progress and Challenges in Self-Healing Composite Materials. Mater. Adv. 2021, 2, 1896–1926. [Google Scholar] [CrossRef]
- Xu, J.; Wang, X.; Zhang, X.; Zhang, Y.; Yang, Z.; Li, S.; Tao, L.; Wang, Q.; Wang, T. Room-Temperature Self-Healing Supramolecular Polyurethanes Based on the Synergistic Strengthening of Biomimetic Hierarchical Hydrogen-Bonding Interactions and Coordination Bonds. Chem. Eng. J. 2023, 451, 138673. [Google Scholar] [CrossRef]
- Garcia, S.J. Effect of Polymer Architecture on the Intrinsic Self-Healing Character of Polymers. Eur. Polym. J. 2014, 53, 118–125. [Google Scholar] [CrossRef]
- Zhong, J.; Zhao, S.; Zhou, Y.; Liu, X.; Yang, Y. Polyurethane Material with Rapid Self-Healing Ability and Shape Recovery Performance. J. Appl. Polym. Sci. 2025, 142, e57261. [Google Scholar] [CrossRef]
- Restrepo-Montoya, A.C.; Larraza, I.; Echeverria-Altuna, O.; Harismendy, I.; Saralegi, A.; Eceiza, A. Emerging Reprocessable and Recyclable Biobased Cross-Linked Polyurethanes Through Diels-Alder Chemistry. ACS Appl. Polym. Mater. 2024, 6, 4475–4486. [Google Scholar] [CrossRef]
- Omrani, I.; Zarjani, M.S.; Berenjegani, R.M.; Nabid, M.R. Imine-Containing Self-Healing Waterborne Polyurethane Elastomeric Coating Derived from Bio-Based Polyester Polyol. J. Polym. Environ. 2024, 33, 431–448. [Google Scholar] [CrossRef]
- Liu, Y.; Zhang, J.; Ji, Y.; Cao, J.; Xu, S.; Luo, P.; Liu, J.; Ma, L.; Gao, G.; Wu, Y.; et al. Self-Healing Polyurethane Elastomers with Dynamic Crosslinked Networks for Complex Structure 3D Printing. Chem. Eng. J. 2025, 507, 160193. [Google Scholar] [CrossRef]
- Feng, H.; Yu, F.; Guo, Y.; Wang, W.; Xiao, L.; Liu, Y. An Exceptional Strength, Self-Healing and Recyclability Polyurethane Elastomers via Multiple Hydrogen Bonds Optimization Strategy. Appl. Surf. Sci. 2024, 655, 159560. [Google Scholar] [CrossRef]
- Chen, Y.A.; Lai, R.H.; Lin, W.C.; Huang, H.Y.; Chen, S.J.; Yeh, C.M.; Huang, H.L.; Elsenety, M.M.; Hu, C.C.; Yu, C.H.; et al. Enhancing Self-Healing and Mechanical Robustness through Aluminum Acetylacetonate-Driven Metal-Ligand Coordination for Skin-Inspired Sensing. ACS Appl. Polym. Mater. 2024, 6, 6976–6987. [Google Scholar] [CrossRef]
- Xu, J.; Wang, H.; Zhang, T.; Li, L.; Zheng, S. Shape Recovery and Reprocessing of Polyurethane Networks Crosslinked via Host-Guest Inclusion Complexation of Adamantane with β-Cyclodextrin. React. Funct. Polym. 2024, 202, 105998. [Google Scholar] [CrossRef]
- Yang, Z.; Wang, J.; Li, G.; Gu, X.; Yang, H.; Tang, Q.; Su, G. A Room-Temperature Self-Healing Anticorrosion Coating of Supramolecular Polyurethane Based on Dynamic Reversible Quadruple Hydrogen Bond. J. Appl. Polym. Sci. 2024, 141, e55441. [Google Scholar] [CrossRef]
- Nevejans, S.; Ballard, N.; Fernández, M.; Reck, B.; García, S.J.; Asua, J.M. The Challenges of Obtaining Mechanical Strength in Self-Healing Polymers Containing Dynamic Covalent Bonds. Polymer 2019, 179, 121670. [Google Scholar] [CrossRef]
- Yan, N.; Zhu, X.; Tian, L.; Han, J.; Zang, J.; Zhang, H. Self-Healing Waterborne Polyurethane Nanocomposites with High Strength and Toughness Based on Ureidopyrimidinone-Modified Cellulose Nanocrystals. Carbohydr. Polym. 2025, 365, 123806. [Google Scholar] [CrossRef]
- Su, R.; Huang, P.; Gan, L.; Zhou, S.; Li, X.; Li, W.; Huang, J.; He, Y. Enhanced Multifunction in Polyurethane Elastomers via Regulation of Triple-Crosslinked Network with Dynamic Covalent and Noncovalent Bonds. J. Appl. Polym. Sci. 2025, 142, e56981. [Google Scholar] [CrossRef]
- Liu, X.; Wu, J.; Wu, J.; Huang, Z.; Shen, W.; Yin, X.; Sun, Y.; Lin, X.; Lin, W.; Yi, G. Tough, Self-Healing, and Recyclable Cross-Linked Polyurethane Elastomers via Synergistic Effect of Dual Dynamic Covalent Bonds. J. Appl. Polym. Sci. 2024, 141, e54876. [Google Scholar] [CrossRef]
- Ma, J.; Pang, X.; Chen, Z.; Du, L.; Qiu, P. Super Adhesive, Self-Healing Elastomer Based on Synergistic Dual Dynamic Interactions for Corrosion-Resistant Coatings. Appl. Mater. Today 2025, 44, 102682. [Google Scholar] [CrossRef]
- Li, J.; Song, Y.; Song, G.; Li, Z.; Yang, X.; Yin, S.; Li, X. Synergistic Enhancement of Low-Temperature Self-Repairing Polyurethane Elastomers through Quadruple Hydrogen Bonds and Coordination Bonds. ACS Appl. Polym. Mater. 2024, 6, 2284–2293. [Google Scholar] [CrossRef]
- Shi, Z.; Kang, J.; Zhang, L. Water-Enabled Room-Temperature Self-Healing and Recyclable Polyurea Materials with Super-Strong Strength, Toughness, and Large Stretchability. ACS Appl. Mater. Interfaces 2020, 12, 23484–23493. [Google Scholar] [CrossRef]
- Xie, H.; Liu, X.; Sheng, D.; Wu, H.; Zhou, Y.; Tian, X.; Sun, Y.; Shi, B.; Yang, Y. Novel Titin-Inspired High-Performance Polyurethanes with Self-Healing and Recyclable Capacities Based on Dual Dynamic Network. Polymer 2021, 230, 124096. [Google Scholar] [CrossRef]
- Tian, W.; Yang, H.; Li, H.; Wang, S.; Jin, H.; Tian, L. A Self-Healing Polyurethane/Imidazole-Modified Carboxylated Graphene Oxide Composite Coating for Antifouling and Anticorrosion Applications. Eur. Polym. J. 2024, 219, 113372. [Google Scholar] [CrossRef]
- Gao, H.; Xu, J.; Liu, S.; Song, Z.; Zhou, M.; Liu, S.; Li, F.; Li, F.; Wang, X.; Wang, Z.; et al. Stretchable, Self-Healable Integrated Conductor Based on Mechanical Reinforced Graphene/Polyurethane Composites. J. Colloid Interface Sci. 2021, 597, 393–400. [Google Scholar] [CrossRef]
- Luo, X.; Wu, Y.; Guo, M.; Yang, X.; Xie, L.; Lai, J.; Li, Z.; Zhou, H. Multi-Functional Polyurethane Composites with Self-Healing and Shape Memory Properties Enhanced by Graphene Oxide. J. Appl. Polym. Sci. 2021, 138, 50827. [Google Scholar] [CrossRef]
- Huang, H.X.; Ouyang, X.Y.; Zhang, J.L.; Lu, C.C.; Li, P.; Wu, W.; Li, R.K.Y.; Ren, X.M.; Zhao, H. Thermal-Driven Self-Healing Polyurethane Based on Polydopamine Nanoparticles with Enhanced Mechanical and UV Shielding Properties. ACS Appl. Polym. Mater. 2024, 6, 7584–7593. [Google Scholar] [CrossRef]
- Pang, W.; Jiang, H.; Wang, S.; He, T.; Chen, H.; Yan, T.; Cheng, M.; Sun, S.; Li, C. Graphene Oxides Enhanced Polyurethane Based Composite Coating with Long Term Corrosion Resistance and Self-Healing Property. Eur. Polym. J. 2024, 207, 112825. [Google Scholar] [CrossRef]
- Tian, W.; Xiong, F.; Han, H.; Li, W. A Polyurethane/Functionalized Reduced Graphene Oxide Coating Based on a Hybrid Cross-Linking Strategy for Marine Corrosion Protection. Prog. Org. Coat. 2025, 208, 109496. [Google Scholar] [CrossRef]
- Meganathan, M.K.; Sasikala, H.; Ramalingam, S. Self-Healable UV-Triggered Silica-Polyurethane Nanocomposite-Reinforced Fabric Coating: Implications for Protective Fabrics. ACS Appl. Nano Mater. 2024, 7, 28713–28724. [Google Scholar] [CrossRef]
- Song, Y.; Li, J.; Song, G.; Li, Z.; Yang, X.; Ma, F.; Li, X. Superior Strength, Highly Stretchable, Bionic Self-Healing Polyurethane and Its Composites for Flexible Conductivity and Self-Cleaning Applications. Compos. B Eng. 2024, 280, 111457. [Google Scholar] [CrossRef]
- He, S.; Gao, Y.; Gong, X.; Wu, C.; Cen, H.; He, S.; Gao, Y.; Gong, X.; Wu, C.; Cen, H. Advance of Design and Application in Self-Healing Anticorrosive Coating: A Review. J. Coat. Technol. Res. 2023, 20, 819–841. [Google Scholar] [CrossRef]
- Liu, J.; Wu, Y.; Yan, F.; Yan, Y.; Wang, F.; Zhang, G.; Zeng, L.; Ma, Y.; Guo, J.; Li, Y.; et al. Graphene-Based Anticorrosion Coatings for Steel: Fundamental Mechanism, Recent Progress and Future Perspectives. Prog. Org. Coat. 2025, 200, 108966. [Google Scholar] [CrossRef]
- Jakhmola, S.; Das, S.; Dutta, K. Emerging Research Trends in the Field of Polyurethane and Its Nanocomposites: Chemistry, Synthesis, Characterization, Application in Coatings and Future Perspectives. J. Coat. Technol. Res. 2024, 21, 137–172. [Google Scholar] [CrossRef]
- Srivastav, R.S.; More, A.P. A Comprehensive Review of Self-Healing Polymers: Mechanisms, Types, and Industry Implications. Polym. Adv. Technol. 2025, 36, e70092. [Google Scholar] [CrossRef]
- Abbas, Z.; Hassan, G.; Khan, M.U.; Abbas, H.; Ahmad, B.; Shuja, A.; Sajid, M.; Bae, J.; Choi, C. Polyurethane Packed Graphene-Coated Spider Silk by Dip-Casting for a Highly Stretchable Strain Sensor. J. Mater. Chem. B 2025, 13, 3437–3447. [Google Scholar] [CrossRef]
- Niu, H.; Liu, L.; Zhu, Y.; Zhou, C.; Wu, G. Liquid Metal-Enhanced Self-Healing Dual-Hard-Phase Cross-Linked Waterborne Polyurethane for Flexible Sensors. Eur. Polym. J. 2024, 215, 113185. [Google Scholar] [CrossRef]
- Yu, Y.; Xu, Z.; Xu, L.; Li, Y.; Liu, T.; Meng, Q.; Su, X.; Kuan, H.C.; Dai, J.; Ma, J. Highly Stretchable, Sensitive and Healable Polyurethane-Urea/Graphene Nanocomposite Sensor for Multifunctional Applications. Thin-Walled Struct. 2024, 198, 111660. [Google Scholar] [CrossRef]
- Li, G.; Xiao, P.; Hou, S.; Huang, Y. Graphene Based Self-Healing Materials. Carbon 2019, 146, 371–387. [Google Scholar] [CrossRef]
- Zhang, H.; Shang, Y.; Li, N.; Hu, X.; Ye, Z.; Zhang, X.; Qu, L.; Song, X.; He, Y.; Fu, K.; et al. Dynamic Bond-Enhanced, Recyclable Polyurethane Elastomer with High Strength and Self-Healing Properties for Advanced 3D Printing. Compos. B Eng. 2025, 304, 112500. [Google Scholar] [CrossRef]
- Bijalwan, V.; Rana, S.; Schlögl, S.; Binder, W.H.; Yun, G.J. 3D Printing of Nanocomposites: Applications in Conductive and Healable Materials. Polym. Rev. 2025, 65, 1–35. [Google Scholar] [CrossRef]
- Sabet, M.; Link, J.T.; Begawan, S.; Darussalam, B. Unveiling Advanced Self-Healing Mechanisms in Graphene Polymer Composites for next-Generation Applications in Aerospace, Automotive, and Electronics. Polym.-Plast. Technol. Mater. 2024, 63, 2032–2059. [Google Scholar] [CrossRef]

| Sample | Nozzle | 1-Zone Heating | Printing Bed | 1-Layer Extrusion | 2-Layer Extrusion | Printing Speed |
|---|---|---|---|---|---|---|
| °C | °C | °C | % | % | mm/s | |
| PU 1% Gr | 220 | 150 | 60 | 700 | 600 | 40 |
| PU 2% Gr | 215 | 150 | 60 | 450 | 450 | 40 |
| PU 3% Gr | 220 | 150 | 60 | 600 | 450 | 40 |
| Sample | Td2% | Td5% | Td10% | Td2max | Td3max |
|---|---|---|---|---|---|
| °C | °C | °C | °C | °C | |
| PU REF | 283 | 302 | 315 | 347 | 393 |
| PU 1% Gr | 272 | 298 | 317 | 386 | 397 |
| PU 2% Gr | 237 | 287 | 312 | 398 | 406 |
| PU 3% Gr | 233 | 286 | 313 | 391 | 400 |
| Sample | 1st Heating | Cooling | 2nd Heating |
|---|---|---|---|
| Tg/°C | |||
| PU REF | −39.9 | −22.3 | −28.5 |
| PU 1% Gr | −39.9 | −29.1 | −35.1 |
| PU 2% Gr | −40.0 | −33.4 | −38.4 |
| PU 3% Gr | −39.2 | −33.4 | −36.9 |
| Sample | E′(0 °C) | E″max | Tan δ |
|---|---|---|---|
| MPa | °C | °C | |
| PU REF | 22.9 | −34.1 | −24.6 |
| PU 1% Gr | 47.6 | −32.2 | −24.3 |
| PU 2% Gr | 53.3 | −32.9 | −23.6 |
| PU 3% Gr | 26.3 | −33.7 | −21.4 |
Disclaimer/Publisher’s Note: The statements, opinions and data contained in all publications are solely those of the individual author(s) and contributor(s) and not of MDPI and/or the editor(s). MDPI and/or the editor(s) disclaim responsibility for any injury to people or property resulting from any ideas, methods, instructions or products referred to in the content. |
© 2025 by the authors. Licensee MDPI, Basel, Switzerland. This article is an open access article distributed under the terms and conditions of the Creative Commons Attribution (CC BY) license (https://creativecommons.org/licenses/by/4.0/).
Share and Cite
Gołąbek, J.; Sulewska, N.; Strankowski, M. Self-Healing 3D-Printed Polyurethane Nanocomposites Based on Graphene. Micromachines 2025, 16, 889. https://doi.org/10.3390/mi16080889
Gołąbek J, Sulewska N, Strankowski M. Self-Healing 3D-Printed Polyurethane Nanocomposites Based on Graphene. Micromachines. 2025; 16(8):889. https://doi.org/10.3390/mi16080889
Chicago/Turabian StyleGołąbek, Justyna, Natalia Sulewska, and Michał Strankowski. 2025. "Self-Healing 3D-Printed Polyurethane Nanocomposites Based on Graphene" Micromachines 16, no. 8: 889. https://doi.org/10.3390/mi16080889
APA StyleGołąbek, J., Sulewska, N., & Strankowski, M. (2025). Self-Healing 3D-Printed Polyurethane Nanocomposites Based on Graphene. Micromachines, 16(8), 889. https://doi.org/10.3390/mi16080889